Both in adults and children, breakfast consumption improves the ability to concentrate, reaction time, problem solving, learning ability, reasoning, memory and mood, when compared with breakfast omission(Reference Widenhorn-Muller, Hille and Klenk1–Reference Hoyland, Lawton and Dye8).
In evaluating the effects of breakfast on cognitive performance, particularly, dietary carbohydrates are of interest. The effect of dietary carbohydrates on blood glucose depends on the type and amount of ingested carbohydrates. Breakfast containing complex or low-glycaemic index (GI) carbohydrates contributes beneficially to attention and memory skills(Reference Benton and Jarvis2, Reference Wesnes, Pincock and Richardson5, Reference Ingwersen, Defeyter and Kennedy9, Reference Mahoney, Taylor and Kanarek10). Micha et al. (Reference Micha, Rogers and Nelson11) indicated that the amount of carbohydrates absorbed (GL, glycaemic load) is important, strongly suggesting that slow-release or slowly digested carbohydrates in right amounts could be beneficial to children.
Isomaltulose is a natural derivative of sucrose found in honey and sugar cane and can be produced from sucrose by enzymatic rearrangement of the α-1,2 linkage between glucose and fructose. Compared with sucrose, isomaltulose is more stable with respect to pH-dependent hydrolysis and enzymatic splitting in the mouth and intestine(Reference Lina, Jonker and Kozianowski12, Reference Cho, Park and Lim13). Isomaltulose is completely digested and absorbed in the small intestine but at a much slower rate than sucrose, resulting in a lower but longer-lasting blood glucose concentration (up to 3 h post-consumption) and with a concomitant lower insulin response(Reference Dye, Gilsenan and Quadt14, Reference Holub, Gostner and Theis15).
A search on PubMed using the keywords ‘isomaltulose and human’ revealed forty publications over the last 50 years. Chronologically, the studied subjects moved from digestion, effects on cariogenicity to glycaemic response. Only over the last 8 years, two studies have focused on cognitive performance in adults. In a Japanese study, mental performance decreased more slowly post-dose with isomaltulose than with sucrose when compared with baseline values(Reference Kashimura, Nagai and Ebashi16). Among healthy male English adults(Reference Dye, Gilsenan and Quadt14), a lower blood glucose concentration profile was observed following the ingestion of isomaltulose when compared with sucrose milk-based drinks. Both milk drinks did not differ in their effects on cognitive performance up to 115 min post-dose, suggesting that isomaltulose lacks the beneficial effect on cognitive performance. However, it cannot be excluded that the effect of isomaltulose on cognitive performance occurs at a later time point (3 h post-consumption) when derived blood glucose concentrations are expected to be higher when compared with carbohydrates with a higher GI(Reference Holub, Gostner and Theis15).
Recently, a single-dose study in children with growing-up milks (GUM) having different carbohydrate compositions, including a high lactose–isomaltulose variant, has been published(Reference Taib, Shariff and Wesnes17). The authors have concluded that subtle changes in GUM formulations, and at relatively low levels of carbohydrates, may have an impact on cognitive performance. The isomaltulose-enriched milk reduced the decline in the power of attention in children aged 5–6 years when compared with a standard milk. Enrichment also limited declines in numeric working memory and picture recognition.
The present study aimed to confirm the positive effects of lactose–isomaltulose-containing GUM, replacing breakfast on test days, on cognitive tasks related to memory and attention in 5–6-year-old Indonesian children. Furthermore, we hypothesised that a combination of extra minerals and vitamins with a lower isomaltulose concentration would have the same cognitive outcome as milks with double the amount of isomaltulose. Finally, since a reduced protein content of the milk might reduce insulin secretion(Reference Claessens, Calame and Siemensma18), which could result in blood glucose concentrations above baseline for a longer period, an effect on cognitive performance is hypothesised.
Methods
Subjects
A total of 100 children from the area Kampung Melayu (East Jakarta, Indonesia) were invited to participate in a screening assessed by the Medical Research Unit (Faculty of Medicine Universitas Indonesia). Based on the inclusion and exclusion criteria, fifty-four apparently healthy children (5–6 years of age, twenty-five boys and twenty-nine girls) were included. The inclusion criteria were: normal to superior score on Wechsler scales; Hb ≥ 110 mg/l; normal body height and weight according to the WHO standard(19); regular milk consumers. The exclusion criteria for the present study were allergy, chronic infections, thyroid disorders, diabetes, lactose intolerance, and mental disturbances or retarded development. During the study period, children were asked to maintain their standard diet and pattern of activity. Children (and parents) were instructed to consume their dinner before 21.00 hours at the day preceding the test days. The characteristics of the study population are reported in Table 1. All participants received an anti-worm treatment. The present study was conducted according to the guidelines laid down in the Declaration of Helsinki, and all procedures involving the subjects were approved by the Medical Research Ethics Committee of Medical Faculty Universitas Indonesia. Written informed consent was obtained from the parents of the subjects. On each test day, children received small toys or stationery items, as an incentive for completing the cognitive performance tasks. The present trial has been registered as NTR2313 (Netherlands Trial Registry).
Table 1 Baseline characteristics of parents and children included in the study (Mean values and standard deviations; number of participants and percentages; medians and interquartile ranges (IQR), and ranges)
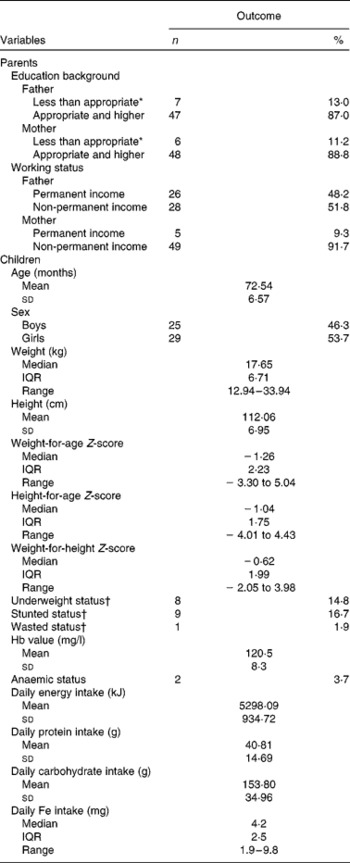
* Less than appropriate = less than 9 years of formal education.
† Less than − 2 sd.
Study design
The present study concerns a blinded, partly randomised, reference product-controlled, cross-over study. Each child received four different milk products: standard (Std) GUM; Std GUM with 5 g isomaltulose per serving (Iso-5 GUM); Iso-5 GUM with lowered protein content (Iso-5 LP GUM); Std GUM with 2·5 g isomaltulose in combination with additional minerals and vitamins (Iso-2·5 GUM). Energy contributions of Std GUM, Iso-5 GUM and Iso-2·5 GUM were the same, and only slightly higher for Iso-5 LP GUM (335 v. 322 kJ/100 ml). More detailed information of the products can be found in Table 2. The test products were each provided during 14 d, two servings per d (2 × 200 ml), and no washout period between the different products. Washout was not necessary because the three randomised products (Std GUM, Iso-5 GUM and Iso-5 LP GUM) were considered to have acute effects, whereas the non-randomised final product containing the extra vitamins and minerals also might have time-dependent effects (improving vitamin/mineral status). The order of the three randomised treatments was based on a 3 × 3 Latin square design (Table 3), using the date of entry and the sequence order of consumption as determining factors.
Table 2 Composition of the test products* per 100 ml
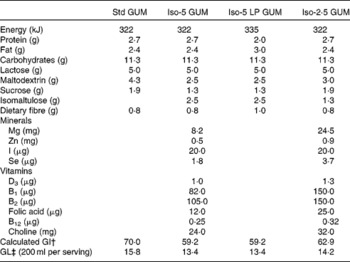
Std GUM, standard growing-up milk; Iso-5 GUM, Std GUM with 5 g isomaltulose per serving; Iso-5 LP GUM, Std GUM with 5 g isomaltulose per serving with lowered protein and increased fat and dietary fibre content; Iso-2·5 GUM, Std GUM with 2·5 g isomaltulose per serving and increased levels of some minerals and vitamins; GI, glycaemic index; GL, glycaemic load.
* Test products are prepared by mixing one sachet (45·4 g powder) with 180 ml of warm water.
† Sum of the products of individual carbohydrates and their GI divided by the total amount of carbohydrates, using the following GI: lactose 46; sucrose 68; maltodextrin 100, isomaltulose 40.
‡ GL is the sum of the products of individual carbohydrates per serving (200 ml) and their GI, divided by 100. A GL >20 is high, 11–19 is medium and 10 or less is considered to be low(Reference Foster-Powel, Holt and Brand-Miller28).
Table 3 Treatment schedule

A, standard growing-up milk (Std GUM); B, Std GUM with 5 g isomaltulose per serving; C, Std GUM with 5 g isomaltulose per serving with lowered protein ( − 0.7 g) and increased fat (0.48 g) and dietary fibre (0.22 g) content; D, Std GUM with 2.5 g isomaltulose per serving and increased levels of some minerals and vitamins.
A week before the study, parents were given printed information on study requirements for the children. On the day before each test day, parents were again reminded to have their children arrived at the research centre before 08.00 hours, to maintain a standard pattern of activity, to consume dinner before 21.00 hours and to refrain from eating or drinking except plain water from 21.00 hours onwards until arrival at the research centre the next day. Parents were asked about their children's adherence to the study requirements upon arrival at the institute.
Major aspects of attention, working and episodic memory were studied using a computerised cognitive performance test battery (United BioSource Corporation) comprising the tests in the order presented below.
Picture presentation
A series of twenty pictures of everyday scenes, animals and objects were presented to the children to remember.
Simple reaction time
Children were instructed to press the ‘YES’ response button as quickly as possible every time the word ‘YES’ was presented on the screen. A total of fifty stimuli were presented with a varying inter-stimulus interval between 1 and 3·5 s. The task lasted approximately 2 min. The average reaction time is the outcome measure of this task.
Digit vigilance
A target digit was displayed on the screen that was then followed by the display of a series of 450 digits at the rate of 150/min. Children were instructed to respond as quickly as possible every time a digit in the series matched the target digit. The task lasted for 3 min. The outcome measures of this task are the percentage of correctly detected targets, the average reaction time for correct detections and the number of false alarms.
Choice reaction time
Children were instructed to respond to the words ‘YES’ and ‘NO’ as they appeared on the screen by pressing the corresponding button as quickly as possible. A total of fifty trials were presented during which each stimulus word was chosen randomly with equal probability and at a varying inter-stimulus interval between 1 and 3·5 s. The task lasted approximately 2 min. The choice reaction time is measured as the percentage of correct responses and the average reaction time of correct responses.
Spatial working memory
A picture of a house was shown on the screen for 10 s with four of the nine windows lit. Children were instructed to memorise the position of the lit windows, and were then presented with thirty-six subsequent presentations of the house, each time with a single window lit. The children were required to decide whether or not the single window that was lit had been lit in the original presentation, and to press the ‘YES’ or ‘NO’ button as quickly as possible. The task lasted approximately 2 min. The sensitivity index and the average speed of correct responses are outcome measures of spatial working memory.
Numeric working memory
A series of five digits were presented, one every 1·15 s for the children to remember. Immediately after this, a series of thirty probe digits were presented one at a time, and the children had to decide whether or not each digit was the one they had been asked to remember, and to press the ‘YES’ or ‘NO’ button as quickly as possible. The task lasted for approximately 2 min. This task is represented by the sensitivity index and the average speed of correct responses.
Picture recognition
The original pictures presented previously, plus twenty similar but different pictures were presented one at a time in a randomised order. For each picture, children were required to indicate whether the picture was one of those originally presented by pressing the ‘YES’ or ‘NO’ button as quickly as possible. The task lasted approximately 1·5 min. The outcome measures of picture recognition are the sensitivity index and the average speed of correct responses.
Composite scores
Principal components analysis has shown that the various measures from the three attention tasks load on two different factors, whereas the speed measure from three different memory tasks loads on one factor, and composite scores can be created based on these loadings. These factors are described below.
Power of attention
The speed measures from the three attention tasks (simple and choice reaction time, and digit vigilance) reflect the intensity of concentration at a particular moment.
Continuity of attention
The accuracy measures from the choice reaction time and the digit vigilance task reflect the ability to sustain attention and avoid error.
Speed of memory
The sum of the speed measures from the spatial and numeric working memory tasks and the picture recognition tasks.
United BioSource Corporation was involved in the training programmes for the researchers and data evaluation. All children completed four training sessions shortly before the first test day in order to ensure an optimal level of performance for the baseline assessment. On each test day, cognitive performance tests (pre-dose (baseline), and at 60, 120 and 180 min post-dose) were conducted at the start of the study (as an acute effect), and at the end of the first, second, third and fourth intervention periods (as a sustained effect). Test drinks at the test days were provided in calibrated cups and were consumed within 15 min. After that, they were restricted from eating for the next 3 h. Any leftover of the test drinks was recorded. Children were tested simultaneously in a classroom, with the children seated at tables in one row, behind each other. In between the tests, children could play in the test room. After completion of the 180 min measurement, children were served with food and beverages.
Data analysis
The number of approximately fifty participants, including a potential dropout rate of 5 %, was based on the outcome in the study of Taib et al. (Reference Taib, Shariff and Wesnes17). In their study, thirty children participated and although significant effects were found on cognitive parameters, we increased the total number of children to compensate for a potentially smaller difference in the findings between the various groups.
A quality data review was conducted on the blinded data before receipt of the randomisation code. Based on this review, all data (except for those who did not consume 75 % of the test product) were approved.
Statistical analysis was performed based on the change in response per person. By doing this, inter-variation is minimised (high v. low responders).
For each parameter, the values per person per time interval were subtracted from those at the start of the experiment. This resulted in changes per time interval, which were tested using multiple stepwise regression analysis with a dummy variable(Reference Kleinbaum, Kupper and Muller20). The regression equation applied was as follows:
where y is the change in outcome per person per time interval; x 1 is the dummy variable, taking the values 0 for product I and 1 for product II; x 2 is the time interval; x 3= (x 1) × (x 2); a 1–4 are coefficients.
By filling in the formula, a statistical comparison between two plots can be established:
(1) one assigned with ‘0’ as the dummy variable, which results in the following equation:
(2) one assigned with ‘1’ as the dummy variable, which results in the following equation:
In these equations, a 3 describes the difference in slope between the two plots (time effect of the product during the intervention), while a 1 characterises the difference in overall intensity (constant effect, already starting at the first time interval) throughout the whole interval of the study. These coefficients can be tested via the t test within the regression analysis itself(Reference Kleinbaum, Kupper and Muller20). Fitting of the equation was done by ANOVA and F-test. In addition to a linear relationship, a quadratic (parabolic) relationship was investigated as well. This did not result in a substantially different outcome.
Since the present study follows a repeated measurement design, a potential subject effect on the outcome was checked via ANCOVA and found to be absent. Using the same approach, it was observed that order of consumption did not affect the outcome in the present study either.
Analyses were done using STATA, version 10 (StataCorp). Throughout the study, using two-sided testing, P values of 0·05 or lower were considered to be statistically significant.
Results
During the study, four children dropped out because of being incapable to do the cognitive performance tasks(nReference Benton and Jarvis2), refusal of parents to continue with the study(Reference Widenhorn-Muller, Hille and Klenkn 1) or continuous consumption of less than 75 % of the test product(Reference Widenhorn-Muller, Hille and Klenkn 1). From the fifty remaining children, some did not consume a minimum of 75 % of the test product at a particular test day and were therefore excluded from the final evaluations for that particular day. For day 0, this was the case for five subjects (2 × Std GUM, 2 × Iso-5 LP GUM and 1 × Iso-5 GUM) and for day 14 for one subject (1 × Iso-5 LP GUM).
For the studied parameters, most treatments showed decrements in performance compared with baseline. Only speed of memory showed improvements when compared with baseline. The results for each cognitive parameter (next sections) and the differences between the parameters are based on outcomes as measured on the last days of each 14 d intervention period. An overview of the several cognitive effects and the differences between the four test products is provided in Table 4.
Table 4 Overview of significant effects or trend effects between the products standard growing-up milk (Std GUM) (A), Std GUM with 5 g isomaltulose per serving (B), Std GUM with 5 g isomaltulose per serving with lowered protein and increased fat and dietary fibre content (C) and Std GUM with 2·5 g isomaltulose per serving and increased levels of some minerals and vitamins (D) with regard to the several cognitive performance tasks‡
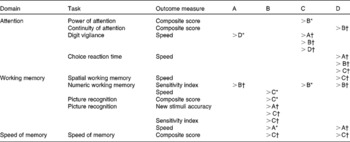
* P< 0·05.
† P< 0·02.
‡ Composition of products A–D can be found in Table 2. Data are expressed as product in column heading being better than (>) product indicated for the several tasks.
Power of attention
Based on the change in this parameter, Iso-5 LP GUM provided the best results (lowest increase) when compared with Iso-5 GUM (P= 0·048; Fig. 1). Both products were isomaltulose enriched, but Iso-5 LP GUM had a lower protein content.
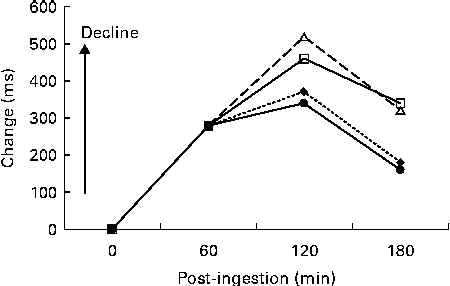
Fig. 1 Effect of the milk products on the change in power of attention: standard growing-up milk (Std GUM; □); Std GUM with 5 g isomaltulose per serving (Iso-5 GUM; △); Std GUM with 5 g isomaltulose per serving with lowered protein and increased fat and dietary fibre content (Iso-5 LP GUM; ●); Std GUM with 2·5 g isomaltulose per serving and increased levels of some minerals and vitamins (◆). Data are mean values. Iso-5 LP GUM was significantly different from Iso-5 GUM (P< 0·05). For the composition of each milk product, refer to Table 2.
Continuity of attention
With regard to the change in this parameter, Iso-2·5 GUM is superior to Iso-5 GUM (P= 0·019; Fig. 2). Furthermore, there is an effect of time when comparing Iso-5 GUM with Iso-5 LP GUM (P= 0·041) and Iso-2·5 GUM (P= 0·031).
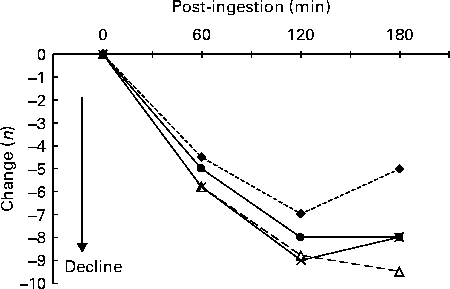
Fig. 2 Effect of the milk products on the change in continuity of attention: standard growing-up milk (Std GUM; □); Std GUM with 5 g isomaltulose per serving (Iso-5 GUM; △); Std GUM with 5 g isomaltulose per serving with lowered protein and increased fat and dietary fibre content (●); Std GUM with 2·5 g isomaltulose per serving and increased levels of some minerals and vitamins (Iso-2·5 GUM; ◆). Data are mean values. Iso-2·5 GUM was significantly different from Iso-5 GUM (P< 0·02). For the composition of each milk product, refer to Table 2.
Digit vigilance speed
The results of the stepwise regression using the change in outcome revealed that there was a significant difference in the effect on time. Std GUM performed worse than Iso-5 LP GUM (P< 0·02), whereas Std GUM performed better than Iso-2·5 GUM (P< 0·05). The same was observed between Iso-5 LP GUM and Iso-5 GUM (P< 0·006), and Iso-5 LP GUM and Iso-2·5 GUM (P< 0·003; Fig. 3). Obviously, the product Iso-5 LP GUM established a better response in digit vigilance speed (in ms) when compared with the other products at 180 min.
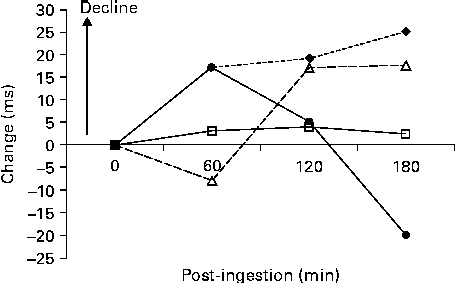
Fig. 3 Effect of the milk products on the change in digit vigilance speed: standard growing-up milk (Std GUM; □); Std GUM with 5 g isomaltulose per serving (Iso-5 GUM; △); Std GUM with 5 g isomaltulose per serving with lowered protein and increased fat and dietary fibre content (Iso-5 LP GUM; ●); Std GUM with 2·5 g isomaltulose per serving and increased levels of some minerals and vitamins (Iso-2·5 GUM; ◆). Data are mean values. Std GUM was significantly different from Iso-2·5 GUM (P< 0·05). Iso-5 LP GUM was significantly different from Std GUM (P< 0·02), Iso-5 GUM (P< 0·006) and Iso-2·5 GUM (P< 0·003). For the composition of each milk product, refer to Table 2.
Choice reaction time
This task had two outcome measures, speed and accuracy. For speed, the results of the analysis showed that during the time interval of the intervention, Iso-2·5 GUM performed better when compared with Std GUM (P< 0·01), Iso-5 GUM (P< 0·01) and Iso-5 LP GUM (P< 0·02) (Fig. 4). The improved response is shown at 120 and 180 min post-dose, and after an initial decrease at 60 min. No differences were found between the products with regard to the outcome measure accuracy.
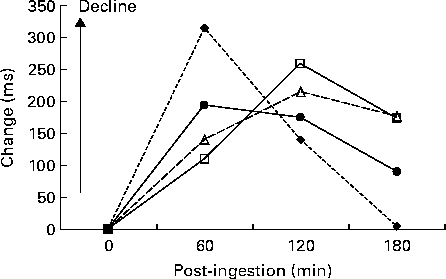
Fig. 4 Effect of the milk products on the change in choice reaction time: standard growing-up milk (Std GUM; □); Std GUM with 5 g isomaltulose per serving (Iso-5 GUM; △); Std GUM with 5 g isomaltulose per serving with lowered protein and increased fat and dietary fibre content (Iso-5 LP GUM; ●); Std GUM with 2·5 g isomaltulose per serving and increased levels of some minerals and vitamins (Iso-2·5 GUM; ◆). Data are mean values. Iso-2·5 GUM was significantly different from Std GUM (P< 0·01), Iso-5 GUM (P< 0·01) and Iso-5 LP GUM (P< 0·02). For the composition of each milk product, refer to Table 2.
Quality of working memory
No differences were found between the four products, although subjects who consumed Iso-2·5 GUM showed a trend in having the slowest rate of decline for this task, especially during the first 2 h post-dose.
Spatial working memory
This task had two outcome measures, the sensitivity index and the speed of correct responses. Performance in the sensitivity index declined significantly over the morning under all conditions, without differences between the various treatments.
For the speed of correct responses, Iso-5 LP GUM showed a significant decrease in speed (bigger change) when compared with the product Iso-2·5 GUM (P< 0·01).
Numeric working memory
The sensitivity index worsened in all conditions compared with baseline. Comparisons between the conditions revealed that Iso-5 GUM performed significantly worse than Std GUM (P= 0·015), Iso-5 LP GUM (P= 0·032) or Iso-2·5 GUM (P= 0·001). For speed, performance on Iso-5 LP GUM declined when compared with pre-dose, which resulted in a worse performance when compared with Iso-5 GUM (P< 0·04), at 180 min post-dose.
Picture recognition
This task had four outcome measures: sensitivity index; speed; original stimuli accuracy; new stimuli accuracy. Based on the change in the outcome measure ‘new stimuli accuracy (%)’, Std GUM showed a bigger decrease in performance during the test period than Iso-5 GUM (P= 0·005), but was not different from Iso-2·5 GUM (P= 0·087). From 60 min post-dose onwards, the plot of Iso-5 GUM was constantly at a higher level than Iso-5 LP GUM (P= 0·018), and this was also the case for the sensitivity index. For speed, Std GUM performed slower than Iso-5 GUM (P= 0·021) and Iso-2·5 GUM (P= 0·017). No differences were found between the groups with regard to the original stimuli accuracy.
Speed of memory
All the products showed an improvement in speed of memory between 120 and 180 min post-dose, but for the product Iso-2·5 GUM, this improvement already started at 60 min post-dose (Fig. 5).
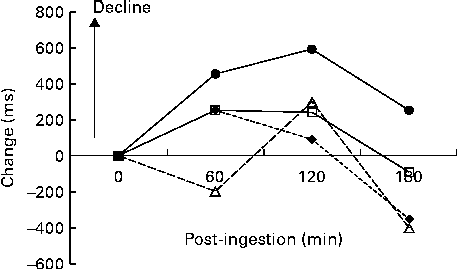
Fig. 5 Effect of the milk products on the change in speed of memory: standard growing-up milk (Std GUM; □); Std GUM with 5 g isomaltulose per serving (Iso-5 GUM; △); Std GUM with 5 g isomaltulose per serving with lowered protein and increased fat and dietary fibre content (Iso-5 LP GUM; ●); Std GUM with 2·5 g isomaltulose per serving and increased levels of some minerals and vitamins (Iso-2·5 GUM; ◆). Data are mean values. Iso-5 GUM was significantly different from Iso-5 LP GUM (P< 0·02). Iso-2·5 was significantly different from Iso-5 LP GUM (P= 0·003). For the composition of each milk product, refer to Table 2.
From 60 min onwards during the test period, the plot Iso-5 GUM was parallel to the plot Iso-5 LP GUM but at a constantly higher level (P= 0·019), which means the speed of memory on Iso-5 GUM was quicker than that on Iso-5 LP GUM. The plots Iso-5 LP GUM and Iso-2·5 GUM started at the same level at 60 min post-dose. However, Iso-2·5 GUM showed a significantly better improvement within the interval of the present study than Iso-5 LP GUM (P= 0·003).
Discussion
Similar to previous findings in children(Reference Benton, Ruffin and Lassel4, Reference Wesnes, Pincock and Richardson5, Reference Ingwersen, Defeyter and Kennedy9, Reference Taib, Shariff and Wesnes17), the present study identified declines in attention and aspects of working and episodic memory over the morning. However, as hypothesised and shown before(Reference Taib, Shariff and Wesnes17), the present study also indicates that GUM with a carbohydrate composition including isomaltulose shows beneficial effects (decreased declines) on parameters of attention and memory, most notably at 180 min after consumption. More specifically, the product with only half the amount of isomaltulose (2·5 g/serving: Iso-2·5 GUM) but additionally enriched with some minerals and vitamins showed the best overall results being significantly different from the reference product (choice reaction time and picture recognition speed), the product Iso-5 GUM (continuity of attention, choice reaction time and numeric working memory) and the product Iso-5 LP GUM (choice reaction time, spatial working memory and speed of memory). It seems that Iso-5 LP GUM and Iso-2·5 GUM optimise attention parameters, whereas Iso-5 GUM performs well with respect to working memory. The reference product Std GUM was, except for two occasions, never the most positively outspoken product.
It is indicated that both the GI of breakfast and the GL (product of the amount of available carbohydrate per serving and GI) are important for cognitive performance in humans(Reference Micha, Rogers and Nelson11). Dependent on the combination of GL and GI, the magnitude of elevation in blood glucose and associated insulin response is affected. The higher the insulin response, the faster the decline in blood glucose concentrations. Furthermore, there is evidence that decreasing blood glucose concentrations (resulting in mild hypoglycaemia) stimulate transient cortisol secretion(Reference Chen, Willis and Mooney21). Also in this case, the cortisol response will be stronger in case the decline in blood glucose concentration is faster. One of the primary functions of cortisol is to increase blood glucose through gluconeogenesis. It has been shown that cortisol secretory pulses stimulate alertness in young adults(Reference Chapotot, Gronfier and Jouny22, Reference Vgontzas, Pejovic and Zoumakis23). Besides, there is accumulating evidence for a direct impact of blood glucose and associated insulin concentrations on brain fuelling. Receptors for insulin and transporters for glucose are widespread in brain tissue with differences in densities between several brain regions. Associations between insulin and cognitive outcomes such as learning and memory have been established(Reference Shemesh, Rudich and Harman-Boehm24, Reference Plum, Belgardt and Brüning25). Finally, in a mixture of low- and medium–high–GI carbohydrates, low-GI carbohydrates such as isomaltulose still supply glucose for absorption up to 3 h post-consumption(Reference Holub, Gostner and Theis15).
In the study of Micha et al. (Reference Micha, Rogers and Nelson11) in children aged 11–14 years old, the combination of calculated low GI (forty-eight) and high GL (forty-one per serving) improved learning through beneficial effects on alertness, attention, improved declarative verbal memory and improved vigilance. Furthermore, kids on low-GI products were happy, less nervous and more confident. In high-GI groups (strong insulin response), for low as well as high GL, increased cortisol levels were detected. In the present study, the GL per serving was much lower than the lowest GL in the study of Micha et al. (Reference Micha, Rogers and Nelson11). Small differences exist between the lowest (59·2 v. 48) and highest GI (70 v. 61) of both studies. The GI/GL combination of Iso-2·5 GUM (62·9/14·2) was closest to the high GI/low GL (61/28) of Micha et al. (Reference Micha, Rogers and Nelson11). They showed positive effects on vigilance (attention), Stroop task (reaction time), speed information processing and short-term memory. As mentioned previously, these children also showed higher cortisol concentrations. In the present study, Iso-2·5 GUM showed beneficial effects on continuity of attention, choice reaction time, picture recognition speed, spatial working memory speed and speed of memory: processes that are more aligned with the acute situation. Although we did not measure cortisol and insulin responses in children, it can be hypothesised that the effect of Iso-2·5 GUM on acute brain function is a combination of higher absolute blood glucose concentrations in the first instance (‘high’ GI), the insulin response and possibly associated cortisol stimulation, and a longer provision of glucose by isomaltulose. At that time, also endogenous glucose production has started due to the expected glucagon synthesis.
Both plasma insulin and glucagon secretions can be significantly stimulated by already low dietary protein intakes (0·25 g/kg body weight)(Reference Claessens, Calame and Siemensma18). Since the protein levels of the GUM used in the present study ranged from 0·2 to 0·28 g/kg body weight, a stimulation of insulin secretion, followed by a stronger decrease in blood glucose concentrations, and, finally, an associated stimulation of glucagon after 100–210 min post-consumption of the GUM can be expected(Reference Claessens, Calame and Siemensma18, Reference Gannon, Nuttall and Saeed26). Std GUM, Iso-5 GUM and Iso-2·5 GUM supplied on average 0·28 g protein/kg body weight. It was hypothesised that a lower protein content (0·2 g/kg body weight: Iso-5 LP GUM) could result in better cognitive performance at 3 h post-dose due to higher blood glucose concentrations because of a blunted insulin response when compared with the products with higher protein concentrations. Table 4 shows that Iso-5 LP GUM, in particular, stimulates parameters of attention. In contrast, Iso-5 GUM that only differed from Iso-5 LP GUM in having a higher protein content showed superior to Iso-5 LP GUM in parameters of working memory. As also suggested by Micha et al. (Reference Micha, Rogers and Nelson11) and as discussed previously, the height of blood glucose concentration and consequently insulin and possible cortisol responses seem to be important in the activation of specific brain domains dealing with acute or more long-term activities. For Iso-5 LP GUM, it can be hypothesised that the role of cortisol is reduced due to a lower insulin response (low protein), resulting in a slower decline of blood glucose. During this decline, there is still the provision of glucose from isomaltulose (up to 3 h post-consumption) and a gradually increasing supply of glucose from liver glycogen breakdown (glucagon). Altogether, this might be favourable for numeric working memory (less acute and necessity for recall) as well as for the effects on attention.
The present study indicates that additional minerals (Mg, Zn and Se) and vitamins (D3, B1, B2, B12 and folic acid), and choline have a positive effect on parameters of attention and memory. An effect of micronutrient enrichment (Fe, Zn and the vitamins A, B6, B12 and C, and folic acid) on parameters of cognitive performance (verbal learning and memory) has also been reported by the NEMO (Nutrition Enhancement for Mental Optimization) study group(Reference Osendarp, Baghurst and Bryan27) in well-nourished, school-aged Australian and Indonesian children, aged 6–10 years. However, the authors did not see an effect on attention. It can be debated what the impact of the additional micronutrients in Iso-2·5 GUM was on the overall good performance of the product. However, since the products with higher concentrations of isomaltulose performed less well on some specific tasks, an important role of the micronutrients is to be expected. Future studies on the ‘real’ benefit of a high or reduced concentration of isomaltulose in combination with the additional mix of minerals and vitamins are warranted.
Iso-2·5 GUM was the final product consumed by all children, which might have affected the outcome of the present study. This construction was chosen since due to the additional vitamins and minerals in the product Iso-2·5 GUM, a randomised cross-over study including all products would require long washout periods. Our purpose was to study the children in a limited period of time to prevent increases in variability due to their normal improvements in cognitive performance. The total study period per child was 2 months, and although even in this period normal improvement of cognitive performance is likely to take place, the period is considered to be too short to explain the overall superiority of the product Iso-2·5 GUM. This topic will be addressed in future studies using a parallel design. A washout period between the randomised products having all the same vitamin and mineral composition was not considered to be necessary. This is confirmed by an absence in differences in cognitive outcomes after the first consumption of the products (start of the study) and consumption on day 14, in a limited number of infants per group (n 18).
Conclusions
The present study shows the beneficial effects of isomaltulose-enriched GUM on parameters of cognitive performance. Significant better effects were found for most parameters of attention, working memory and speed of memory at 3 h post-dose, when compared with the reference product. Furthermore, it is indicated that enrichment with specific minerals and vitamins has an additional positive effect on cognitive performance. Lowering the protein concentration resulted in improved attention but did not benefit speed of memory. The observed effects of the several products are caused by an interplay, especially, between the GI of dietary carbohydrates, the short- and long-term blood glucose concentrations, insulin and possible cortisol responses, and the protein effect on insulin and glucagon. In particular, isomaltulose and its associated longer supply of glucose seem to be of importance since this carbohydrate is the major difference with the reference product. It can be hypothesised that for short-term cognitive performance, a higher blood glucose concentration with associated insulin and cortisol responses seems to be beneficial. For long-term cognitive performance, low protein in combination with low GI might be preferred.
Acknowledgements
The authors are indebted to the research team from the Department of Psychiatry, Medical School, University of Indonesia for their expert analysis. FrieslandCampina Indonesia is gratefully acknowledged for supplying the products and for the regular monitoring of the study. A. S. wrote the study protocol; R. S., T. W. and D. N. were responsible for the data collection; S. B. was responsible for the study from an institutional point of view. All authors were involved in the writing of the manuscript. The results of the present study will be used by FrieslandCampina in medical marketing but FrieslandCampina had no influence on the outcome of the study. None of the other authors or the research institute had any conflicts of interest. FrieslandCampina provided the test products and the budget for the study but was not involved in the selection of participants, cognitive performance testing, the supply of products and the final set of results. Statistical analyses were conducted by W. C. from StatistiCal who was unaware of the composition of the products.


