Many amino acids including arginine are commonly used as oral supplements for various reasons, including as a nutrient. l-Arginine (l-Arg) is a semi-essential amino acid which serves as a substrate for a variety of enzymes(Reference Morris1). The more well-known nitric oxide synthases (NOS) use l-Arg, but not d-arginine (d-Arg), to produce nitric oxide (NO), a vasodilator and l-citrulline(Reference Palmer, Ashton and Moncada2). The endothelial isoform of NOS (eNOS) is an important regulator of vascular tone and blood flow and a major reason for the popularity of arginine supplements(Reference Lekakis, Papathanassiou and Papaioannou3–Reference Maxwell, Ho and Le5). Arginase is a major enzyme that uses l-Arg produced in the urea cycle to produce ornithine and urea and thus plays an important role in ammonia detoxification(Reference Morris1). While arginase 1 is mainly present in the liver, arginase 2 in the kidney and the intestines is believed to regulate polyamine, proline and NO synthesis(Reference Morris1). Arginase has been shown to compete with eNOS for l-Arg as a substrate, resulting in endothelial dysfunction in some situations(Reference Berkowitz, White and Li6). Arginine:glycine amidinotransferase (GATM) converts arginine into creatine via guanidinoacetate N-methyltransferase(Reference Van Pilsum, Stephens and Taylor7). Arginine is also a substrate for arginine decarboxylase (ADC) which produces agmatine, a putative neurotransmitter(Reference Li, Regunathan and Barrow8,Reference Morris9) .
Oral supplements have become more popular after the discovery of l-Arg as a precursor for the vasodilatory NO. Thus, it is used by healthy people and athletes to increase exercise capacity(Reference Maxwell, Ho and Le5,Reference Alvares, Meirelles and Bhambhani10) . Hoping to improve vasodilation, arginine supplements have been used in patients with mitochondrial myopathy, encephalopathy, lactic acidosis and stroke (MELAS)(Reference Koga, Akita and Junko11), hypercholesterolaemia(Reference Creager, Gallagher and Girerd4), diabetic patients(Reference Piatti, Monti and Valsecchi12) and hypertension(Reference Dong, Qin and Zhang13). Interestingly, arginine supplements did not affect blood pressure in healthy humans(Reference Ast, Cieslewicz and Korzeniowska14). Other conditions for which it has been shown to be beneficial include obesity(Reference McKnight, Satterfield and Jobgen15) and reduction of plasma lipids and glucose in humans(Reference McKnight, Satterfield and Jobgen15–Reference Schulze, Glos and Petruschka17). Arginine supplements have also been reported to be unsuccessful in affecting eNOS activity and improving vasodilation in several conditions(Reference Blum, Hathaway and Mincemoyer18–Reference Alvares, Conte-Junior and Silva21).
Despite the increasing popularity of oral arginine supplements, there is a lack of knowledge about an optimum dose or effects of oral arginine on its multiple enzymes and metabolites. Studies and information about the impact of oral arginine supplements on its metabolic pathways are available only in bits and pieces, and there are very few studies which have mainly reported effects on a single metabolic pathway(Reference Moretto, Guglielmetti and Tournier-Nappey22,Reference Dhar, Dhar and Wu23) . Moreover, many studies do not include d-Arg, the supposedly inert isomer. This was our rationale to undertake a comprehensive study to determine the effect of oral l-Arg and d-Arg on its multiple metabolic pathways in normal Sprague–Dawley rats. Since our study involved examining several organ and plasma samples, human studies were not feasible. The rat was chosen as a model because abundant data on its physiology are available and it closely resembles human physiology(Reference Iannaccone and Jacob24). Our objectives were to examine the impact of oral arginine supplements on its metabolic enzymes and their metabolites in all metabolic pathways that utilise l-Arg as a substrate. Since arginine is a scavenger of methylglyoxal (MG)(Reference Dhar, Dhar and Wu23), a reactive metabolite of glucose and fructose, we also examined the impact on the glyoxalase enzymes, which degrade MG into d-lactate.
Materials and methods
Animals
A total of twenty-seven male, 9-week-old, Sprague–Dawley rats were purchased from Charles River Canada for use according to a protocol (no. 20160059) approved by the Animal Care Committee at the University of Saskatchewan, following guidelines of the Canadian Council on Animal Care and the ARRIVE guidelines(Reference Kilkenny, Browne and Cuthill25). The rats were housed in the state-of-the-art vivarium facilities of the Health Sciences building. They were fed a standard laboratory rat diet (Prolab® RMH 3000, LabDiet) containing arginine at 1·37 % in a protein content of 22·5 %. After 1 week of acclimatisation, the rats were randomly assigned to one of the three treatment groups with nine rats per group: (1) control: plain drinking water, (2) l-Arg: 500 mg/kg per d via drinking water and (3) d-Arg: 500 mg/kg per d via drinking water. The treatment was administered for 4 weeks. The dose of 500 mg/kg per d was selected from the dose range used in rats(Reference Xu, Zhao and Lao26–Reference Matsuoka, Nakata and Kohno28) and humans(Reference Ast, Cieslewicz and Korzeniowska14,Reference Clarkson, Adams and Powe29) . The group size was chosen based on data from previous projects and protocols to ensure robust statistical data. During this time, rats were individually housed to allow for individual daily water intake to be recorded. The body weight was recorded every other day. The daily water intake and body weight were used to calculate the dose of arginine for each rat, which was adjusted every other day in the drinking water. Arginine free base (l-Arg, catalogue no. W381918, Sigma-Aldrich Canada Ltd; d-Arg, catalogue no. GM7267, Glentham Life Sciences) was dissolved in the drinking water, and the highly alkaline pH was adjusted to 7·4 with hydrochloric acid.
After 4 weeks of treatment, a terminal experiment was performed during daytime in the Health Sciences vivarium facilities as follows. The rat was placed in a metabolic cage overnight for 16 h prior to the experiment, and urine was collected. The rats were anaesthetised using isoflurane (Forane, 2–4 % in O2), to minimise depression of cardio-respiratory systems, and the right carotid artery and left jugular vein were cannulated to record the mean arterial pressure and collect blood samples, respectively. The mean arterial pressure was recorded for 20 min using the Powerlab (AD Instruments Inc.) and Chart software. Following blood pressure recording, the heart was cut open to cause exsanguination and various organs/tissues were collected and frozen in liquid N2 and stored at −80°C.
Arginine, lysine and citrulline assays
Arginine levels were measured using a rat arginine elisa kit (MyBiosource Inc.; catalogue no. MBS751058), which employs a double antibody sandwich technique. The plate is coated with a specific anti-arginine monoclonal antibody. Lysine levels were measured using a fluorometric lysine assay kit (Biovision Inc.; catalogue no. K2005-100). The assay is based on selective enzymatic metabolism of lysine to yield a final fluorogenic probe. Citrulline levels were measured using a colourimetric assay kit (Abcam; catalogue no. ab242292).
Western blotting
Western blotting was performed as described previously(Reference Dhar, Dhar and Wu23) on tissue lysates. The protein concentration of the supernatant was determined using the DC Protein assay (Bio-Rad Laboratories). The protein loading concentration for each antibody was determined by trying concentrations ranging from 30 to 75 µg and selecting a concentration which gave a clean signal that was within the liner range of the imaging software. The protein samples from different organs/tissues were separated (50–75 µg of protein per well) on a 4–20 % SDS-polyacrylamide gel (Bio-Rad Laboratories) via electrophoresis and wet-electrotransferred onto a 0·45 polyvinylidene difluoride membrane (GE Healthcare Life Sciences) and blocked using non-fat milk or 5 % bovine serum albumin (Sigma Canada) in Tris-buffered saline-Tween buffer for 1 h at room temperature for arginase I/II and eNOS, respectively. Blots were then incubated at 4°C overnight using appropriate primary antibodies: SLC7A1 (cationic transporter-1 (CAT-1), 1:1000, Antibodies-Online Inc.); eNOS (1:1000, BD Transduction Laboratories); arginase I and arginase II (1:1000); ADC (1:500 to 1:1000, Abcam Inc.), agmatinase (1:1000, Abcam Inc.), GATM (1:250, Abcam Inc.), glyoxalase (1:200, Abcam Inc.) and β-actin (1:8000, Abcam Inc.). This was followed by an 1 h incubation at room temperature with horseradish peroxidase-conjugated secondary antibody (Bio-Rad Laboratories). Following a thorough washing with Tris-buffered saline-Tween, the immunoreactive proteins were detected using Clarity Western Enhanced Chemiluminescence Blotting Substrates (Bio-Rad Laboratories). Finally, the images were analysed via densitometry using the GeneTools software (Syngene). If the separation of the bands for the target protein and β-actin was more, dual staining was performed on the same gel. If the bands for the target protein and β-actin were too close, staining was performed on two separate gels loaded with equal amounts of proteins, mounted in the same cassette and run at the same time. We tried stripping the membrane of the target protein and then staining for β-actin, but the results were not satisfactory. Precision Plus Dual Colour Protein standards (Bio-Rad Laboratories Ltd) were always loaded in the first lane to ensure that the detected bands were at the expected molecular weight.
Nitric oxide synthase activity assay
NOS activity was determined using a NOS activity assay kit (Biovision Inc.). Like the nitrite/nitrate assay, this kit uses the Griess reaction to convert NO produced by NOS enzymes into a coloured product for which absorbance can be read at 540 nm. In brief, cold NOS assay buffer was added to tissue samples and homogenised on ice. A sample (30 µl) was added to the wells of a ninety-six-well plate followed by 40 µl of reaction mix. After 1 h incubation at 37°C, an additional 95 µl of NOS assay buffer was added along with 5 µl of enhancer. After 10 min incubation at room temperature, 50 µl of each of Griess Reagents 1 and 2 was added. Following 10 min incubation at room temperature, the absorbance was read at 540 nm.
Nitrite/nitrate assay
Levels of nitrite and nitrate, as indicators of NO production, were measured using a colourimetric assay kit based on the Griess reaction (Cayman Chemicals)(Reference Dhar, Dhar and Wu23). The assay kit first converts nitrate to nitrite via nitrate reductase, and the Griess reagent converts nitrite to a deep purple azo compound. The optical density was measured at 540 nm on a UV spectrophotometer (Multiskan Ascent, ThermoFisher).
Arginase activity assay
Arginase activity was measured using an arginase activity assay kit (Sigma-Aldrich)(Reference Dhar, Dhar and Wu23). Arginase converts arginine to ornithine and urea. In brief, plasma samples were filtered to deplete urea from the sample. Tissue homogenates did not require further preparation. Samples were then loaded into a 96-well plate along with 10 µl of substrate buffer. The plate was allowed to incubate for 2 h at 37°C after which 200 µl of urea reagent was added to stop the reaction. Optical density was then measured at 430 nm.
Urea assay
Urea is a product of arginine breakdown by arginase. Urea levels were determined in plasma, urine and various organs using a urea assay kit (Abcam Inc.). In short, 25 µl of sample and 25 µl of urea assay buffer were added to each well followed by 50 µl of reaction mix. Following a 60 min incubation at 37°C, optical density was measured at 570 nm.
Arginine decarboxylase assay
Arginine decarboxylase levels were quantified in the plasma, ileum and kidney using an ELISA bioassay kit (catalogue no. abx251853, Abbexa Ltd, Cambridge Science Park) as per the manufacturer’s instructions. This kit is based on sandwich enzyme-linked immunosorbent assay with an absorbance read at 450 nm.
Total polyamines assay
Total polyamine (putrescine, spermidine, and spermine) levels were measured using a total polyamine fluorometric assay kit (catalogue no. K475-100, BioVision Inc.) according to the manufacturer’s instructions. The enzyme mix generates hydrogen peroxide which is detected with a fluorometric probe at excitation/emission wavelengths of 535/587 nm.
Creatinine assay
Creatinine levels in the organs and plasma were measured using a Sigma-Aldrich colourimetric creatinine assay kit (Sigma-Aldrich; MAK080). This assay kit determines creatinine concentration by a coupled enzyme reaction, which then results in a colourimetric (spectrophotometry at optical density = 570 nm) product, proportional to the creatinine present.
Glyoxalase activity
The activity of glyoxalase-I, the rate-limiting enzyme that converts MG to S-lactoylglutathione, was measured by means of an activity assay kit (Sigma-Aldrich). The absorbance of the coloured product was read at 240 nm using a UV spectrophotometer.
Methylglyoxal HPLC
MG was measured by a specific and sensitive HPLC method as described earlier(Reference Dhar, Dhar and Wu23). MG was derivatised with o-phenylenediamine to form the quinoxaline product, 2-methylquinoxaline, which is very specific for MG. The 2-methylquinoxaline and the internal standard 5-methylquinoxaline were quantified on a Hitachi D-7000 HPLC system (Hitachi, Ltd) via a Symmetry C18 column (3·9 mm × 150 mm and 4 μm particle diameter; Waters Corp.).
d-Lactate assay
d-Lactate was measured using a d-lactate colorimetric assay kit from Sigma-Aldrich (catalogue no. MAK058-1KT). The absorbance of the fluorescent product, d-lactate hydrogenase, was measured at 450 nm using a spectrophotometric multi-well plate reader.
Statistical analysis
The results were analysed using Graphpad PRISM software version 6 and one-way ANOVA with a post hoc test of multiple comparisons. A P value of <0·05 was taken as significant, and the results are expressed as mean values with their standard errors. Eight rats were included in each treatment group to obtain valid statistical data and account for unexpected mortality during 4 weeks of treatment. The sample size was chosen based on previous experimental protocols using high carbohydrate diet treatments. We have done a power analysis using G*Power (version 3.1.9.4). For our results from at least four different parameters measured (significant and NS) and with a P = 0·05 and a power of 0·80 we got actual power values above 0·95 and a total sample size ranging from six to fifteen, which justifies our total sample size of 25 (8 + 9 + 8).
Results
Oral arginine did not affect the age-related gain in body weight
The body weights, expressed as mean values with their standard errors in g, at the start of treatment (10 weeks) and completion of 4 weeks of treatment (14 weeks), respectively, were as follows: control: 325 (sem 8) g and 531 (sem 11) g (n 8); l-Arg-treated group: 321 (sem 9) g and 543 (sem 11) g (n 9); d-Arg-treated group: 367 (sem 4) g and 554 (sem 9) g (n 8).
Oral l-arginine, but not d-arginine, significantly resulted in reduced water intake
Administration of l-Arg, but not d-Arg, in drinking water resulted in a significant decrease in average water intake for the group at the end of 4 weeks of treatment. The water intake, expressed as mean with their standard errors in ml at the start of the treatment (10 weeks) and at the end of the treatment (14 weeks), respectively, was as follows: control: 48 (sem 2) ml and 50 (sem 3) ml (n 8); l-Arg group: 68 (sem 5) ml and 55 (sem 2) ml (n 8); d-Arg group: 59 (sem 4) ml and 56 (sem 3) ml (n 8). The arginine dose was adjusted every other day by measuring the body weight and daily water intake using the formula: Body weight × 15/water intake/d = xxx ml of arginine (10 g/l) to be added to a 300 ml bottle with the rest tap water.
Oral l-arginine reduces cationic transporter-1 expression in the ileum without any change in plasma and organ arginine concentrations
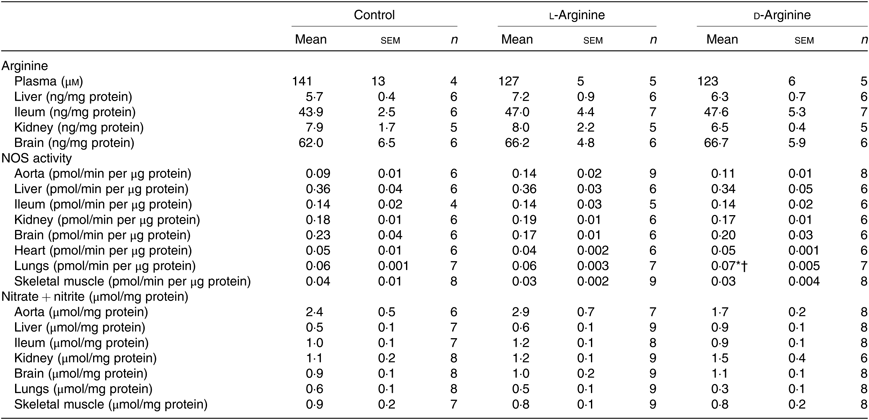
Oral l-Arg or d-Arg did not affect arginine concentrations in the plasma, liver, ileum, kidney or the brain compared with the control group (Table 1). However, oral l-Arg and d-Arg significantly reduced the expression of CAT-1 in the liver, and l-Arg reduced it in the ileum as compared with the control (Fig. 1(a)). Expression of CAT-1 in the aorta was not significantly affected by oral l- or d-Arg (Fig. 1(a)).
Table 1. Effect of oral arginine on arginine levels, nitric oxide synthase (NOS) activity and nitrate + nitrite levels‡
(Mean values with their standard errors; n values)
* P < 0·05 v. respective control group.
† P < 0·05 v. respective l-arginine group.
‡ Male Sprague–Dawley rats (10 weeks old) were treated with l-arginine or d-arginine in drinking water (500 mg/kg per d) for 4 weeks. Assay kits were used to measure arginine levels, NOS activity and nitrate + nitrite levels.
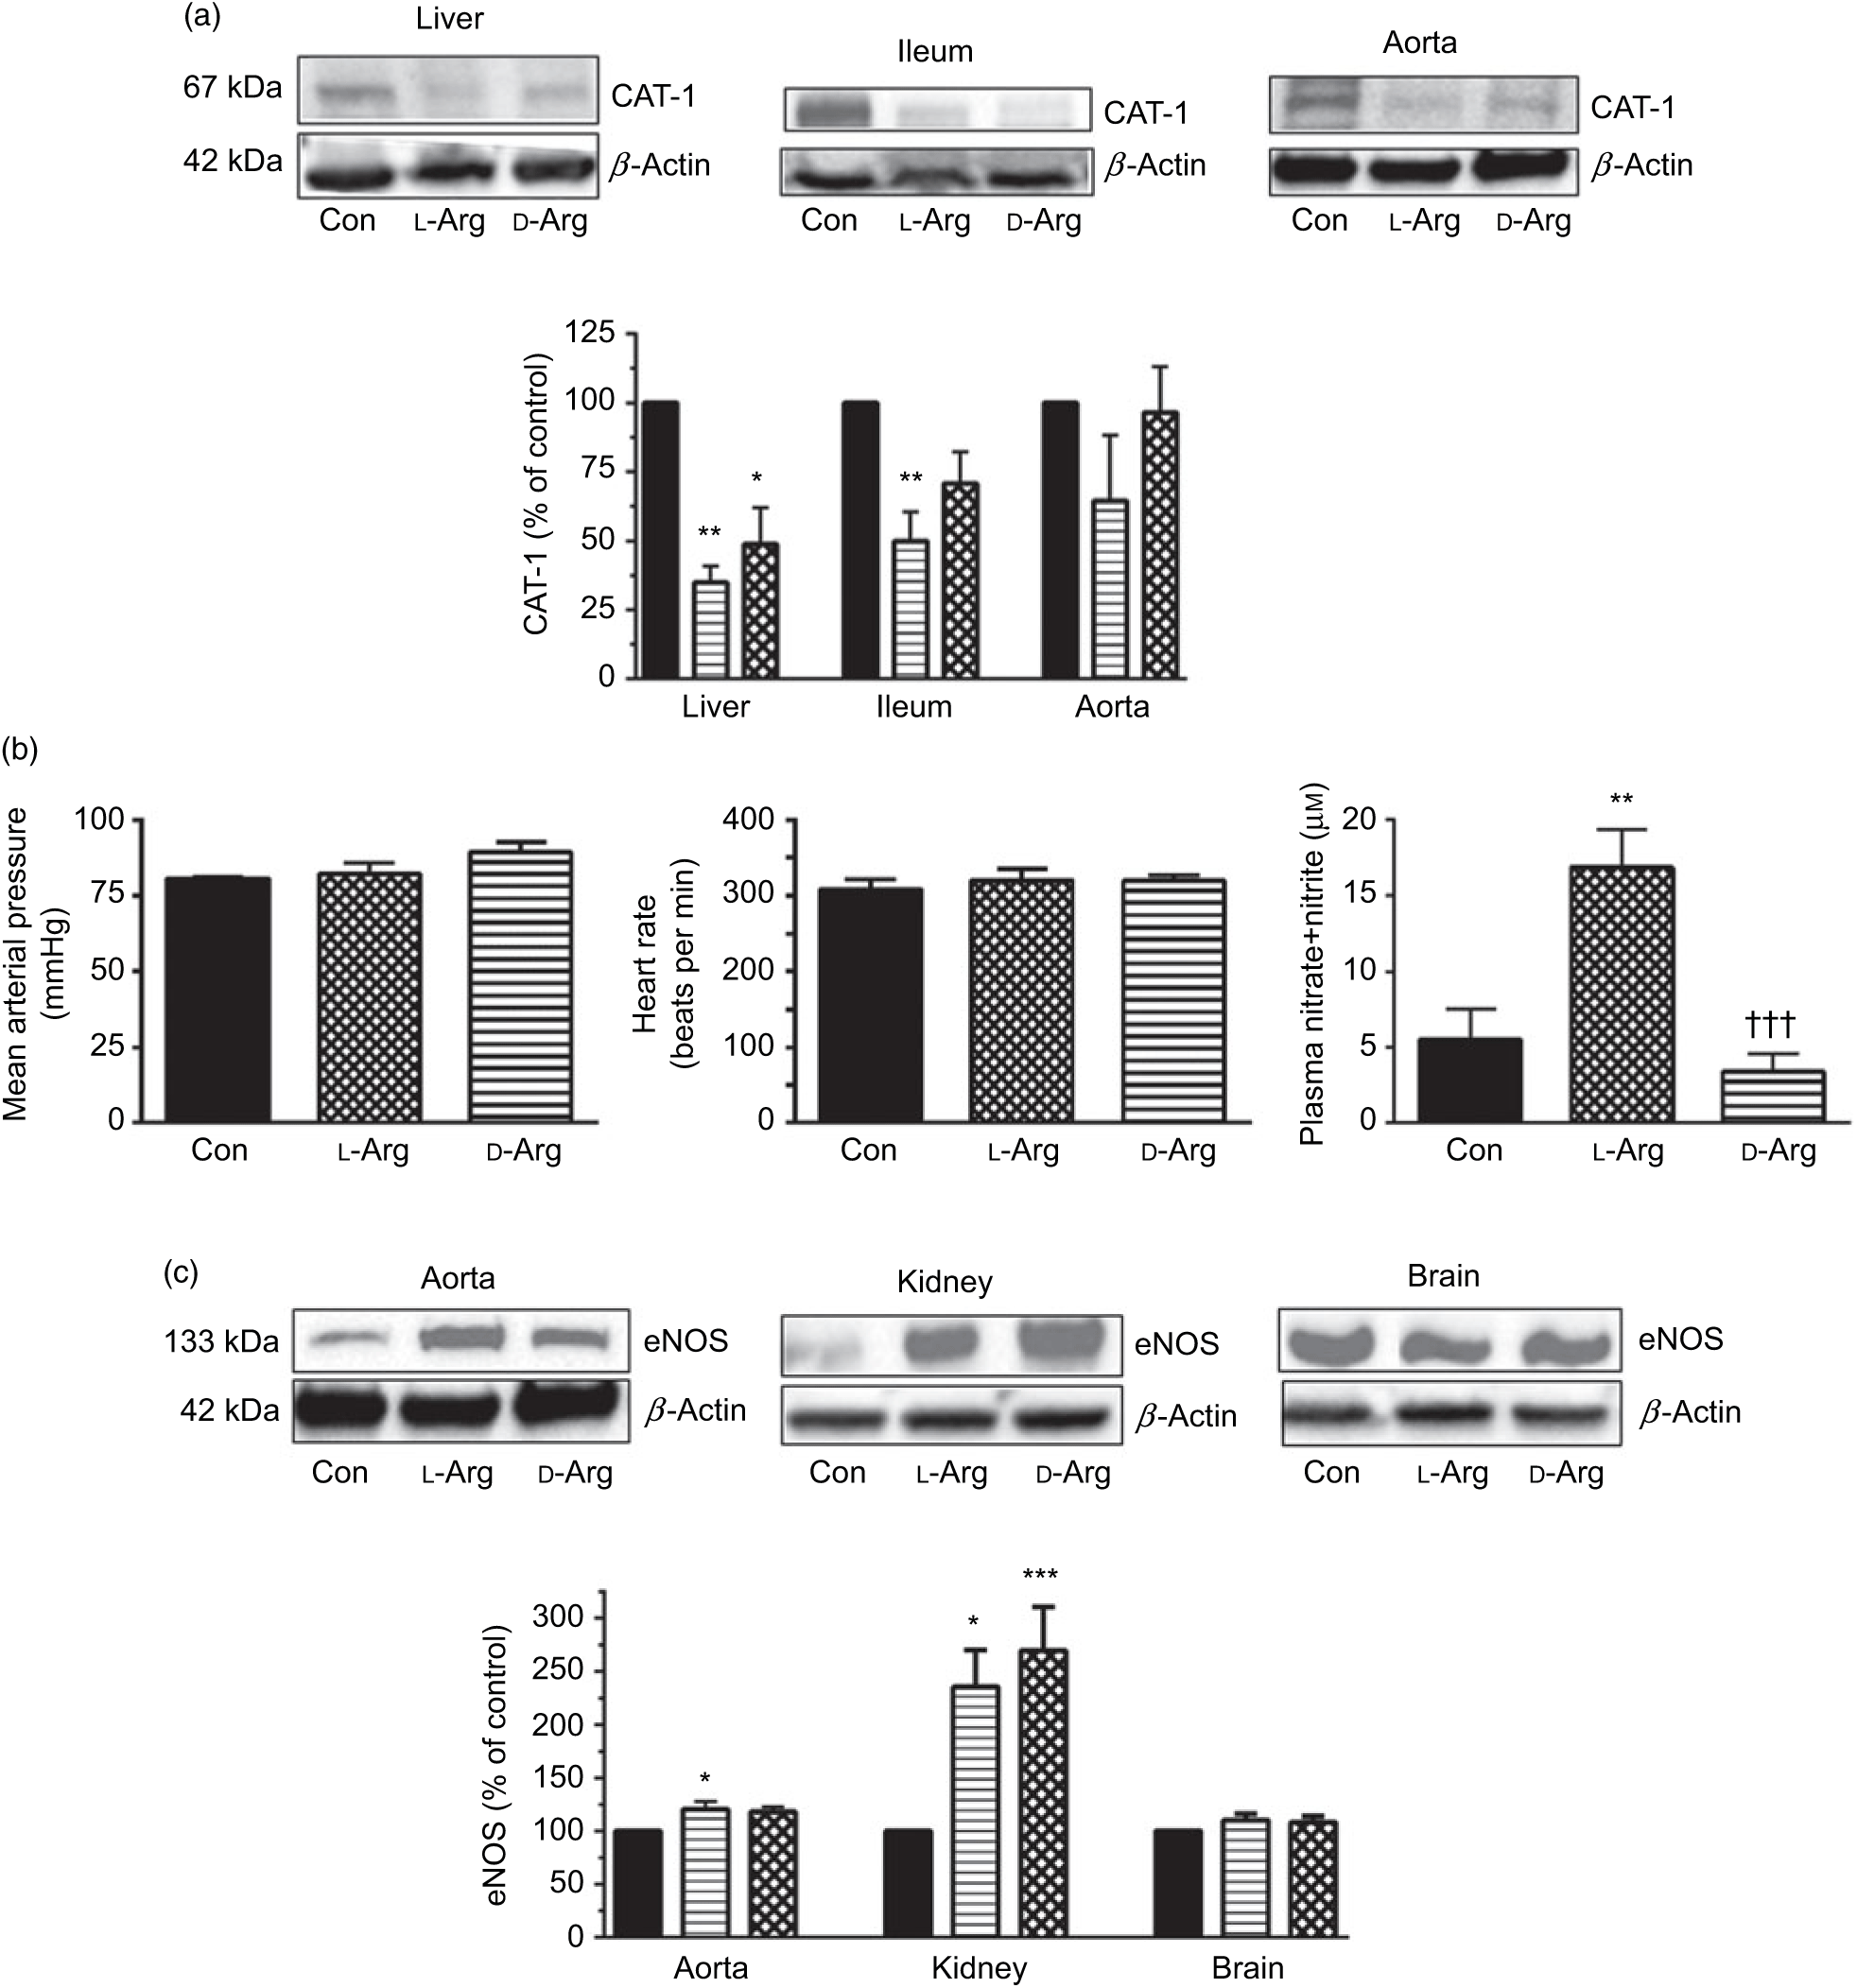
Fig. 1. Oral l-arginine (l-Arg) significantly reduces cationic transporter-1 (CAT-1) expression, increases endothelial nitric oxide synthase (eNOS) expression and plasma nitrite levels but does not affect not mean arterial pressure. Male Sprague–Dawley rats (10 weeks old) were treated with l-Arg or d-arginine (d-Arg) in drinking water (500 mg/kg per d) for 4 weeks. Western blotting was used to determine expression of CAT-1 and eNOS (a, c). The blots were quantified using the GeneTools analysis software. Mean arterial pressure and heart rate were measured in anaesthetised rats with a carotid artery catheter (b). An assay kit with Griess reagent was used to measure nitrate + nitrite levels (b). * P < 0·05, ** P < 0·01, *** P < 0·001 v. respective control (Con); ††† P < 0·001 v. respective l-Arg group. (a) ![]() , Con;
, Con; ![]() , l-Arg;
, l-Arg; ![]() , d-Arg; (c)
, d-Arg; (c) ![]() , Con;
, Con; ![]() , l-Arg;
, l-Arg; ![]() , d-Arg.
, d-Arg.
Effect of oral arginine on mean arterial pressure and the nitric oxide synthase–nitric oxide metabolic pathway
Administration of oral l- or d-Arg did not affect the mean arterial pressure or the heart rate (Fig. 1(b)). However, l-Arg significantly increased eNOS expression in the aorta, and both l- and d-Arg significantly increased eNOS expression in the kidney, compared with the control (Fig. 1(c)). When NOS activity was measured, l- and d-Arg did not affect activity in the aorta, heart, kidney, liver, ileum, brain and the skeletal muscles (Table 1). Surprisingly, only d-Arg increased NOS activity in the lungs compared with the control and l-Arg groups (Table 1). l-Arg also significantly increased nitrite levels in the plasma compared with the control and d-Arg groups (Fig. 1(b)). Nitrite levels in the aorta, kidney, liver, ileum, brain, lungs and skeletal muscles were not affected by l- or d-Arg (Table 1). Interestingly, l-Arg at 1000 mg/kg per d for 12 weeks attenuated the increase in mean arterial pressure in Zucker diabetic fatty (ZDF) rats compared with d-Arg (unpublished results) (Data as mean values with their standard errors in mmHg: Zucker lean control: 98 (sem 4) mmHg (n 5); ZDF control: 118 (sem 4) mmHg (n 4); ZDF + l-Arg: 93 (sem 7) mmHg (n 4); ZDF + d-Arg: 105 (sem 2) mmHg (n 3)).
Effect of oral l- and d-arginine on the arginase–urea metabolic pathway
Oral d-Arg significantly reduced the expression of arginase I in the liver compared with the control (Fig. 2(a)). Both l- and d-Arg significantly reduced the expression of arginase II in the ileum, but not in the kidney, compared with the control group (Fig. 2(a)). The arginase activity in the plasma, liver, kidney and ileum was not affected by either l- or d-Arg (Table 2). l- and d-Arg did not affect urea levels in the plasma, urine, lungs, brain and skeletal muscles as compared with the control (Fig. 2(b)). However, d-Arg, but not l-Arg, significantly increased urea levels in the liver as compared with the control, and the kidney as compared with the control and the l-Arg groups (Fig. 2(b)).
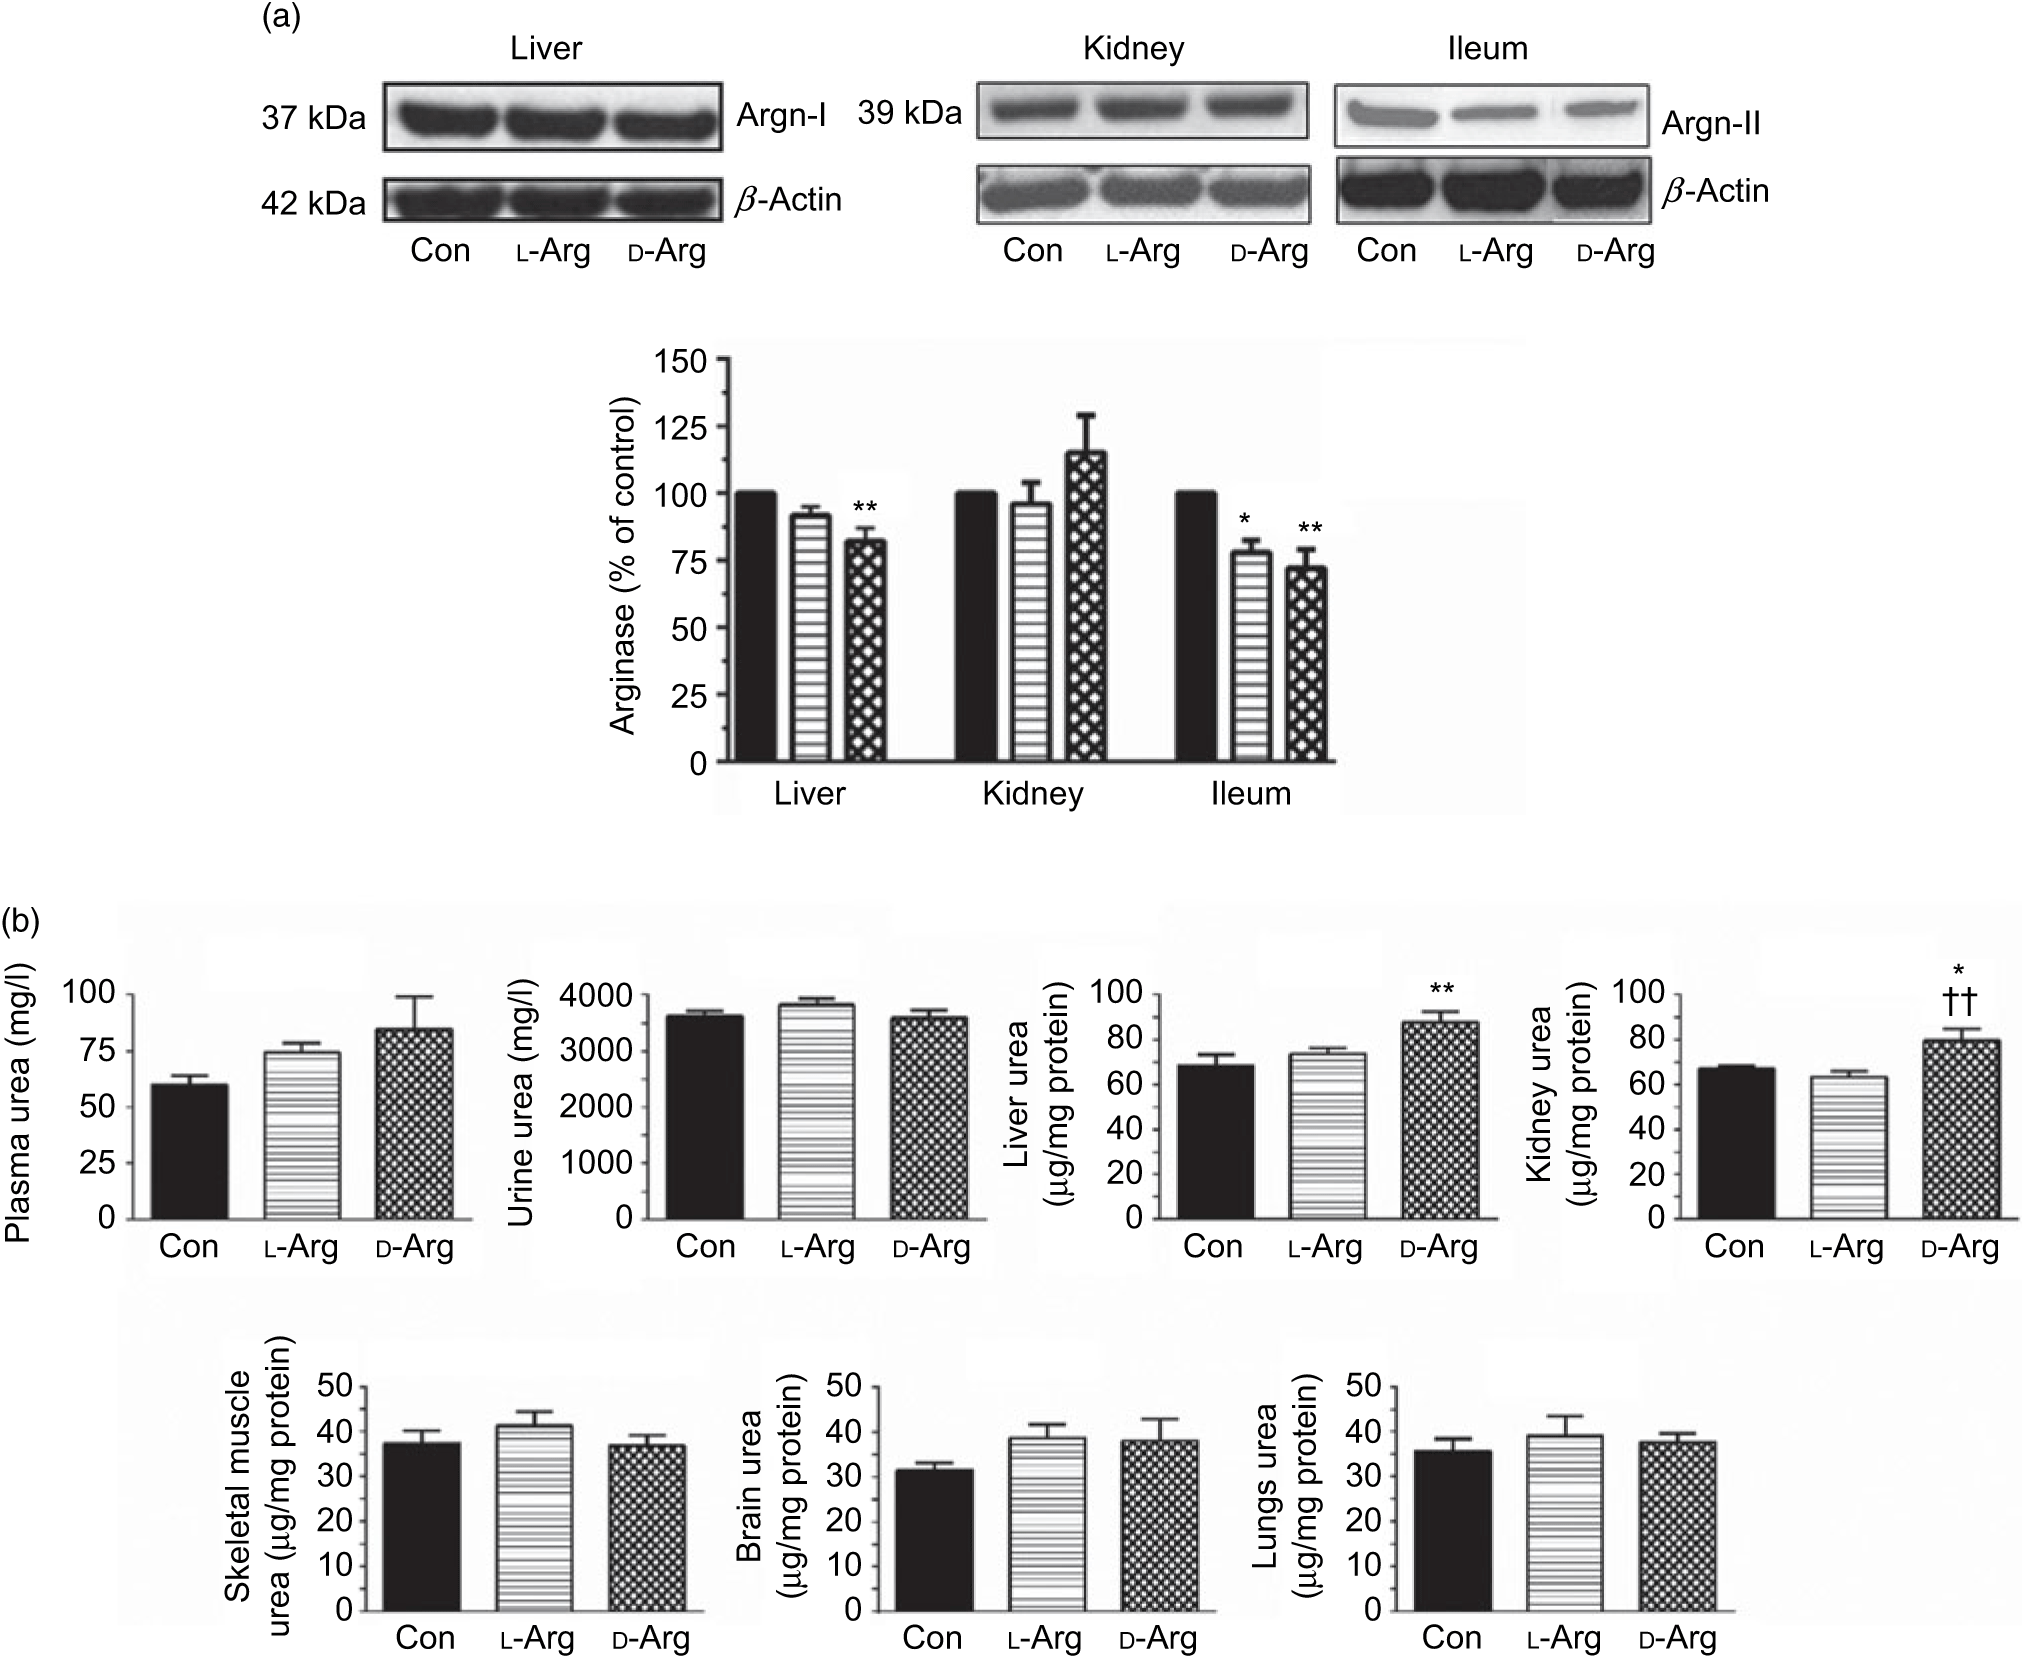
Fig. 2. Effect of oral arginine on arginase (Argn) expression and urea levels. Male Sprague–Dawley rats (10 weeks old) were treated with l-arginine (l-Arg) or d-arginine (d-Arg) in drinking water (500 mg/kg per d) for 4 weeks. Western blotting was used to quantify arginase expression in the liver, kidney and ileum (a). The blots were quantified using the GeneTools analysis software. An assay kit was used to measure urea levels (b). * P < 0·05, ** P < 0·01 v. respective control (Con); †† P < 0·01 v. respective l-Arg group. (a) ![]() , Con;
, Con; ![]() , l-Arg;
, l-Arg; ![]() , d-Arg.
, d-Arg.
Table 2. Effect of oral arginine on arginase activity and arginine decarboxylase protein levels†
(Mean values with their standard errors; n values)

* P < 0·05 v. respective control group.
† Male Sprague–Dawley rats (10 weeks old) were treated with l-arginine or d-arginine in drinking water (500 mg/kg per d) for 4 weeks. An activity assay kit was used to measure arginase activity and an assay kit to measure arginine decarboxylase protein levels.
Oral arginine and the arginine decarboxylase–agmatine metabolic pathway
Oral l-Arg significantly increased the expression of ADC in the liver, but not in the brain, compared with the control group (Fig. 3(a)). On the other hand, d-Arg, but not l-Arg, significantly decreased the expression of agmatinase in the liver, compared with the control (Fig. 3(a)). l-Arg and d-Arg did not affect the expression of agmatinase in the kidney, ileum and the brain (Fig. 3(a)).
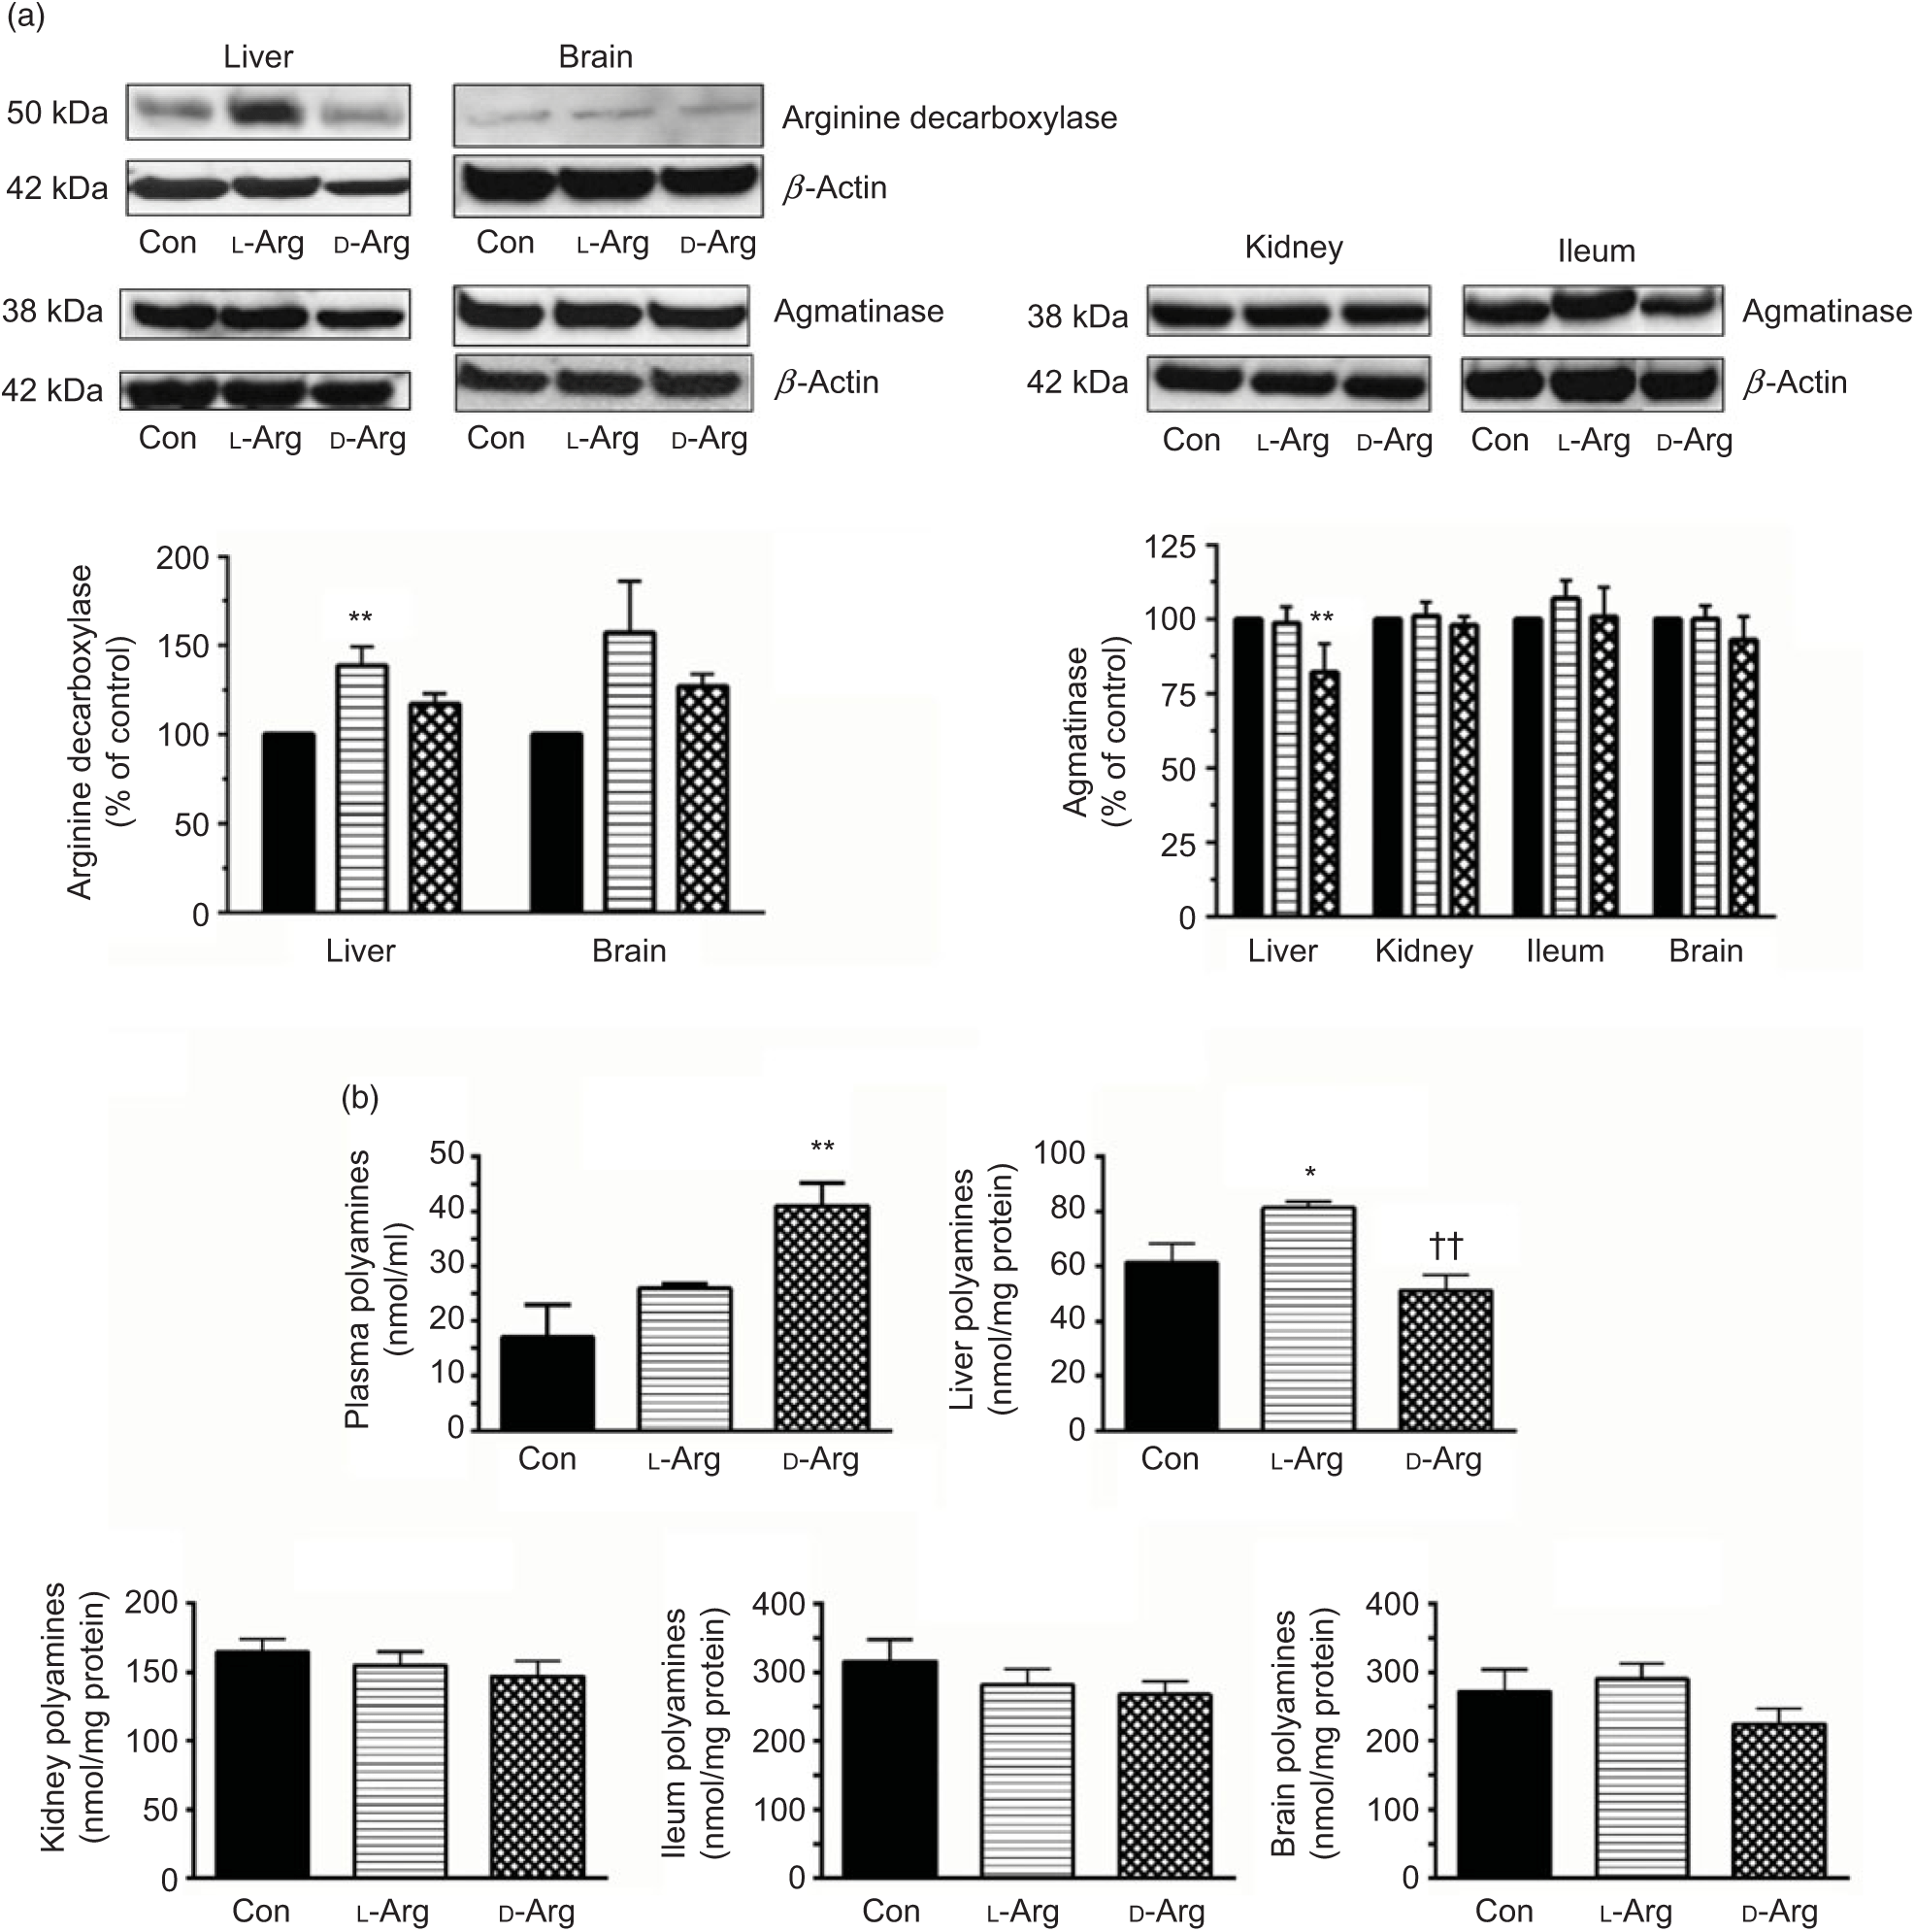
Fig. 3. Effect of oral arginine on arginine decarboxylase and agmatinase expression and polyamines levels. Male Sprague–Dawley rats (10 weeks old) were treated with l-arginine (l-Arg) or d-arginine (d-Arg) in drinking water (500 mg/kg per d) for 4 weeks. Western blotting was used to quantify arginine decarboxylase and agmatinase expression in the liver, kidney, brain and ileum (a). The blots were quantified using the GeneTools analysis software. An assay kit was used to measure polyamine levels (b). * P < 0·05, ** P < 0·01 v. respective control (Con); †† P < 0·01 v. respective l-Arg group. (a) ![]() , Con;
, Con; ![]() , l-Arg;
, l-Arg; ![]() , d-Arg.
, d-Arg.
When ADC protein was measured with an assay kit, both l- and d-Arg did not affect levels in the plasma, liver, kidney and the brain (Table 2). However, d-Arg significantly increased ADC protein in the ileum compared with the control (Table 2).
D-Arg also significantly increased the levels of polyamines in the plasma compared with the control (Fig. 3(b)). In the liver, l-Arg significantly increased polyamines compared with the control and d-Arg decreased it compared with the l-Arg group (Fig. 3(b)). Polyamine levels in the kidney, ileum and brain were not affected by l- and d-Arg (Fig. 3(b)).
Oral arginine and the arginine:glycine amidinotransferase–creatine metabolic pathway
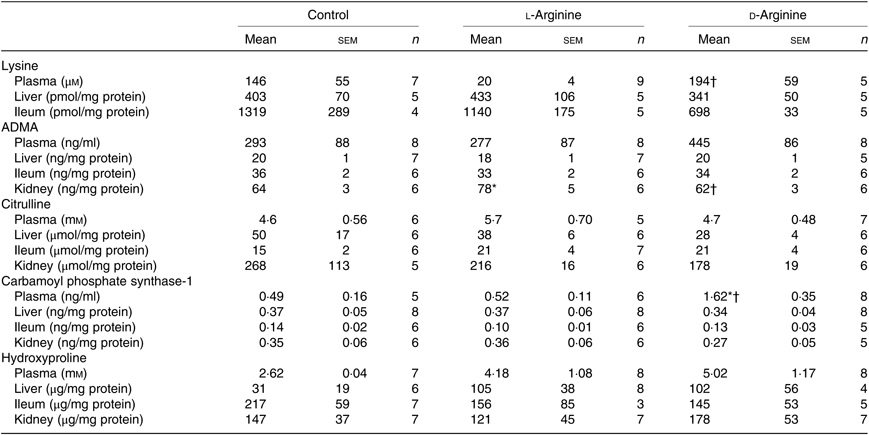
Oral l-Arg significantly decreased the expression of GATM in the liver and the kidney, but not in the ileum and the brain, compared with the control (Fig. 4). On the other hand, d-Arg significantly increased the expression of GATM in the kidney compared with the control and l-Arg groups, but decreased it in the liver compared with the control (Fig. 4). Creatinine, a metabolite of creatine, levels in the plasma, urine kidney and ileum were not affected by l- or d-Arg (Table 3). However, d-Arg significantly increased creatinine levels in the liver compared with the control, whereas l-Arg decreased it in the skeletal muscle compared with the control (Table 3).
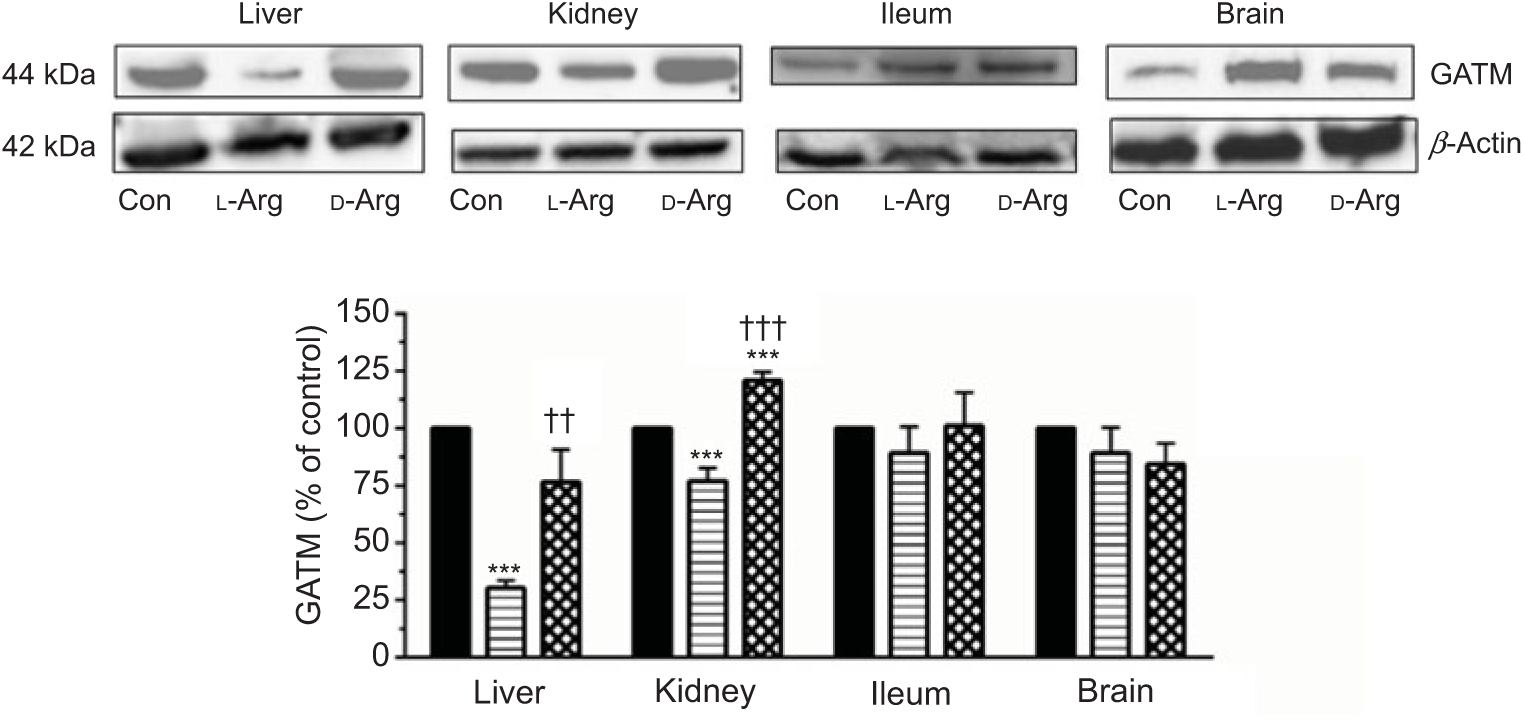
Fig. 4. Effect of oral arginine on arginine:glycine amidinotransferase (GATM) expression. Male Sprague–Dawley rats (10 weeks old) were treated with l-arginine (l-Arg) or d-arginine (d-Arg) in drinking water (500 mg/kg per d) for 4 weeks. Western blotting was used to quantify GATM expression in the liver, kidney, ileum and brain (a). The blots were quantified using the GeneTools analysis software. *** P < 0·01 v. respective control (Con); †† P < 0·01, ††† P < 0·001 v. respective l-Arg group. ![]() , Con;
, Con; ![]() , l-Arg;
, l-Arg; ![]() , d-Arg.
, d-Arg.
Table 3. Effect of oral arginine on creatinine and d-lactate levels†
(Mean values with their standard errors; n values)
* P < 0·05 v. respective control group.
† Male Sprague–Dawley rats (10 weeks old) were treated with l-arginine or d-arginine in drinking water (500 mg/kg per d) for 4 weeks. Assay kits were used to measure creatinine and d-lactate levels.
Effect of oral arginine on the glyoxalase–methylglyoxal–d-lactate metabolic pathway
Both l- and d-Arg significantly decreased the expression of glyoxalase I in the liver and the ileum but not in the kidney, compared with the control (Fig. 5(a)). l-Arg, but not d-Arg, also significantly decreased the expression of glyoxalase I in the brain compared with the control (Fig. 5(a)).
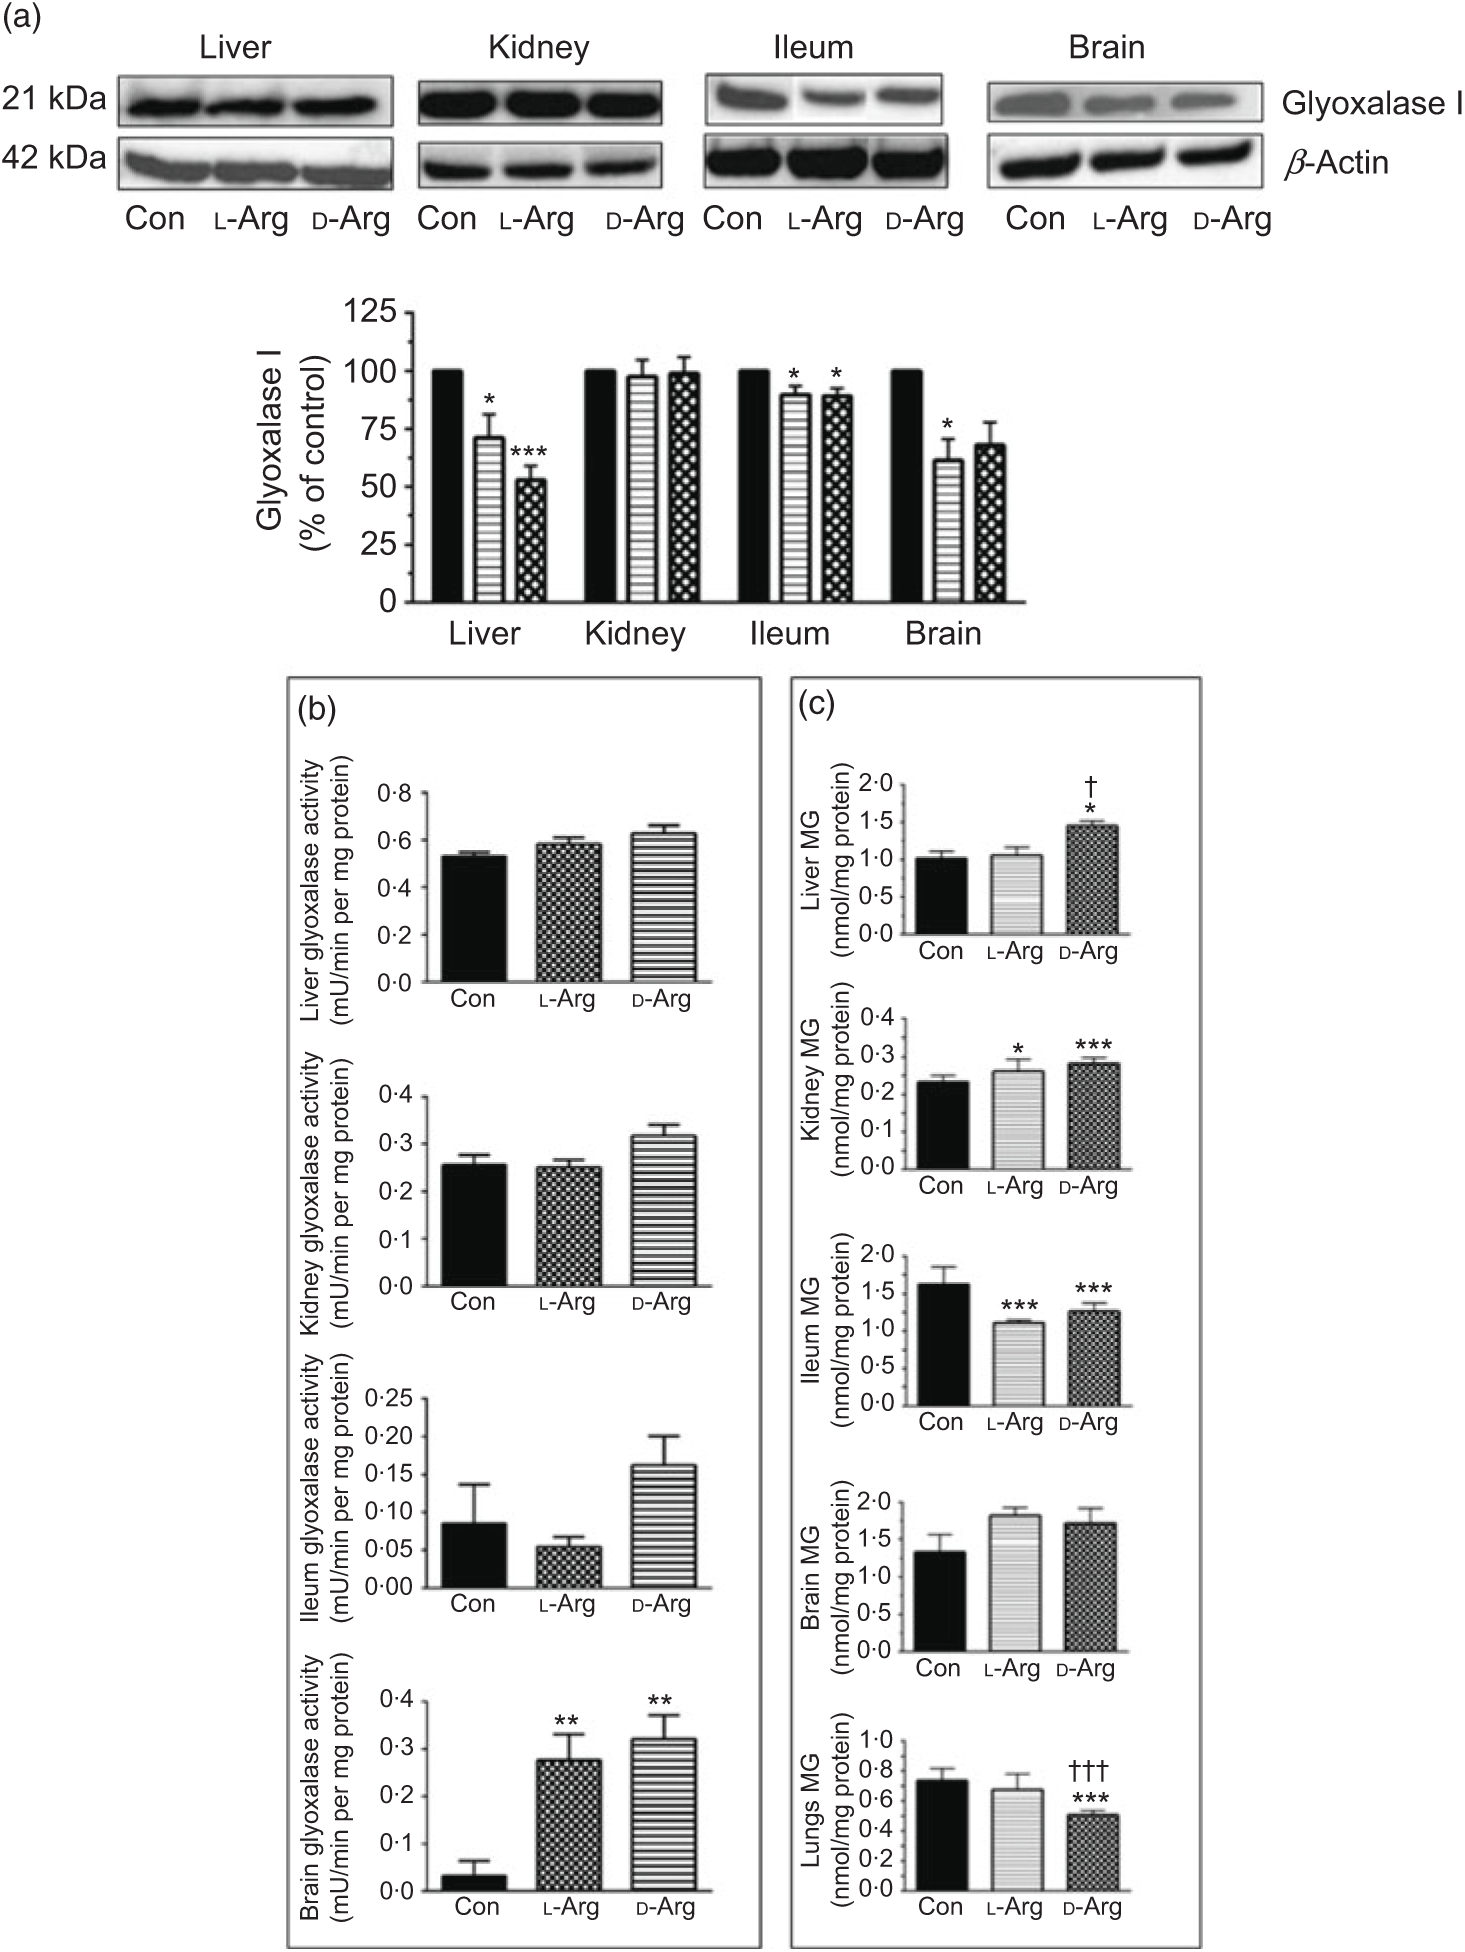
Fig. 5. Effect of oral arginine on glyoxalase I expression and activity and methylglyoxal (MG) levels. Male Sprague–Dawley rats (10 weeks old) were treated with l-arginine (l-Arg) or d-arginine (d-Arg) in drinking water (500 mg/kg per d) for 4 weeks. Western blotting was used to quantify glyoxalase I expression in the liver, kidney, ileum and brain (a). The blots were quantified using the GeneTools analysis software. An activity assay kit was used to measure glyoxalase activity (b) and HPLC to measure MG levels (c). * P < 0·05, ** P < 0·01, *** P<0·001 v. respective control (Con); † P < 0·05, ††† P < 0·001 v. respective l-Arg group. (a) ![]() , Con;
, Con; ![]() , l-Arg;
, l-Arg; ![]() , d-Arg.
, d-Arg.
L- and d-Arg significantly increased the activity of glyoxalase in the brain, but not in the liver, kidney or the ileum, when compared with the control (Fig. 5(b)).
Both, l- and d-Arg significantly increased MG levels in the kidney and decreased them in the ileum, compared with the control (Fig. 5(c)). On the other hand, d-Arg significantly increased MG levels in the liver and decreased them in the lungs, compared with the control and l-Arg groups (Fig. 5(c)). MG levels in the brain were not affected by l- and d-Arg (Fig. 5(c)).
L-Arg, but not d-Arg, significantly increased d-lactate levels in the plasma compared with the control and significantly decreased them in the brain (Table 3). d-Arg significantly increased d-lactate levels in the kidney compared with the control (Table 3). d-lactate levels in the urine, liver and ileum were not affected by l- or d-Arg (Table 3).
Effect of oral arginine on lysine, asymmetric dimethyl arginine, citrulline, carbamoyl phosphate synthase-1 and hydroxyproline levels
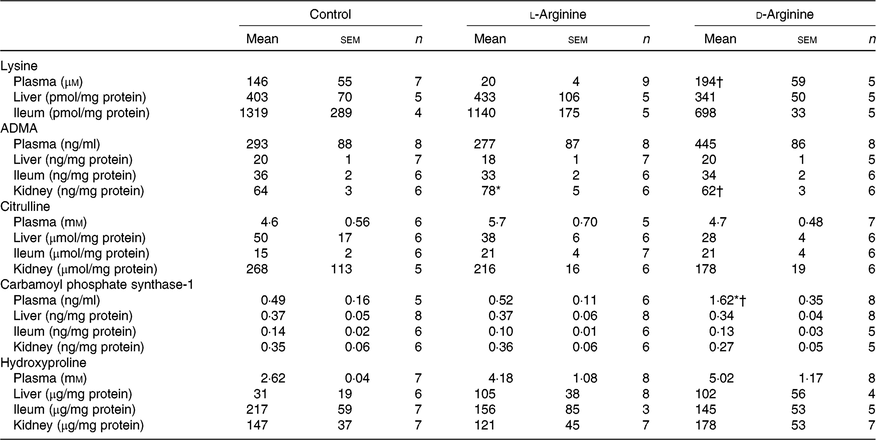
Plasma lysine levels were significantly lower in the l-Arg group compared with the d-Arg group (Table 4). Oral l-Arg or d-Arg did not affect lysine levels in the liver or the ileum (Table 4). Asymmetric dimethyl arginine (ADMA) levels in the kidney were significantly higher in the l-Arg compared with the control and d-Arg groups (Table 4). ADMA levels in the plasma, liver and ileum were not different from each other in the three groups. l-Arg or d-Arg did not affect citrulline levels in the plasma, liver, ileum or the kidney (Table 4). Carbamoyl phosphate synthase-1 levels were significantly elevated in the d-Arg group compared with the control and l-Arg groups (Table 4). Finally, hydroxyproline levels were not affected in the plasma, liver, ileum or the kidney, either by l-Arg or d-Arg (Table 4)
Table 4. Effect of oral arginine on lysine, asymmetric dimethyl arginine (ADMA), citrulline, carbamoyl phosphate-1 and hydroxyproline levels‡
(Mean values with their standard errors; n values)
* P < 0·05 v. respective control group.
† P < 0·05 v. respective l-arginine group.
‡ Male Sprague–Dawley rats (10 weeks old) were treated with l-arginine or d-arginine in drinking water (500 mg/kg per d) for 4 weeks. Assay kits were used to measure lysine, ADMA, citrulline, carbamoyl-phosphate-1 and hydroxyproline levels.
Discussion
We report the metabolic effects of l-Arg and d-Arg administered for 4 weeks to Sprague–Dawley rats. Our comprehensive study reveals some novel and unusual findings with both isomers and will form the basis of the second phase of our study with a higher oral dose for a longer period. Both l- and d-Arg did not affect the normal plasma and organ levels of arginine as shown in Fig. 1(a). This is not surprising considering the fact that up to 40 % of oral arginine is metabolised in the intestines before it reaches the systemic circulation(Reference Castillo, Chapman and Sanchez30). The liver and the intestines have large amounts of arginase which is the major enzyme that uses arginine as a substrate(Reference Morris31). Moreover, these arginases, possibly from erythrocytes, are also present in the plasma and as soon as arginine enters the circulation it may be getting metabolised. Also, arginine from the plasma would also be utilised by different organs and may not show elevated levels most of the time, except maybe within 15–30 min after absorption. Also, the plasma peaks after absorption would be smaller when arginine is given in drinking water rather than as a single large oral dose. Our plasma collection was at least 30 min after anaesthesia so plasma peaks from oral absorption would have subsided. Another reason for no change in plasma arginine could be the significant down-regulation of CAT-1 in the ileum and the liver (Fig. 1(a)), which plays a role in arginine transport from the intestines(Reference Closs, Simon and Vekony32). This down-regulation of the transporter could be an adaptive response to deal with excess oral arginine. This also supports the observation that a deficiency of arginine has the opposite effect, that is, it up-regulates the CAT-1 gene and mRNA(Reference Fernandez, Lopez and Wang33). Since CAT-1 is a non-specific transporter, which also transports lysine(Reference Closs, Simon and Vekony32), our results showing significantly reduced plasma lysine in the l-Arg group compared with the d-Arg group (Table 4) support reduced transport by CAT-1. Reduced levels of the essential amino acid lysine, if reproduced in our next phase study with a 1000 mg dose of l-Arg will be of concern. Similarly, glutamine transport and levels might also have been affected by oral arginine. One possible way to determine reduced absorption of oral arginine supplements would be to measure faecal arginine, which has been added to the protocol in the next phase of our study. Determination of glutamine levels will also be useful to support this.
One of the most popular metabolic pathways for which oral supplements are used is the NOS–NO pathway. As shown in Fig. 1(b), both l- and d-Arg did not affect the mean arterial pressure or the heart rate. This supports the finding that oral arginine supplements do not lower blood pressure in healthy humans(Reference Ast, Cieslewicz and Korzeniowska14), but may do so in some disease conditions in animals and humans(Reference Dong, Qin and Zhang13) (also supported by our unpublished results in ZDF rats). At the same time, we found significantly increased eNOS expression by l-Arg in the aorta and the kidney (Fig. 1(c)). This could be an adaptive response to increased substrate availability. The unusual finding here is that d-Arg also significantly increased eNOS expression in the kidney. d-Arg is not a substrate for the enzyme, and this perplexing finding requires further study and will be keenly observed in our second phase study with a higher dose. An increase in eNOS expression in the rabbit aorta by arginine supplements has been reported(Reference Javanmard, Nematbakhsh and Mahmoodi34). The NOS activity in all the organs tested was not affected by l- or d-Arg, except in the lungs, where again unusually it was d-Arg that significantly increased it (Table 1). We do not wish to speculate on this finding but will see if it repeats with a higher dose in our second phase study. Whereas the eNOS expression in the aorta and kidney increased, there was no change in eNOS activity, which was matched by no increase in nitrates/nitrites. Such disparity between eNOS expression and activity has been observed before by Mohan et al. (Reference Mohan, Wu and Shin35) when exposure of cultured human endothelial cells to 50 µm arginine increased eNOS activity but not protein or mRNA expression. When samples are prepared for enzyme activity assays, they are subject to several changes in their milieu despite strictly following protocols and that may adversely affect their activity. Others have also shown that oral l-Arg supplements do not affect eNOS activity in human subjects(Reference Alvares, Meirelles and Bhambhani10,Reference Bennett-Richards, Kattenhorn and Donald19,Reference Alvares, Conte-Junior and Silva21) . l-Arg significantly increased and d-Arg decreased plasma levels of nitrite (Table 1) but not in the organs tested including the aorta. The increase in plasma nitrite can be explained on the basis of the arginine paradox(Reference Shin, Mohan and Fung36–Reference Dioguardi38) wherein it is believed that the caveolar eNOS in endothelial cells has easier access to plasma arginine due to co-localisation with CAT-1 in the caveoli(Reference Closs, Simon and Vekony32). Rapid utilisation of plasma arginine by eNOS and other enzymes such as arginases can also explain no change in plasma arginine levels (Table 1). Moreover, if most of the NO formed by caveolar eNOS is diffusing into the plasma rather than to the vascular smooth muscle, this can explain why there is no change in the mean arterial pressure.
The arginase–urea pathway is the major one which uses arginine as a substrate, yet any possible effect of oral supplements on this pathway is not normally known to the general public. We found that d-Arg, but not l-Arg, significantly reduced the expression of arginase I in the liver, whereas both l- and d-Arg reduced its expression in the ileum (Fig. 2(a)). Arginases have been reported to use 40 % of the dietary arginine, which can explain significantly reduced absorption of oral arginine(Reference Castillo, Chapman and Yu39,Reference Wu, Hou and Hu40) . Moretto et al.(Reference Moretto, Guglielmetti and Tournier-Nappey22) found no change in liver arginase expression in rats with 2·25 % arginine (1·12 g with an assumed daily 50 ml water intake) supplementation in drinking water. Arginine supplements would be expected to increase arginase expression, based on increased substrate-increased enzyme concept, but we saw the opposite with the liver and ileum arginases. Findings from our study with 1000 mg arginine for 16 weeks, which is currently underway, will help us to make a more definite interpretation. The effect of d-Arg on arginase II in the ileum and arginase I in the liver is unexpected and along with its effect on other enzymes that use l-Arg demands further studies to see whether it competes with endogenous l-Arg for these enzymes as an inhibitor, an idea which we also treat with skepticism. Moretto et al.(Reference Moretto, Guglielmetti and Tournier-Nappey22) have reported a decrease in arginase activity in Wistar rats given chronic l-Arg supplements. The lack of effect of l- and d-Arg on kidney arginase II may possibly be due to not enough arginine reaching the kidney. l- and d-Arg did not affect arginase activity in the plasma, liver, ileum and kidney (Table 2). Even though l-Arg decreased arginase II expression in the ileum (Fig. 2(a)), there was no change in activity (Table 2). We have previously seen a mismatch between arginase expression and its activity in cultured human umbilical vein endothelial cells and also in rat vascular smooth muscle cells treated with high glucose and high glucose + l-Arg or d-Arg, where high glucose increased expression more than glucose plus l-Arg or d-Arg, but activity was significantly more in high glucose plus l-Arg or d-Arg groups than in high glucose alone group(Reference Dhar, Dhar and Wu23). A similar mismatch between arginase expression and its activity was observed in several organs by Moretto et al.(Reference Moretto, Guglielmetti and Tournier-Nappey22). For example, in the brain, they found that l-Arg supplements increased arginase II expression but the activity was unchanged(Reference Moretto, Guglielmetti and Tournier-Nappey22). Thus, arginase I and II seem to have differential regulation not only from each other but also from organ to organ. l- and d-Arg did not affect the urea levels in the plasma, urine and organs such as the liver, lungs, brain and skeletal muscles. Unusually, one more time, d-Arg increased urea levels in the kidney (Fig. 2(b)) even though there was no effect on arginase II expression (Fig. 2(a)). The increase in urea levels by d-Arg only in the kidney, with no change in arginase activity, can be explained by a compensatory reduced expression of hepatic arginase and a possible, but unproven, increased hepatic glutamine synthesis and elimination of ammonia. It should be pointed out that arginine is believed to exist in separate pools within the cells and different pools contribute to the function of different enzymes. Thus, it has been shown that metabolites produced and used by the urea cycle enzymes are recycled and this includes arginine which is synthesised and used within this cycle and is not influenced by exogenous arginine or free arginine within the cytosol(Reference Morris9,Reference Cheung, Cohen and Raijman41) . This may be a reason why we did not see any changes in carbamoyl phosphate synthase 1 or citrulline levels in the liver, ileum and kidney in l-Arg and d-Arg groups (Table 4). Since citrulline is also a product of NOS enzymes, any changes in citrulline levels in any organ become useful parameters of changes in NOS or arginase activity. We do not have any explanation for the significantly increased carbamoyl phosphate synthase 1 levels in the plasma in the d-Arg group. We will see if we get a similar result in the next phase of our study with a higher oral dose of arginine administered for a longer period in Sprague–Dawley rats.
The ADC and agmatinase enzymes produce agmatine from l-Arg(Reference Li, Regunathan and Barrow8,Reference Morris9) . l-Arg significantly increased ADC expression in the liver, but not in the brain, possibly due to increased substrate availability during first pass through the liver after absorption (Fig. 3(a)). Arginine decarboxylase levels measured by an ELISA kit did not show significant changes in the expression of the enzyme in the liver (Table 2). One possible reason could be that the ELISA depends on enzymatic activity which might have altered in the assay conditions. d-Arg also decreased agmatinase expression in the liver (Fig. 3(a)) adding to the growing list of unexpected effects of oral d-Arg. l-Arg did not affect agmatinase levels (Fig. 3(a)). We could not analyse agmatine levels reproducibly with HPLC, but when we analysed polyamines, which are downstream products of agmatine as well as ornithine, we found significant increase by l-Arg in the liver (Fig. 3(b)), which can be explained by the increased expression of ADC (Fig. 3(a)). Ornithine generated from arginase is also a source of polyamines, but arginase expression in the liver was not increased by l-Arg in our study. The increase in plasma polyamine levels by d-Arg (Fig. 3(b)) cannot be explained and will be observed closely in our second phase higher dose study. The significant increase in liver polyamines could be a cause for concern due to their role in cell proliferation and tumour development(Reference Morris1). Since ornithine is also a precursor for proline synthesis(Reference Morris1), we measured hydroxyproline levels (Table 4). Although the levels were not significantly different between the three groups in the plasma, liver, ileum and kidney, the levels in the l-Arg and d-Arg groups showed a trend towards increase in the plasma and the liver. Due to large variability, the differences did not reach significance. Due to the role of proline in collagen synthesis, any changes in proline levels are of interest from the point of view of wound and tissue repair.
l-Arg caused a significant decrease in the expression of GATM in the liver and the kidney, but the creatinine levels were not affected (Fig. 4, Table 3), whereas d-Arg caused a significant increase in the kidney (Fig. 4). d-Arg significantly increased creatinine levels in the liver (Table 3) which is beyond explanation at this stage and requires further studies with cultured cells.
We have shown earlier that l-Arg and d-Arg are MG scavengers(Reference Dhar, Dhar and Wu23), and MG is mostly degraded by the glyoxalase enzymes to produce the inert d-lactate(Reference Desai and Wu42). l-Arg significantly decreased the expression of glyoxalase I in the liver, ileum and the brain (Fig. 5(a)). The activity was significantly increased by l- and d-Arg in the brain (Fig. 5(b)). The change in expression of glyoxalase I in the liver, ileum and the brain was not matched by a corresponding change in their activities in these organs (Fig. 5). A similar mismatch between expression and activities of glyoxalase I was reported by Kuhla et al.(Reference Kuhla, Boeck and Schmidt43). They attributed it to several possible post-translational influences, such as phosphorylation of the enzyme by cytokines, during in vitro activity assay, which seems a reasonable explanation for the mismatch we also observed. d-Arg significantly increased MG levels in the liver, but decreased it in the lungs (Fig. 5(c)). Both l- and d-Arg increased MG levels in the kidney but decreased it in the ileum (Fig. 5(c)). l-Arg increased d-lactate levels in the plasma but decreased them in the brain, whereas d-Arg increased them in the kidney (Table 3). Since the ileum is likely to receive most of the orally absorbed arginine and since both l- and d-Arg can scavenge MG(Reference Dhar, Dhar and Wu23), it explains the significant decrease of MG caused by both isomers in the ileum (Fig. 5(c)). This decrease in MG by both isomers might also explain the decreased expression of glyoxalase I in the ileum (Fig. 5(a)), which is the primary catabolic enzyme for MG(Reference Desai and Wu42). The decrease in glyoxalase I expression in the liver caused by l- and d-Arg without any change in activity or d-lactate levels is difficult to explain (Fig. 5, Table 3). Little is known about intracellular production of MG in different organs and whether it is transported out of the cell which makes it difficult to explain or predict its interaction with different arginine pools.
ADMA levels in the plasma, liver or ileum were not affected by oral l-Arg or d-Arg (Table 4); however, the ADMA levels in the kidney were significantly higher in the l-Arg group (Table 4). It is possible that guanidinoacetate methyltransferase might have contributed to ADMA synthesis from l-Arg(Reference Kayacelebi, Langen and Weigt-Usinger44) in the kidney, which has high activity of this enzyme(Reference Van Pilsum, Stephens and Taylor7). It has been shown that free l-Arg in the plasma can be metabolised to ADMA(Reference Kayacelebi, Langen and Weigt-Usinger44) but we did not see any change in plasma ADMA levels. ADMA levels are of interest because of their ability to inhibit NOS enzymes and cause dysfunction(Reference Leiper and Vallance45).
The dose of 500 mg/kg per d used in our study converts to an equivalent dose of about 81 mg/kg per d for humans (approximately 5·6 g for a 70 kg adult), according to the FDA conversion guide(46). Thus, the dose used by us is relatively small for human equivalent dose. Wu et al.(Reference Wu, Hou and Hu40) reported the use of 1·8 kg/d (human equivalent dose of 20 g/d for a 70 kg adult) of arginine base oral supplementation for 91 d in female rats to be safe. In another study, Yang et al.(Reference Yang, Wu and Jia47) used doses of 1·8 and 3·6 g/kg per d (equivalent human dose of 40 g/d for a 70 kg adult) of l-Arg HCl in rats in drinking water for 13 weeks. They reported changes in levels ornithine, proline, homoarginine, urea and NO metabolites and also GATM activity in the kidneys, and yet they concluded that it was a safe dose in rats. Doses of 6–9 g/d for periods ranging from 21 d to 18 months have been used in human studies without any remarkable adverse effects(Reference McNeal, Meininger and Reddy48). McNeal et al.(Reference McNeal, Meininger and Reddy48) report a dose of about 20 g/d as safe in humans. A meta analysis of eleven trials on the effect of arginine supplements on blood pressure used arginine doses ranging from 4 to 24 g/d in humans for periods ranging from 2 to 24 weeks(Reference Dong, Qin and Zhang13).
In conclusion, our data reveal significant impacts on several enzymes and metabolites in different organs that use l-Arg as a substrate. The effects on enzymes and their metabolites do not appear to follow a pattern, which is perplexing, but support mismatched effects, reported by Moretto et al.(Reference Moretto, Guglielmetti and Tournier-Nappey22), on arginase activity and expression in different organs by oral arginine. The mismatched effects also support the proposal that l-Arg is highly compartmentalised for different enzymes in different organs(Reference Morris9,Reference Simon, Plies and Habermeier37) . The inclusion of d-Arg in our studies discloses some unexpected and novel effects and emphasises more dynamic enzyme-substrate kinetics for arginine metabolic pathways than that currently known. The arginine metabolic pathways in the ileum and the liver undergo most changes and can be explained by exposure to larger amounts of orally absorbed arginine. The oral route chosen by us also makes our results relevant to the use of oral arginine as a nutrient, especially as an ergogenic aid. Even with this low dose and only 4 weeks of treatment, we observed changes in the expression of enzymes such as arginase and ADC, and levels of other parameters and we hesitate to say that an equivalent human dose of about 5·6 g/d is safe. Arginase is an important enzyme that utilises the majority of dietary and supplemental arginine and maybe stealing NO from NOS enzymes(Reference Morris31,Reference Dioguardi38) . We will be able to make a more definitive statement about safety and effectiveness following our studies with 500 mg/kg per d for 16 weeks and 1000 mg/kg per d for 16 weeks in rats, which are currently underway. Thus, our data make a significant contribution to the knowledge regarding the impact of oral arginine supplements and will go towards building a scientific basis on its safety and effective use.
Acknowledgements
We acknowledge the advice provided by Dr George Katselis and Dr Stan Bardal. We are grateful for the support provided by the vivarium staff.
This work was funded by a Discovery grant from Natural Sciences and Engineering Council of Canada (NSERC, grant no. RGPIN-2016-03951).
S. M. was supported by a College of Medicine graduate award (ComGRAD) for 2 years.
K. D. developed original research idea and protocols, helped with in vivo experiments and bioassays, analysed data and edited the manuscript. S. M. carried out the experiments, analysed data and wrote the first draft of the manuscript.
All authors have no conflicts of interest.


