The intestinal epithelium is the largest mucosal surface in the human body, and is constantly exposed to potentially toxic environmental antigens, pathogenic food and water-borne micro-organisms and commensal microflora( Reference Baumann, Park and Mantisa 1 ). Dietary approaches to influence human gut have long been used as an approach to improve host health( Reference Walton, Lu and Trogh 2 ). Indigestible carbohydrates have beneficial effects in human health and nutrition( Reference Velez, Castillo and Mesón 3 ). Human digestive enzymes have little or no effect on carbohydrates such as fructo-oligosaccharides (FOS) and polydextrose (PDX). These substances are digested by colonic bacteria with the production of organic acids, mainly SCFA and gas (CO2 and hydrogen). Small amounts of lactic, formic and succinic acids are also produced( Reference Mitsuoka 4 ). These health effects include immune regulation, normalization of blood glucose and insulin levels, and prevention of cancer recurrence( Reference Kumar, Sinha and Makkar 5 ). Many indigestible carbohydrates influence aspects of intestinal function through fermentation( Reference Nakamura, Nosaka and Suzuki 6 ).
The use of indigestible carbohydrates results in increased IgA levels in the caecal digesta and faeces of animals( Reference Peuranen, Tiihonen and Apajalahti 7 – Reference Gourbeyre, Desbuards and Grémy 11 ). In human subjects, IgA is the most abundant Ig isotype in the body in the absence of infection. It is synthesized mainly in the secretory form in gut-associated lymphoid tissues. Secretory IgA (sIgA) prevents pathogens and commensal bacteria from binding to the epithelial cells of the mucosa and neutralizes their toxins to maintain homeostasis at mucosal surfaces( Reference Tezuka, Abe and Asano 12 ). The polymeric Ig receptor (pIgR), also known as membrane secretory component, is an integral membrane protein expressed by intestinal epithelial cells. The physiological role of pIgR is to bind and transport J-chain-containing dimeric/polymeric IgA or polymeric IgM antibodies across the intestinal epithelial cell layer, and to protect them from proteolytic degradation in the secretions( Reference Norderhaug, Johansen and Schjerven 13 ). Furthermore, pIgR expression is increased by FOS in the intestines of infant mice( Reference Nakamura, Nosaka and Suzuki 6 , Reference Nakamura, Terahara and Iwamoto 14 ). Thus, IgA and pIgR play a very important role in intestinal immunity influenced by indigestible carbohydrates.
The oral cavity is protected by the mucosal immune system( Reference Yasui, Nagaoka and Miyake 8 ). The most important antibody class present in saliva is sIgA, which is produced as dimeric IgA by local plasma cells in the stroma of salivary glands, and is transported through the secretory epithelia by the pIgR( Reference Delgado, Thomé and Gabriel 15 ). Salivary sIgA plays a crucial role in mucosal immune function, and is the first line of defence in the gastrointestinal tract( Reference Kotanil, Shinkai and Okamatsu 16 ). Rounds of heavy exercise depress salivary sIgA secretion, which results in an increased risk of infection, such as upper respiratory tract infection( Reference Otsuki, Shimizu and Iemitsu 17 , Reference Walsh, Gleeson and Shephard 18 ). Children with no detectable IgA in their serum or whole saliva have been found to develop frequent bronchopulmonary infections, bronchial asthma, gastrointestinal allergy, and other conditions( Reference Ostergaard 19 ). IgA plays important roles in the health of the oral cavity and upper respiratory tract. However, there are no reports regarding the relationship between IgA and pIgR and indigestible carbohydrates in the salivary gland to our knowledge.
In the present study, we focused on indigestible carbohydrates, which can increase IgA concentrations in the intestinal tract( Reference Walton, Lu and Trogh 2 , Reference Velez, Castillo and Mesón 3 , Reference Nakamura, Nosaka and Suzuki 6 , Reference Scalabrin, Mitmesser and Welling 20 – Reference Gouveia, Silva and Nakazato 23 ). We hypothesized that indigestible carbohydrates may increase IgA expression not only in the intestinal tract but also in the salivary gland. Therefore, we examined alteration of IgA content in the salivary gland tissue and saliva. In addition, the pIgR expression level was investigated in the salivary gland.
Materials and methods
Animals
Male Wistar rats (4 weeks old) were purchased from Japan CLEA and housed in wire mesh cages without bedding material, under controlled temperature (22 ± 3°C) and a 12 h light–12 h dark cycle. The rats had free access to a commercial diet (CE-2; Japan CLEA) and water for 7 d before starting the experiment. The experimental protocol used in this study was reviewed and approved by the Ethics Committee for Animal Experiments of Kanagawa Dental University (approval number 20130613) and was performed in accordance with the Guidelines for Animal Experimentation of Kanagawa Dental University and the ARRIVE guidelines for reporting animal research. In total, fifteen rats were used in Expt 1 and were randomly divided into three groups (see next paragraph on ‘Diets’). One cage held two or three rats. In Expt 2, eighteen rats were used and divided into three groups at random. For this experiment, three rats were kept in each cage. We maintained the rats in each group under the same conditions other than diet during the experiment period, and no rats died during the experiment. The rats had free access to diet and water. All rats were killed between 07.00 and 11.00 hours; they were first anaesthetized by pentobarbital anaesthesia, then blood was drawn by cardiac puncture, and they were then decapitated.
Diets
The composition of the fibre-free control diet and experimental diets are shown in Table 1. The control diet was based on the solidified AIN76 formulation, with all maize starch and cellulose were replaced by sucrose. FOS (Meioligo P®; Meiji Food Material Company Limited) was added at 5 % (w/w) for the FOS diet. PDX (Litesse Ultra; Danisco Japan Limited) and lactitol (lactitol MC; Danisco Japan Limited) were each added at 2·5 % (w/w) for the PDX+lactitol diet. These special diets were made by Japan CLEA (Tokyo Japan). We employed AIN76 to eliminate the flux of carbohydrates such as maize starch and cellulose, which also induce production of SCFA( Reference Frost, Walton and Swann 24 , Reference Otles and Ozgoz 25 ) in the large intestine. Sucrose is absorbed in the small intestine and does not reach the large intestine; thus, sucrose does not influence fermentation. Consumption of AIN76 results in lower levels of SCFA in the faeces of rats, compared with consumption of AIN93, which is based on maize starch( Reference Cresci, Orpianesi and Silvi 26 ). Thus, the diets used in our study can reduce the influence of SCFA generated from maize starch, thereby allowing the influence of the fermentation of FOS, PDX and lactitol to be determined. On average, approximately 25 g of the diet was fed to each rat per d. We eliminated any effect of the amount of the diet throughout the experiment.
Table 1 The composition (%) of control and experimental diets
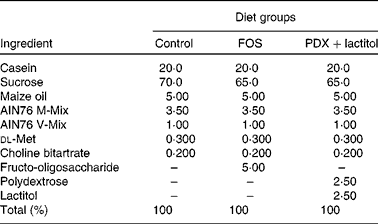
FOS, fructo-oligosaccharides; PDX, polydextrose.
Sampling
After 21 d of feeding, all rats were anaesthetised with sodium pentobarbital (65 mg/kg body weight; Kyoritsu Seiyaku Corporation) for sampling. After deep anaesthesia of all rats, caecal digesta, submandibular glands, and blood samples were obtained in Expt 1. Saliva samples and submandibular glands were obtained in Expt 2. Blood samples were collected by cardiac puncture into Venoject II tubes containing Serum Separating Medium (Terumo). Tubes were immediately inverted five to six times and placed at room temperature for 3 h. The samples were then centrifuged (1200 g , 20 min, 20°C). All samples were stored at − 20°C until analysis. All samples were collected between 07.00 and 11.00 hours.
Saliva collection
Five minutes after anesthetisation, salivary secretion was elicited by intraperitoneal injection of pilocarpine (8 mg/kg body weight; Nacalai Tesque, Inc.). After salivation began (approximately 5 min after injection), whole saliva was collected by pipette for 10 min. All saliva samples were stored at − 20°C until analysis.
Measurement of IgA concentration
The concentration of IgA in the caecal digesta, right submandibular glands, serum, and saliva of rats was quantified by an ELISA using a Rat IgA ELISA Quantitation Set (Bethyl Laboratories).
Caecal digesta samples were treated with twenty volumes of distilled water with 1 mm-phenylmethylsulphonyl fluoride from dimethyl sulphoxide-dissolved stock for 60 min at room temperature. The samples were then centrifuged (10 000 g , 15 min, 4°C) and the supernatant fractions were used for IgA measurement.
Submandibular gland tissue samples were crushed using a Cryo-press (Microtec Company Limited) and mixed in PBS (0·01 m, pH 7·2–7·4; Wako Pure Chemical Industries) containing 1 % Triton® X-100 (MP Biomedicals, LLC) and 1 mm-phenylmethylsulphonyl fluoride (from dimethyl sulphoxide-dissolved stock). These solutions were centrifuged (10 000 g , 15 min, 4°C). The supernatant fractions were collected.
Ninety-six-well microtitre plates were coated for 1 h at room temperature (20–25°C) with goat anti-rat IgA (1:100 dilution) diluted with the coating buffer, 0·05 m-carbonate-bicarbonate, pH 9·6. The residual fluid was removed and washed five times with wash solution (50 mm-Tris, 0·14 m-NaCl, 0·05 % Tween 20, pH 8·0). Blocking solution (50 mm-Tris, 0·14 m-NaCl, 1 % bovine serum albumin pH 8·0) was added to the wells as a blocking agent. The plate was then incubated for 30 min at room temperature and washed with wash solution as before. Samples and rat IgA standards (Bethyl Laboratories) were added to each well. The plate was incubated for 1 h at room temperature and washed five times with wash solution. Horseradish peroxidase-conjugated goat anti-rat IgA detection antibody (1:15 000 dilution) was added to each well. The plate was incubated again for 1 h at room temperature. The enzyme substrate 3,3′,5,5′-tetramethylbenzidine was added to each well after washing. The plate was developed in the dark at room temperature for 15 min. The reaction was stopped with 0·18 m-H2SO4 stop solution. Absorbance was measured at a wavelength of 450 nm in an automated microplate reader (BioRad). Absolute concentrations (ng/ml) were calculated using a standard curve. The IgA flow rate (ng/min) was calculated by multiplying the absolute concentration of IgA by saliva flow rate (ml/min). The IgA flow rate was employed as an indicator of the amount of IgA stored in the salivary glands. The saliva flow rate was determined by dividing the weight of saliva with the sampling time assuming that the specific gravity of saliva was 1·00.
RNA extraction and complementary DNA synthesis
Total RNA isolation from the submandibular glands was performed using ISOGEN reagent (Nippon Gene) in accordance with the manufacturer's instructions. RNA quality was determined by the ribosomal RNA banding pattern after electrophoresis on a 1·5 % agarose gel containing ethidium bromide and visualization using UV illumination. RNA concentrations were determined using a Bio Spec-nano spectrophotometer (Shimadzu Access Corporation). Complementary DNA was synthesized from total RNA using a first-strand cDNA synthesis kit (Roche Diagnostics Limited).
Quantitative real-time PCR measurement of polymeric Ig receptor (pIgR) mRNA in submandibular glands
Real-time PCR was performed using a LightCycler 480 system (Roche Diagnostics Limited) according to the manufacturer's instructions. Reactions were performed in a 20-μl volume (0·5 μmol each primer, 0·1 μmol TaqMan Probe). The primer sequences used to amplify the pIgR gene sequence were 5′-TGG GAG CTA CAA GTG TGG TC-3′ (forward primer) and 5′-GGG TGT CAT TTG GGA ATC CAG-3′ (reverse primer). The probe sequences were FAM-5′-TTC GAT GTC AGC CTG GAG GTC AGC-3′-TAMRA TaqMan Probe designed and synthesized by Nippon Gene Research Laboratory. The PCR product was 98 bp. PCR amplification of pIgR was performed as follows: 95°C for 10 min, followed by forty-five cycles of 95°C for 10 s and 62°C for 30 s. Real-time PCR for amplification of the rat β-actin housekeeping gene was performed using a LightCycler, FastStart DNA Master SYBR Green I (Roche Diagnostics Limited), forward primer (5′-CTT GTA TGC CTC TGG TCG TA-3′), and reverse primer (5′-CCA TCT CTT GCT CGA AGT CT-3′) in accordance with the manufacturer's instructions (Nihon Gene Research Labs, Inc.). The PCR product was 260 bp. Denaturation was performed at 95°C for 10 min, followed by forty cycles of 95°C for 10 s, 60°C for 10 s, and 72°C for 10 s. Gene expression is stated in terms of the copy number ratio of pIgR mRNA:β-actin mRNA for each sample.
Tissue preparation for immunohistochemistry
Submandibular gland tissue samples were fixed in 4 % buffered paraformaldehyde (pH 7·4; Wako Pure Chemical Industries) for 24 h and embedded in paraffin. Serial 4-μm sections were cut and stained with haematoxylin and eosin for immunohistochemistry. Immunohistochemical analysis was performed using simple stain rat MAX-PO (Nichirei Biosciences, Inc.). Slides were placed in 10 mm-sodium citrate, pH 6·0, and microwaved for 20 min for antigen retrieval. Then 0·2 % Triton® X-100 (MP Biomedicals, LLC) treatment was performed for 10 min. Slides were pre-incubated in 3 % H2O2 in methanol for 15 min. Sections were incubated with anti-rat IgA rabbit polyclonal antibody (1:300; Abbiotec, LLC) for 2 h at room temperature. After washing with PBS, sections were incubated with the secondary antibody, horseradish peroxidase-labelled anti-rabbit IgG with amino acid polymer (Nichirei Biosciences, Inc.), for 30 min at room temperature. Colour was developed using 0·02 % 3,3′-diaminobenzidine-tetrahydrochloride (Wako Pure Chemical Industries Limited) and 0·0003 % H2O2 in Tris-buffered saline for 6 min. Sections were then counter-stained with hematoxylin. Non-immunised rabbit IgG was used instead of primary antibody for negative controls.
Statistical analysis
Statistical analyses were performed using SPSS software, version 17.0 (SPSS, Inc.). The statistical analyses for weight gain were performed using the one-way ANOVA. Other statistical analyses were performed using the Kruskal–Wallis test. If the results of the statistical analyses were significant, multiple comparisons were conducted using the Steel test. P< 0·05 was considered statistically significant.
Results
Weight gain and caecal digesta weight of rats on fructo-oligosaccharide or polydextrose+lactitol diets
There were no significant differences in the intake of experimental diets between the control and FOS or PDX+lactitol groups. Prior to the experimental period, all rats had similar body weights. No significant differences were observed throughout the duration of the experimental period in mean body weight gain between the control and FOS or PDX+lactitol groups (Expt 1, P= 0·5; Expt 2, P= 0·9) (Table 2). FOS and PDX+lactitol groups exhibited significantly increased caecal digesta wet weight compared to that of the control group (Expt 1, P< 0·05, Fig. 1).
Table 2 Weight gain of rats during 21-d on experimental diets* (Mean values and standard deviations)

FOS, fructo-oligosaccharides; PDX, polydextrose.
* No significant differences in the mean body weight gain between the control and FOS or PDX+lactitol groups (Expt 1, P= 0·5; Expt 2, P= 0·9; one-way ANOVA).
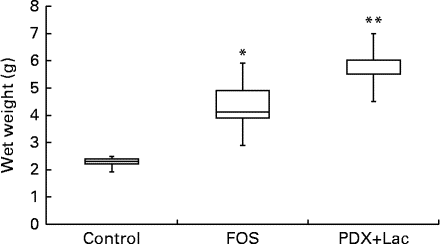
Fig. 1 Wet weight of caecal digesta (n 5). Box plots show median, first quartile, third quartile, minimum and maximum values. Significant differences were determined using the Kruskal–Wallis test and multiple comparisons using the Steel test. Median value was significantly different from that of the control group: * P< 0·05, ** P< 0·01. FOS, 5 % fructo-oligosaccharide; PDX+Lac, combination of 2·5 % polydextrose and 2·5 % lactitol.
IgA concentrations of rat caecal digesta, submandibular gland tissue, and serum
There were significant differences between the control group and both the FOS and the PDX+lactitol groups (Expt 1, P< 0·05) with respect to the IgA concentration in the caecal digesta after the 21-d feeding period (Fig. 2). Similarly, the IgA concentrations of the submandibular gland tissue were significantly increased in the FOS and PDX+lactitol groups compared to those of the control group (Expt 1, P< 0·05, Fig. 3). However, the IgA concentrations of serum did not differ between groups (Expt 1, P= 0·5, Fig. 4).
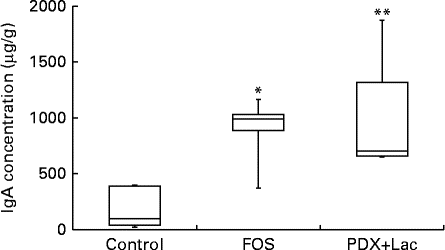
Fig. 2 IgA concentrations in caecal digesta (n 5). Box plots show median, first quartile, third quartile, minimum and maximum values. Significant differences were determined using the Kruskal–Wallis test and multiple comparisons using the Steel test. Median value was significantly different from that of the control group: * P< 0·05, ** P< 0·01. FOS, 5 % fructo-oligosaccharide; PDX+Lac, combination of 2·5 % polydextrose and 2·5 % lactitol.
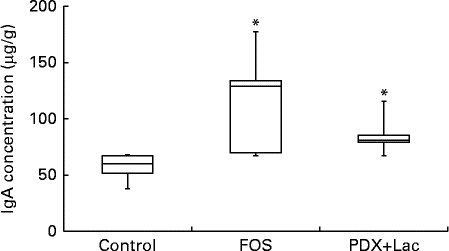
Fig. 3 IgA concentrations in submandibular gland tissue (n 5). Box plots show median, first quartile, third quartile, minimum and maximum values. Significant differences were determined using the Kruskal–Wallis test and multiple comparisons using the Steel test. * Median value was significantly different from that of the control group (P< 0·05). FOS, 5 % fructo-oligosaccharide; PDX+Lac, combination of 2·5 % polydextrose and 2·5 % lactitol.
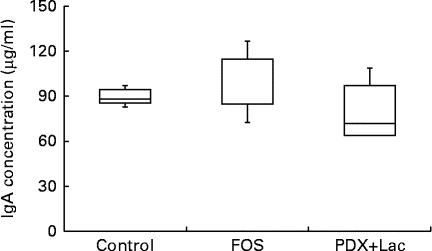
Fig. 4 Serum IgA concentrations (n 5). Box plots show median, first quartile, third quartile, minimum and maximum values. No significant differences in the median IgA concentration between the control and fructo-oligosaccharide (FOS) or combination of 2·5 % polydextrose and 2·5 % lactitol (PDX+Lac) groups (P= 0·5; Kruskal–Wallis test).
Immunohistochemical analysis of rat submandibular gland tissue
After the 21-d feeding period in Expt 1, the submandibular glands of the rats were removed and processed for immunohistochemistry to detect IgA. No apparent signal for IgA was identified in the control group (Fig. 5(a)). IgA staining was observed in the acinar cells but not in ductal cells in the FOS (Fig. 5(b)) and PDX+lactitol (Fig. 5(c)) groups. Acinar cells exhibited weak cytoplasmic staining for IgA. In the stroma around the acinar cells, plasma cells were not recognized on light microscopy of haematoxylin and eosin staining (data not shown) and immunohistochemical staining (see figures), although plasma cells may still have been present. Therefore, IgA-positive plasma cells were not observed in the submandibular glands of any group. Negative control slides were negative for IgA staining (data not shown).

Fig. 5 Immunohistochemical analysis of IgA protein in submandibular gland tissue. Control (a), fructo-oligosaccharide (FOS) (b) or combination of 2·5 % polydextrose and 2·5 % lactitol (PDX+Lac) (c). IgA immunohistochemical signals showed positive reaction for FOS or PDX+Lac group, compared with the control group. Magnification (400 × ).
Saliva flow rate, IgA concentration, and IgA flow rate of rat saliva
The saliva flow rate of rats, as measured for 10 min, did not show significant differences between the control and FOS or PDX+lactitol groups with the Kruskal–Wallis test (Expt 2, P= 0·4). The IgA concentrations in saliva from the FOS and PDX+lactitol groups were significantly increased compared to those from the control group (Expt 2, P< 0·05, Fig. 6). The IgA flow rate was significantly increased in the FOS and PDX+lactitol groups compared to that in the control group (Expt 2, P< 0·01, Fig. 7).
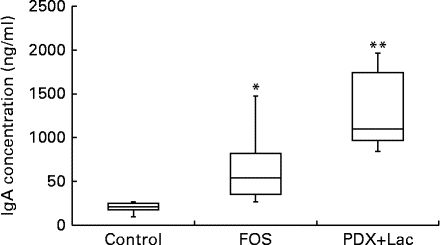
Fig. 6 Saliva IgA concentrations (n 6). Box plots show median, first quartile, third quartile, minimum and maximum values. Significant differences were determined using the Kruskal–Wallis test and multiple comparisons using the Steel test. Median value was significantly different from that of the control group: * P< 0·05, ** P< 0·01. FOS, 5 % fructo-oligosaccharide; PDX+Lac, combination of 2·5 % polydextrose and 2·5 % lactitol.
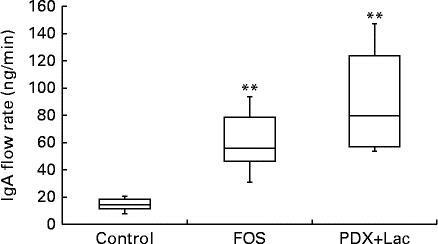
Fig. 7 IgA flow rate in saliva (n 6). Box plots show median, first quartile, third quartile, minimum and maximum values. Significant differences were determined using the Kruskal–Wallis test and multiple comparisons using the Steel test. ** Median value was significantly different from that of the control group (P< 0·01). FOS, 5 % fructo-oligosaccharide; PDX+Lac, combination of 2·5 % polydextrose and 2·5 % lactitol.
Expression level of polymeric Ig receptor (pIgR) mRNA in submandibular gland tissue
Quantitative PCR was conducted on complementary DNA samples as described in the methods to determine the level of pIgR transcript accumulation in the submandibular glands of the rats after the feeding period. Melting curve analysis revealed a single fluorescence peak representing the T m of the pIgR PCR product in all samples. The negative sample did not yield a product (data not shown). A single band was observed following agarose gel electrophoresis of the PCR product from all samples (data not shown). In FOS and PDX+lactitol groups, the pIgR mRNA (pIgR/β-actin) expression level in the submandibular gland tissue was significantly increased compared to that of control group (Expt 2, P< 0·05, Fig. 8).
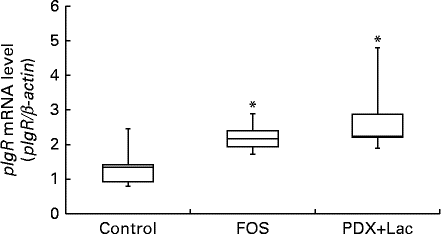
Fig. 8 Expression level of polymeric Ig receptor (pIgR) mRNA in submandibular gland tissue (n 6). Box plots show median, first quartile, third quartile, minimum and maximum values. Significant differences were determined using the Kruskal–Wallis test and multiple comparisons using the Steel test. * Median value was significantly different from that of the control group (P< 0·05). FOS, 5 % fructo-oligosaccharide; PDX+Lac, combination of 2·5 % polydextrose and 2·5 % lactitol.
Discussion
It has been reported that intake of indigestible carbohydrates such as FOS, PDX, and lactitol increases the IgA concentration in the rat caecal digesta( Reference Peuranen, Tiihonen and Apajalahti 7 , Reference Yasuda, Inoue and Sanbongi 27 – Reference Swanson, Grieshop and Flickinger 30 ). Accordingly, in the present study, addition of FOS or a combination of lactitol and PDX caused significant elevation of IgA concentration in the caecal digesta of rats (Fig. 2). We used an AIN76-modified diet with all fibre components eliminated as a control group, and only FOS or a combination of PDX and lactitol was added to the experimental groups. This model minimizes the influence of starch and enables isolation of the effect of PDX, lactitol, and FOS. We also evaluated the IgA concentration in the salivary glands and saliva. Consequently, the present study demonstrates the influence of these carbohydrates on salivary IgA production.
In our model, IgA concentration in the submandibular gland was significantly increased by FOS or PDX+lactitol (Fig. 3). To our knowledge, this is the first report of submandibular gland IgA production induced by these carbohydrates. In addition, this model demonstrated that serum IgA concentrations did not increase upon intake of FOS or PDX+lactitol (Fig. 4). Delgado et al. ( Reference Delgado, Thomé and Gabriel 15 ) reported that FOS derived from Yacón did not elevate the serum IgA level of mice. No changes in serum IgA were observed in healthy elderly people who were given indigestible carbohydrates( Reference Bunout, Hirsch and Pía de la Maza 31 ). Since IgA targets antigens at the mucosal surface, it is thought that an increase of IgA production in the submandibular gland and saliva does not affect serum concentrations of IgA. Interestingly, IgA staining was increased in the acinar cells of the submandibular gland upon FOS or PDX+lactitol intake, compared with that of the control diet. Because the IgA concentration in the submandibular gland was independent of serum IgA, the observed increases in IgA expression were apparently caused by increases in production in the local organ.
FOS and PDX+lactitol increased the IgA concentration in the saliva and submandibular gland and the IgA flow rate in the saliva compared with those of the control group (Figs. 3, 6 and 7). The IgA flow rate was employed as an indicator of the amount of IgA stored in the salivary glands. Ingestion of indigestible carbohydrates may increase the IgA concentration in the saliva and submandibular glands and the amount of IgA stored in the salivary glands, which may protect against infection by adventitious bacteria and viruses, e.g. upper respiratory tract infection( Reference Otsuki, Shimizu and Iemitsu 17 , Reference Walsh, Gleeson and Shephard 18 ).
Indigestible carbohydrates such as FOS, PDX and lactitol reach the large intestine, and then are degraded by the microflora. During such degradation SCFA and gases are formed( Reference Nyman 32 ). In the present study, addition of FOS or PDX and lactitol increased SCFA production in the large intestine as in previous studies( Reference Hiroki, Hiroyuki and Kimio 33 – Reference Finney, Smullen and Foster 39 ). FOS, PDX, and lactitol could theoretically also be fermented by bacteria in the oral cavity, which could be associated with dental caries. Generally, dental caries is associated with a loss of minerals such as Na and Ca under low pH in the dental plaque on tooth surfaces( Reference Struzycka 40 ). The escape of minerals from the tooth surface usually leads to the creation of carious cavities on the tooth surface. The low pH in dental plaque results from fermentation of monosaccharides and disaccharides by Streptococcus mutans. However, the retention period should probably be too short for S. mutans to ferment indigestible carbohydrates such as FOS, PDX and lactitol in the oral cavity. Indeed, it has been shown that S. mutans rarely degrades indigestible carbohydrates in the oral cavity( Reference Sakallioğlu, Güvenç and Cingi 41 ). Therefore, indigestible carbohydrates such as FOS, PDX and lactitol would probably not induce dental caries as in a previous study which did not show dental caries formation( Reference Zero 42 ). Adverse effects of indigestible carbohydrates such as FOS, PDX and lactitol include diarrhoea( Reference Oku, Nakamura and Ichinose 43 ); however, a smaller amount of indigestible carbohydrates was previously shown not to induce diarrhoea( Reference Oku, Nakamura and Ichinose 43 ). Addition of indigestible carbohydrates such as FOS, PDX and lactitol to the diet with careful consideration of the amounts added may thus reduce upper respiratory tract infection without diarrhoea.
The expression of pIgR mRNA in the rat submandibular gland tissue and saliva IgA concentration were significantly increased upon intake of FOS or PDX+lactitol (Figs. 6 and 8). Nakamura et al. ( Reference Nakamura, Nosaka and Suzuki 6 , Reference Nakamura, Terahara and Iwamoto 14 ) reported that pIgR expression increased in the intestinal tract upon indigestible carbohydrate intake. And pIgR plays an important role in facilitating the transport of IgA across the epithelial border and in the resistance to the IgA proteases present within mucosal secretions. Suppression of pIgR expression caused a decrease in the quantity of sIgA secreted within the saliva in a previous study( Reference Kimura, Aizawa and Tanabe 44 ). Therefore, pIgR expression in the submandibular gland may cause an increase in IgA concentration and IgA flow rate in saliva.
Carpenter et al. ( Reference Carpenter, Proctor and Ebersole 45 ) reported that the rate of IgA secretion into saliva is regulated by the autonomic nerves supplying the glands in vivo. Following in vivo nerve stimulation, there was an increased amount of pIgR expressed on the membrane surface. This was also functionally demonstrated in vitro by increased uptake of human IgA by acutely prepared rat salivary cells following stimulation by adrenaline, indicating increased mobilisation of pIgR with stimulation( Reference Carpenter, Proctor and Ebersole 45 ). Kimura et al. ( Reference Kimura, Inoue and Maeda 46 – Reference Kimura, Inoue and Hirano 48 ) recently reported that two orphan G-protein coupled receptors (GPCR), GPR41 and GPR43, were most abundantly expressed in sympathetic ganglia in adipose tissue, the gut and the peripheral nervous system. These receptors have been reported to be activated by SCFA( Reference Kimura, Inoue and Maeda 46 – Reference Kimura, Inoue and Hirano 48 ), which have been shown to be produced by intestinal bacterial fermentation of indigestible carbohydrates( Reference Mitsuoka 4 ). Among SCFA, butyrate was previously shown to induce the differentiation of T regulatory cells in vitro and in vivo, and to ameliorate the development of colitis induced by adoptive transfer of CD4(+) CD45RB(hi) T cells in Rag1( − / − ) mice( Reference Furusawa, Obata and Fukuda 49 ). SCFA affect remote organs( Reference Sakata 50 ), and the salivary glands are greatly influenced by autonomic nerve( Reference Sabbadini and Berczi 51 ). Therefore, further experiments are necessary to examine the influence of SCFA generated in the large intestine from indigestible carbohydrates, which may affect the submandibular gland and saliva IgA through the autonomic nervous system( Reference Carpenter, Proctor and Ebersole 45 , Reference Proctor, Carpenter and Garrett 52 – Reference Proctor and Carpenter 54 ).
In conclusion, we report the novel finding that indigestible carbohydrates in the diet increased submandibular gland IgA expression. Moreover, increases in local IgA production and pIgR expression may influence IgA concentration in the submandibular gland. These findings support the hypothesis that indigestible carbohydrates are important for the enhancement of oral mucosal immunity and of the caecal digesta.
Acknowledgements
The authors thank Professor Tatsuya Morita of Shizuoka University for technical advice on immunohistochemistry.
The present research was supported by the General Research Fund administered by Kanagawa Dental University under grant number 20130333. The funders had no role in the design, analysis or writing of this article.
The authors declare no conflicts of interest.
The author's contributions are as follows: Y. Y. collected all relevant literature, conducted all the experiments and statistical analyses, and wrote the first draft of the manuscript. M. T. performed all the experimental and statistical analyses. T. H. conducted ELISA analysis. T. S. attended to saliva collection. Y. K. performed the immunohistochemical analysis of rat submandibular gland tissue. J. S. conducted pIgR mRNA analysis. T. T. designed the components of the fibre-free diet and participated in statistical analyses. K. T. designed the present study and wrote the first draft of the manuscript.
All authors contributed to, read and approved the final manuscript.


