Over the past few decades, the prevalence of hyperuricaemia has been increasing and ranged from 2·6 to 36 % in different populations(Reference Zhu, Pandya and Choi1–Reference Chuang, Lee and Hsieh4). A recent nation-wide study found that the prevalence of hyperuricaemia was up to 13·3 % in China(Reference Liu, Han and Wu5). Hyperuricaemia is a precipitating factor for gout(Reference Roddy and Doherty6) as well as a risk factor for diabetes, the metabolic syndrome and CVD(Reference Sluijs, Beulens and van der7–Reference Okura, Higaki and Kurata9). Prior studies have demonstrated that serum uric acid (UA) levels may be affected by many factors such as age, sex, diet and race(Reference de Oliveira and Burini10). In recent years, the effects of minerals on the risk of hyperuricaemia have been the focus of scientific research(Reference Cao, Zhang and Li11).
Mg is the fourth most abundant mineral found in the body and is the second most common intracellular cation after K. Serum or plasma Mg is the most commonly used biomarker to assess Mg status in clinical practice(Reference Wu, Xun and Tang12). It reflects not only dietary intake but also intestinal absorption, renal reabsorption and excretion, and hormone regulation(Reference Schwalfenberg and Genuis13). It has been reported that higher plasma Mg or Mg intake may be related to a lower risk of diabetes(Reference Hruby, Ngwa and Renstrom14), cancer(Reference Wark, Lau and Norat15), chronic kidney disease(Reference Massy, Nistor and Apetrii16) and cardiac death(Reference Chiuve, Korngold and Januzzi17). Furthermore, although some cross-sectional studies found that Mg from blood or dietary intake was inversely associated with the prevalence of hyperuricaemia(Reference Zeng, Wang and Wei18–Reference Zhang and Qiu20), few studies have been conducted to investigate the prospective relationship of Mg concentrations from blood with new-onset hyperuricaemia.
Therefore, our present study, a post hoc analysis of the UA Sub-study of the China Stroke Primary Prevention Trial (CSPPT)(Reference Huo, Li and Qin21), aimed to evaluate the prospective association between plasma Mg and risk of new-onset hyperuricaemia and examine any possible effect modifiers among hypertensive patients.
Methods
Study participants and design
The sample population for this study was drawn from the UA sub-study of the CSPPT. The study design and major results of the CSPPT (clinicaltrials.gov; NCT00794885)(Reference Huo, Li and Qin21,Reference Qin, Li and Zhang22) and the UA sub-study of the CSPPT(Reference Qin, Li and He23) have been described in detail previously. Briefly, the CSPPT was a multi-community, randomised, double-blind, controlled trial conducted from 19 May 2008 to 24 August 2013 in thirty-two communities in China. Eligible participants were men and women aged 45–75 years with hypertension, defined as seated resting systolic blood pressure (SBP) ≥140 mmHg or diastolic blood pressure ≥90 mmHg at both the screening and recruitment visit or who were taking antihypertensive medication. The major exclusion criteria included history of physician-diagnosed stroke, myocardial infarction, heart failure, post-coronary revascularisation, and/or congenital heart disease.
The UA Sub-study enrolled CSPPT participants from twenty communities in Jiangsu province excluding those individuals who were taking UA-lowering medication or who had missing UA concentrations at baseline.
Intervention and follow-up
In the CSPPT, a total of 20 702 eligible participants were randomly assigned, in a 1:1 ratio, to one of the two treatment groups: a daily oral dose of one tablet containing 10 mg enalapril and 0·8 mg folic acid (the enalapril–folic acid group), or a daily oral dose of one tablet containing 10 mg enalapril only (the enalapril-only group). Participants were followed up every 3 months. Before the study ended, an exit visit was conducted for blood sample collection and assessment of hyperuricaemia outcomes.
Selection samples from the China Stroke Primary Prevention Trial
Mg deficiencies have been associated with cancer, CVD and mortality(Reference Wark, Lau and Norat15,Reference Chiuve, Korngold and Januzzi17) . Therefore, we selected two cohorts of study participants from the CSPPT. Study 1 included 1326 incident stroke, cancer or all-cause mortality cases matched with 1264 corresponding controls. Controls were randomly chosen from the remaining participants who did not develop the corresponding end points during the follow-up. Controls were matched with the cases on a 1:1 ratio for age (no more than 1 year), sex, treatment group and study site. Study 2 included 1500 subjects randomly selected from the CSPPT. A total of 196 participants were included both in study1 and study 2. The present analysis utilised data from study 1 and study 2; therefore, participants had a wide range of baseline Mg levels, and the analysis had enough power to examine the relation of plasma Mg with new-onset hyperuricaemia.
The total study sample for the present study included participants from the study 1 and study 2 in the UA sub-study with plasma Mg measurements at baseline, as well as complete data on UA at both the baseline and exit visits, and who were free of hyperuricaemia at baseline (online Supplementary Fig. S1). This study was approved by the Ethics Committee of the Institute of Biomedicine, Anhui Medical University, Hefei, China.
Outcomes
The main outcome was new-onset hyperuricaemia in participants with normal UA concentrations (<357 μmol/l) at baseline. Hyperuricaemia was defined as a UA concentration ≥417 μmol/l in men or ≥357 μmol/l in women(Reference Feig, Kang and Johnson24).
The secondary outcome was change in UA concentrations, defined as UA concentrations at the exit visit minus that at baseline.
Laboratory assays
Blood samples of all participants were collected at both the baseline and the exit visit. Serum folate was measured by a commercial laboratory using a chemiluminescent immunoassay (New Industrial). Serum concentrations of UA, total homocysteine, lipids and fasting glucose were measured with the use of automated analyzers (Beckman Coulter) at the core laboratory of the National Clinical Research Center for Kidney Disease, Nanfang Hospital, Guangzhou, China. Plasma Mg was measured by inductively coupled plasma mass spectrometry in a commercial laboratory (Beijing DIAN Medical Laboratory, China). Both intra-assay and inter-assay CV of duplicate samples (randomly placed among the study samples) were calculated. The intra-assay CV of Mg ranged from 0·78 to 5·20 %, while the inter-assay CV of Mg was 4·78 %. The estimated glomerular filtration rate was calculated with the use of the Chronic Kidney Disease Epidemiology Collaboration equation(Reference Levey, Stevens and Schmid25).
Statistical analysis
To maximum study power, we combined study 1 and study 2 for the present analysis (online Supplementary Fig. S1). Furthermore, as a sensitivity analysis, we also evaluated the relation of plasma Mg with new-onset hyperuricaemia in study 1, study 2 and in participants without incident stroke, cancer or all-cause mortality during follow-up period, respectively.
Baseline characteristics are presented as mean (sd) for continuous variables and proportions for categorical variables. Differences in baseline characteristics by Mg tertiles were compared using ANOVA tests, or χ 2 tests, accordingly.
Multivariable logistic regression models and linear regression models were used to examine the relationship of baseline plasma Mg with new-onset hyperuricaemia and the change in UA concentrations, respectively, without and with adjustment for age, sex, BMI, UA, fasting glucose, total cholesterol, TAG, total homocysteine, folate, estimated glomerular filtration rate, SBP, smoking and drinking status at baseline, treatment group and mean SBP during the treatment period. We used cubic B-spline with four knots (5th (725·1 μmol/l), 35th (823·2 μmol/l), 65th (881·9 μmol/l) and 95th (992·3 μmol/l) percentiles of baseline plasma Mg) to model the relation between plasma Mg and new-onset hyperuricaemia by the R package spline (Reference Croxford26). The middle point of first tertile for baseline plasma Mg (777·3 μmol/l) was selected as an anchor point. Non-linearity of the relationship of plasma Mg and new-onset hyperuricaemia was tested using a likelihood ratio test comparing two multivariable logistic regression models: one including only linear effect and second including also quadratic and cubic terms(Reference Saliba, Barnett-Griness and Gronich27). As additional exploratory analyses, possible modifications of the association between plasma Mg and new-onset hyperuricaemia were also assessed for above listed covariables.
A two-tailed P < 0·05 was considered to be statistically significant in all analyses. R software, version 3.3.2 (http://www.R-project.org/) was used for all statistical analyses.
Results
Study participants and baseline characteristics
As illustrated in the flow chart (online Supplementary Fig. S1), a total of 1685 participants were included in the final analysis. Baseline characteristics of the participants are presented by plasma Mg tertiles in Table 1. Plasma Mg levels were positively associated with age and BMI and were inversely associated with folate, fasting glucose, estimated glomerular filtration rate and glucose-lowering drugs.
Table 1. Baseline characteristics of study participants by magnesium tertiles (T1–T3)
(Mean values and standard deviations; numbers and percentages)
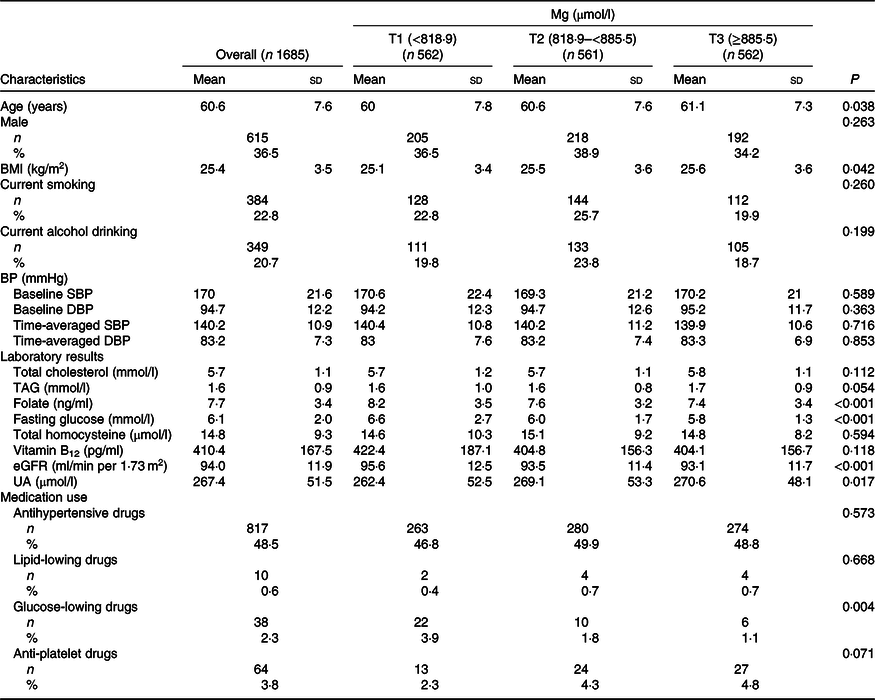
BP, blood pressure; SBP, systolic blood pressure; DBP, diastolic blood pressure; eGFR, estimated glomerular filtration rate; UA, uric acid.
Association between plasma magnesium and study outcomes
During the median follow-up duration of 4·3 years (interquartile range: 4·2–4·6 years), new-onset hyperuricaemia occurred in 290 (17·2 %) participants. Overall, no significant curvilinear association was observed between Mg and new-onset hyperuricaemia (P for non-linearity = 0·436). The linear dose–response analysis suggested that per sd increment of plasma Mg was associated with 15 % reduction in new-onset hyperuricaemia (OR 0·85; 95 % CI 0·74, 0·99) (Fig. 1(a)). Consistently, there was a significantly inverse relationship of plasma Mg with the change in UA levels (per sd increment; β −3·96 μmol/l; 95 % CI −7·14, −0·79) (Fig. 1(b)).
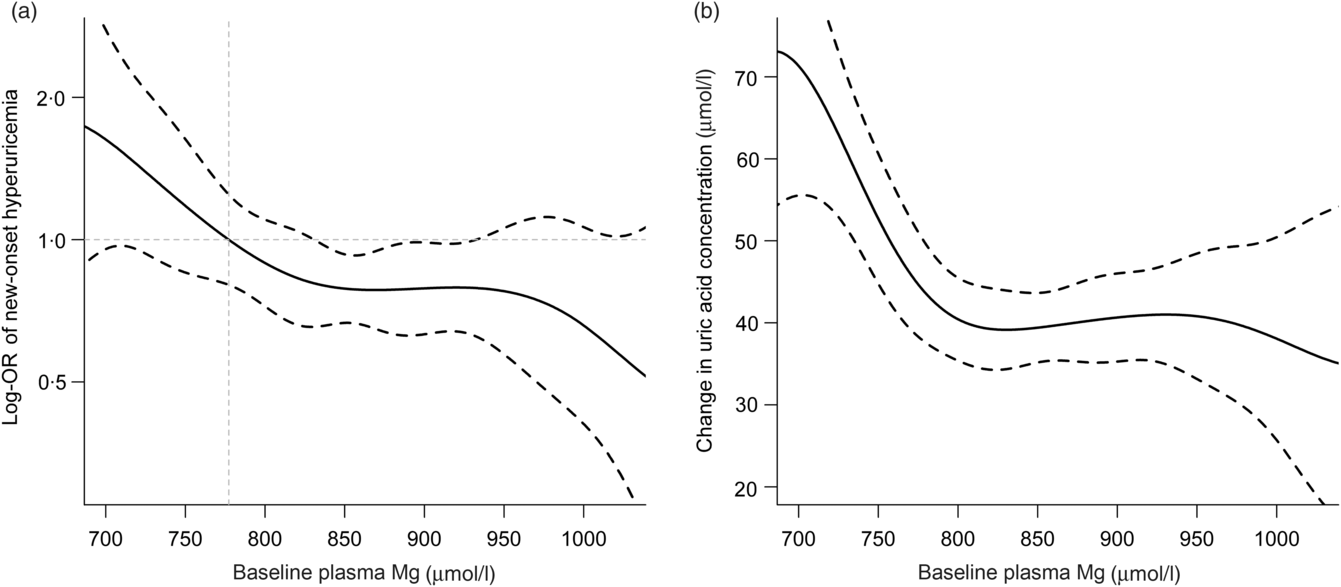
Fig. 1. Relationship of plasma magnesium with new-onset hyperuricaemia (a) and change in uric acid concentration (b) in hypertensive patients*. *Adjusted for age, sex, BMI, uric acid, fasting glucose, total cholesterol, TAG, total homocysteine, folate, estimated glomerular filtration rate, systolic blood pressure (SBP), smoking and drinking status at baseline, treatment group and mean SBP during the treatment period. The middle point of first tertile for baseline plasma magnesium (777·3 μmol/l) was selected as an anchor point.
When plasma Mg was analysed as tertiles, a significantly lower risk of new-onset hyperuricaemia (OR 0·67; 95 % CI 0·48, 0·95) and less increase in UA levels (β −8·35 μmol/l; 95 % CI −16·12, −0·58) were found among participants in tertile 3 (≥885·5 μmol/l) compared with those in tertile 1 (<818·9 μmol/l) (Tables 2 and 3). Similar trends were found in males and females (Tables 2 and 3), in participants without incident stroke, cancer or all-cause mortality (online Supplementary Table S1), in study 1 or 2 (online Supplementary Tables S2 and S3) and in the enalapril-only group (online Supplementary Table S4). Moreover, taking into account possible residual confounding, we further explored the association between plasma Mg and new-onset hyperuricaemia with a sequential modelling approach (online Supplementary Table S5). In the models, all the results did not change essentially.
Table 2. Association between plasma magnesium and new-onset hyperuricaemia
(Numbers and percentages; odds ratios and 95 % confidence intervals)
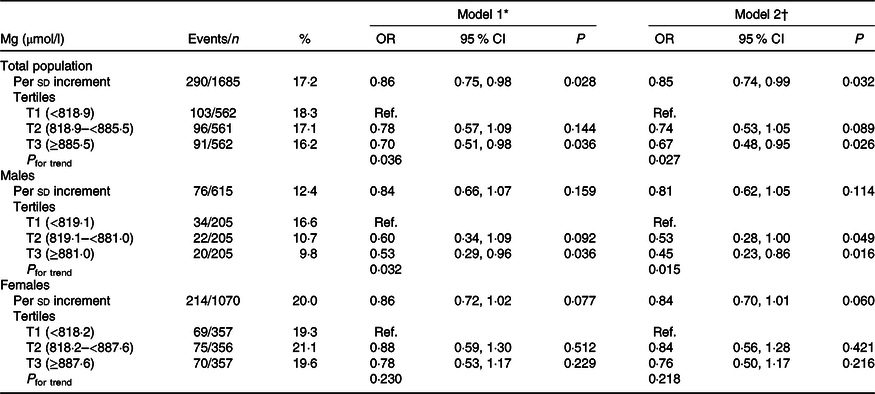
Ref., reference; UA, uric acid; SBP, systolic blood pressure.
* Adjusted for age, sex and UA at baseline.
† Adjusted for age, sex, BMI, UA, fasting glucose, total cholesterol, TAG, total homocysteine, folate, estimated glomerular filtration rate, SBP, smoking and drinking status at baseline, treatment group, and mean SBP during the treatment period.
Table 3. Association between plasma magnesium and change in uric acid (UA) concentrations
(Mean values and standard deviations; β-coefficients and 95 % confidence intervals)
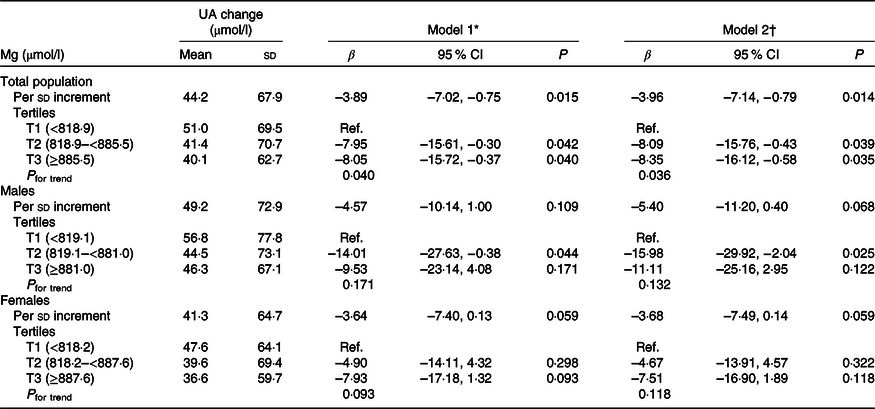
Ref., reference; SBP, systolic blood pressure.
* Adjusted for age, sex and UA at baseline.
† Adjusted for age, sex, BMI, UA, fasting glucose, total cholesterol, TAG, total homocysteine, folate, estimated glomerular filtration rate, SBP, smoking and drinking status at baseline, treatment group, and mean SBP during the treatment period.
In addition, during the treatment period, participants with higher plasma Mg levels had lower frequency use of glucose-lowering drugs (online Supplementary Table S6). However, further adjustment for the use of glucose-lowering drugs did not substantially change the results (online Supplementary Table S7).
Stratified analyses by potential effect modifiers
Stratified analyses were performed to assess the effect of Mg (Per sd increment) on the primary outcome in various subgroups (Fig. 2). None of the variables, including sex, age (<60 v. ≥60 years), current alcohol drinking (no v. yes), treatment group (enalapril-only v. enalapril + folic acid), SBP (<160 v. ≥160 mmHg), UA (<269 (median) v. ≥269 μmol/l), TAG (<1·4 (median) v. ≥1·4 mmol/l)), fasting glucose (<7·0 v. ≥7·0 mmol/l or diabetes), folate (<7·3 (median) v. ≥7·3 ng/ml), estimated glomerular filtration rate (<90 v. ≥90 ml/min/1·73 m2) levels at baseline, as well as mean SBP (<140 v. ≥140 mmHg), stroke occurrence (no v. yes), and cancer occurrence (no v. yes) over the trial period, significantly modified the association between plasma Mg and the risk of hyperuricaemia (P for all interactions >0·05) (Fig. 2). Of note, at the existing sample size, the power for detecting a moderate interaction is limited; therefore, a negative finding would not necessarily confirm the absence of interaction.
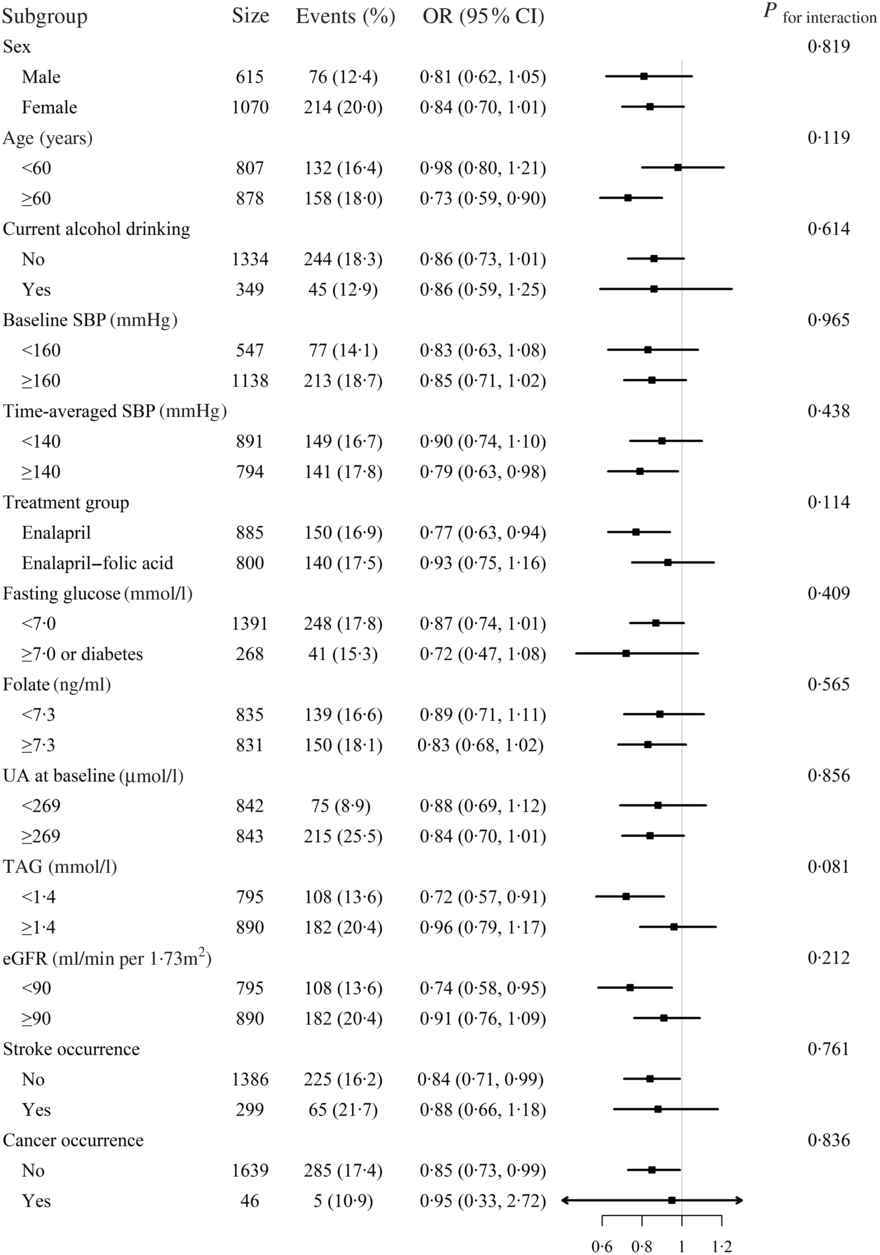
Fig. 2. Stratified analyses by potential effect modifiers for new-onset hyperuricaemia*. *Adjusted, if not stratified, for age, sex, BMI, uric acid (UA) at baseline, fasting glucose, total cholesterol, TAG, total homocysteine, folate, estimated glomerular filtration rate (eGFR), systolic blood pressure (SBP), smoking and drinking status at baseline, treatment group and mean SBP during the treatment period. Diabetes was defined as self-reported physician-diagnosed diabetes or the use of glucose-lowering drugs at baseline. Boxes denote odds ratios; lines represent 95 % confidence intervals.
Discussion
Our present study is the first to demonstrate that plasma Mg levels were inversely associated with incidence of new-onset hyperuricaemia and the magnitude of the increase in UA concentrations among general hypertensive patients.
Our findings are consistent with the published cross-sectional studies on this topic. In a Chinese population of adults over age 40 years (n 2904), serum Mg was inversely associated with the prevalence of hyperuricaemia in men, but not in women(Reference Zeng, Wang and Wei18). Wang et al. (Reference Wang, Zeng and Wei19) reported that the relative odds of the overall prevalence of hyperuricaemia decreased in the fourth quintile of Mg intake (OR 0·57; 95 % CI 0·35, 0·94) and in the fifth quintile (OR 0·55, 95 % CI 0·30, 1·01) compared with the lowest quintile (P for trend = 0·091) among 5168 subjects. In addition, this association remained valid for males but not for females. Consistently, Zhang et al. (Reference Zhang and Qiu20) indicated that increased Mg intake was associated with decreased prevalence of hyperuricaemia in adults from the USA.
With a prospective design, our present study provides some new insights in this field. We found higher Mg levels were associated with lower risk of new-onset hyperuricaemia and less increase in UA concentrations over a median follow-up duration of 4·3 years. Mg is one of the most important dietary nutrients for humans. It is involved in a wide range of biochemical reactions, particularly, intracellular transphosphorylation, which is critical for the initiation of DNA synthesis and multiplication in cultured cells(Reference Rubin28,Reference Rubin29) . Furthermore, low Mg levels can influence oxidative stress, consequent oxidative DNA modification and DNA repair(Reference Wolf, Maier and Nasulewicz30), and therefore, may induce marked DNA damage and release purine nucleotides. Catabolism of the purine nucleotides ultimately leads to the production of UA. Moreover, Mg deficiency is related to an increase in C-reactive protein, IL-6 and fibrinogen, which are sensitive biomarkers of inflammation(Reference Kim, Xun and Liu31–Reference Song, Li and van Dam33). Additionally, a positive relationship between serum UA with IL-6 and TNF-α has been reported(Reference Lyngdoh, Marques-Vidal and Paccaud34,Reference Bonora, Targher and Zenere35) . While more mechanistic studies are required, available evidence lent support for a biological plausibility of our findings.
Our analyses considered a number of potentially confounding factors, including baseline BMI, UA, fasting glucose, lipids, total homocysteine, folate, etc. Furthermore, we have evaluated possible modifications of the association between plasma Mg and new-onset hyperuricaemia for above-listed covariables. However, limitations of the present study should also be noted. First, our present study was conducted in hypertensive patients; thus, the generalisability of the results to adults without hypertension remains to be further examined. However, blood pressure measurements at both baseline and during the trial period did not significantly modify the association between plasma Mg and new-onset hyperuricaemia. Second, Mg concentrations were only measured at baseline, which may or may not represent the Mg concentrations over the period of follow-up. Third, although adjustments were made for a broad set of covariates, residual confounding from unmeasured or incompletely measured factors cannot be excluded. Finally, a relationship between a nutrition biochemical marker may not necessarily mean that the nutrient itself is really involved. Although plasma Mg is highly associated with Mg-rich foods, the effect of Mg intake is difficult to be distinguished from the concomitant many other beneficial components. Moreover, we did not have detailed food intake information. As such, we could not examine the possible effect of Mg intake on new-onset hyperuricaemia. Overall, our results were just hypothesis generating. More clinical studies are needed to confirm our findings and explore the underlying mechanisms.
In conclusion, higher baseline plasma Mg concentrations were associated with significantly decreased risk of new-onset hyperuricaemia in hypertensive adults. If further confirmed by future studies, maintaining higher Mg concentrations may be considered as an adjuvant nutritional strategy for the prevention and treatment of hyperuricaemia.
Acknowledgements
The study was supported by funding from the following: the National Key Research and Development Program (2016YFE0205400, 2016YFC0903103, 2016YFC0904900, 2018ZX09739010 and 2018ZX09301034003), the Science and Technology Planning Project of Guangzhou, China (201707020010); the Science, Technology and Innovation Committee of Shenzhen (JSGG20170412155639040 and GJHS20170314114526143); the Economic, Trade and Information Commission of Shenzhen Municipality (20170505161556110 and 20170505160926390); the National Natural Science Foundation of China (81730019) and Outstanding Youths Development Scheme of Nanfang Hospital, Southern Medical University (2017J009).
Author contributions were as follows: Study concept and design: X. X., X. Q., J. C., J. Z., H. Z., Y. Z., H. L., C. J., T. L., Z. Z., Y. S., C. L., L. L., B. W., J. L., Y. Z., Y. C., Y. H., X. W. Conduct of study: X. Q., J. C., J. Z., H. Z., C. J., Z. Z., B. W., J. L., Y. Z., L. L., C. L., Y. H. and X. W. Data collection and analysis: J. C., J. Z. and X. Q. Drafting of the manuscript: J. C., J. Z. and X. Q. Critical review and revision of the manuscript for important intellectual content: X. X., X. Q., J. C., J. Z., Y. Z., H. L., C. J., Z. Z., Y. S., C. L., B. W., J. L., Y. Z., L. L., Y. C., Y. H. and X. W. All authors read and approved the final manuscript.
Y. H. reports grants from the National Key Research and Development Program (2016YFC0903103). Y. C. reports grants from the National Key Research and Development Program (2016YFC0904900). X. X. reports grants from the National Key Research and Development Program (2016YFE0205400, 2018ZX09739010 and 2018ZX09301034003); the Science and Technology Planning Project of Guangzhou, China (201707020010); the Science, Technology and Innovation Committee of Shenzhen (JSGG20170412155639040 and GJHS20170314114526143); and the Economic, Trade and Information Commission of Shenzhen Municipality (20170505161556110 and 20170505160926390). X. Q. reports grants from the National Natural Science Foundation of China (81730019) and the Outstanding Youths Development Scheme of Nanfang Hospital, Southern Medical University (2017J009). The remaining authors declare no conflicts of interest.
Supplementary material
For supplementary material referred to in this article, please visit https://doi.org/10.1017/S0007114520001099


