Cardiometabolic diseases (CMD) are a group of common but often preventable diseases encompassing CVD and metabolic disorders, which are a major public health concern worldwide(Reference Sattar, Gill and Alazawi1). Existing studies have focused on quantifying burden of CMD in general populations or people with obesity(Reference Cheng, Ma and Ouyang2,Reference Powell-Wiley, Poirier and Burke3) . Data regarding the burden of CMD specifically among people with underweight are scarce. However, underweight has been associated with increased risk of CVD and mortality, according to repeatedly reported J- or U-shaped associations of BMI with CVD and mortality in both general and diseased populations(Reference Milajerdi, Djafarian and Shab-Bidar4–Reference Aune, Sen and Prasad7). In the USA, about 1·6 % of adults aged 20 years or older were underweight in 2017–2018, equivalent to about 4 million individuals(Reference Fryar, Carroll and Afful8). However, the nationwide prevalence of CMD among US adults with underweight is unclear.
Using nationally representative data from the National Health and Nutrition Examination Survey (NHANES) in 1999–2020, we sought to estimate the prevalence of a range of CMD among US adults with underweight.
Methods
Data source and study design
NHANES is a continuous, multistage, nationally representative survey of the non-institutionalised civilian resident US population. The survey has been conducted periodically in 2-year cycles since 1999, collecting data through in-home interviews and study visits at mobile examination centres. However, the NHANES programme suspended field operations in March 2020 due to the pandemic of coronavirus disease 2019. Therefore, data collected from 2019 to March 2020 were combined with the data from the 2017–2018 cycle to form a nationally representative sample. This study included ten cycles between 1999–2000 and 2017–2020. The overall response rate ranged from 51 % to 84 % for the interview component and from 46·9 % to 80 % for the examination component. Participants aged 20 years or older were included. Pregnant women were excluded.
The National Center for Health Statistics Research Ethics Review Board approved NHANES. This study was conducted according to the guidelines laid down in the Declaration of Helsinki, and all procedures involving human subjects/patients were approved by the Shanghai Jiao Tong University School of Medicine Public Health and Nursing Research Ethics Review Committee (ethics number: SJUPN-202102-B). Written informed consent was obtained from all participants.
Underweight and covariates
Height and weight were collected by trained health technicians. BMI was computed by dividing an individual’s weight in kilograms by their height in metres squared. BMI < 18·5 kg/m2 defined underweight and the inclusion criterion of this study. Self-reported information on age, sex, race/ethnicity, education and medical conditions was collected during the household interview. Race/ethnicity was self-reported according to fixed-category questions. Alcohol consumption, leisure-time physical activity, sleep duration, smoking status and dietary intake were self-reported. Diet quality was assessed by Healthy Eating Index-2015 (HEI-2015)(Reference Reedy, Lerman and Krebs-Smith9).
Definition of cardiometabolic diseases
CMD included dyslipidemia, hypertension, prediabetes, diabetes, chronic kidney disease and CVD. Dyslipidemia was defined as having a total cholesterol level ≥ 240 mg/dl or a HDL-cholesterol level < 40 mg/dl for men or < 50 mg/dl for women or self-reported current use of lipid-lowering drugs(Reference Shin, Bautista and Walsh10). Hypertension was defined as having blood pressure ≥ 130/80 mm Hg or self-reported current use of antihypertensive drugs. Blood pressure was based on the average of all available measurements. Diabetes was defined as having a self-reported diagnosis of diabetes by a physician or other health professional, a fasting plasma glucose level ≥ 126 mg/dl or a Hb A1c level ≥ 6·5 %. Fasting plasma glucose was measured among those who were fasted for 8 to < 24 h. Plasma glucose data between 2005–2006 and 2017–2020 were calibrated according to the recommended equation from NHANES(11). Among participants without being diagnosed with diabetes before, a Hb A1c level of 5·7–6·4 % or a fasting plasma glucose level of 100–125 mg/dl defined prediabetes. Chronic kidney disease was defined as having a urine albumin-to-creatinine ratio ≥ 30 mg/g or an estimated glomerular filtration rate < 60 ml/min/1·73 m2(Reference Afkarian, Zelnick and Hall12). Urine and serum creatinine levels were calibrated(13). Estimated glomerular filtration rate was computed according to the Chronic Kidney Disease Epidemiology Collaboration equation(Reference Levey, Stevens and Schmid14). CVD was a composite endpoint of self-reported congestive heart failure, CHD, heart attack and stroke. Two or more CMD commonly co-occur within an individual(Reference Cheng, Ma and Ouyang2). Therefore, having zero and at least two of the following diseases were studied: dyslipidemia, hypertension, diabetes, chronic kidney disease and CVD.
Statistical analysis
The characteristics of the study participants were described using weighted percentages or weighted mean (se). The prevalence of CMD alone and in combination was estimated in the total sample and by age (20–39, 40–59 and ≥ 60 years), sex (men and women), race/ethnicity (non-Hispanic White, non-Hispanic Black, Hispanic and other) and education (less than high school, high school graduate, some college and college graduate or higher). Estimates were age-standardised to the 1999–2020 NHANES non-pregnant adult population with underweight. Multivariable Poisson regressions were used to estimate the prevalence ratios (PR) for comparing the prevalence of CMD between subgroups, adjusting for age, sex and race/ethnicity. Subgroup differences in the PR of CMD were obtained from weighted Poisson regression models. P values were adjusted using false discovery rate (FDR) corrections.
Post hoc analyses were conducted to help interpret the prevalence of CMD in adults with underweight. First, the prevalence of CMD in the general population was compared by weight category (underweight, normal weight, overweight and obese) using multivariable Poisson regressions, adjusting for age, sex and race/ethnicity. Using underweight as the reference, PR and 95 % CI were derived for other weight categories. Second, the prevalence of CMD among adults with underweight was estimated by different lifestyle factors: non-excessive drinking (≥ 4–5 drinks/d, or ≤ 14 drinks/week for men or ≤ 7 drinks/week for women; yes/no)(Reference Taylor, Denniston and Klevens15), meeting physical activity guidelines (≥ 150 min per week of moderate-intensity or ≥ 75 min per week of vigorous-intensity leisure-time activity; yes/no), meeting recommended sleep duration (sleep duration of 7–9 h per d; yes/no), smoking status (self-reported and grouped into three categories: current, former and never) and low HEI-2015 score (< 50 or ≥ 50). Subgroup differences were compared using the F tests.
Appropriate sampling weights and design variables were considered to account for the stratified, multistage probability cluster sampling method. Complete case analysis was implemented for primary analysis unless missing data for specific analysis exceeded 10 % according to the NHANES analytical guidelines(Reference Johnson, Paulose-Ram and Ogden16). When missing data exceeded 10 %, the original sampling weights of the respondent sample were adjusted using a weight factor that accounted for the differences between respondents and non-respondents, based on the Lohr’s method(Reference Särndal, Swensson and Wretman17). A post hoc analysis revealed sex and racial/ethnic differences between individuals with missing data and those without; age and education attainment did not differ between the two groups (online Supplementary eTable 1). Participants were therefore classified into eight subgroups defined by sex (men and women) and race/ethnicity (non-Hispanic Black, non-Hispanic White, Hispanic and other)(Reference Gregg, Sorlie and Paulose-Ram18). The weight factor for each subgroup was calculated as the sum of the weights for all eligible individuals (including those with missing data) divided by the sum of the weights for those with complete data. The adjusted sampling weight for each respondent in a subgroup was then multiplied by the subgroup weight factor. A sensitivity analysis using multiple imputations was also conducted to assess the robustness of the prevalence estimates in the presence of missing data ≥ 10 %. We employed PROC MI procedure in SAS (v 9.4) and used the fully conditional specification method(Reference Lee and Carlin19). The following covariates were included: age, sex, race/ethnicity, education level, estimated glomerular filtration rate, urine albumin-to-creatinine ratio and chronic kidney disease status. All missing values were assumed to be missing at random. All analyses were conducted using SAS statistical software, version 9.4 (SAS Institute Inc.).
Results
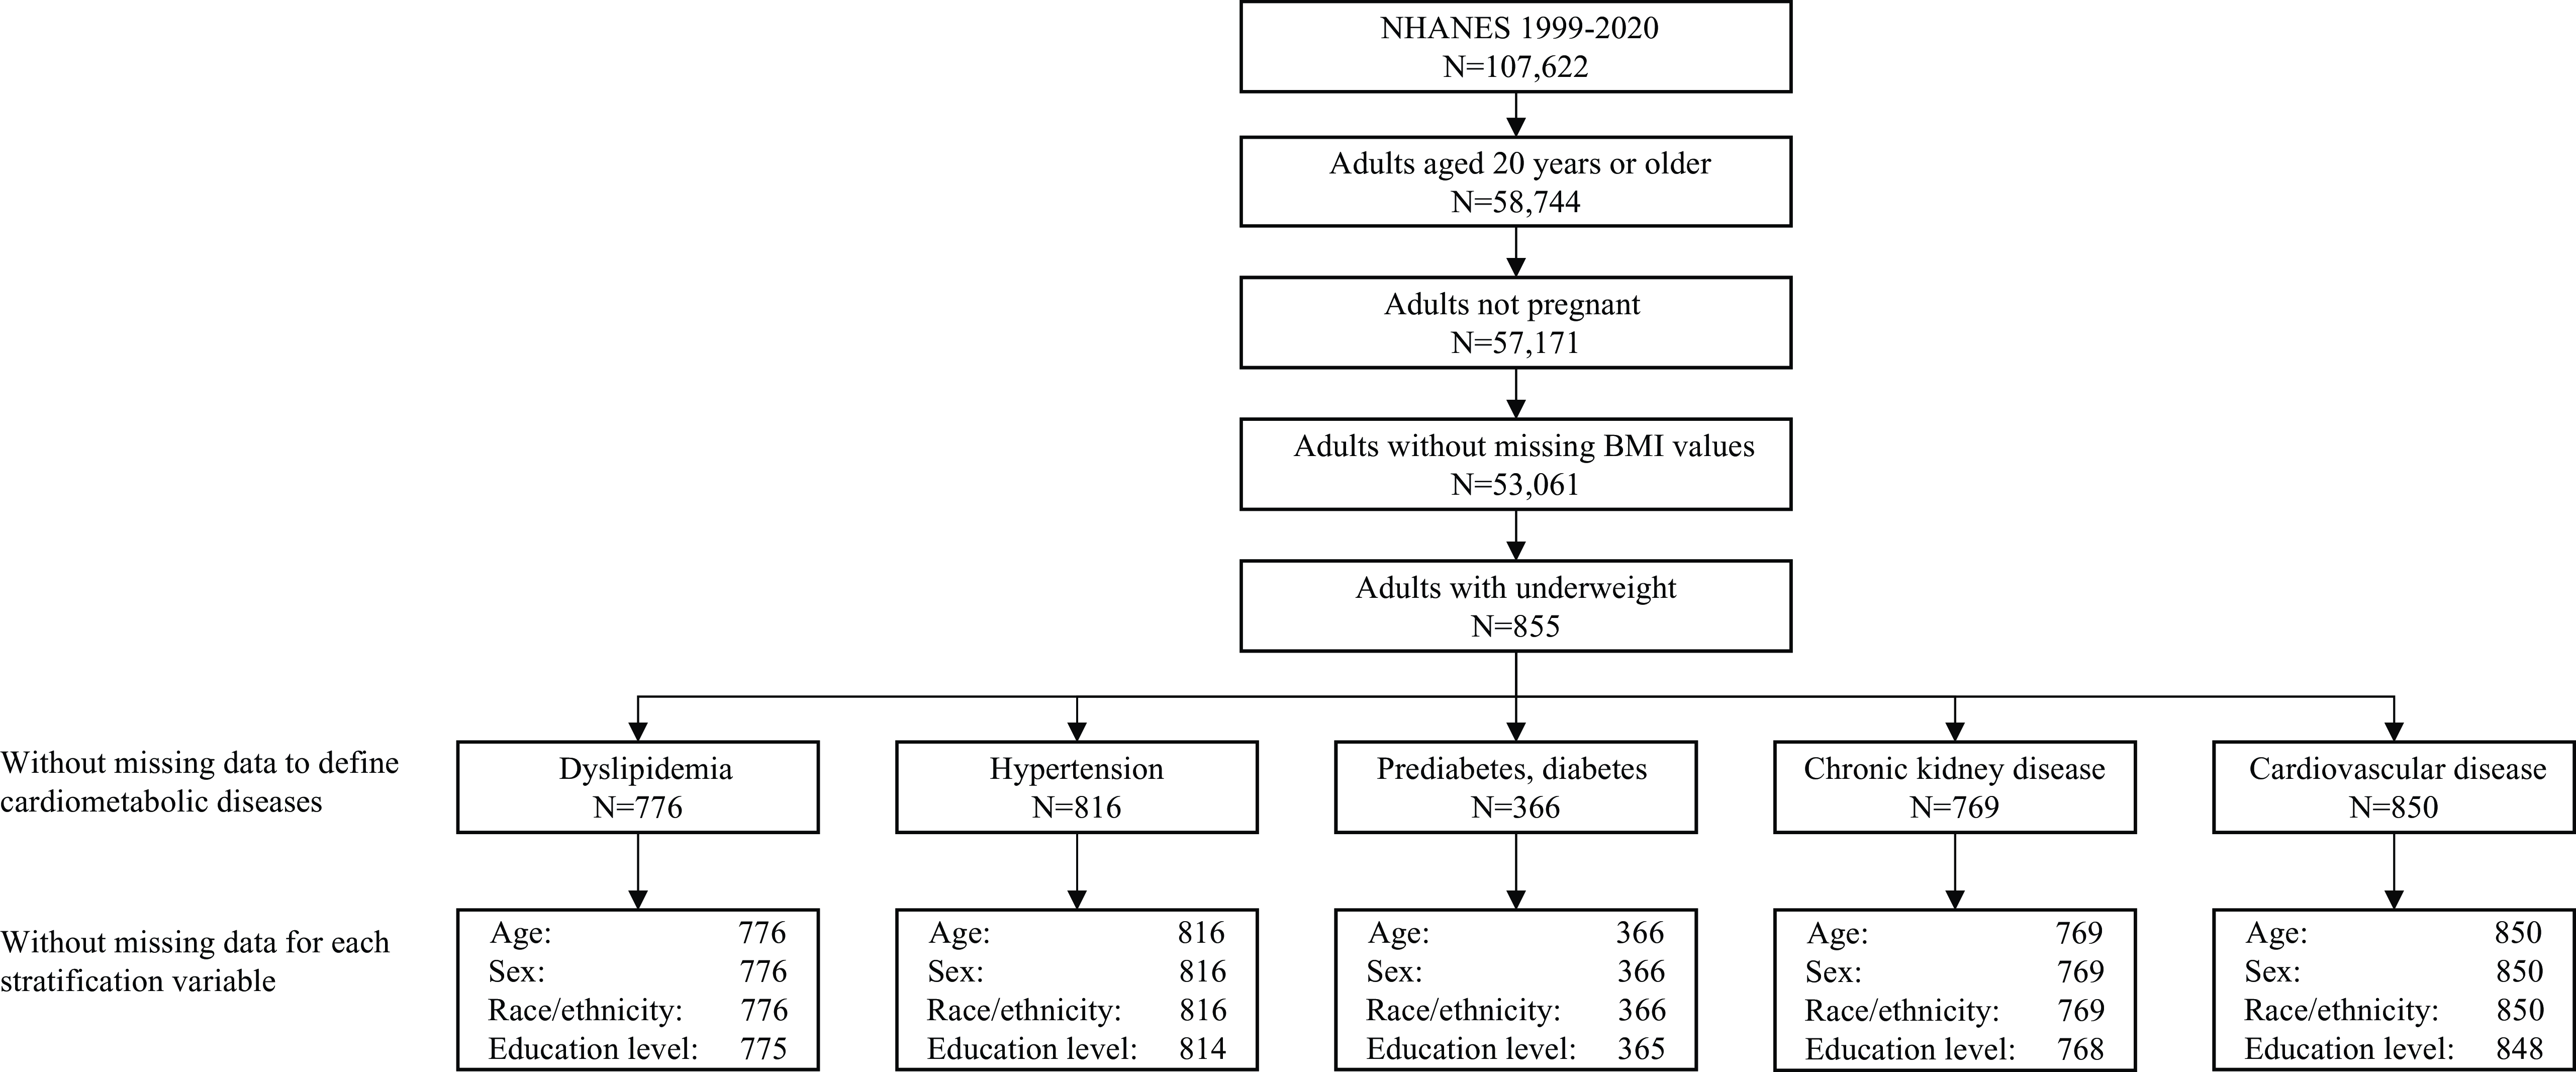
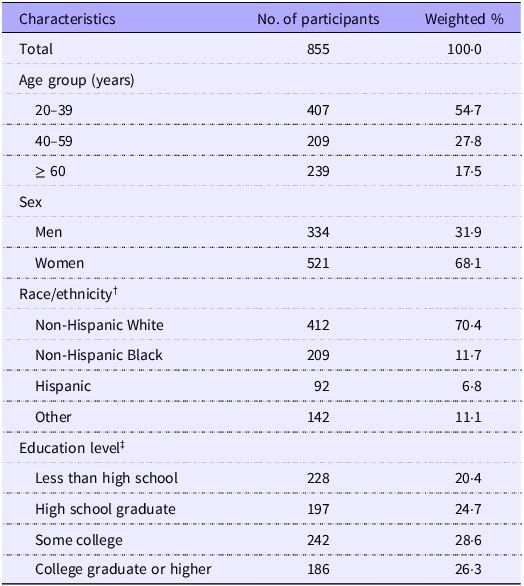
A total of 855 participants with underweight were analysed. Specific sample size for each outcome varied (Fig. 1). The weighted mean age was 40·8 years (se, 0·6), 68·1 % were women and 70·4 % were non-Hispanic White (Table 1). Missing data were found for dyslipidemia (n 79 (9·2 %)), hypertension (n 39 (4·6 %)), chronic kidney disease (n 86 (10·0 %)) and CVD (n 5 (0·6 %)). For stratification variables, missing data were found only for education (n 2 (0·2 %)).

Figure 1. Flow chart of the study sample.
Table 1. Characteristics for adults with underweight *

* Underweight was defined as having BMI < 18·5 kg/m2.
† Race/ethnicity was self-reported. The ‘other’ group included other non-Hispanic races or multiple races.
‡ Two participants refused to report or did not know their education level.
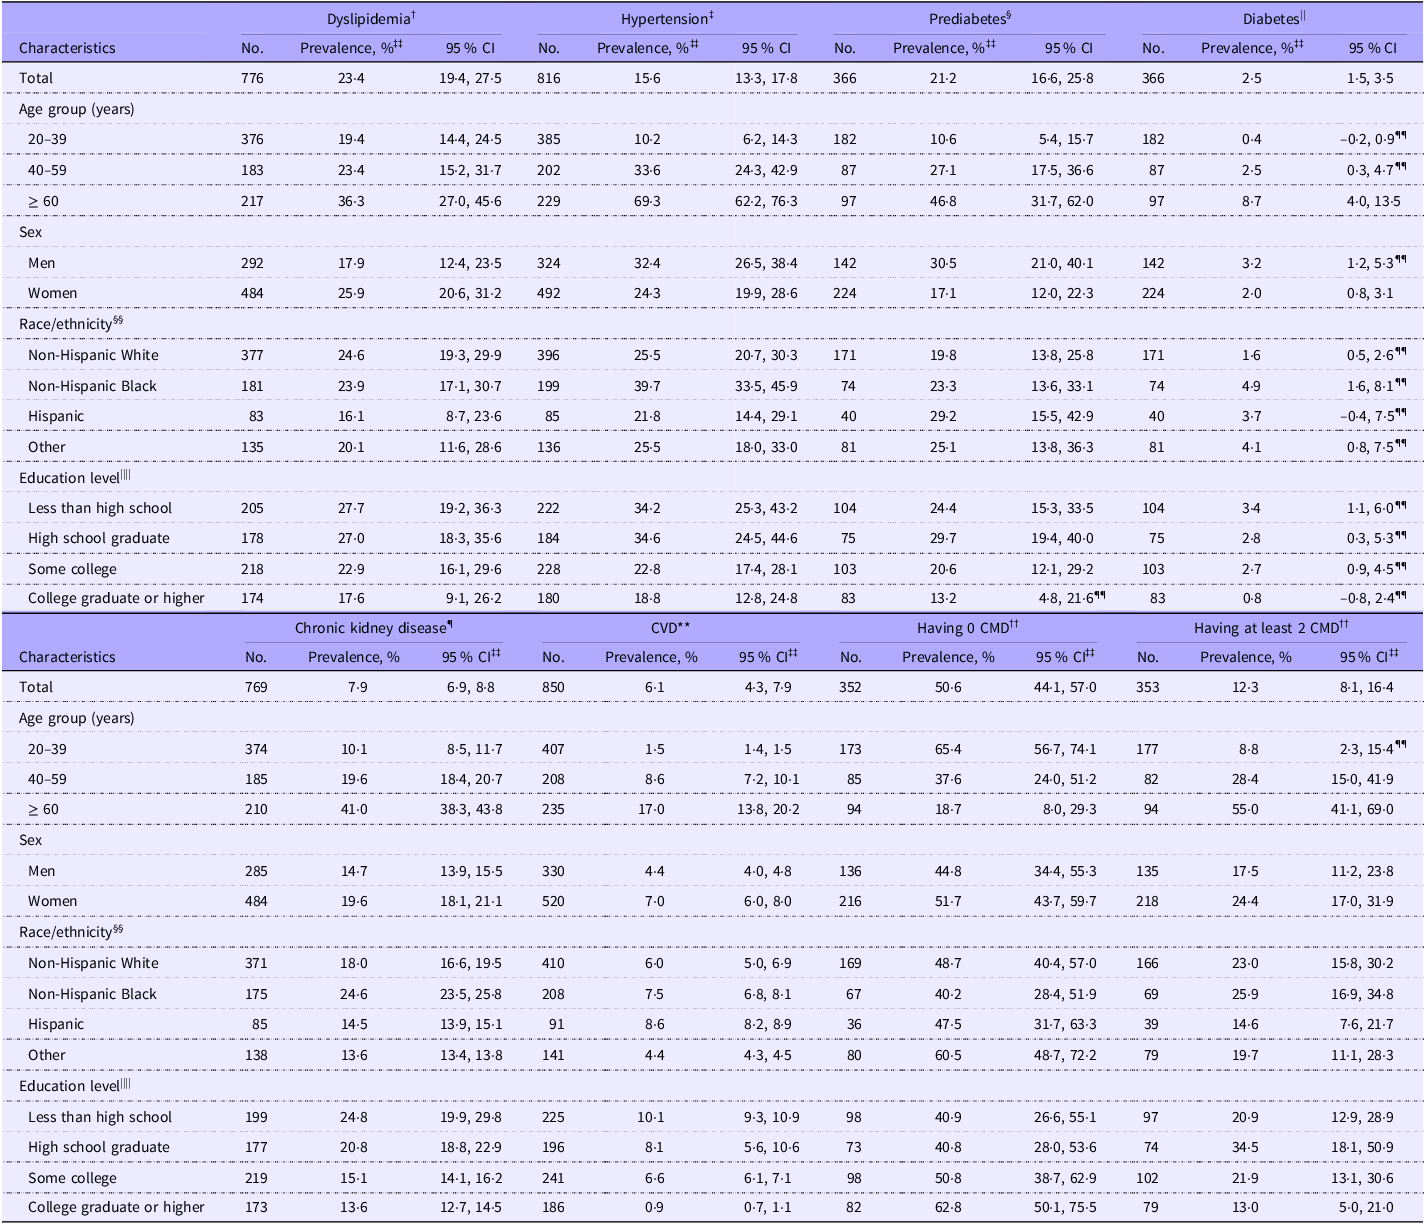
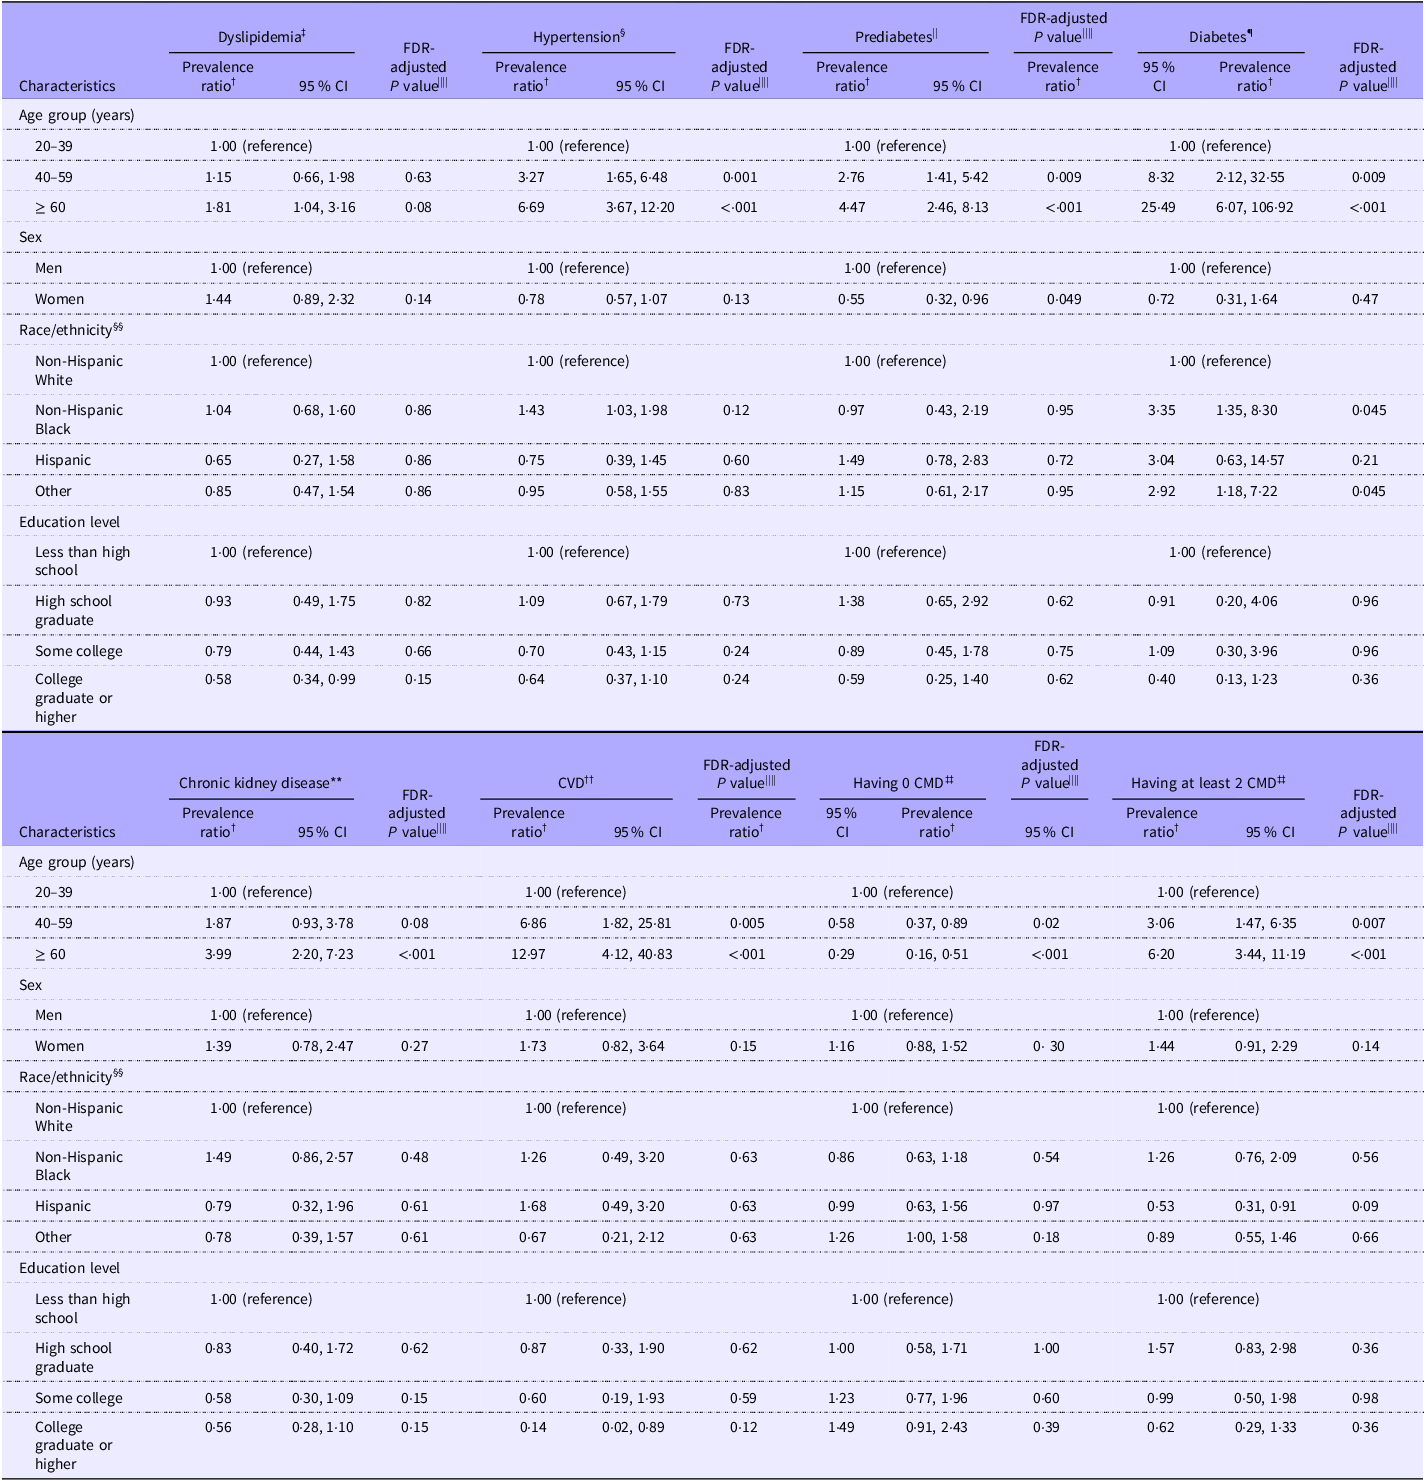
The estimated prevalence of each CMD among adults with underweight was 23·4 % (95 % CI 19·4 %, 27·5 %) for dyslipidemia, 15·6 % (95 % CI 13·3 %, 17·8 %) for hypertension, 21·2 % (95 % CI 16·6 %, 25·8 %) for prediabetes, 2·5 % (95 % CI 1·5 %, 3·5 %) for diabetes, 7·9 % (95 % CI 6·9 %, 8·8 %) for chronic kidney disease and 6·1 % (95 % CI 4·3 %, 7·9 %) for CVD (Table 2). The estimated prevalence of having zero and at least two CMD was 50·6 % (95 % CI 44·1 %, 57·0 %) and 12·3 % (95 % CI 8·1 %, 16·4 %), respectively. Regarding the subgroup results, the prevalence of all CMD was significantly higher in older adults aged at least 60 years than young adults aged 20–39 years, except for dyslipidemia (PR 1·81 (1·04, 3·16), FDR-adjusted P = 0·08) (Table 3). No sex difference in the prevalence of CMD was identified. Racial/ethnic difference in the prevalence of CMD was only found for diabetes. Non-Hispanic Black adults had a significantly higher prevalence of diabetes (PR 3·35 (95 % CI 1·35, 8·30), FDR-adjusted P = 0·045) than non-Hispanic White adults. The prevalence of having zero CMD was significantly lower in older and middle-aged adults than young adults. The prevalence of having at least two CMD was significantly higher in older and middle-aged adults than young adults. No significant difference in the prevalence of composite CMD outcomes by sex, race or education level was identified.
Table 2. Prevalence of cardiometabolic diseases among adults with underweight* (Percentages and 95 % confidence intervals)

CMD, cardiometabolic diseases.
* Underweight was defined as BMI < 18·5 kg/m2.
† Dyslipidemia was defined as having a total cholesterol level ≥ 240 mg/dl or a HDL-cholesterol level < 40 mg/dl for men or < 50 mg/dl for women or self-reported current use of lipid-lowering drugs.
‡ Hypertension had blood pressure ≥ 130/80 mm Hg or self-reported current use of antihypertensive drugs.
§ Prediabetes had a Hb A1c level of 5·7–6·4 % or a fasting plasma glucose level of 100–125 mg/dl among people without self-reported diabetes.
|| Diabetes was defined as having a self-reported diagnosis of diabetes by a physician or other health professional, a fasting plasma glucose level ≥ 126 mg/dl or a Hb A1c level ≥ 6·5 %.
¶ Chronic kidney disease was defined as having a urine albumin-to-creatinine ratio ≥ 30 mg/g or an estimated glomerular filtration rate < 60 ml/min/1·73 m2.
** CVD was a composite endpoint of self-reported congestive heart failure, CHD, heart attack and stroke.
†† CMD included dyslipidemia, hypertension, diabetes, chronic kidney disease and CVD.
‡‡ Estimates by age group were unadjusted. Other estimates were age-standardised to the 1999–2020 National Health and Nutrition Examination Survey non-pregnant adult population with underweight, using the age groups 20–39 years, 40–59 years and 60 years or older.
§§ Race/ethnicity was self-reported. The ‘other’ group included other non-Hispanic races or multiple races.
|||| Participants refused to report or did not know their education level for the analysis of dyslipidemia (n 1), hypertension (n 2), prediabetes (n 1), diabetes (n 1), chronic kidney disease (n 1), CVD (n 2), having 0 CMD (n 1) and having at least 2 CMD (n 1).
¶¶ Relative standard error ≥ 30 %.
Table 3. Subgroup differences in the prevalence of CMD among adults with underweight* (Prevalence ratio and 95 % confidence intervals)

CMD, cardiometabolic diseases; FDR, false discovery rate.
* Underweight was defined as BMI < 18·5 kg/m2.
† Prevalence ratio was estimated using Poisson regressions, adjusting for age, sex and race/ethnicity when appropriate.
‡ Dyslipidemia was defined as having a total cholesterol level ≥ 240 mg/dl or a HDL-cholesterol level < 40 mg/dl for men or < 50 mg/dl for women or self-reported current use of lipid-lowering drugs.
§ Hypertension had blood pressure ≥ 130/80 mm Hg or self-reported current use of antihypertensive drugs.
|| Prediabetes had a Hb A1c level of 5·7–6·4 % or a fasting plasma glucose level of 100–125 mg/dl among people without self-reported diabetes.
¶ Diabetes was defined as having a self-reported diagnosis of diabetes by a physician or other health professional, a fasting plasma glucose level ≥ 126 mg/dl or a Hb A1c level ≥ 6·5 %.
** Chronic kidney disease was defined as having a urine albumin-to-creatinine ratio ≥ 30 mg/g or an estimated glomerular filtration rate < 60 ml/min/1·73 m2.
†† CVD was a composite endpoint of self-reported congestive heart failure, CHD, heart attack and stroke.
‡‡ CMD included dyslipidemia, hypertension, diabetes, chronic kidney disease and CVD.
§§ Race/ethnicity was self-reported. The ‘other’ group included other non-Hispanic races or multiple races.
|||| P values were adjusted using FDR method to control the type I error for multiple comparisons in subgroup differences.
Post hoc analyses showed that adults with underweight had the highest prevalence of chronic kidney disease among all weight categories (all P < 0·01). No significant difference in the prevalence of CVD was found across weight categories (all P > 0·05) (online Supplementary eTable 2). Among adults with underweight, the prevalence of all CMD was significantly lower in those who met the physical activity guideline recommendation than those who did not meet. The prevalence of all CMD, except for diabetes, was significantly lower in never smokers than former or current smokers (online Supplementary eTable 3). Adults with healthier lifestyle behaviours (e.g. non-excessive drinking, meeting physical activity guidelines, never smoking and not low diet quality) had a significantly higher prevalence of having zero CMD than that in their counterparts (all P < 0·05). No significant difference in the prevalence of all CMD, except for CVD, was found between those who met the recommended sleep duration and those who did not.
The prevalence of chronic kidney disease among adults with underweight using different missing data handling methods was similar. Compared with complete case analysis, only small differences in the point estimates were found using adjusted weights (≤ 0·3 %) and multiple imputations (≤ 1·4 %) (online Supplementary eTable 4).
Discussion
Among adults with underweight in the USA, only 50·6 % had absence of CMD and 12·3 % lived with at least two CMD. Diabetes and hypertension disproportionately affected non-Hispanic Blacks. The prevalence of CMD was higher in older than younger adults but did not vary by education level. No sex difference was observed.
Adults with underweight are commonly perceived as having a low burden of CMD, but our results did not support this. In our study, only half of adults with underweight had no CMD. Of all the CMD examined, the prevalence of dyslipidemia was the highest achieving about 23 %, followed by hypertension of about 16 %, while the prevalence of diabetes was relatively low. Published studies that reported the prevalence of CMD often merged the underweight adults into the normal-weight group(Reference Gujral, Weber and Staimez20,Reference Brown, Higgins and Donato21) and rarely estimated the prevalence of CMD in underweight separately(Reference Holmes, Hossain and Ward22,Reference Khan, Ning and Wilkins23) . Only one study conducted specifically among US adults with underweight was identified based solely on self-reported data, reporting a prevalence of CVD of 7·3 % in 2013, similar to the estimate from our study(Reference Park, Lee and Han24). The high prevalence of CMD in the underweight population implies that being underweight does not necessarily mean being cardiometabolically healthy(Reference Khan, Ning and Wilkins23). A cross-sectional study found that nearly 20 % of the underweight population were classified as metabolically abnormal, defined as having two or more criteria of metabolic syndrome(Reference Gao, Zhang and Zhao25). Ectopic fat deposition in the liver and pancreas may confer a large role on the development of CMD in the underweight population(Reference Thomas, Parkinson and Frost26).
Similar to the findings from overweight and obese populations, multimorbidity of CMD was also common in underweight based on our study. Unhealthy lifestyle behaviours are well-established risk factors for CMD. Evidence has shown that unhealthy lifestyle behaviours may even cause more severe health problems in non-obese individuals, including those who were underweight, than obese adults(Reference Kikuchi, Monma and Ozawa27). In our study, the prevalence of CMD was highly prevalent among underweight adults with unhealthy lifestyle behaviours. Of all the lifestyle factors except for sleep duration, compared with underweight adults with a healthier lifestyle, those with a less healthier lifestyle had a 6–16 % higher prevalence of having at least two CMD. Despite the differential influences of each lifestyle factor, the findings suggest that targeting multiple unhealthy lifestyle behaviours may be needed for the prevention and management of CMD among adults with underweight.
Subgroup differences by demographic variables and socio-economic status in the prevalence of CMD were not as widely present in the underweight population as previously reported in general adult populations(Reference He, Zhu and Bundy28,Reference Gerdts and Regitz-Zagrosek29) , suggesting that the entire underweight group was at risk of developing CMD. This distinction suggests possibilities of different aetiologies and risk factor profiles for CMD between adults with underweight and those with overweight/obesity, which require future investigations to elucidate. Nonetheless, the disproportionate burden of diabetes in non-Hispanic Black adults with underweight was in line with the racial/ethnic disparities in diabetes well -described in general adult populations(Reference Ngo-Metzger30,Reference Kim, Kim and Conigliaro31) . Racial/ethnic disparities in the prevalence of CMD found in previous studies were largely due to racial/ethnic disparities in the prevalence of overweight and obesity, social risk factors and lifestyle behaviours(Reference Min, Goodale and Xue32,Reference Maraboto and Ferdinand33) . The NHANES data did not allow accurate classification of diabetes type, but it is possible that type 1 diabetes accounted for a substantial proportion. To understand pathophysiological mechanisms leading to CMD in underweight, it is critical to understand the causes of underweight itself. Unlike underweight mainly resulting from inadequate nutrition in many low- and middle-income countries, underweight in the USA may be multifactorial, including malnutrition, chronic diseases and a personal choice due to body image dissatisfaction, among others(Reference Furnham, Badmin and Sneade34). Effective prevention and management of CMD are not possible without correctly understanding the underlying causes of underweight.
Although the underlying contributors to the high prevalence of CMD in underweight populations are poorly understood, improving cardiometabolic health among underweight people is clearly an urgent public health need. Published data on characterising distributions of lifestyle risk factors in underweight are scarce. Our study found that underweight people who had a healthier lifestyle, including non-excessive drinking, more physical activity, never smoking and higher-quality diet, had a lower prevalence of various CMD. These findings suggest that improving lifestyle may be critical to improving cardiometabolic health in people with underweight as in people with overweight or obesity(Reference Kaminsky, German and Imboden35). Furthermore, evidence has shown that underweight individuals tended to have lower cardiorespiratory fitness compared with those with normal weight(Reference Nikolakaros, Vahlberg and Auranen36,Reference Lee and Kim37) . Lower cardiorespiratory fitness is known to be associated with higher risks of CMD and mortality(Reference Lang, Prince and Merucci38,Reference Ross, Blair and Arena39) . Cardiorespiratory fitness can possibly be improved through reducing alcohol intake, eating healthy diet and increasing physical activity, especially resistance training(Reference Ross, Blair and Arena39–Reference Kaminsky, Lavie and Flint43), but these data may not be equally applicable to underweight people. Whether such lifestyle modifications would result in a similar improvement in cardiorespiratory fitness specifically in people with underweight requires further investigation.
Strengths and limitations
To our knowledge, this is the first study to comprehensively characterise the landscape of CMD in underweight, using both self-reported and laboratory data from a large nationally representative sample. However, this study has several limitations. First, misdiagnosis of CMD was possible due to the use of self-reported data and one-time laboratory measurements. Second, this was a cross-sectional study; thus, the causal relationship between underweight and CMD cannot be inferred. Third, because of the small sample size, several subgroup estimates had a relative standard error greater than 30 % and thus should be interpreted with caution. Fourth, missing data may have caused bias in some estimates, but we used both multiple imputations and weight adjustment approach to address missing data. Results from these two approaches were similar.
Conclusions
Contrary to the commonly assumed low burden of CMD in the underweight population, nearly half of adults with underweight had at least one CMD, and nearly one-eighth had at least two CMD. Screening of CMD in underweight population may be considered. More resources should be allocated to prevention and management of CMD in this understudied group.
Supplementary material
For supplementary material/s referred to in this article, please visit https://doi.org/10.1017/S0007114524002885
Acknowledgements
The authors would like to express our deepest appreciation to all who contributed to this study.
This study was supported by the Innovative Research Team of High-Level Local Universities in Shanghai.
Drs F. Z. and V. W. Z. had full access to all the data in the study and take responsibility for the integrity of the data and the accuracy of the data analysis. Concept and design: M. C., F. Z. and V. W. Z. Acquisition, analysis or interpretation of data: all authors. Drafting of the manuscript: M. C. and V. W. Z. Critical revision of the manuscript for important intellectual content: all authors. Statistical analysis: M. C. and V. W. Z. Administrative, technical or material support: F. Z. and V. W. Z.
All authors have completed the ICMJE uniform disclosure form at www.icmje.org/coi_disclosure.pdf and declare: support from the Innovative Research Team of High-Level Local Universities in Shanghai for the submitted work; no financial relationships with any organisations that might have an interest in the submitted work in the previous 3 years; no other relationships or activities that could appear to have influenced the submitted work.
The National Center for Health Statistics Research Ethics Review Board approved NHANES. All participants signed informed consent. Shanghai Jiao Tong University School of Medicine Public Health and Nursing Research Ethics Review Committee approved this study, approval number (SJUPN-202102-B).
The data that support the findings of this study are openly available at https://www.cdc.gov/nchs/nhanes/.


