During the last few decades there has been a trend in commercial fish feed formulations to increase dietary lipid levels in order to mainly enhance the protein-sparing effect and to improve growth performances and production. More recently, because of the limitation of worldwide fish oil supply, the partial or total replacement of fish oil by vegetable oils is increasingly widespread in fish feed production. However, the use of high-energy diets is known to have a direct influence on the fat deposition in fish, depending on species and age(Reference Bell, McEvoy, Webster, McGhee, Millar and Sargent1, Reference Regost, Arzel, Cardinal, Robin, Laroche and Kaushik2). Eurasian perch (Perca fluviatilis L.) is a carnivorous species classified as a lean fish, and wild specimens are known to store energy supply mainly as perivisceral fat while muscles contain very little fat, ranging between 1 and 2 %(Reference Sulistyo, Rinchard, Fontaine, Gardeur, Capdeville and Kestemont3–Reference Blanchard, Druart and Kestemont5). However, in culture conditions, percid species are fed diets formulated for salmonids(Reference Brown, Dabrowski and Garling6, Reference Mélard, Kestemont and Grignard7) or European sea bass(Reference Fontaine, Gardeur, Kestemont and Georges8). Pale and fatty livers as well as unexplained mortality in juvenile production when fed such high-energy diets have been reported(Reference Kestemont, Vandeloise, Brown, Mélard, Fontaine, Creswell and Harache9–Reference Xu, Fontaine, Mélard and Kestemont12).
Numerous causes are listed in the literature to explain the accumulation of lipids, particularly in the liver, which may eventually cause hepatic steatosis. This condition is described as the presence of lipid microvesicles inside the nucleus and in the lumen of both smooth and rough endoplasmic reticulum (RER). A fatty liver can be the consequence of an imbalanced diet(Reference Bautista and De la Cruz13–Reference Caballero, Lòpez-Calero, Socorro, Roo, Izquierdo and Fernàndez15), a deficiency in dietary fatty acids(Reference Ibeas, Izquierdo and Lorenzo16), lipid peroxidation(Reference Bell, Tocher, MacDonald and Sargent17) or inadequate culture conditions. However, few studies have examined the simultaneous effects of multiple parameters on lipid liver accumulation.
The liver fulfils numerous functions among which some are related to metabolism, detoxification, digestion or excretion. Lipid assimilation, and glycogen and fat supply management are essential roles played by the organ. According to the principle of the relationship and mutual interaction between structure and function, an alteration of liver structure may be expected to also imply an alteration of liver function(Reference Hinton, Lantz, Hampton, McCuskey and McCuskey18). So, structural alterations of liver can provide information on the diet quality, diet metabolism and nutritional status of the fish(Reference Escaffre and Bergot19).
Until now, fish liver ultrastructure has been mainly investigated in ecotoxicological studies(Reference Braunbeck, Storch and Nagel20–Reference Quabius, Nolan, Balm and Wendelaar Bonga25), but, to our knowledge, very few investigations have been performed using aquaculture-based studies(Reference Caballero, Lòpez-Calero, Socorro, Roo, Izquierdo and Fernàndez15, Reference Segner, Arend, Von Poeppinghausen and Schmidt26, Reference Rodríguez, Gisbert, Rodríguez and Castelló-Orvay27). Based on a multifactorial fractional design, the aim of the present study was to identify, among twelve nutritional and husbandry factors, those that influence ultrastructure hepatocytes in intensively cultured Eurasian perch both individually, and through interactions.
Materials and methods
Experimental design and diets
Among numerous factors that are likely to influence the aquaculture system, twelve factors of influence were tested in a fractional factorial experimental design(Reference Box, Hunter and Stuart28–Reference Ruohonen, Kettunen, King, Houlihan, Boujard and Jobling30). The fractional factorial experimental design has already been applied to the study of fish nutrition and reproduction in fish(Reference Torstensen, Lie and Hamre31–Reference Gardeur, Mathis, Kobilinsky and Brun-Bellut35). Factors and the two tested levels of each factor (Table 1) were defined from data available in the literature(Reference Mélard, Kestemont and Grignard7, Reference Fontaine, Gardeur, Kestemont and Georges8, Reference Kestemont, Vandeloise, Mélard, Fontaine and Brown10, Reference Xu, Fontaine, Mélard and Kestemont12, Reference Mathis, Feidt and Brun-Bellut36). Temperature, feeding level, diet lipid content, dietary protein and lipid sources, astaxanthin enrichment (Ast), target density, daily distribution frequency, CV of initial weight, photoperiod, light colour and weekly distribution frequency were tested with high or low level (+1 and − 1) in twenty-four tanks (Table 2).
Table 1 Twelve factors and their levels tested in the fractional factorial experiment with juvenile Eurasian perch (Perca fluviatilis L.)

Table 2 Twenty-four experimental combinations tested in the fractional factorial experiment with juvenile Eurasian perch (Perca fluviatilis L.)

Combi, combinations; Temp, temperature at 23 or 16°C; FL, optimal (opt) or maximal (max) feeding level; Lip, lipid content at 21 or 17 % of lipid in the diet; PS and LS, protein and lipid sources with fishmeal (F) or fish+soya meal (FV) and menhaden oil (F) or rapeseed oil (V), respectively; Ast, astaxanthin enrichment with 0 % (O) or 0·4 % (T); Dens, fish density at 4 kg/m3 (4) or 12 kg/m3 (12); DDF, daily distribution frequency, two times per d (2) or continuously (C); Het, initial weight heterogeneity at 30 or 15 %; Pho, photoperiod with 16 h light (16) or 8 h light (8) per d; LSpect, light spectrum with industrial white (I) or violet (V); WDF, weekly distribution frequency all days of the week (7) or 6 d of the week (6).
Each of the twenty-four tanks is the illustration of one unique combination under the 4096 possibilities in case of full factorial design (212). This fractional factorial experimental design of resolution IV permits an independent estimation of the constant term and the main effects of the factors as well as estimation by group of two-factor interactions(Reference Kobilinsky, Droesbeke and Fine37, Reference Chen and Cheng38). The resolution IV used here was obtained by doubling its opposite, i.e. the resolution III of Plackett & Burman's design with twelve units at two levels(Reference Box, Hunter and Stuart28, Reference Kobilinsky and Monod39). In practice, we detected discrepancies between sixteen ordered foods and the sixteen actually provided by the supplier (data not shown), and so the twenty-four combinations tested were slightly different from the ones planned (experimental matrix in Table 2). This thus resulted in the loss of both orthogonality and IV resolution. Consequently, factor effect coefficients were dependent, their estimation was less precise (CI higher) and the main effects are confounded with interactions. Consequently, the interpretation of the effect of the main factors will be realised in the form of hypotheses according to the probability that they correspond to main effects alone or to main effects confused with groups of interactions.
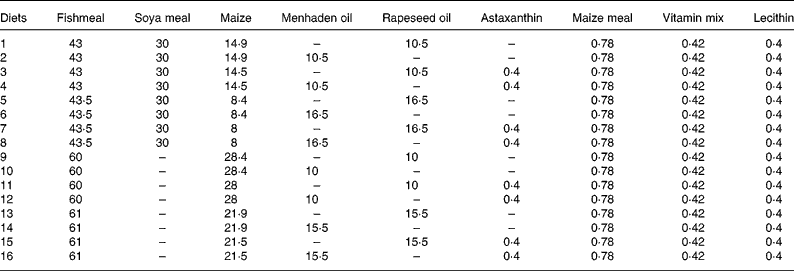
The design used four two-level diet factors (24 combinations), i.e. sixteen different isoproteic diets: the lipid content, the lipid source, the protein source and the Ast (Table 3). Diets (extruded pellets of 3 mm) were produced by BioMar (Nersac, France). Fish were fed, according to the experimental design, continuously between 07.00 and 17.00 hours or twice daily at 07.00 and 16.00 hours, by automatic feeders. The feeding levels were established at 22·45 (optimal feeding) and 30·67 % (maximal feeding) of body weight− 0·68(Reference Mélard, Kestemont and Grignard7, Reference Mathis, Feidt and Brun-Bellut36).
Table 3 Composition (%) of the sixteen different diets used in the fractional factorial experiment with juvenile Eurasian perch (Perca fluviatilis L.)
Fish and facilities
Before the experiment, Eurasian perch (P. fluviatilis) juveniles originating from the Centre of Education and Research in Aquaculture (Tihange, Belgium) were reared in a recirculating system under the following conditions: temperature 20–24°C; dissolved O2 7·5 and 9·5 mg/l; 12 h light–12 h dark photoperiod. Fish were fed by hand with a commercial diet (TROUVIT Classic; Fontaine Les Jervins, France) twice daily, at an optimal feeding level(Reference Mélard, Kestemont and Grignard7). The experiment was conducted during 15 weeks at the Animal Functionality of Animal Products Research Unit (Nancy University, Nancy, France). A single batch of 804 fish weighing between 30 and 85 g (average weight 57·6 (sd 14·4) g) was graded into eleven weight classes of 5 g. From these classes, 536 fish were allocated into twenty-four experimental units (tanks) in such a way that tanks contained fish of the same initial average weight, low or high initial weight heterogeneity and low or high target total biomass (twenty-five or forty-two fish per tank, respectively). The twenty-four tanks of 0·5 m3, each operating independently as a recirculating system, were made with light blue polyvinyl chloride (PVC). They were distributed into four experimental rooms. Water temperatures were maintained either at 16°C (air-conditioned rooms) or at 23°C (heating resistors). All tanks were covered with opaque cages 80 cm high to protect fish against external light and disturbances. At the top of each experimental unit were placed a band automatic feeder and an individual light (industrial white or violet). Fish were exposed to an 8 h light and 16 h dark or a 16 h light and 8 h dark photoperiod according to the experimental design.
Sampling procedure
At the beginning of the experiment and every 5 weeks until the end of the experiment, biomass and average weight were determined by bulk weighing and counting of all fish in each tank. This manipulation was also necessary in order to adjust the feeding level, as a percentage of biomass. During rearing, water temperature and O2 content were monitored daily after the first feeding period. Ammonium ion and nitrites (![]() and
and ![]() ) were measured twice per week(Reference Eaton, Clesceri and Greenberg40) and nitrate and phosphate contents weekly. Mortalities were recorded and dead fish removed daily. At the end of experiment (116 d), individual measurements were carried out on fifteen fish per tank chosen at random from each tank and for which the final fresh weight was included in the interval of the average ± 2 sd. Fish were immediately killed by cold shock combined with overdose of anaesthetic (i.e. phenoxy-ethanol; 3 ml/l), weighed (g) and dissected. The hepatosomatic index (I H), gonadosomatic index (I G) and liposomatic index (morphological criteria) were calculated as:
) were measured twice per week(Reference Eaton, Clesceri and Greenberg40) and nitrate and phosphate contents weekly. Mortalities were recorded and dead fish removed daily. At the end of experiment (116 d), individual measurements were carried out on fifteen fish per tank chosen at random from each tank and for which the final fresh weight was included in the interval of the average ± 2 sd. Fish were immediately killed by cold shock combined with overdose of anaesthetic (i.e. phenoxy-ethanol; 3 ml/l), weighed (g) and dissected. The hepatosomatic index (I H), gonadosomatic index (I G) and liposomatic index (morphological criteria) were calculated as:
where y is the index, M is the mass (g) of the fish, and x is the mass (g) of the liver, gonad or perivisceral fat (compacted fat was easily collected around the digestive tract).
Specific growth rate (%/d) was calculated as follows:
where W i and W f are initial and final weights (g), respectively, and ΔT is the duration of the experiment (d).
Samples of diets (5 g) and muscles were stored frozen under vacuum at − 80°C before analysis. The livers of three females per tank were randomly harvested for electron microscopy analysis.
Analytical procedures
Muscle samples were ground and homogenised. Total lipids from diets and from muscles were extracted in duplicate with dichloromethane–methanol (2:1, v/v) according to Folch et al. (Reference Folch, Lees and Sloane Stanley41) modified according to Chen et al. (Reference Chen, Shen and Sheppard42). An antioxidant (butylhydroxytoluene) was added at 0·01 % during the analysis to avoid peroxidation. The fatty acids of total lipids were converted to methyl esters by acid-catalysed transmethylation according to Santha & Ackman(Reference Santha and Ackman43) and analysed by GC (GC trace, Varian, 3400) using a 30 m × 0·25 mm capillary column (DB-Wax). The carrier gas was He (0·9 ml/min) and temperature programming was from 180 to 240°C at 4°C/min, and then during 10 min at 240°C. The injection and detection temperatures were 260 and 250°C, respectively. Peak identification and quantification were done in a calibrated plotter integrator by comparing with known reference standards (Sigma). Crude protein content of diets was determined using the Kjeldahl method (N × 6·25).
Tissue preparation
Liver specimens were randomly harvested from three additional females of each tank in order to analyse the hepatocyte ultrastructure. In each liver, more than ten random samples were minced to 1 mm3 blocks in 2·5 % glutaraldehyde in 0·1 m-cacodylate buffer (pH 7·4). The blocks were fixed for 150 min at 4°C, rinsed three times (60 min) in 0·2 m-cacodylate buffer, post-fixed for 60 min in 1 % osmium tetroxide (OsO4) prepared in cacodylate buffer, washed three times (30 min) in 0·1 m-cacodylate buffer (pH 7·4), placed at 4°C overnight, dehydrated through a graded series of ethanol, cleared in propylene oxide and embedded in LX 112. Thick sections (about 2 μm) of embedded tissue from two blocks from the three females of each tank were prepared on an LKB pyramitome, mounted on glass slides, and stained with 1 % toluidine blue for light microscopy. Thin sections were cut at approximately 50 nm on a LKB ultramicrotome and mounted on 200 mesh, uncoated, Cu–Pd grids. The sections were counterstained with uranyl acetate 4 % (prepared in 50 % ethanol) and lead citrate, and examined with a Philips Tecnai electron microscope. Sixty electron micrographs per tank were obtained from a randomly selected area per grid (two grids per block, two blocks per female and three females per tank). Each micrograph was subsequently examined to obtain measures of organelle numbers and/or areas that provide an estimate of the organelle importance according to treatments. Results are expressed as number of lipid droplets per micrograph (nld), mean area of lipid droplet per micrograph (ald; μm2), total area of lipid droplets per micrograph (tld) (tld = nld × ald (μm2)), area of glycogen per micrograph (agly; μm2), area of RER per micrograph (arer; %), number of mitochondria per micrograph (nmit) and mean area of mitochondria per micrograph (amit; μm2). The micrograph surface was 320 μm2 with constant magnification. Organelles were semi-quantified and measured using a soft imaging system (AnalySIS 3.0; AnalySIS GmbH, Munster, Germany). Automatic identification of lipid droplets and glycogen particles was made after the definition of an amplitude variation on colour pixels as well as of a minimum size particles to take into account. Because of the very similar grey tonality between some organelles and cytoplasm, the analysis of mitochondria was done manually with the help of a graphics tablet and pen (Wacom Intuos 2 Model XD-0912-U; Wacom Europe GmbH, Krefeld, Germany). Finally, in order to evaluate the area of RER, a grid of 320 squares of 1 μm2 was virtually superimposed on the electron micrograph. Evaluation of RER area was made by counting the number of squares containing at least 50 % of the organelle.
Statistical analysis
Statistical analyses were carried out with Analys software(Reference Kobilinsky44). The detection of the potentially active effects of tested factors on the output variables was given by Daniel's graphics (half normal probability plot of basal estimation function)(Reference Daniel45) using an oversaturated model of variance analysis. An ANOVA was next performed, setting the potential influent factors for each variable as part of the model and calculating the reference mean square results from the non-active contrasts (P < 0·05). The Results present the effects of factors and their interactions. The impact of the factor on the measured variable expressed in percentage of variability (R 2) is indicated and followed by the significance of the test (significant effect with P < 0·05; highly significant effect with P < 0·01; very highly significant effect with P < 0·001). Levels and their correspondences are presented in Table 1.
Results
Description of ultrastructural hepatocyte features
The twenty-four factor combinations tested in the present experiment generated a wide range of hepatic features. Parenchymal cells were preserved or degenerated and unstructured. Nuclei were generally round and contours smooth with intermembrane spaces not inflated or deformed with inflated intermembrane spaces. Nuclei were generally centrally located in the hepatocyte with a single nucleolus, but intermediate or opposite situations occurred with nuclei located at the periphery of the hepatocyte. Content of RER in the parenchymal cells ranged between 0·7 and 14·7 % of the micrograph surfaces (Fig. 1 (A) and (B)). The RER was arranged usually in parallel stack cisternae around the nucleus. Sometimes cisternae were inflated (Fig. 1 (C)) or very inflated without parallel organisation. Vesicular RER distributed in clusters in the cytoplasm was also observed. Mitochondria were distributed throughout the cytoplasm, elongated or rounded, sometimes inflated with a pale matrix and often surrounded by a circle of RER. Mitochondria could be found in contact with myelinoid formations corresponding to a type of mitochondria degeneration. Number and mean area of this organelle ranged between 14 and 67, and 0·16 and 0·40 μm2, respectively (Fig. 1 (D) and (C)). Glycogen was aggregated in the cytoplasm forming large concretions ranging between 18·1 and 127·5 μm2 of the parenchymal cell surfaces. Lipid could be found as small- to medium-sized droplets interspersed with the organelles in the parenchymal cells, or nearly filling the cytoplasm of the cells (Fig. 1 (B) and (A), respectively). The tld ranged between 1·4 and 106·3 μm2. In the case of the highest area, other organelles were usually crushed at the periphery of the hepatocytes or simply absent. Some abnormal intranuclear inclusions of lipid droplets were also observed (Fig. 1 (D)). Figure 1 (E) shows the possible fusion between lipid droplets in the cytoplasm. Results illustrated the plasticity of perch liver, ranging, in rearing conditions, from typical cytological features of wild fish to the so-called fat-storing cells.

Fig. 1 Electron micrograph of female juvenile Eurasian perch (Perca fluviatilis L.) hepatocytes reared under the combination of twelve nutritional and husbandry factors. (A) Hepatocytes with low content of rough endoplasmic reticulum (RER) and large lipid droplets (LD) nearly filling the cytoplasm. (B) Hepatocytes with a large content of RER arranged in parallel stack cisternae around the nucleus (N) and without lipid droplets. (C) Hepatocytes with RER cisternae and mitochondria (Mit) inflated. (D) Hepatocytes with numerous mitochondria not inflated and abnormal intranuclear inclusions of lipid droplets. (E) Hepatocytes with lipid droplets probably in fusion in the cytoplasm. Gly, glycogen; S, sinusoidal blood space.
Organelles undergoing most of the influences of the twenty-four combined experimental conditions applied in the present study were lipid droplets displaying CV equal to 99, 93 and 76 % for the tld, ald and nld, respectively. Results of arer also displayed high CV between combinations (67 %) followed, to a lesser extent, by agly, nmit and amit (39, 30 and 27 %, respectively).
Correlations between ultrastructural hepatocyte features themselves and biological variables
Each of the ultrastructural hepatocyte features may be related to the others. Positive significant correlation was established between the tld and the nld (r 0·79; P < 0·05; Fig. 2). Growth performance (specific growth rate) was positively correlated with the hepatic accumulation of lipid droplets (tld) (r 0·7; P < 0·05; Fig. 3 (A)). When lipid droplet accumulation increased (tld), I G decreased (r − 0·7; P < 0·05; Fig. 3 (B)) while liposomatic index increased (r 0·8; P < 0·05; Fig. 3 (C)). RER development (arer) was positively correlated with the I G (r 0·7; P < 0·05; Fig. 3 (D)).
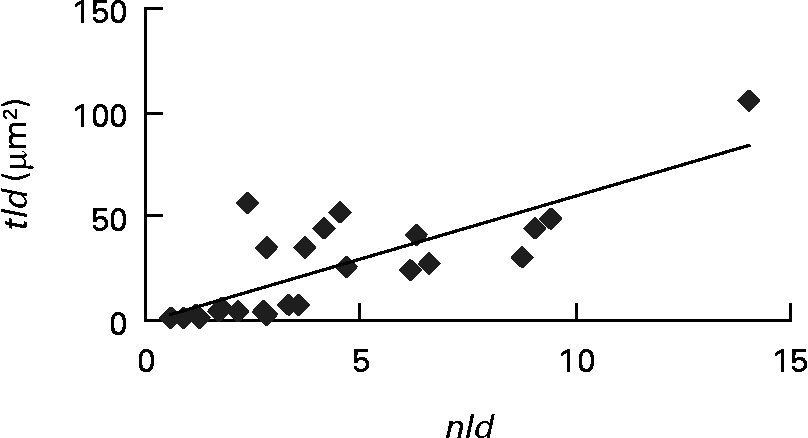
Fig. 2 Correlation (r 0·79; P < 0·05) between ultrastructural hepatocyte features of female Eurasian perch (Perca fluviatilis L.). nld, Number of lipid droplets per micrograph; tld, total area of lipid droplets per micrograph (tld = nld × ald (μm2) where ald is the mean area of lipid droplet per micrograph (μm2)).
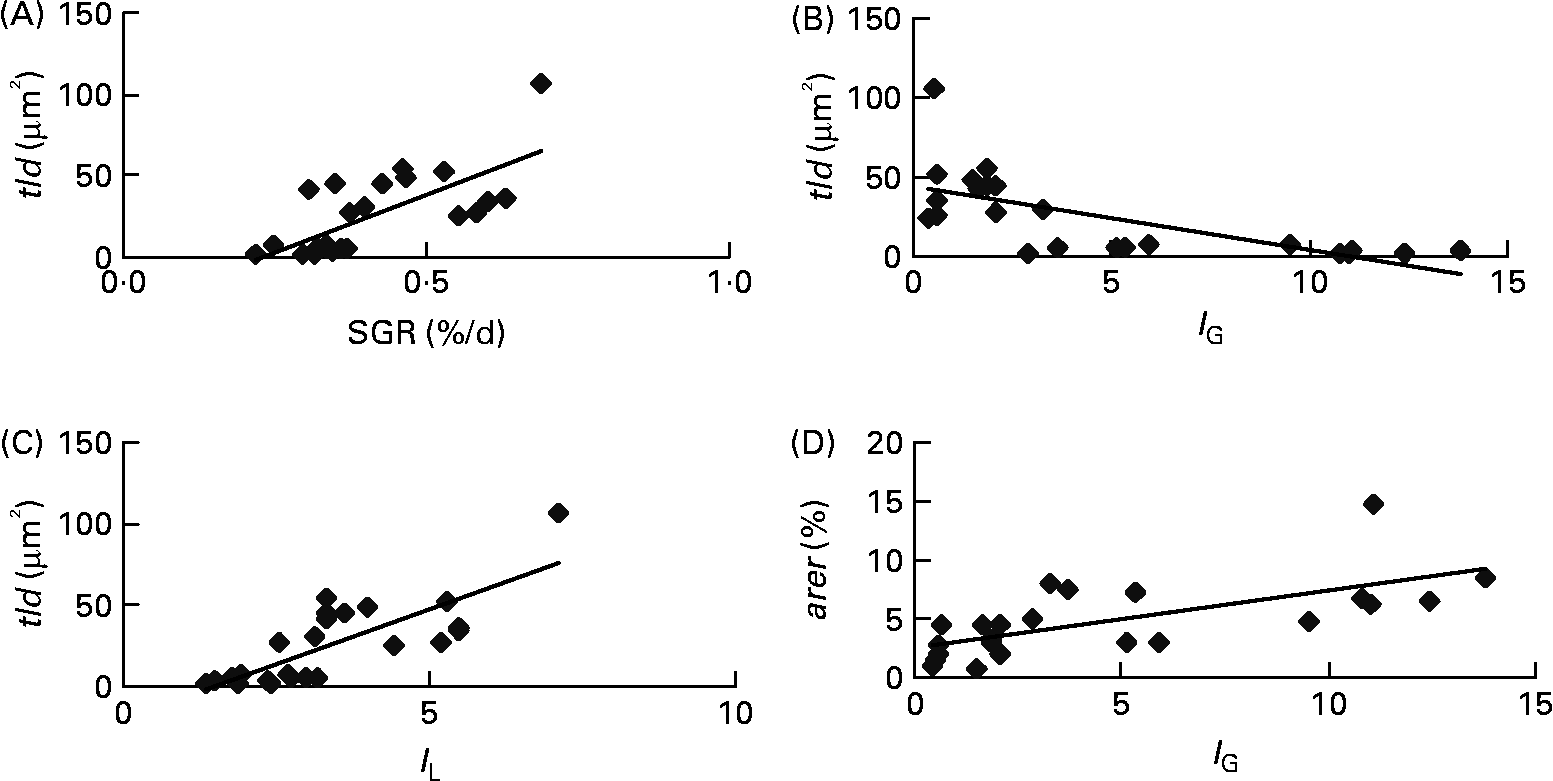
Fig. 3 Correlations between ultrastructural hepatocyte features and biological variables of female juvenile Eurasian perch (Perca fluviatilis L.). (A) Correlation of specific growth rate (SGR; %/d) and total area of lipid droplets per micrograph (tld) (r 0·7; P < 0·05). SGR = 100 × (Ln(W f) − Ln(W i))/ΔT, where W i and W f are the initial and final weights (g), respectively, and ΔT is the duration of the experiment (d); tld = nld × ald (μm2), where nld is the number of lipid droplets per micrograph and ald is the mean area of lipid droplet per micrograph (μm2). (B) Correlation of gonadosomatic index (I G) and tld (r − 0·7; P < 0·05). (C) Correlation of liposomatic index (I L) and tld (r 0·8; P < 0·05). (D) Correlation of I G and area of rough endoplasmic reticulum per micrograph (%) (arer) (r 0·7; P < 0·05). The I G and the I L (morphological criteria) are calculated as y = 100 × x/M, where y is the index, M is the mass (g) of the fish, and x is the mass (g) of the gonad or perivisceral fat.
Factor effects on hepatocyte ultrastructure
Among the twelve nutritional and husbandry factors tested, rearing temperature was by far the one that most frequently affected hepatocyte ultrastructure. The effect of temperature on tld (μm2) reached 61 % (P < 0·001). So, according to rearing temperature, tld ranged between 6·4 and 45·3 μm2 at 16 and 23°C, respectively (Fig. 4). In the case of the remaining hepatocyte features, the effects of temperature were always strongest, and they were observed along with other factors. These sometimes interacted with temperature, or with each other. For example, temperature and density both influenced the nld (R 2 30 % (P < 0·001) and 12 % (P < 0·01), respectively) as presented in Fig. 5. In addition, the nld was affected by interactions between temperature and protein source (R 2 16 %; P < 0·001), protein source and daily distribution frequency (R 2 13 %; P < 0·01) and temperature and daily distribution frequency (R 2 9 %; P < 0·01) (Fig. 6). Higher nld (8·0) were obtained at 23°C in fish fed pure fishmeal as the protein source (PSF) and lower nld (1·6) at 16°C in fish fed fish and vegetable meal as the protein source (PSFV). The effect of temperature was less pronounced (4·3 v. 3·6 nld at 23 and 16°C, respectively) in the case of mixed protein source (PSFV). An increase in the nld was observed at 16°C in fish fed continuously compared with those fed twice per d (1·7 v. 3·4), but a decrease at 23°C (7·4 v. 5·0). The third interaction between protein source and daily distribution frequency (R 2 13 %; P < 0·01) was associated with an increase of the nld in fish fed fish and vegetable meal (PSFV) continuously, compared with twice daily (2·9 v. 5·0). The opposite was observed when fish were fed PSF in the diets (6·2 v. 3·4, respectively).
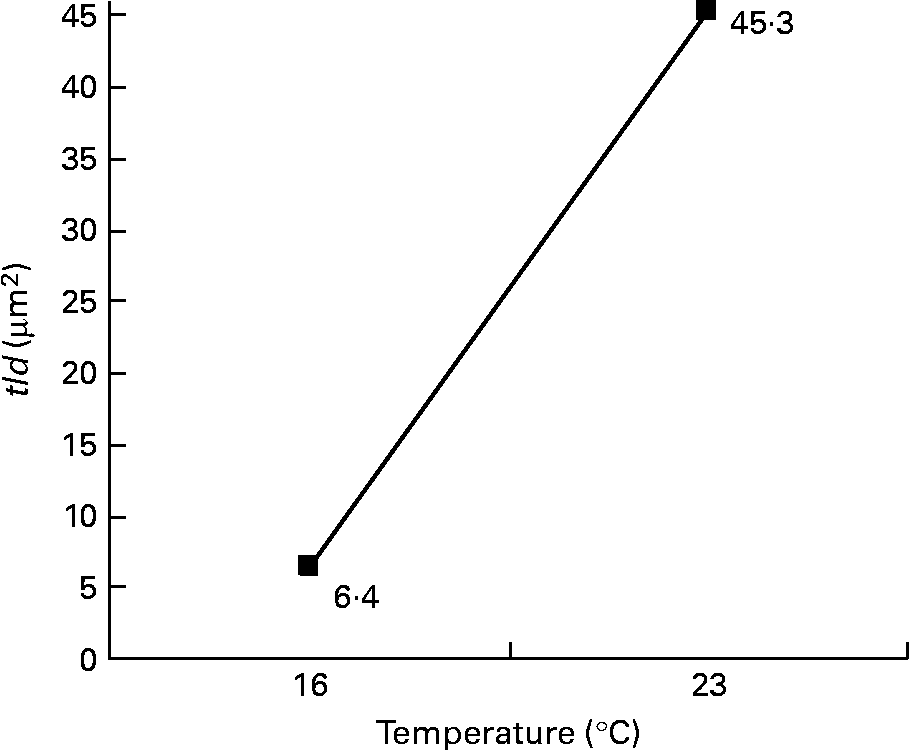
Fig. 4 Effect of temperature on the total area of lipid droplets per micrograph (tld) of female juvenile Eurasian perch (Perca fluviatilis L.) hepatocytes; tld = nld × ald (μm2), where nld is the number of lipid droplets per micrograph and ald is the mean area of lipid droplet per micrograph (μm2). The impact of temperature on tld expressed in percentage of variability (R 2) is 61 % (P < 0·001). CV residual mean square error = 64 %.
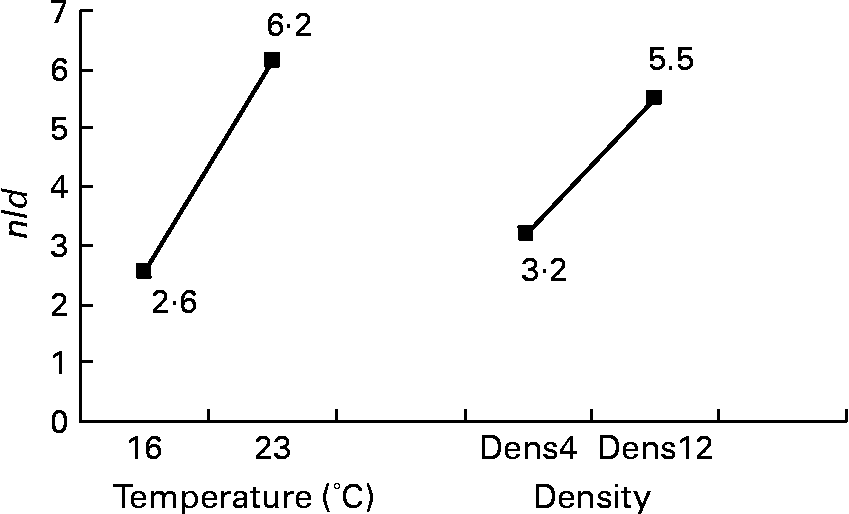
Fig. 5 Effects of temperature and expected final fish density on the number of lipid droplets per micrograph (nld) of female juvenile Eurasian perch (Perca fluviatilis L.) hepatocytes. Dens4, 4 kg/m3; Dens12, 12 kg/m3. The impact of temperature on nld expressed in percentage of variability (R 2) is 30 % (P < 0·001). The impact of expected final fish density on nld expressed in percentage of variability (R 2) is 12 % (P < 0·01). CV residual mean square error = 34 %.

Fig. 6 Factor interaction effects on the number of lipid droplets per micrograph (nld) of female juvenile Eurasian perch (Perca fluviatilis L.) hepatocytes. (–●–), Fishmeal as the protein source; (![]() ), fishmeal and soya meal as the protein source; (–▲–), temperature 16°C; (
), fishmeal and soya meal as the protein source; (–▲–), temperature 16°C; (![]() ), temperature 23°C; DDF2, daily distribution frequency two meals; DDFC, daily distribution frequency continuously. The impact of temperature and protein source on nld expressed in percentage of variability (R 2) is 16 % (P < 0·001). The impact of daily distribution frequency and protein source on nld expressed in percentage of variability (R 2) is 13 % (P < 0·01). The impact of daily distribution frequency and temperature on nld expressed in percentage of variability (R 2) is 9 % (P < 0·01). CV residual mean square error = 34 %.
), temperature 23°C; DDF2, daily distribution frequency two meals; DDFC, daily distribution frequency continuously. The impact of temperature and protein source on nld expressed in percentage of variability (R 2) is 16 % (P < 0·001). The impact of daily distribution frequency and protein source on nld expressed in percentage of variability (R 2) is 13 % (P < 0·01). The impact of daily distribution frequency and temperature on nld expressed in percentage of variability (R 2) is 9 % (P < 0·01). CV residual mean square error = 34 %.
Concerning the area of lipid droplets per particle (ald; μm2), temperature was also the main factor affecting the results (R 2 43 %; P < 0·001), followed by lipid source (R 2 9 %; P < 0·01), weekly distribution frequency (R 2 8 %; P < 0·01) and light spectrum (R 2 5 %; P < 0·01). But, they act in interaction. Interaction effects between these factors show that the effect of weekly distribution frequency was very low at 16°C or with rapeseed oil as the lipid source or with violet light and that the effect of lipid source was very low at 16°C (Fig. 7). At the opposite levels, interaction effects were much more pronounced.

Fig. 7 Factor interaction effects on the mean area of lipid droplet per micrograph (ald; μm2) of female juvenile Eurasian perch (Perca fluviatilis L.) hepatocytes. (–●–), Weekly distribution frequency 6 d of the week; (![]() ), weekly distribution frequency all days of the week; (–▲–), fish oil as the lipid source; (
), weekly distribution frequency all days of the week; (–▲–), fish oil as the lipid source; (![]() ), vegetable oil as the lipid source; LSpectI, light spectrum industrial white; LSpectV, light spectrum violet. The impact of temperature and weekly distribution frequency on ald expressed in percentage of variability (R 2) is 7 % (P < 0·01). The impact of lipid source and weekly distribution frequency on ald expressed in percentage of variability (R 2) is 4 % (P < 0·05). The impact of light spectrum and weekly distribution frequency on ald expressed in percentage of variability (R 2) is 5 % (P < 0·05). The impact of temperature and lipid source on ald expressed in percentage of variability (R 2) is 6 % (P < 0·05). CV residual mean square error = 41 %.
), vegetable oil as the lipid source; LSpectI, light spectrum industrial white; LSpectV, light spectrum violet. The impact of temperature and weekly distribution frequency on ald expressed in percentage of variability (R 2) is 7 % (P < 0·01). The impact of lipid source and weekly distribution frequency on ald expressed in percentage of variability (R 2) is 4 % (P < 0·05). The impact of light spectrum and weekly distribution frequency on ald expressed in percentage of variability (R 2) is 5 % (P < 0·05). The impact of temperature and lipid source on ald expressed in percentage of variability (R 2) is 6 % (P < 0·05). CV residual mean square error = 41 %.
The arer (%) was significantly affected by three main factors: temperature (R 2 43 %; P < 0·001), fish initial heterogeneity (R 2 10 %; P < 0·01) and lipid source (R 2 6 %; P < 0·05), and they act in interaction. Interactions between these main factors show that fish initial heterogeneity and lipid source effects were very low at 23°C (Fig. 8). For example, the arer was less influenced by rearing temperature (4·9 and 3·3 % at 16 v. 23°C, respectively) considering fish fed rapeseed oil in the diet compared with fish fed pure fish oil in the diet (LSF) (10·3 and 2·0 % at 16 and 23°C, respectively) (R 2 17 %; P < 0·001).

Fig. 8 Factor interaction effects on the area of rough endoplasmic reticulum per micrograph (arer; %) of female juvenile Eurasian perch (Perca fluviatilis L.) hepatocytes. (–●–), Fish oil as the lipid source; (![]() ), vegetable oil as the lipid source; (–▲–), initial heterogeneity of 15 %; (
), vegetable oil as the lipid source; (–▲–), initial heterogeneity of 15 %; (![]() ), initial heterogeneity of 30 %. The impact of temperature and lipid source on arer expressed in percentage of variability (R 2) is 17 % (P < 0·001). The impact of temperature and initial heterogeneity on arer expressed in percentage of variability (R 2) is 8 % (P < 0·01). The impact of lipid source and initial heterogeneity on arer expressed in percentage of variability (R 2) is 3 % (NS). CV residual mean square error = 31 %.
), initial heterogeneity of 30 %. The impact of temperature and lipid source on arer expressed in percentage of variability (R 2) is 17 % (P < 0·001). The impact of temperature and initial heterogeneity on arer expressed in percentage of variability (R 2) is 8 % (P < 0·01). The impact of lipid source and initial heterogeneity on arer expressed in percentage of variability (R 2) is 3 % (NS). CV residual mean square error = 31 %.
In contrast to the previous ultrastructural features (nld, ald, tld, arer), the area of glycogen per micrograph (agly; μm2) was mainly affected by daily distribution frequency (R 2 23 %; P < 0·001), lipid source (R 2 8 %; P < 0·05) and protein source (R 2 8 %; P < 0·05) (Fig. 9). In other words, glycogen storage was more important in fish fed twice per d or with a diet containing menhaden oil (LSF) or fishmeal (PSF) than at the opposite levels. However, temperature also modified other effects (with inversion) such as photoperiod (temperature–photoperiod, R 2 17 %; P < 0·01), diet lipid content (temperature–lipid content, R 2 11 %; P < 0·05) and Ast (temperature–Ast, R 2 11 %; P < 0·05) (Fig. 10). With 16 h of light or 21 % of lipid or 0 % astaxanthin, glycogen storage increases with higher temperature; however, with 8 h of light or 17 % of lipid or 0·4 % astaxanthin, glycogen storage decreases with higher temperature.

Fig. 9 Effects of daily distribution frequency, lipid source and protein source on the area of glycogen per micrograph (agly; μm2) of female juvenile Eurasian perch (Perca fluviatilis L.) hepatocytes. DDF2, daily distribution frequency two meals; DDFC, daily distribution frequency continuously; PSF, fishmeal as the protein source; PSFV, fishmeal and soya meal as the protein source. The impact of daily distribution frequency on agly expressed in percentage of variability (R 2) is 23 % (P < 0·001). The impact of lipid source on agly expressed in percentage of variability (R 2) is 8 % (P < 0·05). The impact of protein source on agly expressed in percentage of variability (R 2) is 8 % (P < 0·05). CV residual mean square error = 18 %.
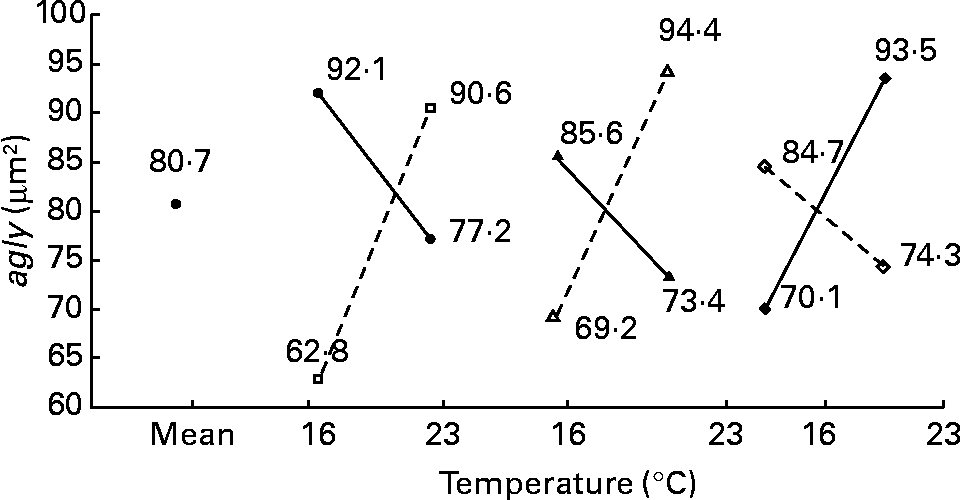
Fig. 10 Factor interaction effects on the area of glycogen per micrograph (agly; μm2) of female juvenile Eurasian perch (Perca fluviatilis L.) hepatocytes. (–●–), Photoperiod 8 h light and 16 h dark; (![]() ), photoperiod 16 h light and 8 h dark; (–▲–), lipid content 17 % on a wet-weight basis; (
), photoperiod 16 h light and 8 h dark; (–▲–), lipid content 17 % on a wet-weight basis; (![]() ), lipid content 21 % on a wet-weight basis; (–♦–), 0 % astaxanthin; (
), lipid content 21 % on a wet-weight basis; (–♦–), 0 % astaxanthin; (![]() ), 0·4 % astaxanthin. The impact of temperature and photoperiod on agly expressed in percentage of variability (R 2) is 17 % (P < 0·01). The impact of temperature and lipid content on agly expressed in percentage of variability (R 2) is 11 % (P < 0·05). The impact of temperature and astaxanthin enrichment on agly expressed in percentage of variability (R 2) is 11 % (P < 0·05). CV residual mean square error = 18 %.
), 0·4 % astaxanthin. The impact of temperature and photoperiod on agly expressed in percentage of variability (R 2) is 17 % (P < 0·01). The impact of temperature and lipid content on agly expressed in percentage of variability (R 2) is 11 % (P < 0·05). The impact of temperature and astaxanthin enrichment on agly expressed in percentage of variability (R 2) is 11 % (P < 0·05). CV residual mean square error = 18 %.
The nmit was affected by temperature (R 2 10 %; P < 0·05), protein source (R 2 10 %; P < 0·05), photoperiod (R 2 10 %; P < 0·05) and Ast (R 2 9 %; P < 0·05) (Fig. 11). A temperature of 16°C, protein source of fish and soya meal (PSFV), 8 h of light and Ast of 0·4 % led to a higher number of mitochondria in comparison with opposite levels. Significant interaction effects between temperature and protein source factors (temperature–protein source, R 2 12 %; P < 0·05) suggested that the effect of temperature is mainly observed when diets contain fishmeal (Fig. 12). The amit (μm2) was not affected by rearing temperature. However, Ast (R 2 19 %; P < 0·001), daily distribution frequency (R 2 7 %; P < 0·01) or diet lipid content (R 2 4 %; P < 0·05) all significantly influenced amit. Numerous interactions between these main factors and protein source and lipid source factors show that amit decreased with 0·4 % Ast in the diet mostly in the case of menhaden oil (LSF) or fishmeal (PSF) or 17 % lipid in the diets, continuously distributed during the day, rather than with the opposite levels (Ast–lipid source, R 2 18 % (P < 0·001); protein source–Ast, R 2 19 % (P < 0·001); Ast–daily distribution frequency, R 2 5 % (P < 0·05); lipid content–Ast, R 2 5 % (P < 0·05), respectively) (Fig. 13). With 21 % of lipids in the diet, the effect of weekly distribution frequency on the area of mitochondria was lower than in case of 17 % lipid content (daily distribution frequency–lipid content, R 2 9 %; P < 0·01). The amit was lowered when fish were fed menhaden oil in the diet (LSF). The last significant interaction lipid source–protein source (R 2 8 %; P < 0·01) was associated with an increase in the area of mitochondria in fish fed a mix of fish and soya meal in the diet (PSFV) and rapeseed oil, compared with fish oil (LSF) (0·32 v. 0·25 μm2). The opposite was observed when fish were fed pure fishmeal in the diets (PSF) (0·32 v. 0·24 μm2, respectively).
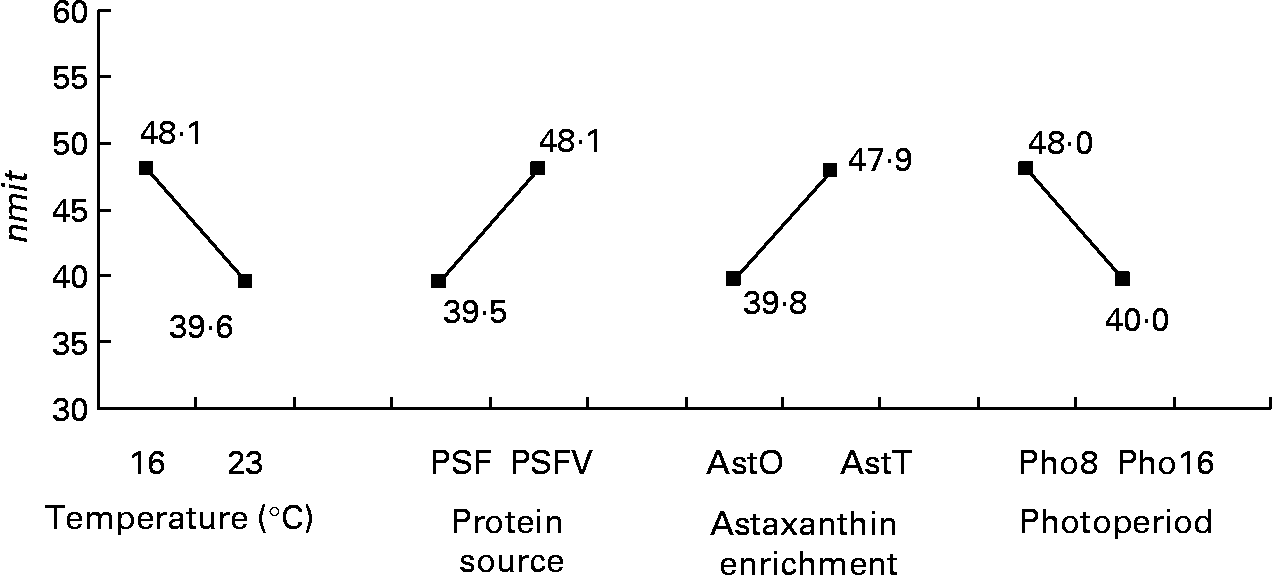
Fig. 11 Effects of temperature, protein source, astaxanthin enrichment and photoperiod on the number of mitochondria per micrograph (nmit) of female juvenile Eurasian perch (Perca fluviatilis L.) hepatocytes. PSF, fishmeal; PSFV, fish and soya meal; AstO, 0 % astaxanthin; AstT, 0·4 % astaxanthin; Pho8, 8 h light and 16 h dark; Pho16, 16 h light and 8 h dark. The impact of temperature on nmit expressed in percentage of variability (R 2) is 10 % (P < 0·05). The impact of protein source on nmit expressed in percentage of variability (R 2) is 10 % (P < 0·05). The impact of astaxanthin enrichment on nmit expressed in percentage of variability (R 2) is 9 % (P < 0·05). The impact of photoperiod on nmit expressed in percentage of variability (R 2) is 10 % (P < 0·05). CV residual mean square error = 20 %.
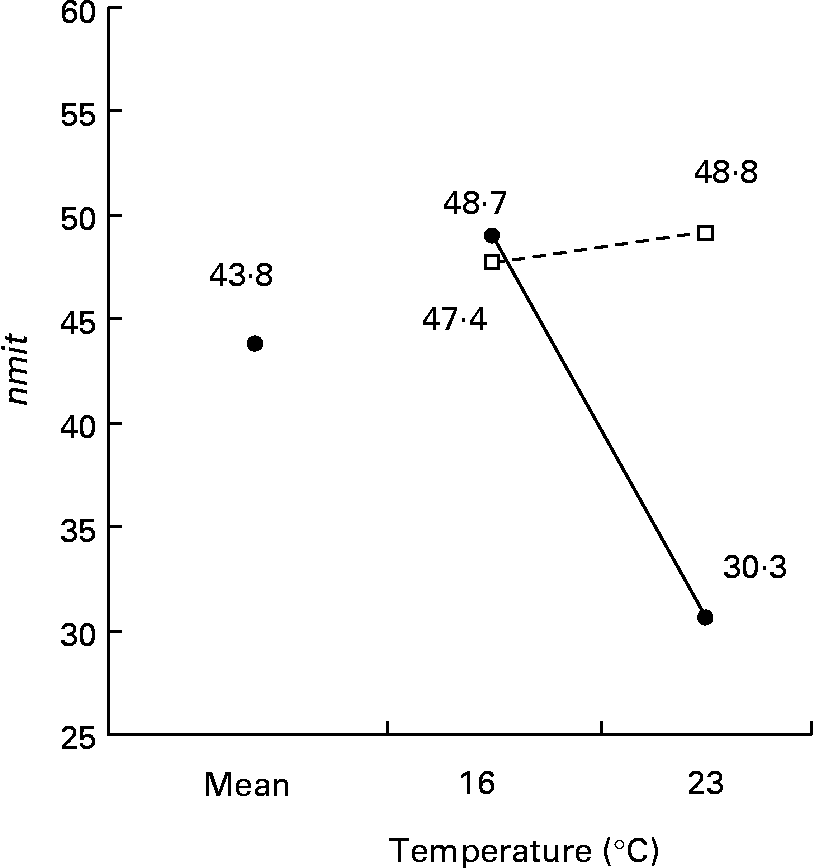
Fig. 12 Factor interaction effects of temperature and protein source on the number of mitochondria per micrograph (nmit) of female juvenile Eurasian perch (Perca fluviatilis L.) hepatocytes. (–●–), Fishmeal as the protein source; (![]() ), fishmeal and soya meal as the protein source. The impact of temperature and protein source on nmit expressed in percentage of variability (R 2) is 12 % (P < 0·05). CV residual mean square error = 20 %.
), fishmeal and soya meal as the protein source. The impact of temperature and protein source on nmit expressed in percentage of variability (R 2) is 12 % (P < 0·05). CV residual mean square error = 20 %.
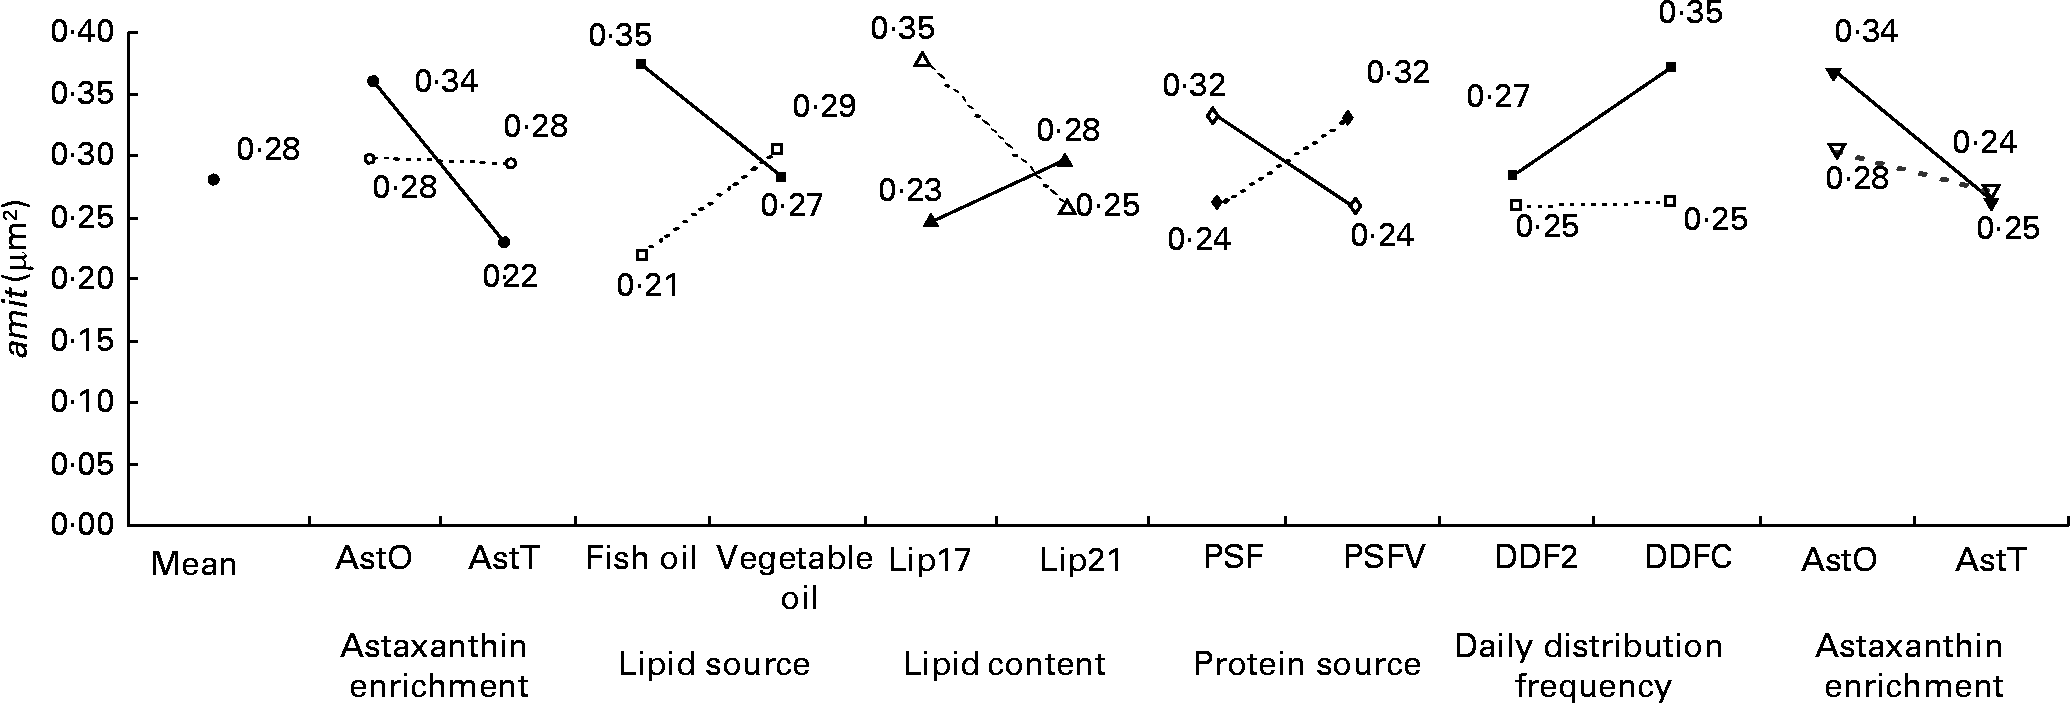
Fig. 13 Factor interaction effects on the mean area of mitochondria per micrograph (amit; μm2) of female juvenile Eurasian perch (Perca fluviatilis L.) hepatocytes. (–●–), PSF, fishmeal as the protein source; (![]() ), PSFV, fishmeal and soya meal as the protein source; (–■–), AstO, 0 % astaxanthin; (
), PSFV, fishmeal and soya meal as the protein source; (–■–), AstO, 0 % astaxanthin; (![]() ), AstT, 0·4 % astaxanthin; (–▲–), DDF2, daily distribution frequency two meals; (
), AstT, 0·4 % astaxanthin; (–▲–), DDF2, daily distribution frequency two meals; (![]() ), DDFC, daily distribution frequency continuous; (–♦–), fish oil as the lipid source; (
), DDFC, daily distribution frequency continuous; (–♦–), fish oil as the lipid source; (![]() ), vegetable oil as the lipid source; (–▾–), Lip17, lipid content 17 % on a wet-weight basis; (
), vegetable oil as the lipid source; (–▾–), Lip17, lipid content 17 % on a wet-weight basis; (![]() ), Lip21, lipid content 21 % on a wet-weight basis. The impact of astaxanthin enrichment and protein source on amit expressed in percentage of variability (R 2) is 19 % (P < 0·001). The impact of lipid source and astaxanthin enrichment on amit expressed in percentage of variability (R 2) is 18 % (P < 0·01). The impact of lipid content and daily distribution frequency on amit expressed in percentage of variability (R 2) is 9 % (P < 0·01). The impact of protein source and lipid source on amit expressed in percentage of variability (R 2) is 8 % (P < 0·01). The impact of daily distribution frequency and astaxanthin enrichment on amit expressed in percentage of variability (R 2) is 5 % (P < 0·05). The impact of astaxanthin enrichment and lipid content on amit expressed in percentage of variability (R 2) is 5 % (P < 0·05). CV residual mean square error = 9 %.
), Lip21, lipid content 21 % on a wet-weight basis. The impact of astaxanthin enrichment and protein source on amit expressed in percentage of variability (R 2) is 19 % (P < 0·001). The impact of lipid source and astaxanthin enrichment on amit expressed in percentage of variability (R 2) is 18 % (P < 0·01). The impact of lipid content and daily distribution frequency on amit expressed in percentage of variability (R 2) is 9 % (P < 0·01). The impact of protein source and lipid source on amit expressed in percentage of variability (R 2) is 8 % (P < 0·01). The impact of daily distribution frequency and astaxanthin enrichment on amit expressed in percentage of variability (R 2) is 5 % (P < 0·05). The impact of astaxanthin enrichment and lipid content on amit expressed in percentage of variability (R 2) is 5 % (P < 0·05). CV residual mean square error = 9 %.
Factor effects on other biological variables
As shown in Table 4, specific growth rate (%/d) was significantly affected by the temperature, the photoperiod and the lipid source (50 (P < 0·001), 26 (P < 0·001) and 9 % (P < 0·001), respectively). The best growth was recorded when a long photoperiod (16 h of light) or a high temperature (23°C) or menhaden oil (LSF) were applied during the rearing experiment. Under low temperature (16°C) and short photoperiod (8 h of light), fish gonads developed (11·4 %) and the liver (I H) was bigger than in fish reared at 23°C under a long photoperiod (16 h of light). In case of no gonad maturation, energy was mainly stored in perivisceral tissues. The dietary protein source affected the I H (R 2 34 %; P < 0·001). In other words, when fishmeal was used, mean liver size was greater than with fishmeal and soya meal mix. The lipid source influenced growth parameters but did not significantly affect the morphological criteria.
Table 4 Effects of factors on growth parameters and morphological criteria in juvenile Eurasian perch (Perca fluviatilis L.)†
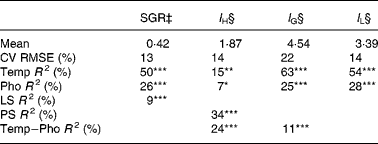
SGR, specific growth rate (%/d); I H, hepatosomatic index; I G, gonadosomatic index; I L, liposomatic index; RMSE, residual mean square error; Temp, temperature; Pho, photoperiod; LS, lipid source; PS, protein source.
*P < 0·05, **P < 0·01, ***P < 0·001.
† Values indicate the effects of factors or interactions, the impact of the factor on the measured variable expressed in percentage of variability (R 2) and followed by the significance of the test.
‡ SGR (%/d) = 100 × (Ln(W f) − Ln(W i))/ΔT, where W i and W f are initial and final weights (g), respectively, and ΔT is the duration of the experiment (d).
§ The I H, I G and I L were calculated as: y = 100 × x/M, where y is the index, M is the mass (g) of the fish, and x is the mass (g) of the liver, gonad or perivisceral fat.
Discussion
In the present study, important variability within hepatocyte ultrastructure was observed according to treatment. Parenchymal cell morphology varied between typical fish hepatocyte as described by Takashima & Hibiya(Reference Takashima and Hibiya46), and the so-called fat-storing cells of cultured species when lipid droplets were nearly filling the cytoplasm of numerous degenerated cells. In such conditions, excessive accumulations of fat into the cytoplasm were generally accompanied by nuclear atrophy and can be thus described as a pathological liver. Moreover, the variability of liver ultrastructural features in the present study was higher in comparison with a previous study on adult females of wild perch(Reference Blanchard, Druart and Kestemont5). In this latter case, hepatic ultrastructure modifications were mainly enhanced by the vitellogenin production and no signs of impaired liver function were detected. In the hepatocytes of wild perch females and cultured perch, respectively, average nld was 11·47 and 4·36; area of lipid droplet per particle was 0·73 and 5·56 μm2; tld was 8·17 and 25·8 μm2; agly was 35·81 and 79·1 μm2; area of RER was 12·54 and 4·71 %; area of mitochondria was 0·55 and 0·27 μm2; number of mitochondria was 19·5 and 43·8. Energy storage was more extended in cultured female perch than in wild ones, concomitantly to a modification of the organelle patterns usually observed in typical hepatocytes.
We have demonstrated the higher plasticity of lipid storage and RER development than those of mitochondria development and glycogen storage according to the different combinations of factors tested in the present experiment. It is well known that internal arrangement and peculiarities of hepatocyte organelles vary among species, age, season, sex, spawning period and nutritional condition(Reference Takashima and Hibiya46). The comparison of liver ultrastructure plasticity with other studies is rather difficult. There is a lack of similarity between experimental designs and no references of multifactorial approach. However, when analysed by electron microscopy, organelles previously mentioned are frequently the most influenced, regardless of the treatments applied such as inclusion of astaxanthin(Reference Segner, Arend, Von Poeppinghausen and Schmidt26), levels of dietary lipids, with or without added ethoxyquin(Reference Kestemont, Vandeloise, Mélard, Fontaine and Brown10), lipid level and fishmeal quality(Reference Caballero, Lòpez-Calero, Socorro, Roo, Izquierdo and Fernàndez15), diets and salinities(Reference Rodríguez, Gisbert, Rodríguez and Castelló-Orvay27) and temperature(Reference de Brito-Gitirana and Storch47). Moreover, when histological modifications of the liver are observed using light microscopy, the significance of lipid storage plasticity (the number and size of lipid inclusions) becomes irrefutable, as demonstrated by Tucker et al. (Reference Tucker, Lellis, Vermeer, Roberts and Woodward48), Fontagné et al. (Reference Fontagné, Geurden, Escaffre and Bergot49), Robaina et al. (Reference Robaina, Izquierdo, Moyano, Socorro, Vergara and Montero14), Salhi et al. (Reference Salhi, Hernandez-Cruz, Bessonart, Izquierdo and Fernandez-Palacios50), Morais et al. (Reference Morais, Bell, Robertson, Roy and Morris51), Caballero et al. (Reference Caballero, Obach, Rosenlund, Montero, Gisvold and Izquierdo52, Reference Caballero, Izquierdo, Kjorsvik, Fernandez and Rosenlund53), Figueiredo-Silva et al. (Reference Figueiredo-Silva, Rocha, Dias, Silva, Rema, Gomes and Valente54) and Ruyter et al. (Reference Ruyter, Moya-Falcón, Rosenlund and Vegusdal55).
Alterations in the glycogen or mitochondria organisation of the liver linked to experimental feeding regimens are much less often reported. Hepatic steatosis and glycogen depletion in the liver coupled with poorer growth performance have been observed in rainbow trout(Reference Caballero, Obach, Rosenlund, Montero, Gisvold and Izquierdo52) and European glass eels (Anguilla anguilla)(Reference Rodríguez, Gisbert, Rodríguez and Castelló-Orvay27).
However, the location of the nucleus in a hepatocyte is often mentioned when describing the accumulation of lipid droplets, in order to evaluate the effect of feeding regimen on fish health(Reference Caballero, Lòpez-Calero, Socorro, Roo, Izquierdo and Fernàndez15, Reference Tucker, Lellis, Vermeer, Roberts and Woodward48, Reference Morais, Bell, Robertson, Roy and Morris51, Reference Mosconi-Bac56). When the nucleus does not occupy the centre of the cell, pathological accumulation of lipids can be suggested, even if it is reversible. In the present study, the location of the nucleus was not taken into account, but it could be recorded and mentioned in similar future studies. As suggested by Kestemont et al. (Reference Kestemont, Vandeloise, Mélard, Fontaine and Brown10), we demonstrated that the accumulation of lipid droplets in the liver of perch is negatively correlated to RER surface and number of mitochondria, both essential organelles involved mainly in the protein synthesis and oxidation process, respectively. This could be interpreted as a sign of impaired liver function.
Among the twelve nutritional and husbandry conditions investigated, two major factors, temperature and lipid source, significantly affected the hepatocyte ultrastructure of intensively cultured Eurasian perch, but mostly in interaction between them or with other factors such as the protein source, the photoperiod, the diet lipid content, the initial heterogeneity or the daily distribution frequency. Hierarchically the temperature, as main effect or in interaction, is by far the dominant factor. Temperature changes are known to induce a wide range of physiological modifications in poikilotherms. For example, it may cause changes in the lipid composition of fish membranes in a process known as homoviscous adaptation(Reference Røsjø, Berg, Manum, Gjoen, Magnusson and Thomassen57) or influence the fat content of fish tissue(Reference Corraze, Larroquet and Médale58). Atlantic salmon (Salmo salar) parr kept at 2°C showed higher muscle and carcass fat content than at 8°C(Reference Jobling and Bendiksen59). Ingemansson et al. (Reference Ingemansson, Olsson and Kaufmann60) also demonstrated the higher fat accumulation in the dark muscle of rainbow trout (Oncorhynchus mykiss) acclimatised to cold temperature. Grisdale-Helland et al. (Reference Grisdale-Helland, Ruyter, Rosenlund, Obach, Helland, Sandberg, Standal and Rosjo61) showed that the I H of Atlantic salmon held at low temperature was greater than those of fish raised at 12°C. Ruyter et al. (Reference Ruyter, Moya-Falcón, Rosenlund and Vegusdal55) have shown that low temperature (5°C) and high levels of soyabean oil (100 % soyabean oil) in the diet lead to an accumulation of fat in the liver of Atlantic salmon. On the contrary, in wall lizards (Hemidactylus frenatus), the hepatocyte ultrastructure study demonstrated that hepatocytes of animals adapted at 30°C displayed larger lipid inclusions compared with the hepatocytes of animals adapted at 20°C(Reference de Brito-Gitirana and Storch47). The authors also demonstrated an increase in the endoplasmic reticulum, number of mitochondria and peroxisomes at low temperature. Thus, disparities between results can be partly explained considering species and, within species, development stages and feeding history differences. But, it seems more and more evident that environmental temperature has no direct effect on tissue lipid contents but plays an indirect role through the feed intake increasing in case of higher temperature. Temperature interacts with feeding factors by modifying the mechanisms involved in supplying energy(Reference Corraze, Larroquet and Médale58). The present results confirm that rearing temperature influences the general metabolism, resulting in a modulation of the effects of the other factors that are related to diet quality or influence feed intake. In other words, factors related to diet quality or influencing the feed intake mainly intensify or compensate the effect of temperature at different levels of biological organisation: macroscopically by changes at the organ and tissue levels and microscopically at the cellular level by hepatic ultrastructure modifications occurring before macroscopic changes.
The fatty acid profile of diets is known to be very important in fish nutrition. Several authors have described liver alterations produced by nutritional origins. Large lipid vacuolisation of hepatocytes was observed when fish were fed vegetable oil(Reference Rodríguez, Gisbert, Rodríguez and Castelló-Orvay27, Reference Tucker, Lellis, Vermeer, Roberts and Woodward48, Reference Salhi, Hernandez-Cruz, Bessonart, Izquierdo and Fernandez-Palacios50, Reference Caballero, Obach, Rosenlund, Montero, Gisvold and Izquierdo52–Reference Figueiredo-Silva, Rocha, Dias, Silva, Rema, Gomes and Valente54) or when diets had imbalanced fatty acid composition and lipid levels(Reference Caballero, Lòpez-Calero, Socorro, Roo, Izquierdo and Fernàndez15, Reference Rodríguez, Gisbert, Rodríguez and Castelló-Orvay27, Reference Morais, Bell, Robertson, Roy and Morris51, Reference Caballero, Obach, Rosenlund, Montero, Gisvold and Izquierdo52). Some authors refer to a physiological response to lipid excess that can indicate a well-fed status(Reference Caballero, Lòpez-Calero, Socorro, Roo, Izquierdo and Fernàndez15) but not a pathological status as described by Mosconi-Bac(Reference Mosconi-Bac56) in sea bass. Others refer to an excess level of unsaturated lipid in marine fish oil, which may present a greater risk from lipid peroxidation(Reference Figueiredo-Silva, Rocha, Dias, Silva, Rema, Gomes and Valente54, Reference Bell, Tocher, MacDonald and Sargent62). Verreth et al. (Reference Verreth, Coppoolse and Segner63) demonstrated higher lipid vacuolisation according to different highly unsaturated fatty acid digestibility. Salhi et al. (Reference Salhi, Hernandez-Cruz, Bessonart, Izquierdo and Fernandez-Palacios50) observed that lower polar lipid level affected the lipoprotein synthesis and consequently the transport of lipid from the liver to extrahepatic tissues. Caballero et al. (Reference Caballero, Izquierdo, Kjorsvik, Fernandez and Rosenlund53) reported that a high intake of highly unsaturated fatty acids (mainly EPA and DHA) prevents lipid accumulation as it induces lipid oxidation through the activation of β-oxidation. Fatty acid imbalances in the diet can also have an impact on liver lipid accumulation because of different elongation and desaturation enzyme affinities. In brief, modifications in lipid vacuolisation of the hepatocyte are linked with nutritional aspect such as the nature of diet, dietary fat balances, fatty acid profiles or fish digestive physiology. We argue that excessive lipid accumulation is probably reflecting hepatic dysfunctions of nutritional origin possibly related to disorders in the lipid metabolism. Moreover, this lipid accumulation is exacerbated when high rearing temperature is applied, inducing higher feed intake. In perch, optimal rearing temperature is 23°C. In the present experiment, the effect of lipid source (fish oil v. vegetable oil) was obvious in decreasing the areas of lipid droplets, glycogen and, to a lesser extent, RER in the case of rapeseed oil in the diet. However, this lipid source effect was modulated according to the temperature and the weekly distribution frequency for ald and according to the temperature for arer (interactions). The fatty acid composition of the different oils explains partially such results. Regarding other studies, differences between results can also be explained by the variability of physiological responses according to species. Mourente et al. (Reference Mourente, Good and Bell64) have shown an increase in the occurrence of variable-sized vacuoles and large amounts of lipid droplets within hepatocytes in the case of partial replacement of fish oil in the diet of European sea bass (Dicentrarchus labrax L.) by rapeseed oil. Another study on salmonids demonstrated higher or lower total lipid contents of liver in fish fed vegetable oils (blend of linseed and rapeseed oils) or fish oil, according to species(Reference Tocher, Bell, MacGlaughlin, McGhee and Dick65).
Globally, numerous interaction effects between temperature, lipid source and other nutritional factors such as daily and weekly distribution frequencies, protein source or factors such as expected final density, initial heterogeneity and Ast, were also observed. Most of these effects can be explained considering quantities of ingested food. For example, in the case of 7 d feeding frequency the ald was smaller than in the case of 6 d feeding frequency. In this case, fish appear to be able to adapt their feed intake after a period of undernutrition by hyperphagia(Reference Houlihan, Boujard and Jobling66). Interactions between weekly distribution frequency and temperature corroborated this result because differences in area of lipid droplets were more pronounced at 23°C than at 16°C.
The effect of Ast was less pronounced than previously cited factors, but nevertheless interesting. Literature data on the effects of astaxanthin-enriched diets on fish metabolism are scarce. However, astaxanthin as a carotenoid is known to be an efficient antioxidant in fish. The liver is thought to be the major site for carotenoid pigment metabolism(Reference Hardy, Torrissen and Scott67, Reference Metusalach, Synowiecki, Brown and Shahidi68). Any effect of astaxanthin supplementation would be apparent in the histology of the liver(Reference Segner, Arend, Von Poeppinghausen and Schmidt26). The present results suggest that astaxanthin-enriched diets probably exerted their effects on the area of mitochondria and to a lesser extent on the number of mitochondria and area of glycogen per micrograph. Segner et al. (Reference Segner, Arend, Von Poeppinghausen and Schmidt26) observed significantly higher glycogen deposition in the liver compared with their controls in Oreochromis niloticus fed diets supplemented with astaxanthin. In contrast, Page et al. (Reference Page, Russell and Davies69) did not observe any differences in glycogen deposition in the livers of carotenoid-treated Oncorhynchus mykiss. However, as they indicated, rearing temperatures between these studies were different and consequently hepatocellular structures were difficult to compare(Reference Page, Russell and Davies69). The present study suggested an interaction effect between temperature and Ast on glycogen development, corroborating the findings of both authors. We also demonstrated the impact of Ast, in interactions with diet lipid content, lipid or protein sources, weekly and daily distribution frequencies, on the area of mitochondria (amit). We also showed that astaxanthin apparently increased the number of mitochondria. Whether this is significant is difficult to establish, given the lack of similar studies in the literature. However, the present results lend support to the assumption that astaxanthin has a positive metabolic effect on perch, supported by the fact that 0·4 % astaxanthin in the diet was associated with a lower area of mitochondria (amit), when 0 % Ast was linked with comparatively higher values of amit.
Numerous studies have demonstrated an increase in the I H and liver lipid content with increasing levels of dietary fat(Reference Jobling, Knudsen, Pedersen and Dos Santos70–Reference Santinha, Médale, Corraze and Gomes73). In the present study, the lipid content factor analysed with the levels of 17 and 21 % dietary lipid does not support this idea. This could be due to a too small difference between the two dietary lipid contents tested. Moreover, a previous experiment with Eurasian perch reared at 23°C as the optimal rearing temperature demonstrated that 17 % dietary lipid is already increasing the degree of vacuolation in hepatocytes.
The accumulation of energy into the liver is not only under the dependence of dietary lipid content but can be modulated according to the quality of fishmeal. Caballero et al. (Reference Caballero, Lòpez-Calero, Socorro, Roo, Izquierdo and Fernàndez15) have shown in gilthead sea bream that 27 % dietary lipid with high-quality meal led to a hepatic steatosis while, at the same lipid level but with low-quality fishmeal, hepatic morphology was not pathological. Thus, when dietary lipid or energy exceeds the capacity of the hepatic cells to oxidise fatty acids, or when protein metabolism is impaired, the result is a large synthesis and deposition of TAG in vacuoles, leading to steatosis(Reference Caballero, Izquierdo, Kjorsvik, Fernandez and Rosenlund53).
The determination of hepatocyte ultrastructure build-up as presented here is at its simplest; it could, however, be more complex because of possible confused significant interactions.
Conclusion
The rearing temperature through its influences in the general metabolic activity seems to be the main factor influencing directly but the most often in strong interaction with other nutritional or environmental factors, principally lipid droplet accumulation and RER development. Factors related to diet quality or influencing the feed intake mainly intensify or compensate the effect of temperature at different levels of biological organisation. In comparison with a previous study on adult females of wild perch(Reference Blanchard, Druart and Kestemont5) we demonstrated the higher variability of liver ultrastructural features in the present study with complex determination based on interaction between factors.
Today, liver histological changes are often observed by scientists to prove dietary effect on the transport and metabolism of fat in fish(Reference Caballero, Obach, Rosenlund, Montero, Gisvold and Izquierdo52). In future experiments, dedicated to the evaluation of liver status through ultrastructure analysis, it could be beneficial to study the lipid accumulation, the RER development as well as the nucleus location.
We argue that in the context of sustainable aquaculture, guaranteeing liver functional integrity and healthy fish, as well as ensuring profitable production, could be achieved by using an adequate combination of nutritional and husbandry factors.
Acknowledgements
The authors thank the French Research Ministry which allowed the realisation of the work as part of the project AQS F7-2001: System of production and the technological and nutritional quality of the perch and for their partnership (Laboratoire INRA de Nutrition des Poissons, St Pée sur Nivelle; Société TAG; Société BioMar; Filière Lorraine d'Aquaculture Continentale). The authors express their gratitude to the staff of the electron microscopy laboratory of Namur University, especially M-F Six-Boulanger, for their contribution in the preparation of electron micrographs.


