Introduction
Geopolymer binders are inorganic polymers with a 3-dimensional framework structure of oligomers with various ratios of Si, Al, O, and OH–. The negative charge created by Si/Al substitutions is balanced by the cation of the alkaline activator solution. As well as supplementary cementitious materials (SCM), geopolymer binders are potential substitutes for ordinary Portland cement (OPC), and emit up to 40–80% less CO2 than OPC during their production (McLellan et al. Reference McLellan, Williams, Lay, van Riessen and Corder2011; Davidovits Reference Davidovits2013). The lower emissions are mainly due to the fact that the raw materials contain no structural CO2. In contrast to SCM, which replace only a certain amount of OPC, geopolymers are ideally OPC-free binders. OPC is a hydraulic binder, while geopolymers are alkaline-activated binders. High-Ca and low-Ca/Ca-free types of alkaline-activated binders differ from one another (Herrmann et al. Reference Herrmann, Koenig and Dehn2018) in that geopolymers contain little or no Ca. Aluminosilicates (fly ash, furnace slag, silica fume, or calcined clays) function as precursors and are activated with a highly alkaline solution (waterglass and/or highly concentrated alkali brines), which leads to a geopolymerization reaction (Davidovits Reference Davidovits1991). The polymerization takes place in three successive reactions: the dissolution of the precursors in the alkaline activator solution; the reorganization and diffusion of monomers; and, afterwards, the formation of the 3-dimensional network and hardening of the binder (Heah et al. Reference Heah, Kamarudin, Mustafa Al Bakri, Bnhussain, Luqman and Khairul Nizar2013; Esaifan et al. Reference Esaifan, Rahier, Barhoum, Khoury, Hourani and Wastiels2015).
The mechanical properties of geopolymers are comparable to those of binders prepared with OPC (Oh et al. Reference Oh, Monteiro, Jun, Choi and Clark2010; Gao et al. Reference Gao, Joussein, Michaud and Rossignol2014; Djobo et al. Reference Djobo, Elimbi, Tchakouté and Kumar2016; Yaseri et al. Reference Yaseri, Hajiaghaei, Mohammadi, Mahdikhani and Farokhzad2017; Hàjkovà Reference Hájková2018). When calcined clay minerals such as metakaolinite (Si:Al = 1:1) are used as a precursor, adjusting the Si:Al ratio may be necessary to optimize the mechanical performance of the geopolymers (Duxson et al. Reference Duxson, Provis, Lukey, Mallicoat, Kriven and Van Deventer2005; Ozer and Soyer-Uzun Reference Ozer and Soyer-Uzun2015; Yaseri et al. Reference Yaseri, Hajiaghaei, Mohammadi, Mahdikhani and Farokhzad2017). A Si:Al ratio of 3:1 is given as a suitable ratio (Davidovits Reference Davidovits1982; Yaseri et al. Reference Yaseri, Hajiaghaei, Mohammadi, Mahdikhani and Farokhzad2017). For this purpose, commercial waterglass solutions are mostly used for the production of geopolymers. The term waterglass describes aqueous solutions of the glassy frozen melts of alkali silicates, mostly sodium silicates, with varying SiO2:M 2O (M: Na, K, or Li) ratios (e.g. Na2SiO3). In the production of geopolymers, however, waterglass accounts for most of the CO2 emissions. The environmental benefit is reduced by commercial waterglass, therefore, in comparison with OPC cements. The usage of alkaline brines (e.g. NaOH) can lead to a reduction in CO2 emissions of up to 50% and the Si:Al ratio can be adjusted by alternative SiO2 sources (Mellado et al. Reference Mellado, Catalán, Bouzón, Borrachero, Monzó and Payá2014). Microcrystalline or amorphous SiO2 can be obtained by combustion of organic materials or by technical manufacturing (e.g. silica fume). Rice husk ash appeared to be suitable for producing an alkaline-activator solution in combination with NaOH (He et al. Reference He, Jie, Zhang, Yu and Zhang2013; Tchakouté et al. Reference Tchakouté, Rüscher, Kong, Kamseu and Leonelli2016). Furthermore, waste glass and sugar cane bagasse ash performed well in terms of geopolymer production (Tchakouté et al. Reference Tchakouté, Rüscher, Kong, Kamseu and Leonelli2016, Reference Tchakouté, Rüscher, Hinsch, Djobo, Kamseu and Leonelli2017). The solubility of any other alternative SiO2 sources in NaOH was not considered here. The solubility of SiO2 in alkaline solutions was investigated only up to a pH value of 12 (Alexander et al. Reference Alexander, Heston and Iler1954; Crundwell Reference Crundwell2017).
In addition, unreacted metakaolinite remains following the production of geopolymers (Rowles and O’Connor Reference Rowles and O'Connor2003; Duxson et al. Reference Duxson, Provis, Lukey, Mallicoat, Kriven and Van Deventer2005; Heah et al. Reference Heah, Kamarudin, Mustafa Al Bakri, Bnhussain, Luqman and Khairul Nizar2013; Esaifan et al. Reference Esaifan, Rahier, Barhoum, Khoury, Hourani and Wastiels2015; Faisal et al. Reference Faisal, Muhammad and Amin2015), but usually the amount of unreacted material and the range of the solubility of metakaolinite in the alkaline activator have not been investigated further. The solubility of clay minerals increases with the concentration of NaOH (Xu and Van Deventer Reference Xu and van Deventer2003). In addition, geopolymers produced with more concentrated NaOH show greater compressive strengths (Heah et al. Reference Heah, Kamarudin, Mustafa Al Bakri, Bnhussain, Luqman and Khairul Nizar2013). Research on clay-mineral solubility in alkaline environments is carried out mainly in the field of nuclear-waste storage. The highest concentration of alkaline solution used is 4 mol/L (Chermak Reference Chermak1992; Bauer and Berger Reference Bauer and Berger1998; Cuevas et al. Reference Cuevas, De La Villa, Ramírez, Sánchez, Fernández and Leguey2006).
The solubility of metakaolinite and SiO2 at pH = 14 and at high NaOH concentrations should be investigated with respect to the amount of unreacted material left after geopolymerization. Unreacted material must be considered because of its impact on the compressive strength and carbonation (formation of carbonates) of geopolymers. While unreacted material can act as a filler and increase mechanical strength (Xu and Van Deventer Reference Xu and Van Deventer2000; Moosberg-Bustnes et al. Reference Moosberg-Bustnes, Lagerblad and Forssberg2004), a non-stoichiometric conversion of precursors and activator will lead to unreacted Na+ and carbonation. Carbonation was observed in various geopolymers (e.g. Fletcher et al. Reference Fletcher, MacKenzie, Nicholson and Shimada2005; Zaharaki et al. Reference Zaharaki, Komnitsas and Perdikatsis2010; Nikolov et al. Reference Nikolov, Rostovsky and Nugteren2017), but a quantitative description was not given.
The present study investigated geopolymers prepared using metakaolinite and NaOH but without commercial waterglass. The Si:Al ratio was adjusted by amorphous SiO2. The objective was first to determine quantitatively the solubility of metakaolinite and amorphous SiO2 and second to study the carbonation of geopolymers prepared with the initial Si:Al:Na ratio ranging from 1:1:1 to 3:1:1 with the expected incomplete dissolution of the precursors.
Materials and Methods
Raw Materials
The Bavarian kaolin KBE-1 (grain size ≤20 μm) from Amberger Kaolinwerke Eduard Kick GmbH & Co. KG (Hirschau, Bavaria, Germany) was used to produce metakaolin by calcination. The calcination of KBE-1 was carried out at 480, 555, 615, 700, and 900°C in a L9/12/B180 furnace from Nabertherm (Lilienthal, Germany). These temperature steps were selected based on the dehydroxylation of kaolinite (beginning at the onset of DHX and ending prior to recrystallization) determined by thermal analysis (see supplementary material, Fig. S1). Samples were heated at a rate of 10 K/min in air without forced recirculation. No holding time at maximum temperature was applied. The raw material contained 93% kaolinite and small amounts of accessory minerals (Table 1). The metakaolin consisted mainly of metakaolinite, therefore. This term will be used through the manuscript to describe the samples.
Table 1. Proportions (wt.%) of mineral phases present in KBE-1

Kaolinite of KBE1 consists of 46–47 mass% ordered kaolinite and 50–51 mass% disordered kaolinite. The disordered kaolinite is characterized by 93% B/7% BC stacking sequences. 88% of BB sequences have no additional b/3 stacking errors and, thus, the kaolinite is low b-axis error-ordered. The Hinckley index of KBE1_M2 was 1.63, characteristic of a well ordered kaolinite (Izadifar et al. Reference Izadifar, Thissen, Steudel, Kleeberg, Kaufhold, Kaltenbach, Schuhmann, Dehn and Emmerich2020).
Amorphous silica (Amosil® from HPF – The Mineral Engineers, Frechen, Germany; grain size ≤ 12 μm; Table 2) was added to adjust the Si:Al ratio of the geopolymers.
Table 2. Composition of amorphous silica – Amosil® (wt.%)

Ultra-pure NaOH solutions (Carl Roth GmbH & Co.KG, Karlsruhe, Germany) with concentrations of 10.79 mol/L (32%), 7.96 mol/L (25%), 6.1 mol/L (20%), 5 mol/L (16.88%), and 4 mol/L (13.9%) were utilized. Solutions with concentrations of 1 mol/L (3.8%), 0.1 mol/L (0.38%), and 0.01 mol/L (0.038%) were also prepared.
Analytical Techniques
Inductively coupled plasma optical emission spectrometry (ICP-OES) was carried out using an Optima 8300DV instrument (Perkin Elmer, Waltham, Massachusetts, USA). The measuring range of Si and Al concentrations in solution was 30 mg/L. Liquid samples were, therefore, diluted by a factor of 200.
For X-ray diffraction (XRD), a Bruker D8 Advance A25 diffractometer (Bruker AXS GmbH, Karlsruhe, Germany) with a LYNXEYE XE Detector (2.94° opening angle) was used. Powdered samples (<32 μm) and solid geopolymer discs were analyzed between 5 and 80°2θ or between 2 and 60°2θ. The step size was 0.02°2θ and the scan rate was 2 s per step. An automatic slit (primary side), Soller collimators of 2.5° (primary and secondary sides), and an automatic knife edge were used. The CuKα radiation (1.54 Å) was generated at 40 kV and 35 mA. For quantitative analysis, the Rietveld software Autoquan (GE Inspection Technologies GmbH, Boston, Massachusetts USA) was used.
Investigations with a scanning electron microscope (SEM) were conducted using a VEGA3 instrument (TESCAN, Brno, Czech Republic). First, solid discs of geopolymer were used without polishing to study the sample surface. For further investigations, cross sections of the discs were embedded in epoxy resin (Epoxy2000 from Cloeren Technology GmbH, Wegberg, Germany) and polished. The tests were complemented by EDX analysis (measuring field of 250 μm × 250 μm).
EXPERIMENTAL PROCEDURE
Determination of Dissolution Characteristics
0.1 g of either raw KBE-1, metakaolinite, or amorphous SiO2 was mixed with 5 g of NaOH solution, which is equal to a solid/liquid (s/l) ratio of 0.02. The NaOH solutions reflected a pH value ranging between 12 and 14. The samples were left on a shaking table for 24 h or 7 days. Afterward the samples were centrifuged for 25 min at 4347×g. 0.5 mL of supernatant was diluted in each case for ICP-OES measurement.
Geopolymer Production
The geopolymers were manufactured with the metakaolinite calcined at 700°C, to ensure fully dehydroxylated material (see supplementary material, Fig. S1). After calcination, the metakaolinite was ground manually and gently to destroy small aggregates which were formed during calcination. Metakaolinite has a natural Si:Al ratio of 1:1. The Si:Al ratio was increased to the supposed optimum of 3:1 by adding amorphous silica as a solid powder in various amounts (Table 3). The Na:Al ratio was fixed at 1:1 and, thus, the s/l ratio varied (Table 3). In preliminary tests, s/l ratios of between 0.8 and 2 yielded sufficient hardening and good workability. S/l ratios of <0.8 led to mixtures with very low viscosity and insufficient hardening. If the NaOH concentration was too high, its volume in the formulation was too low (s/l > 2) and workability was lost.
Table 3. Composition of blends

The solids were mixed with the NaOH solutions for several minutes at 10,000 rpm using a Roti-Speed-Stirrer (Xenox MHX/E from Proxxon, Wecker, Luxembourg) operated at 40 W. Next, the stirred material was placed on a vibration table (Vortex Genie 2 from Scientific Industries Inc., Bohemia, New York, USA) for several more minutes to avoid trapped air in the hardening samples. The hardening took place in open PE cylinders (from Kulzer GmbH, Hanau, Germany) with 30 mm diameter under ambient conditions (~21°C, ~50% relative humidity). Three days after preparation, the geopolymer discs were subjected to XRD for qualitative phase analysis. For quantitative analysis, powdered samples were prepared from a second set of geopolymer discs prepared in parallel. They were crushed after 1 day of hardening and ground gently after the second day. After 3 days, the samples were ground again and sieved (<32 μm). As an internal standard, 10 wt.% ZnO was added. XRD analysis of the powdered samples also started at a sample age of 3 days.
RESULTS AND DISCUSSION
Solubility of Metakaolinite and Amorphous Silica
Kaolinite and metakaolinite showed a congruent solubility of Si and Al (for solubility of Al see supplementary material, Fig. S2). Non-congruent solubility would lead to an excess or a deficit of Al in the geopolymer matrix. The samples that were not calcined presented the lowest solubility (<5%, Fig. 1). The solubility increased by >20% after the calcination temperature was increased from 480 to 555°C. At calcination temperatures of >555°C the increase in solubility declined (≤10%). The maximum solubility (e.g. 65% in 4 mol/L and 71.5% in 10.79 mol/L NaOH) was reached in sample KBE-1 calcined at 900°C (Fig. 1). This trend was observed in all NaOH concentrations. The solubility of samples calcined at 700 and 900°C differed only slightly (0–5%). Calcination to 700°C is sufficient, therefore, for geopolymer production.
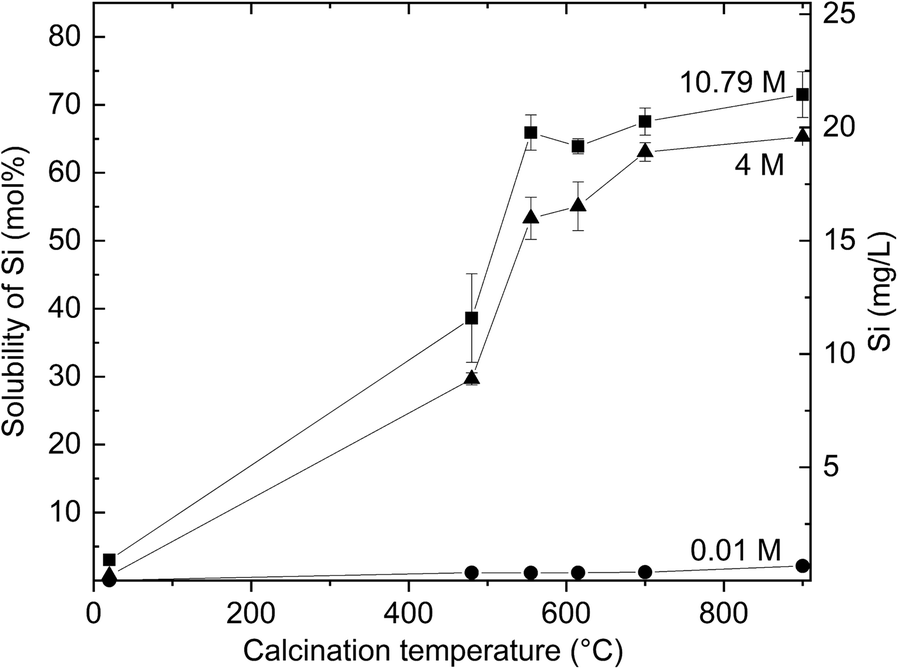
Fig. 1 Solubility of KBE-1 in NaOH (10.79 mol/L, 4 mol/L, 1 mol/L) as a function of calcination temperature (reaction time 24 h)
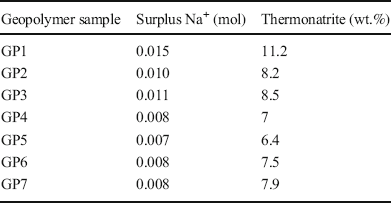
The solubility of metakaolinite calcined at 700°C increased with the concentration of NaOH (Fig. 2). In 0.01 and 0.1mol/L, solubilities of <5% were reached even after 7 days. The greatest solubility for the same metakaolinite was reached in 10.79 mol/L NaOH after 7 days (80%, Fig. 2). Note that none of the samples reached a solubility of 100%. At the beginning of geopolymer formation, the incomplete dissolution of metakaolinite in NaOH led to an excess of unreacted Na+ in the mixture. This unreacted Na+ formed carbonates (thermonatrite at first) from reaction with airborne CO2. Theoretical amounts of free Na+ and thermonatrite (Table 4) were estimated based on the solubility of metakaolinite after 24 h (Fig. 2) and the assumption that the solubility of metakaolinite is not influenced by the dissolution of amorphous SiO2 in geopolymer formulation. Excess Na+ is determined by the amount of metakaolinite (s/l) and its solubility in the specific NaOH in the geopolymer formulation. As solubility of metakaolinite in NaOH with a concentration of ≥ 4 mol/L varies only slightly, the samples with higher s/l (with the same amount of metakaolinite) must contain a larger amount of thermonatrite. GP2 has a calculated amount of thermonatrite of 8.17 wt.% (s/l 0.86) while that of GP3 is slightly larger with 8.50 wt.% (s/l 1.07). The same goes for GP4–7 (s/l 0.80–1.44). The slightly smaller amount of thermonatrite calculated for GP5 compared to GP4 is a result of the greater solubility of metakaolinite measured at 5 mol/L NaOH. The largest amount of thermonatrite at the beginning of the geopolymerization was found in GP1.

Fig. 2 Solubility of metakaolinite (KBE-1 calcined at 700°C) at various NaOH concentrations (reaction time 24 h and 7 days)
Table 4. Estimated amounts of free Na+ and thermonatrite
The solubility of amorphous silica was between 20 and 25% after 24 h and up to 55% after 7 days at a s/l ratio of 0.02 (Fig. 3). The solubility in 10.79 mol/L NaOH was slightly less than in 7.96 mol/L NaOH. By lowering the s/l to 0.005, the solubility had already increased after 24 h. At 7 days, a maximum of 70% was reached in 5 mol/L NaOH (Fig. 3). Because the solubility of amorphous silica at a s/l ratio of 0.02 was only 20–25% in NaOH of 4–7.96 mol/L after 24 h, even less SiO2 dissolution after 24 h could be assumed during geopolymer production with a much higher s/l ratio of 0.8–1.44. To estimate the resulting Si:Al of the geopolymer matrix after 24 h, however, a solubility of 25% was considered (Table 5).

Fig. 3 Solubility of amorphous silica at various NaOH concentrations (reaction times of 24 h and 7 days)
Table 5. Si:Al ratios for GP, calculated by solubilities of metakaolinite and amorphous SiO2

1 normalized solubility of metakaolinite
2 0.25y Si (y = 1 or 2)
3 x Si + 0.25y Si (x: normalized solubility of metakaolinite)
Phase Composition of Geopolymers
All the geopolymers described in this study hardened, and those prepared with NaOH concentrations of >5 mol/L showed compressive strengths of a few MPa. Further study and the optimization of mechanical properties were not the aim of the present study, however.
The formation of carbonates during the early stages of hardening was evident from the appearance of white efflorescence at the surface of the geopolymer discs and confirmed by XRD (Fig. 4). First, thermonatrite (Na2CO3·H2O) and, shortly afterward, trona (Na3(HCO3)(CO3)·2H2O) were formed. For GP1, GP3, and GP7 the carbonation started after 3 days; for the other GP samples, carbonates first appeared at a sample age of 7 days (Table 6). While the amount of trona increased for up to 3 months, thermonatrite disappeared with time; after 28 days, thermonatrite could no longer be detected (Fig. 4).
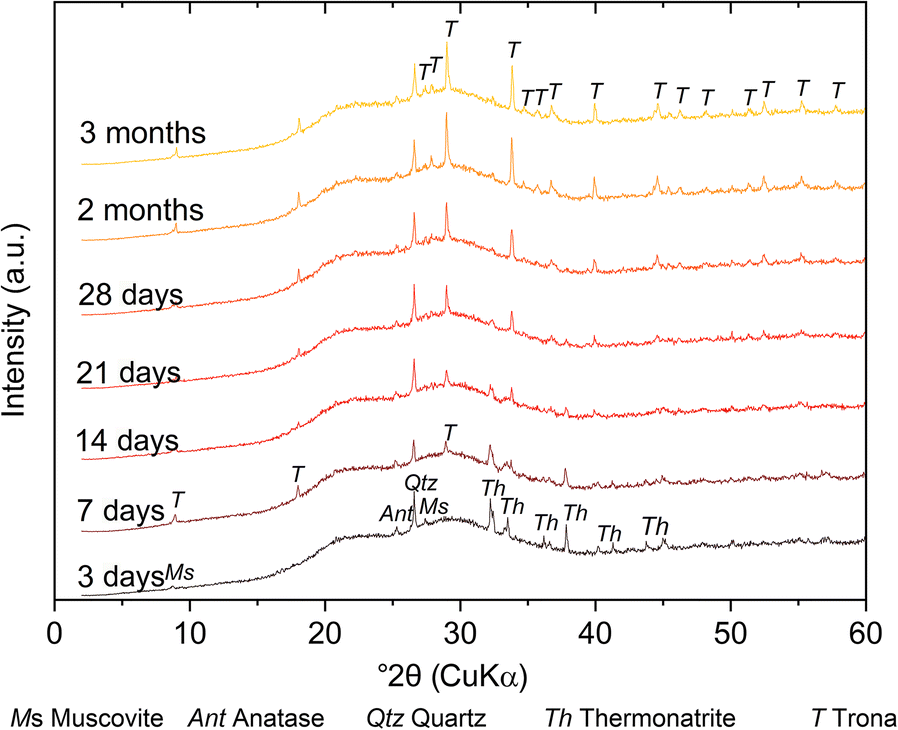
Fig. 4 Qualitative phase analysis of GP7 over a period of 3 months
Table 6. First appearance of carbonates in geopolymer discs (determined by XRD)

In the powdered samples, small amounts of trona (1.13–3.59 wt.%) could be observed after 3 days in all geopolymers (Table 7). The reduction of thermonatrite over time, which was already detected in the discs, was confirmed with the powders. The largest amount of thermonatrite at the beginning of geopolymerization was calculated and observed in GP1 (theoretical amount = 11.19 wt.%; measured amount = 22.11 wt.%). The large deviation between the theoretical and measured amounts of thermonatrite for GP1 was explained by the larger s/l ratio in the geopolymer and, therefore, a larger surplus of Na+ than estimated. The measured amounts of thermonatrite in GP2 to GP6 were within the range of estimation and measurement error. The increasing amount of thermonatrite with increasing s/l could be confirmed at least for GP4 to GP6. The amount of thermonatrite measured in GP7 (5.28 wt.%) was less than the estimated amount (7.9 wt.%). The largest s/l ratio in GP7 of all samples could result in a denser fabric with trapping of free Na+ and hindered air exposure and, thus, reduced carbonation.
Table 7. Amounts of minerals present in powdered geopolymers (wt.% after 3 days, 28 days, and 3 months; measured by XRD and calculated using Autoquan)

While the quantity of thermonatrite decreased over time, the amorphous content increased (Fig. 5). The amount of trona remained approximately the same (variation of <1%). The decrease in the amount of thermonatrite and a nearly constant, small amount of trona in the powder samples, combined with the increase in amorphous phase, indicated that geopolymerization took place for far longer than 24 h. The continuing dissolution of metakaolinite led to the subsequent binding of free Na+ and, therefore, a reduction of thermonatrite. After 28 days, GP1 still contained 15.13 wt.% thermonatrite, GP7 contained <0.5 wt.%. After 3 months, thermonatrite could be detected in none of the powder samples. After 28 days, the increase in the amorphous phase was marginal for GP2–7, but GP1 showed a significant increase until 3 months. Geopolymerization in the discs could have been inhibited by the fast hardening, but, in the solid samples, thermonatrite also disappeared and the amount of amorphous material increased over time.
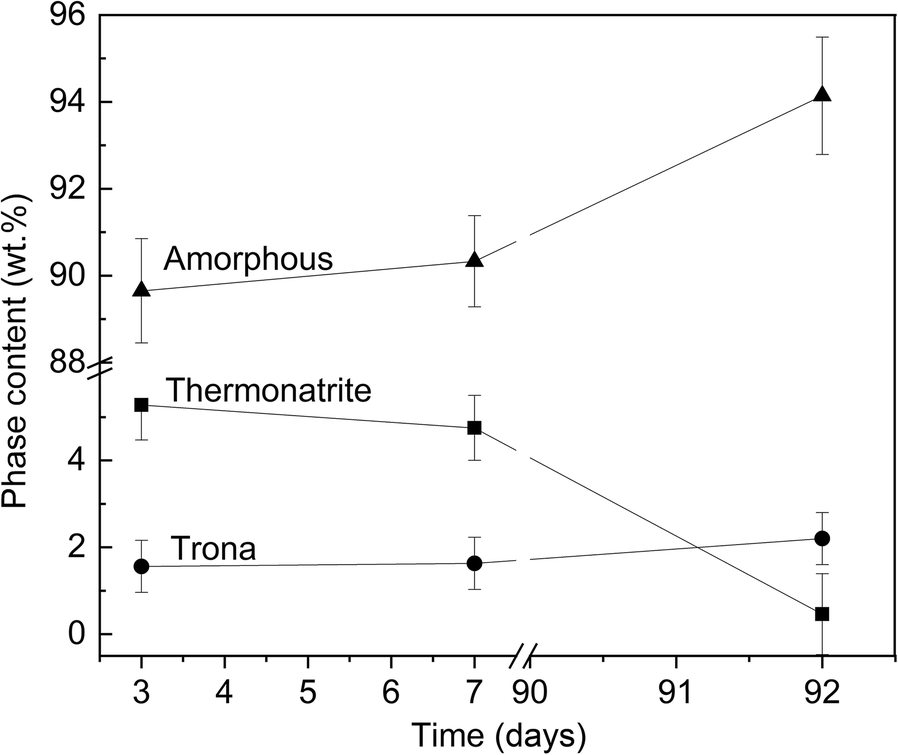
Fig. 5 Time-dependent change in mineralogical content of GP7 (from 3 days to 3 months)
Microstructural Properties of Geopolymers
The unpolished samples showed a rough surface (e.g. GP4; 4 months; Fig. 6). The element ratios reflected the components added at geopolymer production (Na:Al 1:1 and Si:Al 3:1), but spots with a surplus of Na were observed up to Na:Al ratios of 2.25:1, indicating remaining trona deposits at the surface.
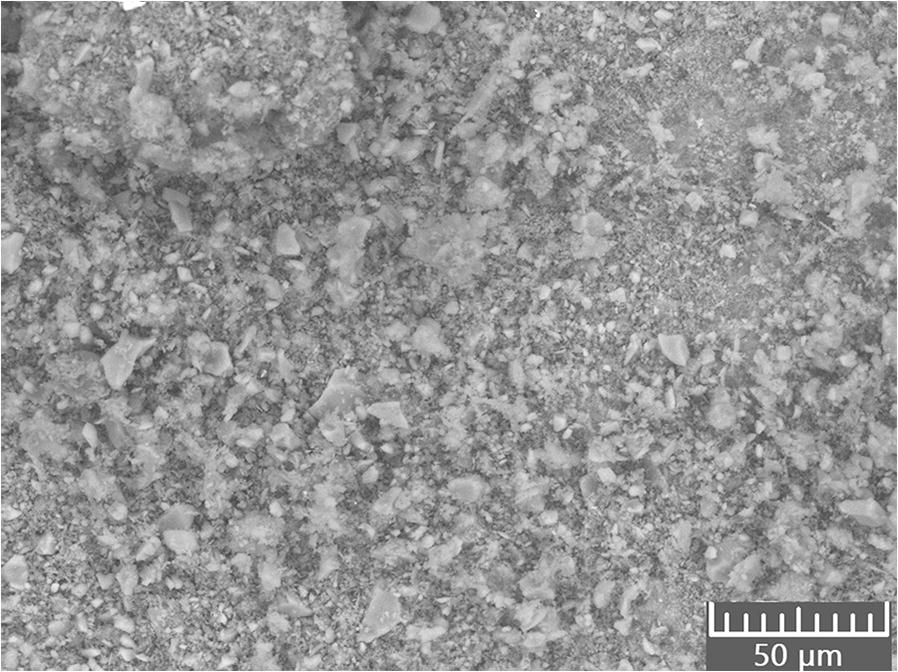
Fig. 6 SEM image of an air-exposed surface of GP4
The micrographs of the polished cross sections revealed that the geopolymers consisted of a fine-grained matrix with a homogeneous distribution of bigger particles throughout the entire sample thickness. No reaction front of carbonates was detected at the surface of the samples (Fig. 7), by which the penetration depth of the carbonates within the geopolymer could be examined. The Si:Al ratio was ~1.5:1 for the bigger particles (X1 and X2, Fig. 7) and ~2.5:1 for the matrix (X3 and X4, Fig. 7). Both the particles and the matrix showed a Na:Al ratio of only 0.5:1, however. A few spots with Si:Al ratios up to 7:1 were found, which indicate agglomerated, unreacted SiO2 attached to the geopolymer matrix. Aggregates of unreacted SiO2, together with a geopolymer matrix of about stoichiometric composition, showed that the raw materials were not converted completely into geopolymers.
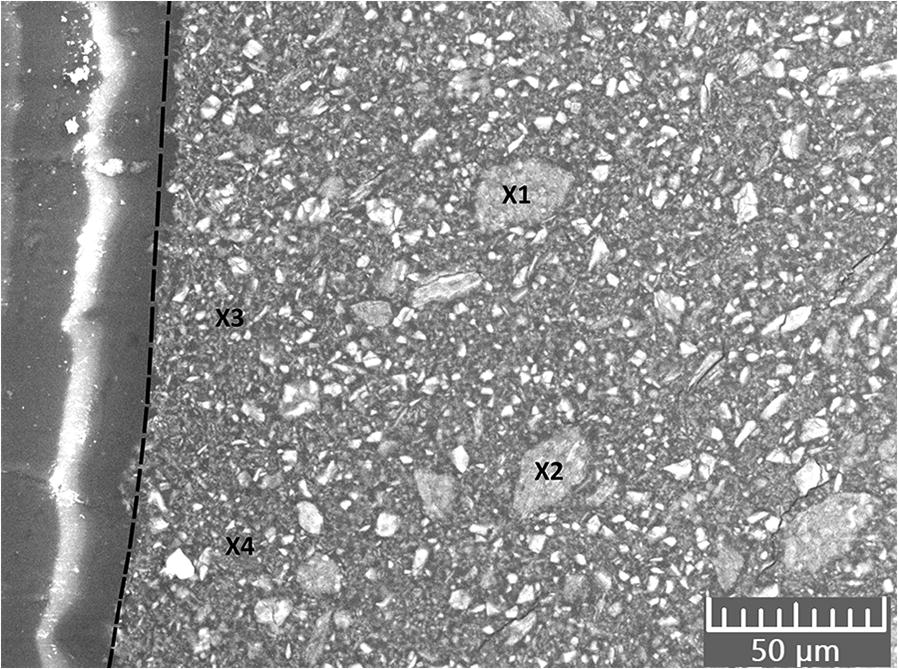
Fig. 7 SEM image of a polished section of GP4 (the dashed line marks the edge of the sample)
SUMMARY AND CONCLUSION
Incomplete and/or delayed dissolution of metakaolinite in NaOH resulted in a surplus of reactive Na+ of stoichiometrically mixed educts. Na+ reacted with airborne CO2 to form thermonatrite during the early stage of hardening. Ongoing exposure to the atmosphere of the freshly prepared geopolymer caused an increase in CO2 incorporation during consumption of thermonatrite and the formation of trona. The progressive dissolution of the metakaolinite and geopolymerization reduced the formation of trona. Further studies are needed to show the influence of carbonation on mechanical strength and durability of geopolymers as well as on the pH value of geopolymers and its impact on steel corrosion. Furthermore, the s/l ratio at the same metakaolinite content had an impact on carbonation. The coupled influence on workability, extent of thermonatrite formation, and mechanical strength also require study.
The incomplete dissolution of the amorphous silica added resulted in smaller Si:Al ratios within the geopolymers in relation to the initial stoichiometric calculations with no influence on carbonation but with a possible influence on mechanical strength. While a reduced Si:Al ratio reduces the mechanical strengths of geopolymers, amorphous SiO2 fillers could increase the mechanical strength of construction materials by increasing bulk density and decreasing porosity. The combined influence needs to be studied in detail for practical applications. The presolution of amorphous SiO2 in NaOH, e.g. at moderate temperatures, prior to mixing with metakaolinite should be considered.
Electronic supplementary material
The online version of this article (https://doi.org/10.1007/s42860-020-00096-4) contains supplementary material, which is available to authorized users.
ACKNOWLEDGMENTS
This project was funded by Deutsche Forschungsgemeinschaft under EM79/8-1. The ICP-OES measurements were performed by Marita Heinle, Institute of Functional Interfaces, Karlsruhe Institute of Technology (KIT), Karlsruhe, Germany.
Funding
Open Access funding was provided by Projekt DEAL. Funding sources are as stated in the Acknowledgments.
Compliance with Ethical Statements
Conflict of Interest
The authors declare that they have no conflict of interest.


