Introduction
Kaolin is a clay consisting mainly of kaolinite but with minor quantities of quartz and feldspars. Kaolinite (Al2Si2O5(OH)4) has a 1:1 layered aluminosilicate structure, and the hydroxyl groups of the gibbsite sheets from one layer are attracted to the SiO4 tetrahedral sheets of the next layer through hydrogen bonding (Bailey, Reference Bailey and Bailey1966; Swindale, Reference Swindale and Gieseking1975) to form the kaolinite particles.
Kaolin is not particularly preferred as an adsorbent for hazardous cations (Jiang et al., Reference Jiang, Liu, Hu, Xu, Yu, Xie and Chen2013; Shirsath et al., Reference Shirsath, Patil, Patil, Naik, Gogate and Sonawane2013; Sari & Tuzen, Reference Sari and Tuzen2014; Drweesh et al., Reference Drweesh, Fathy, Wahba, Hanna, Akarish, Elzahany, El-Sherif and Abou-El-Sherbini2016; Gao et al., Reference Gao, Zhao, Wu, Deligeer and Asuha2016) because it has a small specific surface area (10–20 m2 g–1) and a small ion-exchange capacity (15–75 μmol g–1). Kaolin characteristics may be enhanced by functionalization with organic and inorganic substrates through various mechanisms such as chemical bonding, adsorption, and/or intercalation (Makó et al., Reference Makó, Kovács, Katona and Kristóf2016; Kristóf et al., Reference Kristóf, Sarkadi, Ható and Rutkai2018). The small electrostatic charge of the kaolinite layers and the hydrogen bonding between them makes the direct intercalation process more difficult than for other clay minerals, however (Ianchis et al., Reference Ianchis, Corobea, Donescu, Rosca, Cinteza, Nistor, Vasile, Marin and Preda2012; Zaharia et al., Reference Zaharia, Perrin, Teodorescu, Radu, Iordache, Florea, Donescu and Sarbu2015). This hydrogen bonding may be broken by the intercalation of a few small polar guest molecules such as dimethyl sulfoxide (DMSO), urea, or salts such as potassium acetate (Ledoux & White, Reference Ledoux and White1966; Olejnik et al., Reference Olejnik, Aylmore, Posner and Quirk1968; Tunney & Detellier, Reference Tunney and Detellier1993; Dedzo & Detellier, Reference Dedzo and Detellier2016). Then, new hydrogen bonding develops; hence, this displacement method yields various intercalated compounds (Ianchis et al., Reference Ianchis, Corobea, Donescu, Rosca, Cinteza, Nistor, Vasile, Marin and Preda2012; Zaharia et al., Reference Zaharia, Perrin, Teodorescu, Radu, Iordache, Florea, Donescu and Sarbu2015; Dedzo & Detellier, Reference Dedzo and Detellier2016; Ngnie et al., Reference Ngnie, Dedzo and Detellier2016).
The intercalation of kaolinite with inorganic salts through the reversible intercalation of kaolinite by CH3COOK was pioneered by Wada (Reference Wada1961). Grinding of kaolinite with CH3COOK resulted in a lattice expansion of the clay mineral and the appearance of a basal spacing of 14 Å caused by the expansion of the kaolinite lattice structure along the c axis (Wada, Reference Wada1961). Another report (Singh & Mackinnon, Reference Singh and Mackinnon1999) declared the first successful intercalation of kaolinite by alkaline-earth halides. The kaolinite structure was first modified through a potassium acetate intercalation-deintercalation process, then subsequent intercalation by CaC12 and MgC12 was achieved and the kaolinite layers expanded to basal spacings of 9.8 and 10 Å, respectively (Singh & Mackinnon, Reference Singh and Mackinnon1999). A recent study reported the intercalation of the kaolinite structure by zinc ions and studied the shielding ability and the barrier efficiency of the unmodified and modified kaolinite on an epoxy ester coating (Majd et al., Reference Majd, Davoudi, Ramezanzadeh, Ghasemi, Ramezanzadeh and Mahdavian2020). The Zn-intercalation yielded a small shift in the d spacing of the two most intense peaks of kaolinite from 7.10 and 3.56 Å to 7.11 and 3.57 Å, respectively. Furthermore, Majd et al. (Reference Majd, Davoudi, Ramezanzadeh, Ghasemi, Ramezanzadeh and Mahdavian2020) reported a decrease in the intensities of XRD peaks in the Zn-kaolinite-intercalated powder and considered the decline in crystallinity as proof of successful Zn intercalation. The incorporation of inorganic cations, in particular, into clay minerals often enhances the suitability of the clay as a sorbent, catalyst support, or ion exchanger. These characteristics derive from the development of larger interlayer spaces, a three-dimensional porous structure, new acidic sites, and/or larger surface area while maintaining better thermal stability (Mnasri & Frini-Srasra, Reference Mnasri and Frini-Srasra2013; Ngnie et al., Reference Ngnie, Dedzo and Detellier2016). Beside the inherent acidity of the clay layers, the guest itself may also possess an acidic character.
Very few studies have reported the incorporation of Zr into kaolinite, though Vaughan (Reference Vaughan1994) patented hydrothermal synthesis of zirconium oxide-pillared interlayered kandites using zirconium oxychloride (ZrOCl2) in acetic acid at 100°C, resulting in a d value of the basal spacing ≥14.5 Å. The main limitation of this method is the use of a closed system for the hydrothermal treatment, which limits large-scale production. Synthesis of poly(oxozirconium)-kaolinite by stirring a 0.1 M solution of ZrOCl2 with kaolin was also reported but with no evidence of accompanying enlargement of the basal spacing. The adsorption of Cu2+ (Bhattacharyya & Gupta, Reference Bhattacharyya and Gupta2006), Cd2+ (Gupta & Bhattacharyya, Reference Gupta and Bhattacharyya2006), Pb2+ (Gupta & Bhattacharyya, Reference Gupta and Bhattacharyya2005), Fe3+, Co2+, and Ni2+(Bhattacharyya & Gupta, Reference Bhattacharyya and Gupta2008) from aqueous solution was evaluated. The adsorption capacity of the modified kaolinite was not improved in comparison with the pristine sample. From a commercial point of view, nanocrystalline zirconia itself is an important material and used extensively as an anodic material in solid oxide fuel cells, as a catalyst in oxygen-sensor applications, and as a structural material (Miura et al., Reference Miura, Sato, Anggraini, Ikeda and Zhuiykov2014; Agarkov et al., Reference Agarkov, Burmistrov, Tsybrov, Tartakovskii, Kharton and Bredikhin2018; Wang et al., Reference Wang, Liu, Yu, Li and Zhang2019).
Efficient incorporation of Zr into kaolinite without limitation is still a challenge, especially for large-scale production. The objectives of the current study were to find a simple, scalable synthesis method of zirconia-intercalated kaolinite, and to test the possible applications of the modified kaolinite as a selective sorbent for Cd2+, Cu2+, or Pb2+ from water.
Experimental
Material
The characterization of the untreated raw Egyptian kaolin sample collected from the Wadi El Hamadiya area, south Sinai, Egypt, was reported previously (Drweesh et al., Reference Drweesh, Fathy, Wahba, Hanna, Akarish, Elzahany, El-Sherif and Abou-El-Sherbini2016). The major elements are SiO2 (47.97%), Al2O3 (34.74%), TiO2 (2.26%), and Fe2O3 (1.46%). The kaolin loss on ignition (LOI) is 12.55%. Firstly, raw kaolin was ball-milled, sieved to <112 μm, and labeled as UnK. UnK was activated with 5.0 mol L–1 HCl as reported previously (Drweesh et al., Reference Drweesh, Fathy, Wahba, Hanna, Akarish, Elzahany, El-Sherif and Abou-El-Sherbini2016) and labeled as “HCl-treated kaolin” (abbreviated HK). Kaolinite was the main constituent in both UnK and HK with concentrations of 89.9 and 83.8%, respectively, and exhibiting a Hinckley index of 0.58 indicating that it is a highly disordered kaolinite (Abou-El-Sherbini et al., Reference Abou-El-Sherbini, Elzahany, Wahba, Drweesh and Youssef2017). ZrOCl2·8H2O (99.0%) was purchased from Merck (Darmstadt, Germany - B372317 439). Experimental solutions containing heavy-metal ions were prepared by dissolving stoichiometric amounts of Pb(NO3)2, Cu(NO3)2, and Cd(NO3)2(from Sigma-Aldrich, Steinheim, Germany) in deionized water at the desired concentrations. The pH of solutions was adjusted using 0.1 M NaOH (Merck, Darmstadt, Germany) and/or 0.1 M HNO3 (El-Nasr Co., Cairo, Egypt).
Equipment
The kaolin samples were subjected to powder X-ray diffraction (XRD) analysis to determine their mineralogical compositions using CuKα radiation and a Ni filter at a constant voltage of 40 kV and current of 30 mA, using an Empyrean Powder Diffractometer (Malvern Panalytical Ltd, Malvern, UK) with a side-loading sample holder to minimize mineral orientation. Chemical analyses for the major oxides (mass%) and some minor elements of the raw kaolin and the modified samples were performed using X-ray fluorescence spectrometry (XRF) on a wavelength-dispersive spectrometer (Axios, WD-XRF Spectrometer, PANalytical, 2005, Lelyweg, The Netherlands). Thermogravimetric analysis (TGA) was performed using an SDT Q600 thermal analyzer (TA Instruments, New Castle, Delaware, USA) at a heating rate of 10°C min−1 under N2. TGA was also performed with a Perkin Elmer 7-Series thermal analyzer (Waltham, Massachusetts, USA) at a heating rate of 10°C min−1 in air. Fourier-transform infrared (FTIR) spectra were recorded on a Nicolet iS10 (Thermo-Fisher Scientific, Waltham, Massachusetts, USA) using a KBr pellet at ~0.5% sample concentration. Scanning electron microscopy (SEM) images of the gold-coated samples were performed using SEM model Quanta FEG 250 (FEI, Hillsboro, Oregon, USA) equipped with an energy dispersive X-ray analysis (EDX) unit, with accelerating voltage of 30 kV (FEI Company, Eindhoven, Noord-Brabant, The Netherlands). Elemental mapping analysis was performed using a field emission scanning electron microscope model Zeiss Sigma 300 vp (Oberkochen, Germany). Transmission electron microscopy (TEM) measurements were performed on a JEOL model 1200EX electron microscope (Peabody, Massachusetts, USA) operated at an accelerating voltage of 120 kV. Selected area electron diffraction (TEM-SAED) was recorded using the TEM. The sample was prepared by dropwise coating of its acetone suspension on carbon-coated copper TEM grids (40 μm×40 μm mesh size). The sample was dried under vacuum in a desiccator before loading into a specimen holder. Size-distribution analysis was performed on aqueous sample suspensions by using a Zeta Sizer, ZS-Nano instrument, from Malvern Instruments (Malvern, UK). Surface area (S BET) was determined with a Nova surface area analyzer 3200 (Quantachrome, Boynton Beach, Florida, USA) using nitrogen at 77 K. The S BET was determined following the BET method (Brunauer et al., Reference Brunauer, Emmett and Teller1938). 0.06–0.1 g of prepared sample was outgassed at 300°C for 24 h in order to remove the water adsorbed in the sample and liquid nitrogen was used during the nitrogen adsorption-desorption analysis at –196oC. Pore-size distribution (PSD) curves were calculated from the adsorption branch of the isotherms using the Barrett-Joyner-Halenda(BJH) method (Barrett et al., Reference Barrett, Joyner and Halenda1951). The residual concentration of Cd2+, Cu2+, or Pb2+ was determined using the APHA3111 standard method (Baird et al., Reference Baird, Eaton and Rice2017) on a Varian 220 flame atomic absorption spectrophotometer (FAAS) (Varian, Inc. Palo Alto, California, USA). For each series of measurements, the absorption calibration curve was constructed from a blank and three standards.
The pH of the solution of each sample was adjusted with NaOH and HNO3 solutions using a Hanna Instruments 8519 pH/mV meter (Padova, Italy), with an expanded scale and an accuracy of ±0.1.
Methodology
Intercalation of Zr(IV) into the acid-activated (HK ) and untreated (UnK) kaolin.
UnK or HK (10 g) was added to 10 mL of distilled H2O, impregnated for a week in a stoppered 250 mL glass conical flask to guarantee sufficient hydration of kaolinite layers, then ZrOCl2·8H2O (19.69 g ≡ 0.061) was added and mixed thoroughly. Using a high concentration of ZrOCl2 (6.1 mol L–1) was important to avoid hydrolysis (Solovkin & Tsvetkova, Reference Solovkin and Tsvetkova1962). The slurry was sonicated for 60 min and impregnated again for 6 days with frequent shaking. For analysis purposes, 1 g was separated after this stage, dried at 70°C, and labeled as HKZS. The mixture was dried gradually at 100°C for 24 h (labeled as UnKZS100 and HKZS100, respectively), then heated again at 200°C for 60 min, washed with 10 mL of 0.1 mol L–1 HCl and then with 50 mL of distilled water, dried at 105°C, and labeled as UnKZS200 and HKZS200, respectively. Finally, the UnKZS200 or HKZS200 was heated at 300 and 500°C for 3 h and labeled as UnKZS300 and UnKZS500 or HKZS300 and HKZS500, respectively. For the sake of comparison, the same procedure for the synthesis of HKZS200 was repeated without HK to evaluate the effect of wet aging, sonication, and thermal treatment on ZrOCl2·8H2O. The samples produced were labeled as ZrOCl2-S, ZrOCl2-S100, and ZrOCl2-S200 for the samples heated at 70, 100, and 200°C, respectively. In addition, the synthesis of HKZS-100 was repeated, replacing ZrOCl2·8H2O and water with 10 mL of concentrated HCl (36–37%) to resemble the acidity produced during the hydrolysis of ZrOCl2·8H2O. The samples produced were labeled as HK-S-HCl, HK-S-HCl100, and HK-S-HCl200 and were heated at 70, 100, and 200°C, respectively. HK was also heated at 300 and 500°C, and similarly labeled as HK300 and HK500, respectively. Detailed names, labels, and synthesis parameters are given in the Supplementary Material (Table S1).
Adsorption of Cd 2+ , Cu 2+ , or Pb 2+ .
The adsorption experiments were carried out at room temperature (~25°C). To investigate the effect of the initial pH on the adsorption behavior of Cd2+, Cu2+, or Pb2+, a 10 mL volume (v) with an initial concentration of 10 mg L–1 (C i) of the metal ions (as nitrate) was added to a mass (m) of 10 mg of HK or HKZS300. The resulting solutions containing adsorbent were agitated for 60 min. The initial pH values, 1.87, 3.0, 5.0 (acetate-buffered), and 8.0 (ammonia-buffered), were controlled using 0.1 M NaOH and HNO3 solutions. The suspensions were filtered and the final concentration of metal ions in solution (C f) was determined by FAAS. The removal efficiencies (E, %) of the metal ions onto HK or HKZS300 were calculated using the following equation:
The distribution coefficient of the metal ions (K d, M ) and the selectivity coefficient (S M1/M2) were calculated using the following equations:
Results and Discussion
Characterization
XRD/TG studies.
X-ray diffraction (Fig. 1) traces indicated the effect of zirconium oxychloride on kaolinite in the raw inactivated kaolin (UnK) and the HCl-activated kaolin (HK) after homogenizing mixtures by a sonication-impregnation technique and heating the products at 100, 200, 300, or 500°C. The XRD pattern of the parent materials (UnK and HK) were typical of kaolin and similar to those obtained previously with d 001 values for kaolinite of 7.19 Å (Drweesh et al., Reference Drweesh, Fathy, Wahba, Hanna, Akarish, Elzahany, El-Sherif and Abou-El-Sherbini2016). The XRD pattern of ZrOCl2·8H2O was also typical of a pure substance (ICSD 00-032-1498).
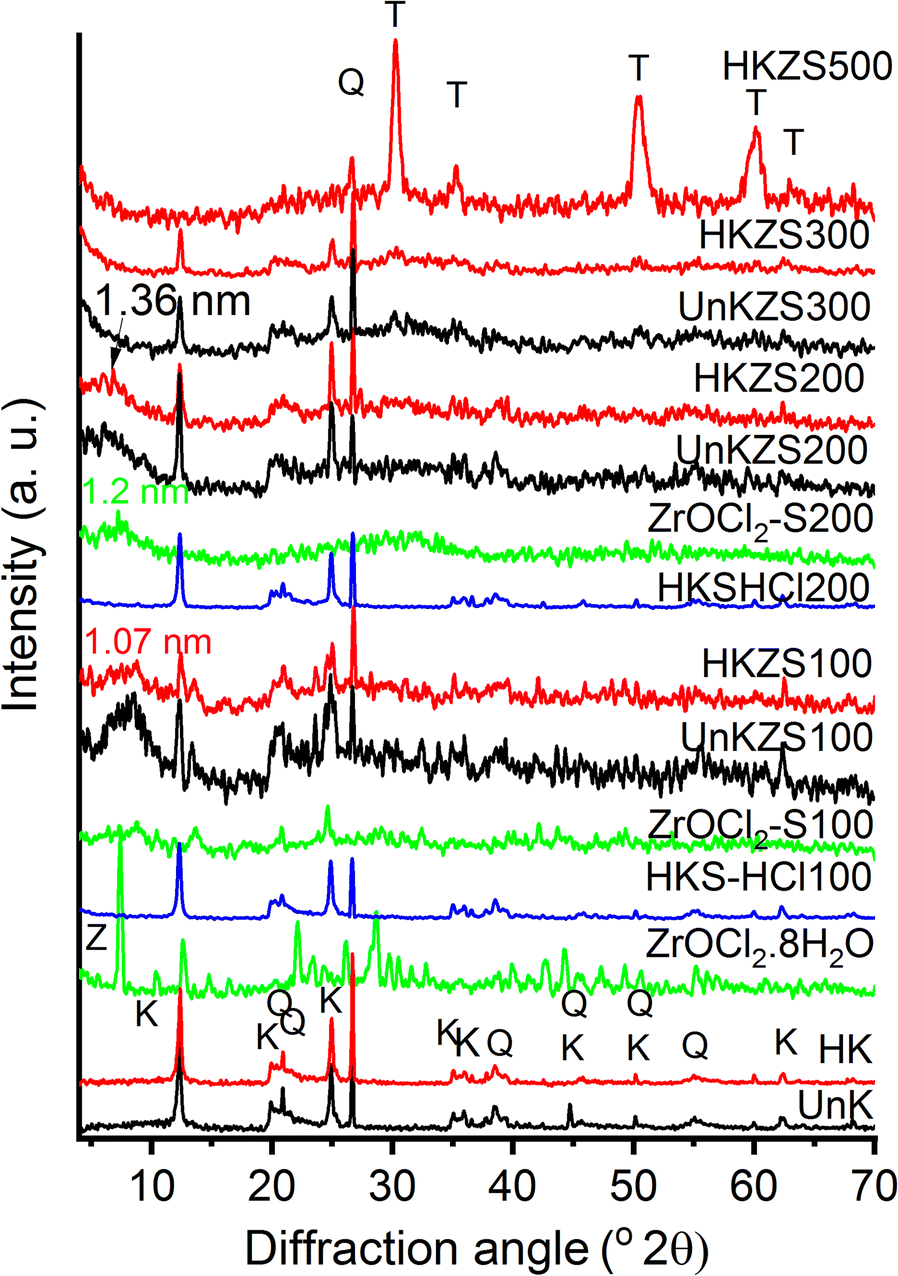
Fig. 1. XRD patterns of UnK, HK, ZrOCl2·8H2O, and their ZrO2-modified products. K, Q, Z, and T denote kaolinite, quartz, ZrOCl2·8H2O, and tetragonal zirconia, respectively
Within the present XRD parameters, no decisive evidence of the intercalation of ZrO2 into kaolinite layers of the ZrOCl2-treated kaolins could be observed. A remarkable decrease in the intensity of the kaolinite reflections was observed, however, especially that of the basal spacing (d 001) of kaolinite phases compared with the d 101 reflection of quartz at 3.34 Å in the parent kaolins (UnK and HK) and concentrated HCl-treated HK blanks (HK-S-HCl100 and HK-S-HCl200). Although new, broad reflections were observed, with greater d 001 values of 10.7–13.6 Å, for the ZrOCl2-treated samples dried at 100–200°C, which are close to the reported basal spacing of meta-kandite intercalated with ZrO2– 14.5 Å (Vaughan, Reference Vaughan1994), they may also be due to the residues of incompletely decomposed ZrOCl2·8H2O when compared with the diffraction patterns of ZrOCl2-S100 and ZrOCl2-S200. Relative broadening as well as the decrease in intensity of basal spacing peaks, compared to the parent clay mineral, were reported to be good evidence for the existence of successful intercalation, and/or an irregular-packing of intercalated and non-intercalated layers (Valverde et al., Reference Valverde, de Lucas, Sánchez, Dorado and Romero2003; Majd et al., Reference Majd, Davoudi, Ramezanzadeh, Ghasemi, Ramezanzadeh and Mahdavian2020). In addition, the intercalation of kaolinite, in particular, may reduce XRD quality due to the generation of lattice perturbation, defects, and disorders in the structure (Grzybek et al., Reference Grzybek, Klinik, Olszewska, Papp and Smarzowski2001).
Zr(IV)-intercalation in other clays was reported (Ohtsuka et al., Reference Ohtsuka, Hayashi and Suda1993; Chaabene et al., Reference Chaabene, Bergaoui and Ghorbel2004; Valášková et al., Reference Valášková, Tokarský, Hundáková, Zdrálková and Smetana2013). Two models of Zr-tetrameric cations ([Zr4(OH)14(H2O)10]2+ and [Zr4(OH)8(H2O)16]8+, and one model of Zr-octameric cation ([Zr8(OH)20(H2O)24]12+) were built; only the tetrameric models were studied for intercalation into vermiculite because the octameric cation was excluded due to its thickness (1.0 nm) being greater than that of the vermiculite layer (0.86 nm) (Valášková et al., Reference Valášková, Tokarský, Hundáková, Zdrálková and Smetana2013). The insertion of Zr-tetrameric cations into vermiculite was suggested to yield a d 002 of 14.2 Å. Successful Zr(IV)-intercalation in montmorillonite was also reported to have a van der Waals’ spacing of 11.4 or 7.0 Å (Ohtsuka et al., Reference Ohtsuka, Hayashi and Suda1993; Chaabene et al., Reference Chaabene, Bergaoui and Ghorbel2004), assigned to hosting of octamer [Zr8(OH)20(H2O)24Cl12]4+ or tetramer [Zr4(OH)8(H2O)16Cl6]2+, respectively.
According to the length and thickness of the [Zr4(OH )12(H2O)12]4+ polycation estimated to be 9.1 and 5.5 Å, respectively (Miehé-Brendlé et al., Reference Miehé-Brendlé, Khouchaf, Baron, Le Dred and Tuilier1997), the intercalation form of Zr(IV) in the Zr-modified kaolin samples is supposed to proceed in two steps: (1) ZrOCl2·8H2O undergoes hydrolysis which increases with temperature (Matsui & Ohgai, Reference Matsui and Ohgai2002), to form tetramers [Zr4(OH)8(H2O)16]8+ or more complex polyoxide polymers. (2) The resultant hydrated tetramers are bonded to the kaolinite layers with face-to-face or edge-to-edge positioning parallel to the xy plane as the unit kaolinite layer thickness is ~5.4 Å (Zhang et al., Reference Zhang, Chen and Xing2017).
Comparing the diffraction patterns of UnKZS100-300 (ZrOCl2-treated inactivated kaolin) with HCl-activated analogs HKZS100–300, the ratio of intensities of the 00l lines of kaolinite to the quartz reflection at 3.34 Å, accounting for the d 101 of quartz, were observed to decrease in the HK-activated kaolin compared with untreated kaolin, which may indicate that the ZrO2 binding process is enhanced by the acid-activation of the kaolinite surface. This may be attributed to the release of more surface OH groups upon acid activation (Drweesh et al., Reference Drweesh, Fathy, Wahba, Hanna, Akarish, Elzahany, El-Sherif and Abou-El-Sherbini2016).
The ~13 Å d value was not observed by XRD for the samples heated at 300 or 500°C (Fig. 1), while sustaining a remarkable reduction in the parent d 001 intensity relative to the d value at 3.34 Å accounting for the d 101 reflection of quartz. The increase of background intensity at >8°2θ for both UnKZS300 and HKZS300 may be due to the polymerization of intercalated zirconia building units with increasing temperature yielding an amorphous kaolinite with an enlarged perturbed structure. Polymerization of the intercalated Zr(IV) species was suggested to form zirconia sandwiched face-to-face or edge-to-edge between less ordered stacking of the kaolinite layers. The polymerization of tetramer and octamer forms of Zr(IV) was reported to be enhanced with calcination yielding crystalline zirconia (Farfan-Torres et al., Reference Farfan-Torres, Sham and Grange1992; Chaabene et al., Reference Chaabene, Bergaoui and Ghorbel2004).
A loss of the uniform layered packing in the xy plane of Zr-modified kaolinite layers may accompany thermal treatment that causes aggregation of zirconia particles and weakens bonding between kaolinite layers with ZrO2. This explanation is supported by XRD (Fig. 1) via the disappearance of kaolinite reflections (due to the dehydration of the kaolinite and the formation of metakaolinite (Gil et al., Reference Gil, Vicente, Lambert and Gandιa2001)) and the development of a ZrO2 metastable tetragonal phase [PDF80-0965] at 500°C. Obtaining the tetragonal ZrO2 metastable phase at such a low temperature is interesting due to its catalytic importance (Vera et al., Reference Vera, Pieck, Shimizu and Parera2002), knowing that it crystallizes at a temperature of 1205°C (Chevalier et al., Reference Chevalier, Gremillard, Virkar and Clarke2009), or at lower temperature by using special calcination conditions such as the presence of silica or alumina as supporting materials (Nagarajan & Rao, Reference Nagarajan and Rao1990).
TGA. In order to understand the mechanism further, a TGA measurement (Fig 2) was performed for the ZrOCl2·8H2O and HKZS sample that was dried at 70°C without further thermal treatment. The TGA of ZrOCl2·8H2O showed the presence of five mass-loss stages, with T max at 113, 162, 286, 343, and 460°C, which corresponded to mass-loss stages of 25.3, 18.3, 10.2, 3.1, and 3.4%, respectively. These results are close to the thermal decomposition of ZrOCl2·8H2O, performed in air, reported to occur in two major mass-loss stages (Takagi, Reference Takagi1954; Gorodylova et al., Reference Gorodylova, Šulcová, Bosacka and Filipek2014; Gorodylova & Šulcová, Reference Gorodylova and Šulcová2018), which help to explain the ZrOCl2·8H2O/HK reaction. A release of crystalline water was reported within the range 70–230°C, leading to the formation of XRD-amorphous ZrOCl2 as illustrated in Eq. 4. In the temperature range of 230–500°C, ZrOCl2 reacts with atmospheric water to form amorphous ZrO2 and HCl is released as shown by Eq. 5. A small exothermic effect was observed with a maximum rate at 500°C that can be associated with the crystallization of monoclinic ZrO2(Beden & Guillaum, Reference Beden and Guillaum1969) as represented by Eq. 6.
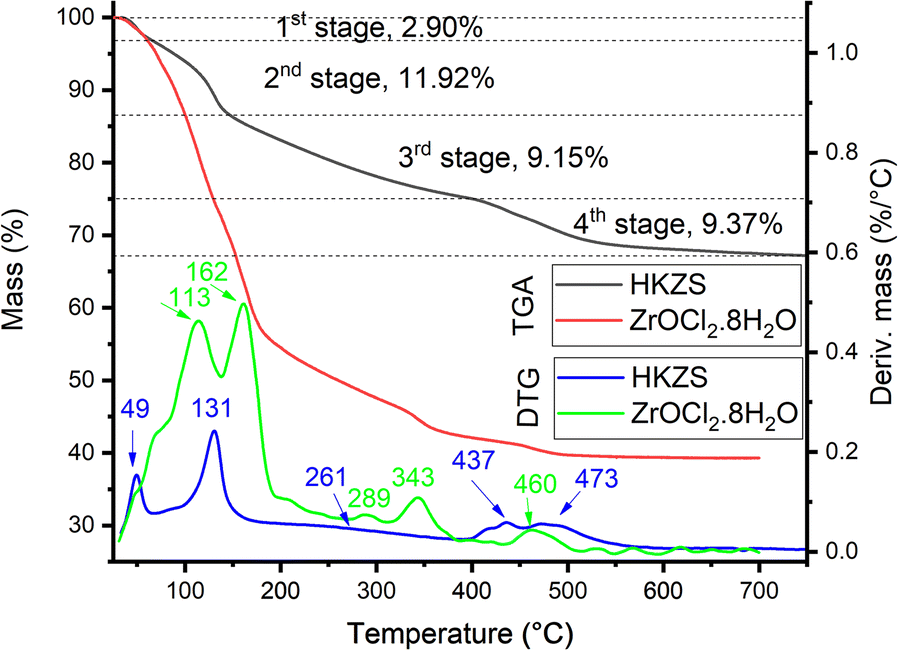
Fig. 2. TGA and DTG of ZrOCl2·8H2O and impregnated ZrOCl2·8H2O + HK (HKZS) at a heating rate of 10°C/min under N2
The TGA of the HKZS (Fig. 2) showed the presence of four principal mass-loss stages at T max 48.9, 130.8, 261.0, and 436.6–472.6°C, which correspond to 2.90, 11.92, 9.15, and 9.37% of mass-loss stages, respectively.
On the other hand, TGA of HK was reported to show two main mass-loss stages at 25–75°C and 490°C, which were attributed to elimination of the adsorbed H2O and dehydroxylation of kaolinite aluminols, respectively (Drweesh et al., Reference Drweesh, Fathy, Wahba, Hanna, Akarish, Elzahany, El-Sherif and Abou-El-Sherbini2016), as explained in Eq. 7.
Accordingly, the first and second stages in the present TGA study of HKZS (Fig. 2) were attributed to the loss of water (either adsorbed on kaolin or crystallized in ZrOCl2·8H2O) and HCl. The formation of white clouds in the ammonia solution test indicated the evolution of HCl gas, beginning from 70°C. The third stage may have been related to the loss of most chloride content, as revealed from the EDX measurement of the HKZS300 (Fig. S2) and the elemental mapping results (Fig. S3), which differed from the reported thermal decomposition of ZrOCl2·8H2O to amorphous ZrO2(Eq. 6), that may be physically or chemically bonded to perturbed kaolinite layers as suggested by the XRD study.
The last TGA stage, which showed a remarkable reduction in the offset-temperature of the stage of HK (490°C) (Drweesh et al., Reference Drweesh, Fathy, Wahba, Hanna, Akarish, Elzahany, El-Sherif and Abou-El-Sherbini2016), was composed of multiple overlapped thermal decomposition reactions. During this stage, dehydroxylation of aluminol groups clearly took place. Accordingly, the existence of the dehydroxylation stage below 500°C and its complex structure are evidence of the bonding of the kaolinite layers with the intercalated ZrO2(Kristó et al., Reference Kristó, Frost, Felinger and Mink1997; Cheng et al., Reference Cheng, Liu, Cui, Zhang, Zhang and Frost2012).
The last stage was accompanied by the crystallization of the tetragonal ZrO2 as concluded from the XRD pattern of the HKZS500 (Fig. 1), contrary to the expected monoclinic form reported in the literature for the thermal treatment of ZrOCl2.8H2O in air (Gorodylova et al., Reference Gorodylova, Šulcová, Bosacka and Filipek2014). This may be attributed to the influence of kaolinite as a support for the crystallization process of ZrO2.
XRF. Analysis by XRF of UnK and HK and their zirconia-modified kaolins UnKZS300 and HKZS300 (Table 1) gave results which were very similar to those from EDX measurements (Fig. S3), indicating the homogeneity of the sample despite the presence of separate phases of silica-, titania-, and zirconia-rich kaolinite. The XRF indicated that Si/Al atomic ratios increased to 1.383 and 1.631 in UnKZS300 and HKZS300 compared with their initial values (1.226 and 1.258) in the parent samples UnK and HK, respectively. On the other hand, Cl/Zr atomic ratios decreased from the theoretical 2:1 in ZrOCl2·8H2O to only 0.329 and 0.272 for UnKZS300 and HKZS300, respectively. These results suggest a partial release of Al as AlCl3 from the kaolinite lattice as a result of the thermal treatment of zirconyl chloride with kaolin at temperatures up to 300°C according to Eq. 8.
Table 1. XRF analysis of UnK and HK and their zirconia-modified kaolins

As determined by loss on ignition (LOI), the kaolinite percentages were 89.28 and 83.90% in UnK and HK, respectively
The atomic ratios of Zr/Al in UnKZS300 and HKZS300 (0.637 and 0.691) were also smaller than the starting values of UnK and HK (0.912 and 0.920). These results mean that the loading efficiency of zirconia with respect to kaolinite in HKZS300 is greater than that of UnKZS300 where zirconia loading efficiencies were 69.8 and 75.1%, respectively.
On the other hand, metal contents in the acid-activated samples were slightly less than those for the untreated samples, indicating the leaching effect of HCl that releases the OH groups engaged in bonding with the leached metal ions; this was also reported previously (Drweesh et al., Reference Drweesh, Fathy, Wahba, Hanna, Akarish, Elzahany, El-Sherif and Abou-El-Sherbini2016).
FTIR. The FTIR spectra (Fig. 3) obtained for the ZrOCl2·8H2O, UnK, HK, HK-S-HCl, HK300, and HK500 samples and their kaolin-ZrO2-modified products showed, for UnK, HK, and HK-S-HCl, three strong absorption bands centered at 3697, 3654, and 3622 cm–1, corresponding to the inter- and intra-hydroxyl groups (Farmer & Russell, Reference Farmer and Russell1964; Frost et al., Reference Frost, Kristof, Paroz, Tran and Kloprogge1998; Abou-El-Sherbini et al., Reference Abou-El-Sherbini, Elzahany, Wahba, Drweesh and Youssef2017). The bands at ~1626 and ~3430 cm–1 correspond to the bending and stretching modes of the OH groups of water molecules. The bands centered at 1111, 1034, 1005, 938, 913, 792,753, 694, 537, 469, and 428 cm–1 are assignable to the apical Si–O stretching, two in-plane Si–O–Si stretching, inner Al–OH bending, inner surface Al–OH bending, three OH translational, Si–O–Al in-plane bending deformation, Si–O bending, and Si–O vibrations, respectively, which are typically the IR absorption bands of kaolinite (Frost & Vassallo, Reference Frost and Vassallo1996). The FTIR spectra of HK300 showed a 1–2 cm–1 blue shift in the wavenumber positions of stretching modes of the inner and inner surface hydroxyl-group vibrations while in HK500 all Al–O–H-including vibration bands disappeared due to the dehydroxylation of aluminols and the formation of the amorphous metakaolinite phase (Frost & Vassallo, Reference Frost and Vassallo1996). Also, new broad bands appeared at 1080 and 799 cm–1, ascribed to the Si–O and AlO4 vibrations, respectively, in the newly formed metakaolinite (Ilić et al., Reference Ilić, Mitrović and Miličić2010). The FTIR spectra of both ZrOCl2.8H2O and ZrOCl2-S showed strong absorption bands at 3000–3500 cm–1(broad) and 1620–1624 cm–1 due to νOH and δOH vibrations of water molecules. Much weaker absorption bands at 545–548, 438–439, and 407–415 cm–1 are due to Zr–O (Štefanić et al., Reference Štefanić, Musić, Popović and Furić1996).
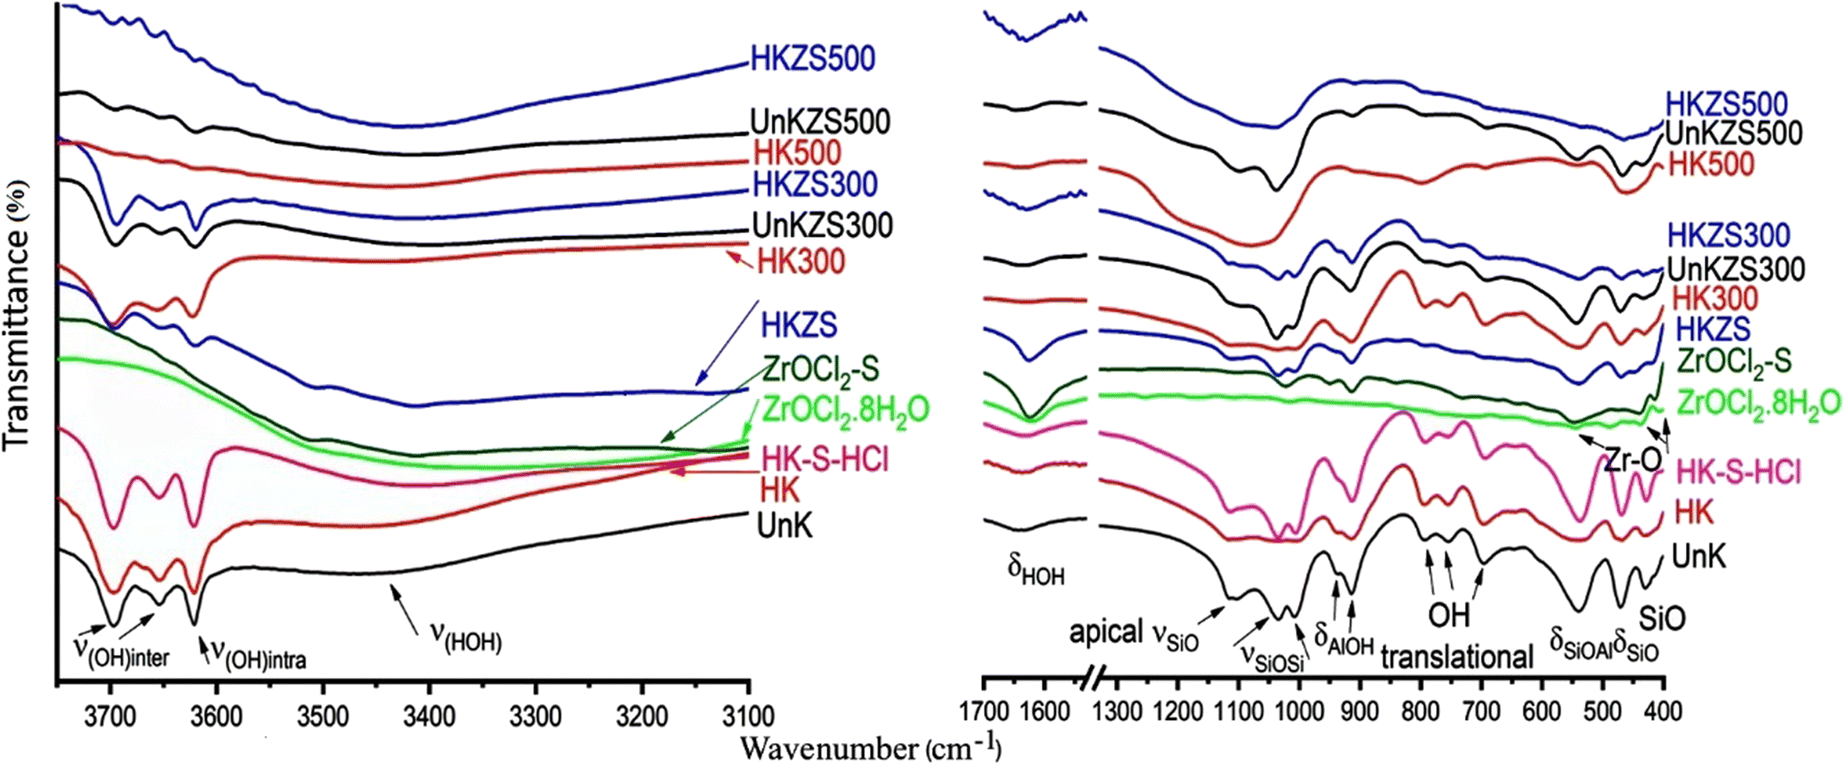
Fig. 3. FTIR spectra of HK, HK300, HK500, and their ZrO2-modified products
By comparing the FTIR spectra of HK and HK300 with those of HKZS, HKZS300, and UnKZS300, the effect of the Zr(IV) coating on the kaolinite structure was confirmed by the observed 2 cm–1 red shift in the stretching modes of the inner and inner-surface hydroxyl-group vibrations (especially in HKZS300), the remarkable weakness of the surface stretching AlO–H vibrations, and a red-shift of 15 cm–1 of the stretching mode of the OH groups of water molecules at 3430 cm–1. Also, the bands due to Zr–O at 407–415 and 438–439 cm–1 in ZrOCl2·8H2O and ZrOCl2-S were blue-shifted to 420 and 449 cm–1 in the FTIR spectra of HKZS but could not be distinguished in the other zirconia-modified kaolin samples. The interaction of OH, Si–O, and aluminol groups with the Zr(IV) species confirmed the intercalation of zirconia and the presence of strong bonding with kaolinite surface as concluded elsewhere with another aluminosilicate support; SBA-15(Gong et al., Reference Gong, Sun, Sun, Li and Liu2011).
In addition, the FTIR spectra of UnKZS500 and HKZS500 support the intercalation process of zirconia through the remarkable decrease of bands due to AlO4 vibrations in the metakaolinite, in addition to the appearance of multiple weak bands in the region of the inner and inner-surface OH-group vibrations for HKZS500, which confirmed the strong interaction between aluminols and zirconia. The blue shift of hydroxyl-stretching vibrations was reported to indicate weaker hydrogen bonding, corresponding to the structural OH groups with the higher energies (i.e. wavenumbers) and the weaker participation in the hydrogen bonding (Libowitzky & Beran, Reference Libowitzky and Beran2004). Accordingly, the observed red shift accompanying zirconia upload may be correlated with O–H stretching frequencies and O–H…..O stronger hydrogen bond strength due to the coating with zirconia (Libowitzky, Reference Libowitzky, Schuster and Mikenda1999). A summary (Table 2) was given for the FTIR absorption spectra (cm–1) of kaolin and its zirconia-modified samples.
Table 2. Locations and assignment of FTIR absorption bands (cm–1) of kaolin and its zirconia-modified samples
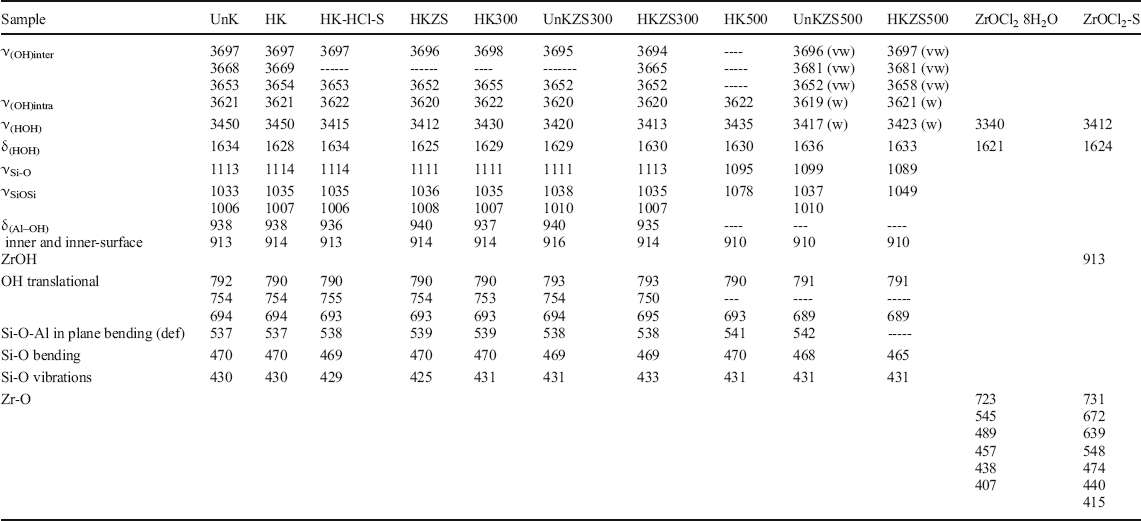
vw: very weak, w: weak, def: deformation
SEM. Examination of HK by SEM (Fig. 4a) indicated that kaolinite is found as discrete, coarse aggregates, poorly crystallized with irregular geometry that might reflect its detrital nature. In addition, silt-sized quartz grains were present. The SEM image of HKZS300 (Fig. 4b) revealed improvement in the lamellar crystalline nature of the clay, as well as a uniform distribution of Zr over all of the face-to-face- and edge-to-edge-ordered clay layers as confirmed by the EDX measurement (Fig. S3), despite the presence of minor constituents of ZrO2-rich/kaolinite. Zeta size mapping (Fig. S4) confirmed these large differences in the morphologies of HK and HKZS300. Although HK was polydispersed, mainly due to the presence of sedimentary particles, it showed a high population of particles having a diameter of 1 μm, while the HKZS300 sample was not suitable for DLS measurements due to its polydispersed nature. The HKZS300 contained large particles and aggregates with an average size larger than the upper size display limit of the Zeta Sizer instrument (10 μm). The presence of zirconia in the HKZS300 led to binding of the layers with kaolinite particles.
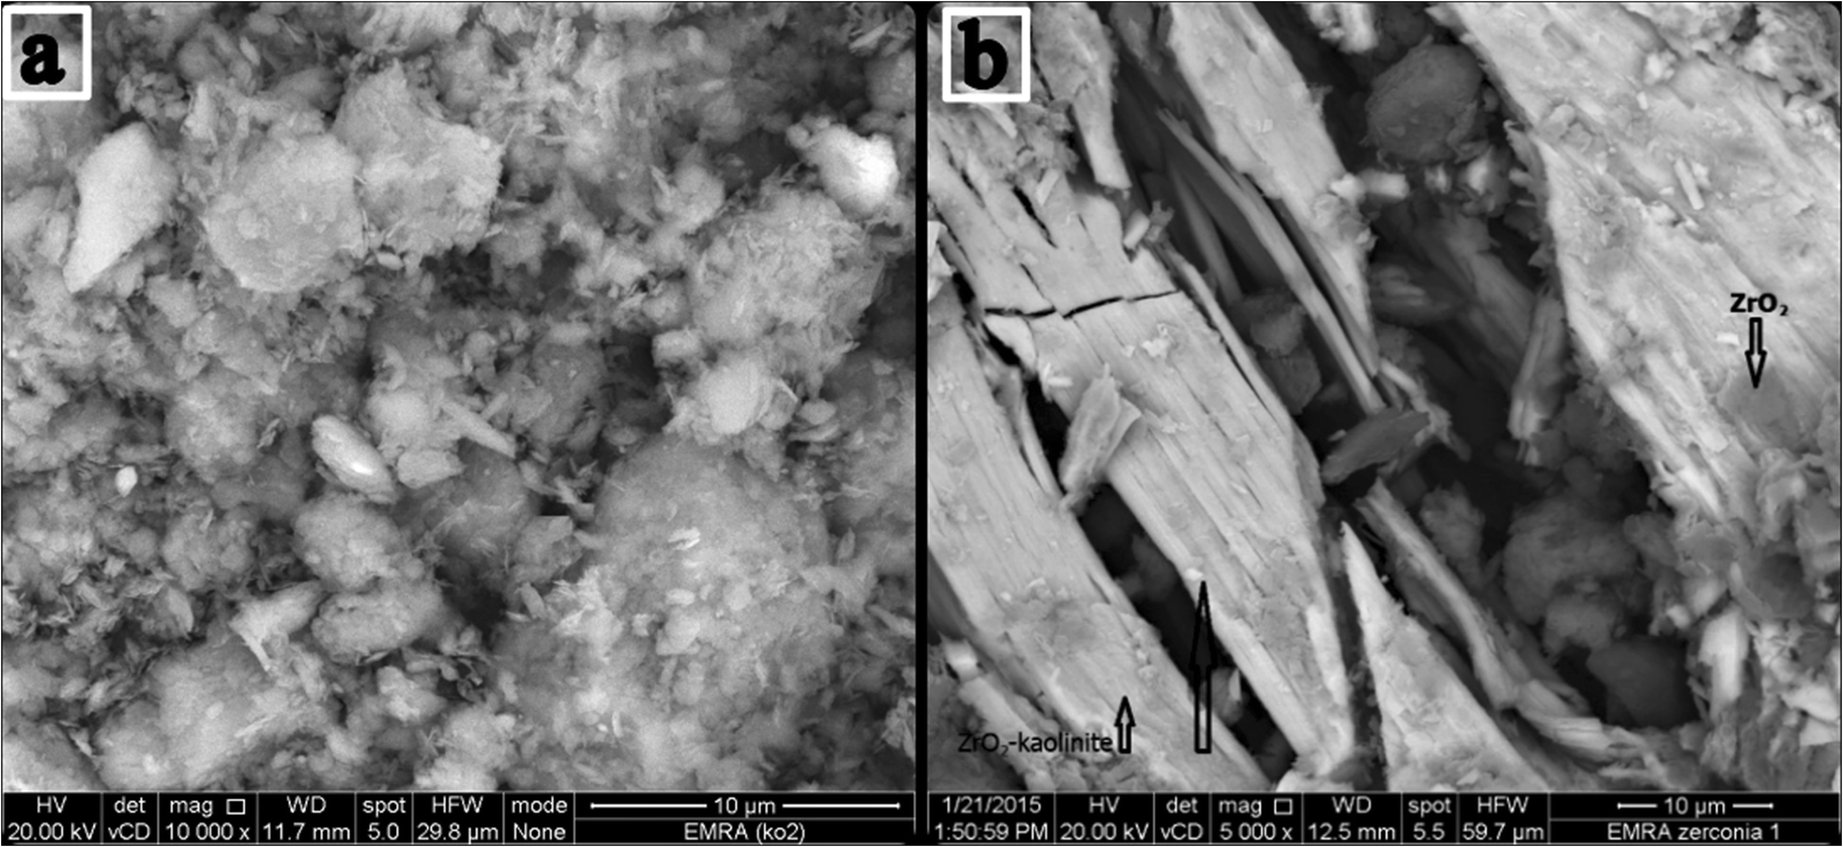
Fig. 4 SEM images of aHCl-treated kaolinite (HK) and b its Zr-intercalated sample HKZS300
TEM. Transmission electron microscopy images for HKZS300 (Fig. 5a–h) support the presence of zirconia-intercalated kaolinite phases with basal spacings of ~11 to 25 Å, as illustrated in Fig. 5h, while the 7.16 Å d 001 value of the parent kaolinite is present also. Both kaolinite phases, the pristine and the enlarged, could be recognized easily even in the same particle (regions A and B in Fig. 5c). The modified kaolinite crystallites were observed to be darker on their edges than in their centers (Fig. 5d, f). A TEM-SAED pattern of kaolinite layers (Fig. 5d, e) also showed well-defined spots with d spacings of ~21.49 Å. These observations may be explained by assuming gradient contents of intercalated zirconia into kaolinite interlayer space that decrease toward the kaolinite crystallite center. The observed darker edges compared to centers of particles (Fig. 5d, f) support the suggested cement-like action of zirconia to the kaolinite particles, which in turn led to enhancement of the stacking order of the kaolinite particles. In addition, the kaolinite layers appeared thicker by variable levels than their ideal 5.4 Å thickness of the silica-gibbsite layer (Fig. 5g, h). The outer surface of the kaolinite crystallites in the XY plane was observed to be coated with a layer of nano-sized dark particles of 1.8 nm diameter, capturing nanopores within them (Fig. 5g); these may be zirconia nano-particles formed by dimerization or higher polymerization of zirconia tetramers. The enlarged kaolinite phase was observed to be wavy and strongly perturbed, which explains the poor-quality XRD patterns of zirconia-modified kaolin samples. Partial intercalation of ZrOCl2·8H2O into kaolinite occurred at temperatures of up to 500°C (Fig. 6).
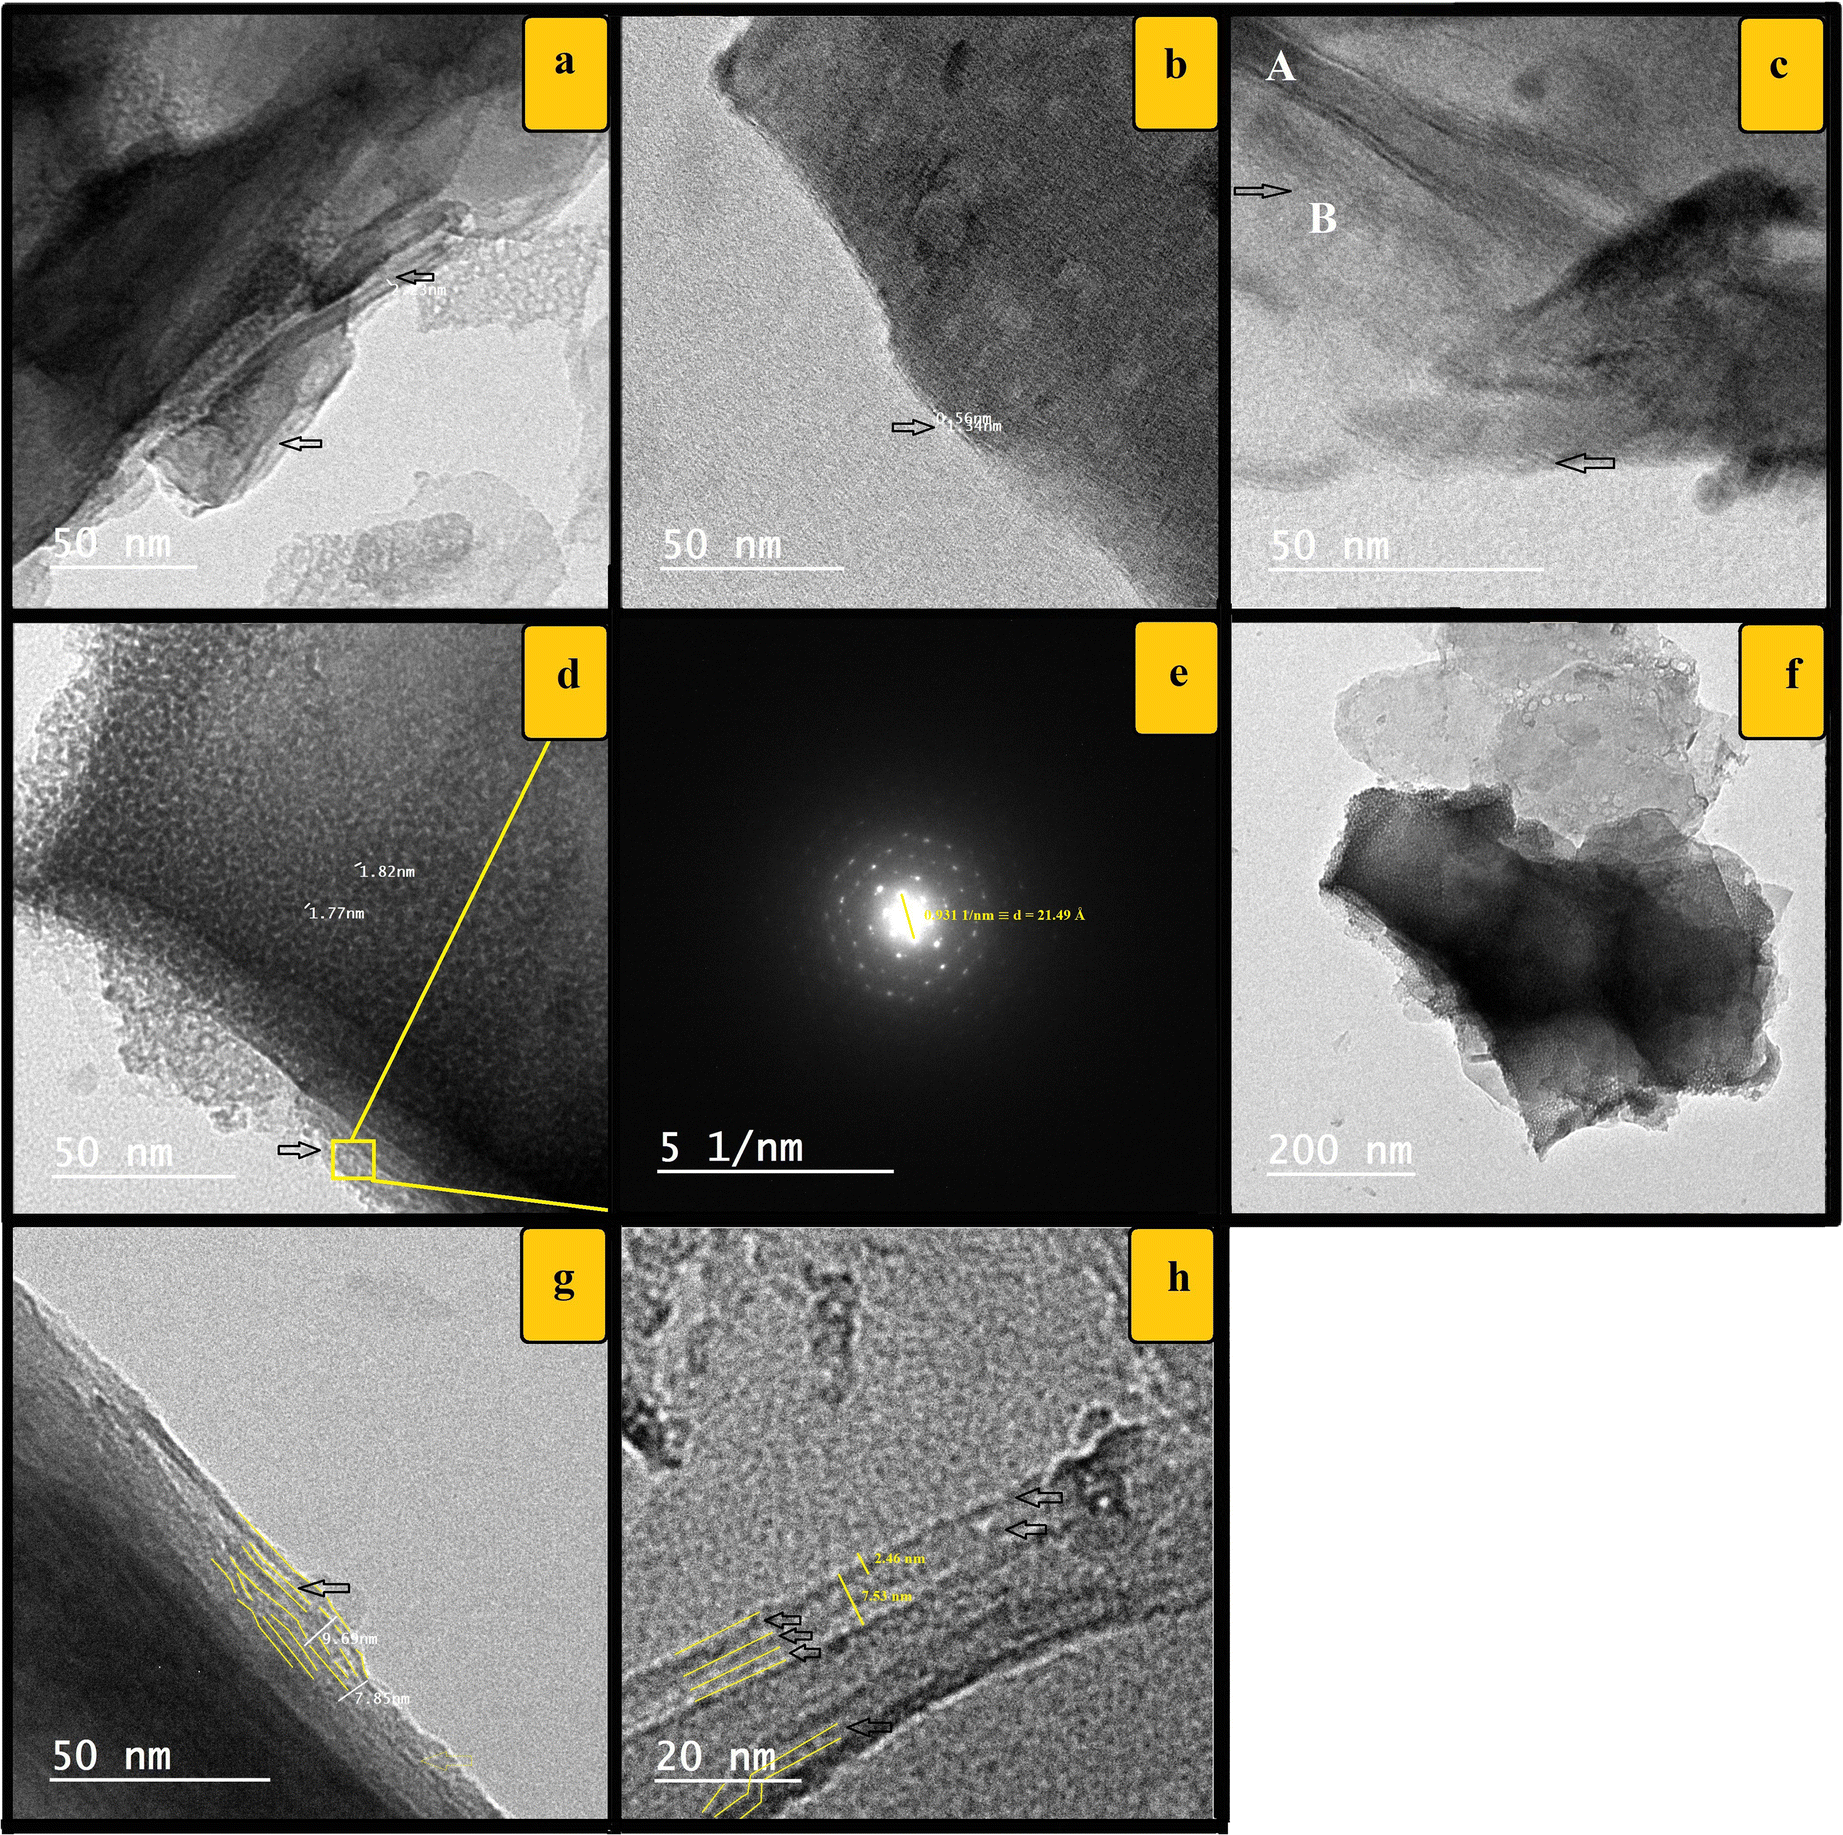
Fig. 5. TEM images a–h of Zr-intercalated sample HKZS300. TEM-SAED pattern of kaolinite layers in part d is shown in part e. The arrows indicate examples of enlarged interlayer spacings while the yellow lines show some perturbed and enlarged layers. Calculations written in yellow were made by ImageJ software
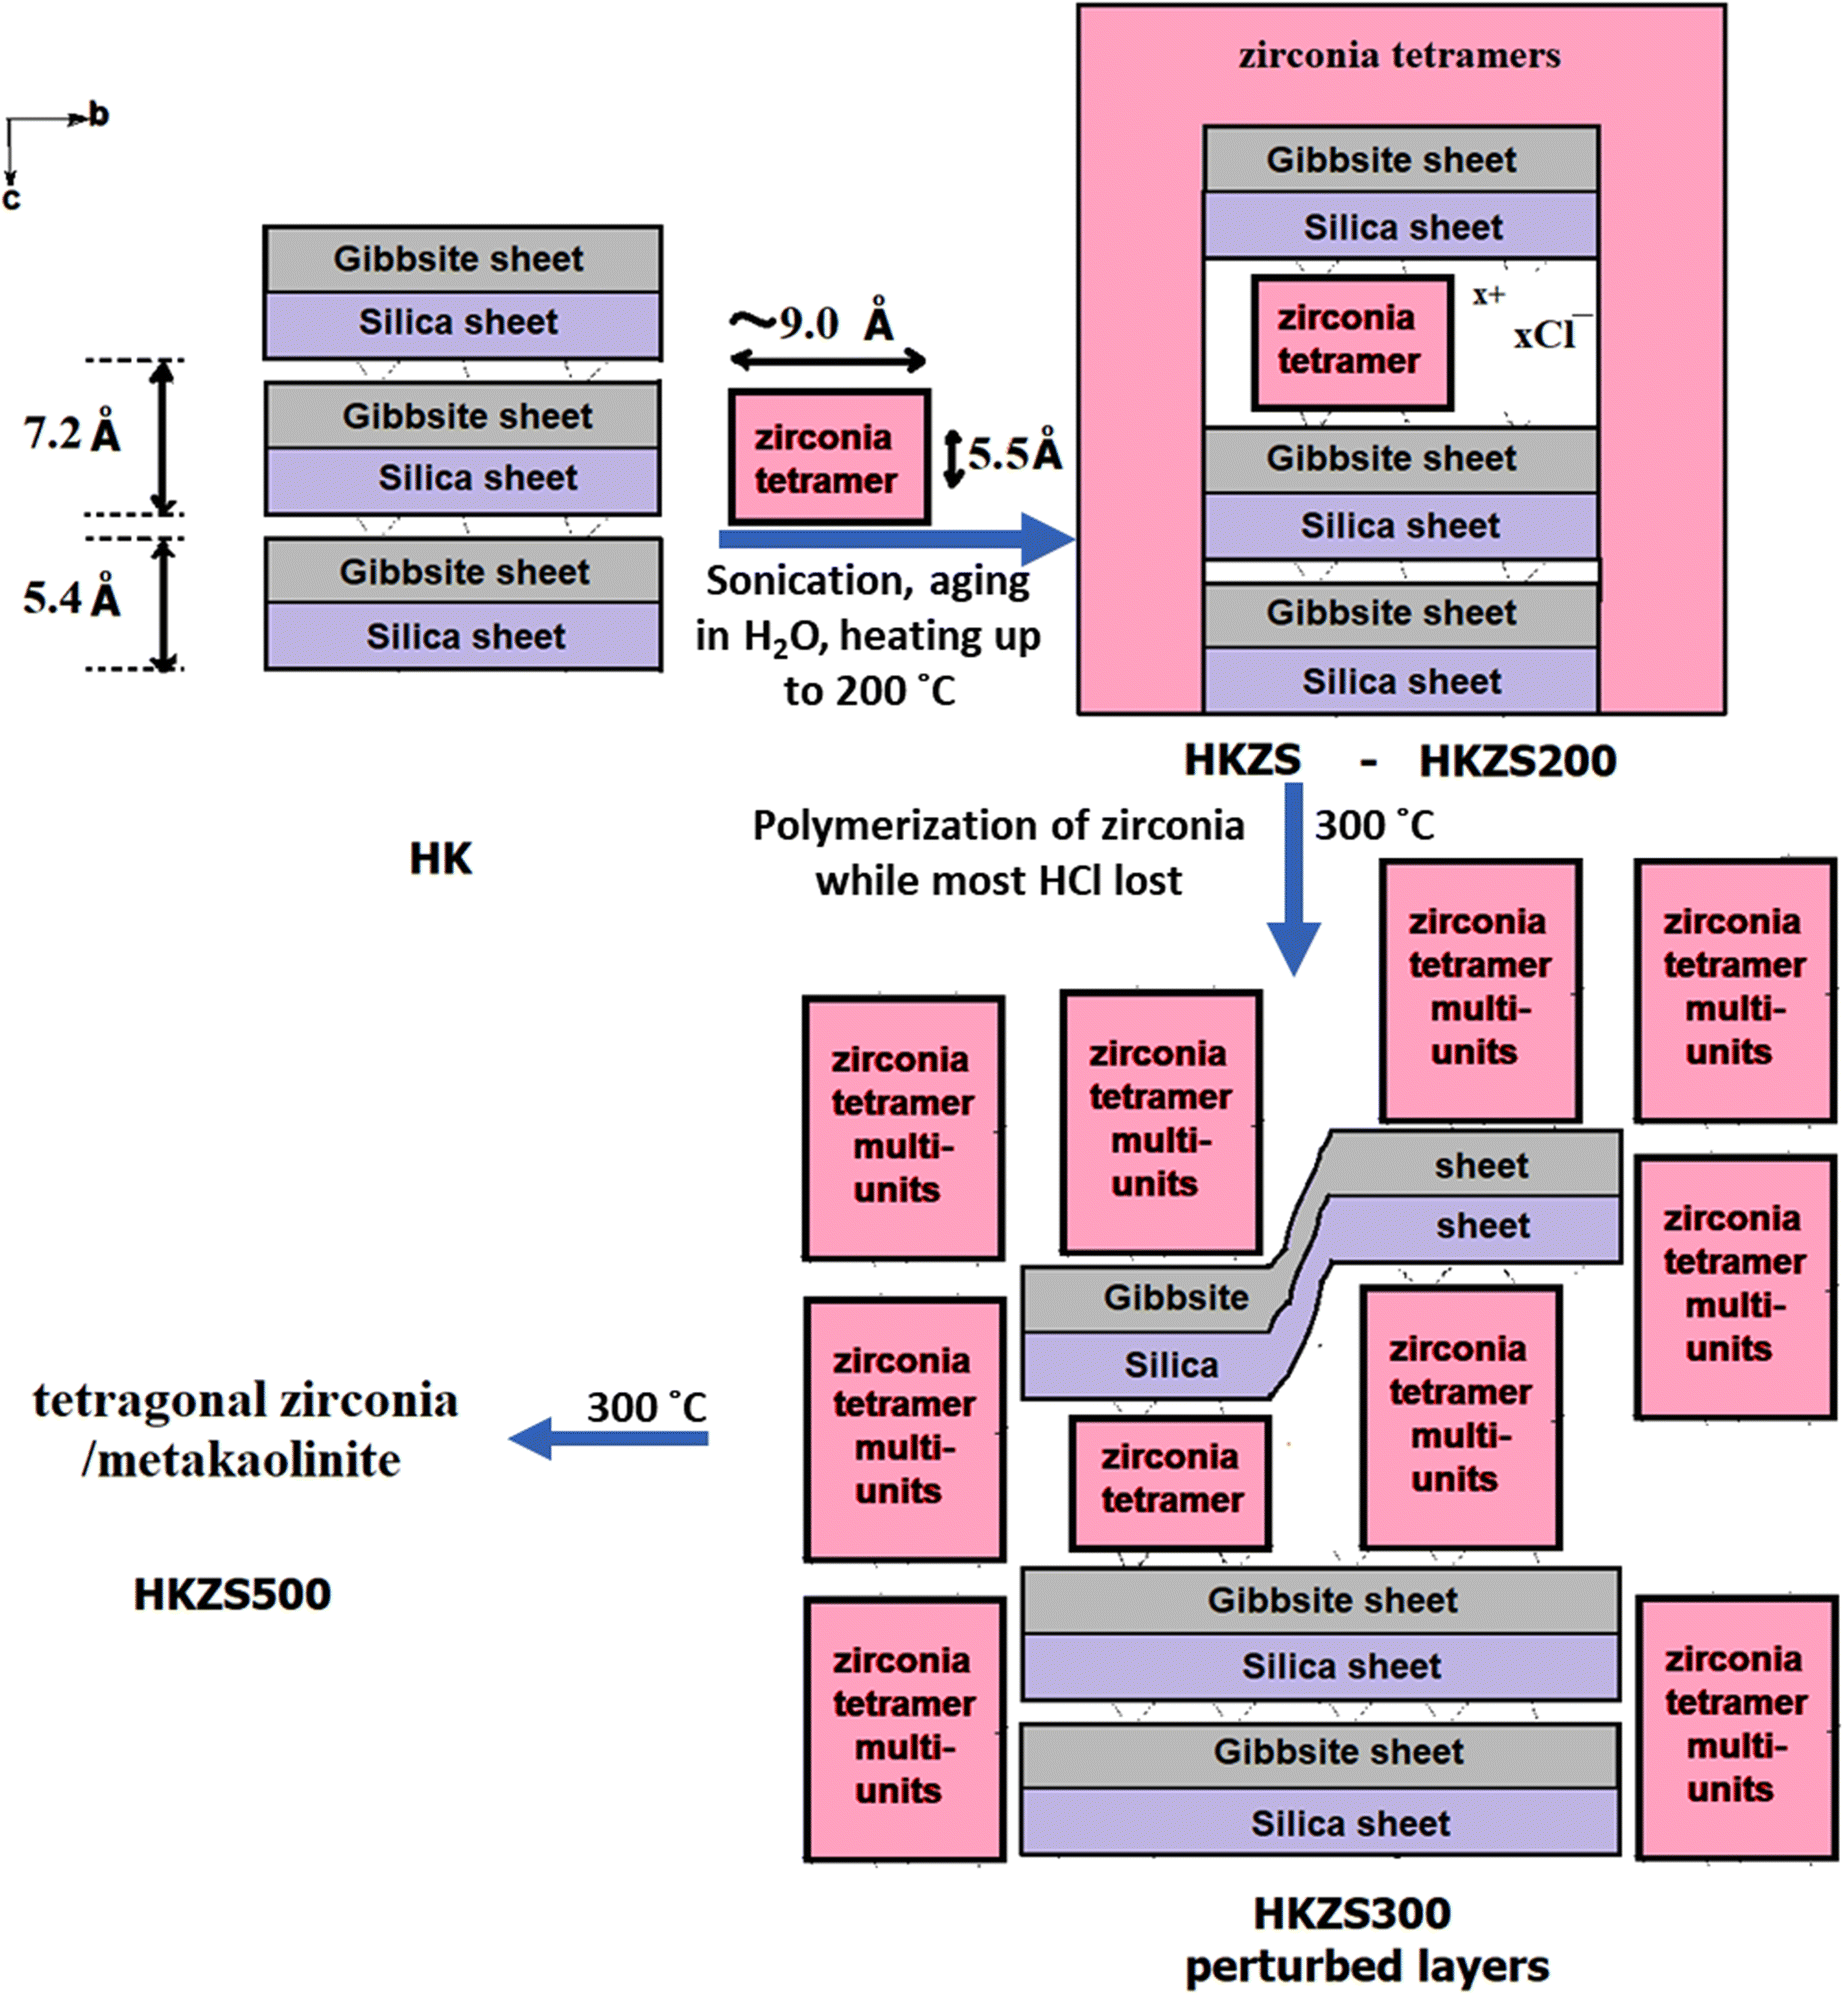
Fig. 6. Schematic representation of ZrOCl2·8H2O intercalation into kaolinite layers and its temperature dependence
Texture study.
The N2adsorption/desorption isotherms and pore-size distributions (Fig. 7a, b , respectively) were performed for HK and its zirconia-modified product, HKZS300. Three well distinguished regions of the adsorption isotherm were evident: (1)monolayer-multilayer adsorption; (2) capillary condensation; and (3) multilayer adsorption on the outer surfaces of the particles. HK samples have the type II isotherm with a distinct capillary condensation step, which is characteristic of mesoporous materials according to the classification of the International Union of Pure and Applied Chemistry (IUPAC). Nitrogen adsorption-desorption isotherms of HK illustrated a clear H4 type hysteresis loop in the relative pressure range between 0.4 and 1.0, implying that this material had very regular mesoporous channels. Based on the surface texture data (Table 3), HK was observed to have a mesopore area of 24.17 m2 g–1 and mesopore volumes of 0.125 cm3 g–1, which are in good agreement with the results reported by Drweesh et al. (Reference Drweesh, Fathy, Wahba, Hanna, Akarish, Elzahany, El-Sherif and Abou-El-Sherbini2016).

Fig. 7. a N2 isothermal adsorption and desorption profiles and b pore-size distribution plots for HK and HKZS300 samples
Table 3. Surface texture parameters of HK and its zirconia-modified product HKZS300

The adsorption isotherm of HKZS300 (Fig 7a) was estimated to be Type-II, based on the IUPAC classification of sorption isotherms, indicating the existence of mesoporosity. In addition, an obvious type H4 hysteresis loop can also be seen in the relative vapor pressure range of 0.4–1.0 bar, indicating the presence of a hierarchical micro/mesoporous system (Valášková et al., Reference Valášková, Tokarský, Hundáková, Zdrálková and Smetana2013). This was further ascertained by the BJH pore-size distribution plot (Fig. 5b) which confirmed the presence of micropores with an average size of ~1.83 nm and mesopores with an average size of ~3.98 nm. The HKZS300 sample showed a total surface area of 59.74 m2 g–1 with micro- and mesoporous surface areas of 23.68 and 36.06 m2 g–1, respectively. The total pore volume of the sample was 0.072 cm3 g–1 in which the micro- and mesoporous volumes were 0.009 cm3 g–1 and 0.063 cm3 g–1, respectively. In other words, the bulk of the total surface area and pore volume of HKZS300 was derived from mesopores. Such a mesoporous structure would be favorable for adsorption purposes in terms of improved accessibility of the adsorbent to the active binding centers within the porous structure of HKZS300, as well as high diffusion rates. The increment in S BET after zirconia intercalation represents an increase of ~250% over the parent surface area, which is in agreement with the morphological changes observed in TEM images. According to previous studies, the acid-activated samples HK and HKZS300 were selected for comparing their properties in the adsorption study of the Cd2+, Cu2+, and Pb2+, due to their confirmed reduced trace-metal contents, and the remarkable influence of zirconia on the kaolinite structure compared with the inactivated samples.
Cd 2+ , Cu 2+ , and Pb 2+ Removal Using HK and HKZS300
A preliminary adsorption study was performed to show the improvement of the kaolin properties after intercalation with zirconia. The effect of pH on the removal of some selected heavy metals (Cd2+, Cu2+, and Pb2+) by HK and HKZS300 (Figs 8 and 9) was investigated. The removal efficiencies were enhanced by increasing the pH of the medium, which may indicate the electrostatic nature of the adsorption process. A comparison of the removal efficiencies of HK and HKZS300 toward Cd2+, Cu2+, and Pb2+(Fig. 8) was performed at pH 5 and 8. Small differences between the capture of Cu2+ and Cd2+ ions on HK and/or HKZS300 were observed, while Pb2+ showed much greater capture. The removal percentages were generally enhanced using the zirconia-modified kaolin HKZS300 and by increasing the initial pH of the medium. The greatest removal percentages were achieved at pH 8; on HK and HKZS300 the removal percentages for Cd2+ were 8.99 and 14.29%; for Cu2+, 19.17 and 25.95%; and for Pb2+, the values were 23.22 and 79.44%, respectively.

Fig. 8. Removal efficiency of Cd2+, Cu2+, and Pb2+ on HK and HKZS300 as a function of pH
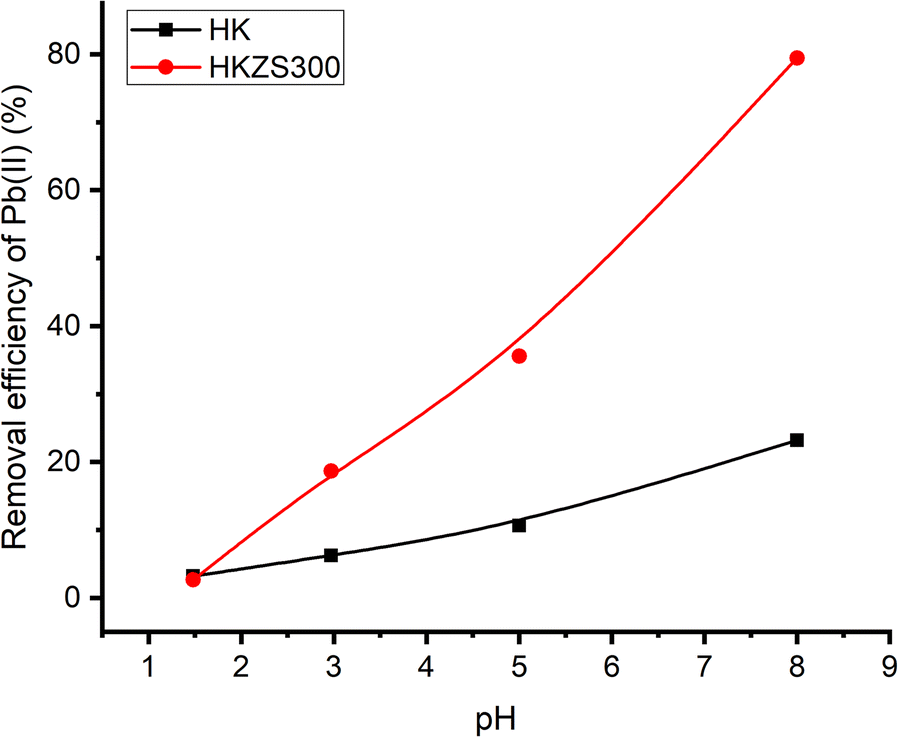
Fig. 9. Removal efficiency of Pb2+ on HK and HKZS300 as a function of pH
The estimated K d values for the Pb2+, Cu2+, and Cd2+ adsorbed on HKZS300 at pH 8 were 3865, 350, and 169 mL g–1, respectively. These distribution coefficients followed the order Pb2+ >> Cu2+ > Cd2+, which has the same trend in terms of the removal percentages. This trend was also observed by other authors; Chen et al. (Reference Chen, Ma, Chen and Xian2010) investigated the ability of nano-hydroxylapatite to adsorb Pb2+, Cu2+, and Cd2+ in solution and reported similar results for zirconia-intercalated kaolinite. The K d values seemed to be inversely proportional to the hydrated ionic radii of the metals, being Pb2+ (4.01 Å) > Cu2+ (4.19 Å) > Cd2+ (4.26 Å) (Berger & Hubbell, Reference Berger, Hubbell and Lide1998). This is in agreement with the results reported previously by others (Lee & Moon, Reference Lee and Moon2001; Chen et al., Reference Chen, Ma, Chen and Xian2010) that the small ionic radius and large valence of adsorbate ions enhance their adsorption. In contrast, the smaller the ion’s hydration, the closer it is to the adsorbing surface and consequently it has greater adsorption strength.
The corresponding selectivity coefficients (S M1/M2) were 11.03, 23.16, and 2.10 at pH 8 and 7.39, 46.71, and 6.33 at pH 5 for Pb/Cu, Pb/Cd, and Cu/Cd, respectively. The results obtained showed clearly that the kaolin samples demonstrated greater efficiency for the removal of Pb2+ than of Cu2+ and Cd2+. Moreover, the removal selectivity of Pb was enhanced significantly upon intercalation of kaolin with zirconia; this may be due to the larger surface area and the increased number of mesoporous active sites of HKZS300 compared with HK. The order of selectivity for metal ion removal was Pb2+ >> Cu2+ > Cd2+. The comparison of the removal efficiencies of HK and HKZS300 for Pb2+(Fig. 9) was performed at various pH values. Obviously, the greatest adsorption on either HK or ZrO2-intercalated kaolinite (HKZS300) was obtained for the most basic pH, 8. When the pH varied from 1.48 to 8.0, the removal percentage of Pb2+ increased drastically from 3.22 to 23.22% and from 2.66 to 79.44% for HK and ZrO2-intercalated kaolinite, respectively. These results showed that the pH of the solution greatly affected the adsorption of Pb2+ onto the ZrO2-intercalated kaolin more than that of the HK.
These variations in adsorption could be explained by competition between Pb2+ and H3O+ for the surface adsorption sites (Gupta & Bhattacharyya, Reference Gupta and Bhattacharyya2008). In general, oxygen groups on the clay surface are presumed to have the ability to bind electrolyte cations (ions in solution) yielding surface complexes. Such surface reactions could be ascribed to the affinity of charged surface sites for ions of opposing charge via the coulombic interaction between them (Miehé-Brendlé et al., Reference Miehé-Brendlé, Khouchaf, Baron, Le Dred and Tuilier1997; Kenne Dedzo & Detellier, Reference Kenne Dedzo and Detellier2017). At low pH, the number of H3O+ ions exceeds that of Pb2+ and the surface is almost covered with H3O+ ions, leading to a decline in the number of Pb2+ ions adsorbed. Upon an increase in pH, H3O+ ions leave the clay surface, exposing surface sites that then become accessible to Pb2+, thus enhancing ion-binding to the clay surface through a mechanism like that of ion-exchange (H3O+/Pb2+). The significant improvement in terms of the percentages of metal ions removed using the acid-activated kaolinite intercalated with zirconia (HKZS300) vs. the unchanged, acid-activated kaolinite (HK) is mainly related to intercalation of zirconia into kaolinite via adsorption up to pH 5, while a precipitation process may be invoked at greater pH (8). This modification provides new, accessible active sites and alters significantly the textural properties which enhance the limited sorptivity of kaolinite. Such heavy-metal uptake enhancement with rising pH has also been reported for natural kaolin and orthophosphate-modified kaolin (Jiang et al., Reference Jiang, Jin, Lu and Chen2010), which could be assigned to the deprotonation of edge-OH groups on the adsorbent surfaces with increasing pH, as demonstrated in a recent pH-metric titration study (Drweesh et al., Reference Drweesh, Fathy, Wahba, Hanna, Akarish, Elzahany, El-Sherif and Abou-El-Sherbini2016). Accordingly, at low pH, an electrostatic repulsion arises between the metal cations and the protonated kaolinite edge-OH groups (e.g. SiOH2 + exists at low pH). On the other hand, the conditions are reversed to electrostatic attraction of the metal cations to the deprotonated surface Al–OH, Si–OH, and Zr–OH groups at high pH. A precipitation process of the metal hydroxides could also accompany the adsorption at high pH.
Conclusions
The intercalation of zirconia into the interlayer space of Egyptian kaolinite was suggested as a good method of synthesizing zirconia-loaded kaolin with a preference for acid-activated kaolin. The new material had an enlarged basal spacing of ~11–25 Å in HKZS300, which is suggested to be due to the intercalated zirconia oligomers bonded with kaolinite layers through aluminol groups up to 300°C, giving rise to a significantly perturbed zirconia/kaolinite layered structure. At 500°C, zirconia crystallized in a tetragonal phase while kaolinite decomposed to metakaolinite. The intercalation process caused a remarkable increase in the surface area of the kaolin, an improvement of the layer stacking, and a uniform distribution of Zr among all of the kaolinite particles. In addition, the intercalation process created new micropores which led to the observed increase in surface area but decreased pore volume and pore-size distribution due to the new micropore creation. The metal sorption characteristics of the ZrO2-modified kaolin was confirmed to be much more efficient than the raw or activated kaolin for the removal of Pb2+, Cu2+, and Cd2+ with a 300% improvement in the removal efficiency and a greater selectivity for removal of Pb with the order: Pb2+ >> Cu2+ > Cd2+.
The catalytic activity of zirconia-intercalated kaolinite offers much interest for further research.
Supplementary Information
The online version contains supplementary material available at https://doi.org/10.1007/s42860-021-00134-9.
Acknowledgments
The authors are grateful to the Editor in Chief and the anonymous reviewers for their constructive criticism and valuable comments which helped to improve the manuscript. The authors are also grateful to the National Research Centre, Egypt, for partial financial support of this study via project No AR110903.
Funding
Funding sources are as stated in the Acknowledgments.
Declarations
Conflict of Interest
The authors declare that they have no conflict of interest.


