1 Introduction
When developing the next generation of an existing vehicle model, an automotive designer must balance tradeoffs between two competing customer considerations. One consideration is the customer’s desire for novelty, as the appeal of the current model tends to fade with time (Martindale Reference Martindale1990; Coates Reference Coates2003). The extent the designer is able to reach toward increasingly novel designs, in other words by deviating from past designs, defines the amount of design freedom available to the design team. Another consideration is the customer’s desire for consistency with past designs, which can play an important role in brand recognition. Much as there is family resemblance among members of a family, the designer seeks to maintain a recognizable brand character among all the brand’s members. Any deviation from the past may reduce the new design’s association with the brand, as well as how it conveys design attributes known to be important to the customers (e.g., luxuriousness) (Aaker & Keller Reference Aaker and Keller1990).
At the enterprise level, both design freedom and brand recognition are known to contribute significantly to market competitiveness (Bloch Reference Bloch1995; Person et al. Reference Person, Snelders, Karjalainen and Schoormans2007; Yin Wong & Merrilees Reference Yin Wong and Merrilees2008). On the academic side, studies have shown that vehicle manufacturers that focus on maximizing design freedom for vehicle styling are more likely to capture market share through innovation capacity, particularly during early stages of the product life cycle (Talke et al. Reference Talke, Salomo, Wieringa and Lutz2009). Given too little design reach relative to the market’s desire for change and the brand’s history of innovation, the product appears weak and stale: given too much reach, the customer reaction may be anxiety and discomfort (Berlyne Reference Berlyne1971). If the reach is in the wrong direction, because it either violates the brand’s identity or strays from the benefits desired by the target market, the product may fail within the market (Hartley Reference Hartley1996).
On the automotive industry side, brand loyalty is a significant factor in customer purchase decisions. Brands such as BMW and Cadillac have taken more than 100 years to build a brand reputation; and oftentimes, in stated customer responses, brand is near or at the top in influencing purchase decisions (Motors 2014). By maintaining brand recognition, the equity of the brand may be leveraged for new products, thus influencing customer preference (Barney Reference Barney1991; Srinivasan, Lilien & Rangaswamy Reference Srinivasan, Lilien and Rangaswamy2006; Person & Snelders Reference Person and Snelders2010; Schmitt Reference Schmitt2012).
As a result, both design freedom and brand recognition are competing considerations during the design process for both the designer and the enterprise as a whole. Correctly balancing this tradeoff is paramount to realizing market success (Moulson & Sproles Reference Moulson and Sproles2000) – akin to musicians aiming to produce their next great hit while still sounding true to their unique musical style.
1.1 Automotive design process
The automotive design process may be conceptualized as a long sequence of depictions, each one becoming more detailed and realistic. The design may begin as just a verbal description (e.g., ‘The next generation Chevrolet Malibu, coming off engineering platform B, aimed at owners of midsize cars who want a versatile and modern design at a moderate price.’). Or it may start with some rough physical dimensions (e.g., overall length, width, and height, within specified bounds).
Over a number of months, the depiction gains specificity in terms of physical dimensions, features, and options. What began as a description in words and numbers eventually transitions, first to two-dimensional (2D) images and eventually to three-dimensional (3D) models and prototypes. In these latter stages many decisions are made that will affect the aesthetic appeal and projected image of the design, and consequently the emotional reaction of customers. While these decisions are ultimately based on the intuition of highly trained designers, there is a long history of attempts to influence these decisions with a more data-driven approach.
The most common approach has been to conduct theme studies where designs are shown to customers who then rate them on several dimensions (e.g., appeal, innovativeness, distinctiveness, sportiness), and also take part in focus groups. This approach has often fallen short because evidence counter to designer intuition is met with skepticism by the designers. Another issue is that design activity typically occurs for 6–12 months before any customer feedback is collected. This creates an environment where designers’ preferred designs gain momentum and backing by management, and are subsequently less likely to be changed given preliminary customer data.
1.2 Aim of this study
In this study, we measure how brand recognition and design freedom interact and trade off with each other for four automotive luxury vehicle brands – Audi, BMW, Cadillac, and Lexus. Luxury brands are chosen primarily due to strong brand affiliation in their market segment (Aaker & Keller Reference Aaker and Keller1990; Mannering et al. Reference Mannering, Winston, Griliches and Schmalensee1991). To make such measurements, we decompose both brand recognition and design freedom to a common set of styling design attributes – an approach supported by psychology and design research suggesting styling design attributes such as ‘aggressiveness’ may be more representative of visceral human perceptions of design than geometric design variables such as ‘120 cm vehicle grill’ (Norman, Ortony & Russell Reference Norman, Ortony and Russell2003; Norman Reference Norman2004; Reid, Gonzalez & Papalambros Reference Reid, Gonzalez and Papalambros2010). By manipulating the values of these styling design attributes rather than geometric design variables, we can better trace relative changes in both design freedom and brand recognition.
Manipulation of these design attributes, however, still requires a mapping to the geometric design variables that the designer controls: We cannot choose the ‘aggressiveness’ level of the vehicle, but we can decide the width of the wheelbase. Accordingly, we build on a general methodology common in the design community – determining the values of design attributes as functions of the underlying geometric design variables using customer responses (McWilliam & Dumas Reference McWilliam and Dumas1997; Louridas Reference Louridas1999; Mulder-Nijkamp & Eggink Reference Mulder-Nijkamp and Eggink2013). A key difference in our approach, however, is that we do not explicitly model the functional form of the nonlinear mapping between styling attributes and geometric variables. Instead, we crowdsource this mapping as a black-box function that is hypothesized to model the judgments of customers. This approach may be too simplistic – see, e.g., (MacDonald, Gonzalez & Papalambros Reference MacDonald, Gonzalez and Papalambros2009) – but we adopt it here as a starting point to address our research question of measuring the balance between design freedom and brand recognition.
Our experimental procedure involved three steps: (1) Determination of styling attribute values for existing vehicles using a Markov chain derived for partial rankings over customer responses to 2D design representations; (2) Generation of new conceptual designs using morphable 3D design representations; and (3) Determination of design freedom and brand recognition via deviations from previous designs of both styling design attributes and geometric design variables, using a proposed design freedom distance metric and a conditional multinomial logit model. Customer responses and new concept designs were gathered using an online interactive survey consisting of sequential design evaluation and design generation stages using both 2D images and 3D morphable vehicle models rendered in real time. Using the data from this experimental procedure, we quantitatively capture the relationship between design freedom and brand recognition on a brand-by-brand basis.
This research approach thus puts its entire emphasis on determining an accurate relationship between design freedom and brand recognition, at the expense of being unable to ask the reasons ‘why’ this relationship exists. This causal relationship is important to uncover, but in the current implementation we use nonparametric and nonlinear predictive models to assess design freedom. These models do not have an explicitly known functional form much less a known inverse. Therefore, we cannot explicitly link geometric design variables to perceptual design attributes, but we can compute the corresponding design freedom and brand recognition.
1.3 Significance of this study
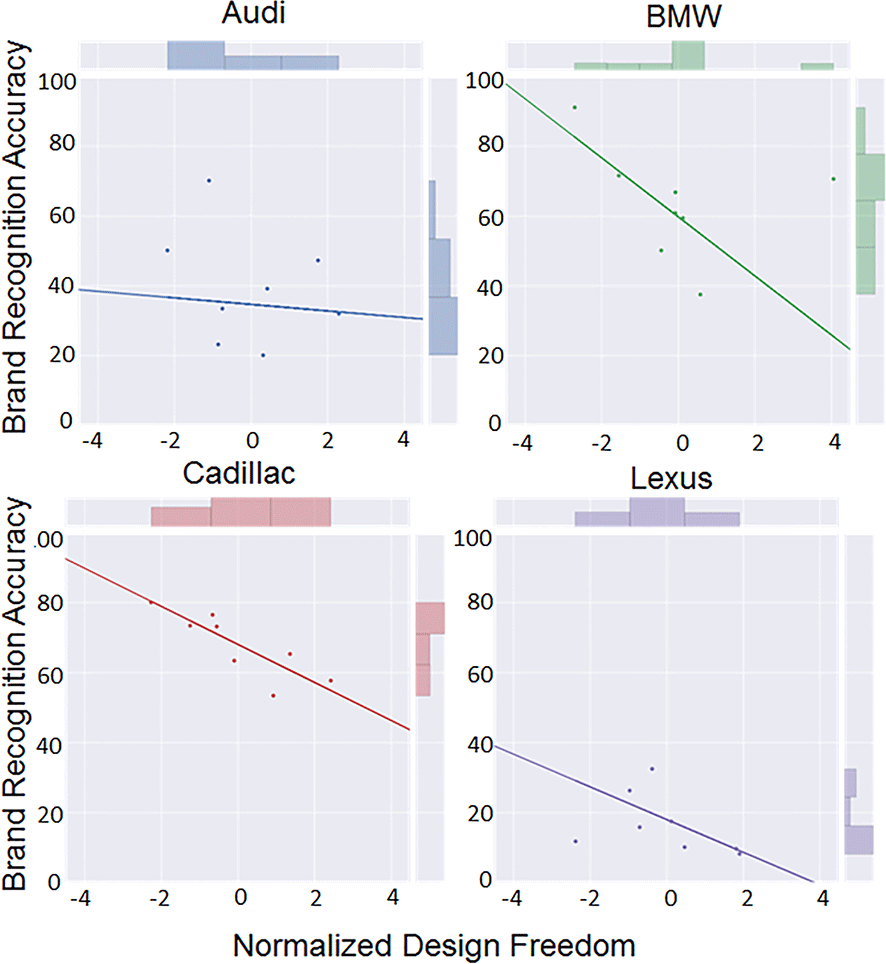
The results of this study show that there is indeed a tradeoff between brand recognition and design freedom according to the proposed design freedom metric. The results agree with common intuition and are useful as a validation that the computational procedure described in the paper leads to intuitive results. The expectation is that the same procedure could be useful in situations with no obvious intuition available. This brand recognition versus design freedom tradeoff is predicted to affect BMW and Cadillac the most, suggesting that these brands face greater challenges to maintain brand recognition while evolving the styling of future vehicles. In particular, we find that designers at BMW have by far the sharpest relationship between design freedom and brand recognition; BMW also has the highest level of brand recognition. Thus BMW designers appear to have little leeway in evolving future design concepts. The tradeoff is predicted to affect Audi and Lexus less; however these tradeoffs are less not conclusive as both these brands are found to have large spread in the obtained data and low absolute brand recognition across customers surveyed throughout the world, respectively.
The main contribution of this work is an extension of previous descriptive investigations (McCormack, Cagan & Vogel Reference McCormack, Cagan and Vogel2004; Kreuzbauer & Malter Reference Kreuzbauer and Malter2005; Ranscombe et al. Reference Ranscombe, Hicks, Mullineux and Singh2012) of brand recognition and design freedom to a predictive investigation involving modeling of brand recognition and design freedom. While it is often qualitatively recognized that brand recognition and design freedom must trade off with each other, we offer an early effort to a quantitative measurement of this tradeoff.
This work does not seek to optimize the tradeoff between design freedom and brand recognition, which would require modeling decisions by a multitude of stakeholders – particularly designers, marketers, and strategic design managers. Instead, we posit that the present work can augment stakeholder intuition during the strategic design decision-making process.
Additional contributions include: (1) The combined use of multiple design representations for predictive modeling including styling attributes and more conventional geometric variables as previously studied (McWilliam & Dumas Reference McWilliam and Dumas1997; Orsborn, Cagan & Boatwright Reference Orsborn, Cagan and Boatwright2009; Ersal et al. Reference Ersal, Papalambros, Gonzalez and Aitken2011; Sylcott, Cagan & Tabibnia Reference Sylcott, Cagan and Tabibnia2013); (2) a hybrid combination of parametric models and nonparametric representations; (3) the use of realistic, morphable 3D modeling techniques in an interactive web-based environment, an approach gaining popularity in areas such as design co-creation (Ramanujan et al. Reference Ramanujan, Vinayak, Reid and Ramani2015); (4) filtering crowdsourced data on ‘brand-conscious’ customers to filter data relevant for this study; and (5) using the crowd as a ‘black box’ for modeling an implicit nonlinear function distributed over a number of people.
Using the crowd as a ‘black box’ is perhaps the most important methodological contribution. In particular, measuring styling has always been problematic because it is perhaps one of the most challenging problems from a statistical and modeling standpoint. In particular, a realistic design’s styling, for example, a full 3D model of a vehicle, must be represented by more than 10 000 to 100 000 dimensions (e.g., a door handle has length, width, curvature dimensions, thickness, color, sheen, etc.). Building a function with unknown functional form that maps styling from this high-dimensional space to a single number is challenging. Instead, using crowdsourcing to ‘discover’ this function from the responses of a large number of people does not require making a priori functional form assumptions, similar to recent work on constructing and estimating implicit functions from kernel feature spaces (Ren & Papalambros Reference Ren and Papalambros2012; Burnap et al. Reference Burnap, Pan, Liu, Ren, Lee, Gonzalez and Papalambros2016).
2 Background and related work
Balancing between design freedom and brand recognition has been studied extensively in the product innovation and styling strategy literature as well as the design research literature. From the strategic management and customer product innovation communities, we establish qualitative justifications for upholding design freedom and brand recognition. From the design community, we consider previous efforts toward measuring tradeoffs between design styling and other considerations, as well as methodologies toward eliciting customer preferences via various design representations.
2.1 Design freedom and brand recognition
Several studies have considered the importance of design freedom from the perspective of organizational innovation capability, with a consensus that there is an optimal amount of deviation from previous designs (Hekkert, Snelders & Wieringen Reference Hekkert, Snelders and Wieringen2003; Person et al. Reference Person, Schoormans, Snelders and Karjalainen2008). Customers expect novelty in new product offerings (Martindale Reference Martindale1990), yet such novelty must be bounded (Berlyne Reference Berlyne1971). Companies that follow a ‘design-driven’ approach toward balancing this tradeoff via strategic design decisions have been shown empirically to capture larger market shares (Person et al. Reference Person, Schoormans, Snelders and Karjalainen2008).
The effect of brand recognition on customer preferences has been studied in depth for new product offerings (Aaker & Keller Reference Aaker and Keller1990). General conclusions from these studies are that brands are comprised of highly complex associations between within-brand products and features (Milburn & Childs Reference Milburn and Childs2001; Ranawat, Tuteja & Höltta-Otto Reference Ranawat, Tuteja and Höltta-Otto2012), as well as related people, places, and out-of-brand products (Keller Reference Keller2003). Particularly because automobiles fall under the category of ‘durables,’ namely, products where lifecycle use is important to the customer, brand recognition plays a very important role (Zeithaml Reference Zeithaml1988). These conclusions are aligned with observations in the automotive sector, where brand has been shown to be one of the foremost contributors to customer preference (Mannering et al. Reference Mannering, Winston, Griliches and Schmalensee1991; Motors 2014).
The current study builds on recent results showing that the front fascia or ‘face’ of the vehicle – the view looking directly at the front of the vehicle – is most closely associated with vehicle brand (Ranscombe et al. Reference Ranscombe, Hicks, Mullineux and Singh2012). Moreover, anecdotal evidence from experienced sources within the industry supports this notion (Manoogian II Reference Manoogian2013). Accordingly, all stimuli used in this study consider the face view of vehicle designs.
2.2 Brand-conscious customers
Brand-conscious customers, able to correctly identify brand from unbranded vehicles, are used for filtering the data collected in the study. These brand-conscious customers are filtered, because data from customers unable to identify brand add noise to the construction of predictive models for brand recognition. Moreover, appealing to brand-conscious customers has been found to be important for premium brands such as those considered in this study (Aaker Reference Aaker2009).

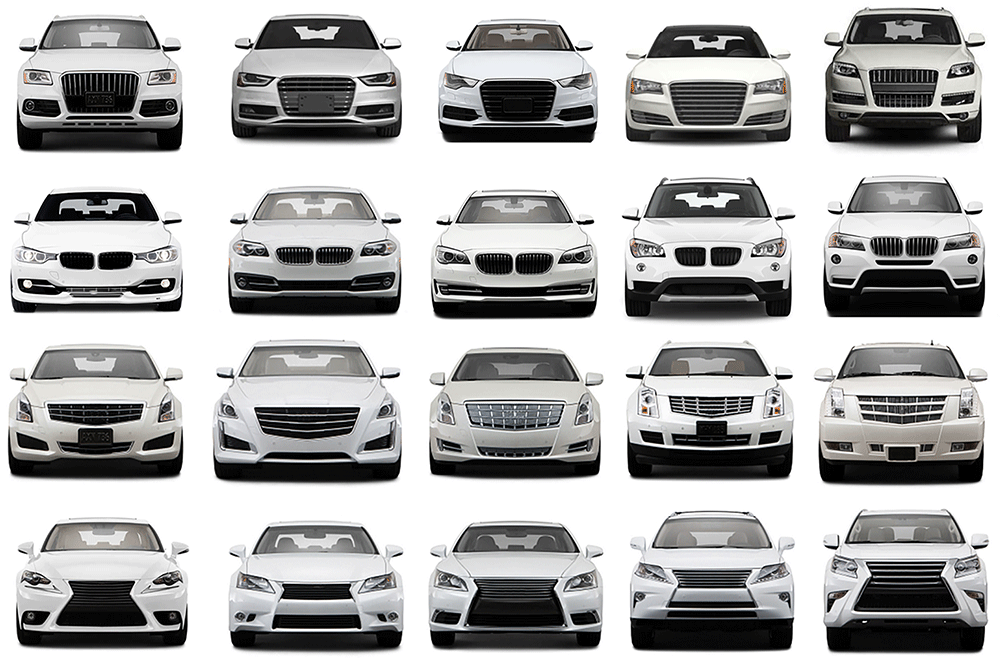
Figure 1. Example images shown to customers in the 2D representation portion of the experiment. These images were used to assess styling attribute values, as well as brand recognition. The images remained static (were not morphed by customers) during the experiment and did not contain brand logos.
To identify brand-conscious customers, we filter out customers not able to correctly identify brands above a given threshold for designs that already exist in the market (see below for filtering criteria). Recent literature in crowdsourcing research has shown that data from ‘experts’ within a crowd, in this case ‘brand-conscious customers’ within a crowd, may be aggregated to obtain an accurate ‘crowd consensus vote’ using simple algorithms such as majority vote (Sheng, Provost & Ipeirotis Reference Sheng, Provost and Ipeirotis2008; Sheshadri & Lease Reference Sheshadri and Lease2013). However, if such filtering on the ‘experts’ in the crowd is not done, simple algorithms to aggregate customer input may result in heavily biased crowd-level evaluations (Burnap et al. Reference Burnap, Ren, Gerth, Papazoglou, Gonzalez and Papalambros2015b ). In our current case, this may skew estimates of design freedom when trading off brand recognition. Such filtering of customer data to guide the design process has been similarly explored by using customers to interactively guide the creative aspect of early-stage design (Crilly, Moultrie & Clarkson Reference Crilly, Moultrie and Clarkson2004; Ind & Watt Reference Ind and Watt2006).
2.3 Design representation
Design representation refers to the method that a design artifact is encoded by either a computer or a customer during one of many steps in the design process (Chandrasegaran et al. Reference Chandrasegaran, Ramani, Sriram, Horváth, Bernard, Harik and Gao2013). We make a distinction between the two as it has been shown that computer representations and human representations may be entirely different, resulting in the need to construct models and conduct experiments in the appropriate space (Tversky & Gati Reference Tversky and Gati1978; Tversky & Hutchinson Reference Tversky and Hutchinson1986). Moreover, we consider three different forms of design representation: 2D and 3D model geometries; parametric and nonparametric geometries; and as a function of styling attributes and geometric variables.
2.3.1 2D and 3D representations
Recent studies have shown that brand recognition is dependent on the fidelity of the design representation (Ranscombe et al. Reference Ranscombe, Hicks, Mullineux and Singh2012; Rasoulifar, Prudhomme & Eckert Reference Rasoulifar, Prudhomme and Eckert2015). Informally, there is a level of realism to the design that must be achieved for customers to correctly identify vehicle brand (Orbay, Fu & Kara Reference Orbay, Fu and Kara2015). We build on this notion by representing vehicle designs using the highest fidelity representation possible whether a 2D image or a 3D high polygon mesh, as shown in Figures 1 and 2, respectively.

Figure 2. Example images shown to customers in the 2D representation portion of the experiment. These images were used to assess styling attribute values, as well as brand recognition. The images remained static (were not morphed by customers) during the experiment and did not contain brand logos.
Studies have also shown differences between 2D and 3D design representations regardless of fidelity. In particular, customer preferences assessed through conjoint analysis have been found to be inconsistent when contrasting the type of design representation (Reid, MacDonald & Du Reference Reid, MacDonald and Du2013; Bao et al. Reference Bao, El Ferik, Shaukat and Yang2014; Toh & Miller Reference Toh and Miller2014). The area of assessing the level of fidelity or abstraction to a given threshold for a customer’s perception is still an active area of research, including both 2D and 3D representations.
2.3.2 Parametric and nonparametric
Design representations may be also categorized as parametric or nonparametric. Parametric design representations have numerous applications via conjoint analysis using 2D silhouettes (Orsborn et al. Reference Orsborn, Cagan and Boatwright2009; Petiot & Dagher Reference Petiot and Dagher2010; Reid et al. Reference Reid, Gonzalez and Papalambros2010; Sylcott et al. Reference Sylcott, Cagan and Tabibnia2013), gestalt quantification using 2D representations (Lugo et al. Reference Lugo, Schmiedeler, Batill and Carlson2015), and 3D interpolated Bezier curves (Ren et al. Reference Ren, Burnap and Papalambros2013; Tovares, Boatwright & Cagan Reference Tovares, Boatwright and Cagan2014); however, perhaps the most realistic 3D interpolated Bezier curves come from design research done within the automotive industry (Kókai et al. Reference Kókai, Finger, Smith, Pawlicki and Vetter2007).
In the shape grammar literature, nonparametric design representations are used as basic constituent shape elements to generate larger and more complex forms (Königseder, Stanković & Shea Reference Königseder, Stanković and Shea2016). These include automotive applications (Orsborn et al. Reference Orsborn, Cagan, Pawlicki and Smith2006; Orsborn & Cagan Reference Orsborn and Cagan2009), some with focus on vehicle face details (McCormack et al. Reference McCormack, Cagan and Vogel2004) and vehicle side profiles (Pugliese & Cagan Reference Pugliese and Cagan2002; Yannou, Dihlmann & Awedikian Reference Yannou, Dihlmann and Awedikian2008; Bluntzer, Ostrosi & Sagot Reference Bluntzer, Ostrosi and Sagot2014). Such shape grammar techniques are applicable to generation of 3D design representations, for example, with fluid channel layouts (Hooshmand & Campbell Reference Hooshmand and Campbell2014).
The representation approach here is qualitatively similar to the shape grammar approach in that it employs a design generation process where an agent creates new designs, but it is limited in scope when contrasting the corresponding design spaces. In particular, shape grammars are able to generate a much larger set of possible designs as defined by the Cartesian product of grammar enumeration, whereas the design generation considered in this study is limited to the convex hull defined by the morphing bounds on the 3D design representations.
In this study, we cast the 3D design representation as a set of geometric variables defining a 3D mesh that morph not strictly related via a mathematical function, nor nonparametrically such as volumetric deformation (Tiwari et al. Reference Tiwari, Dong, Fadel, Fenyes and Kloess2014), but instead requiring predefined input, say from professional vehicle designers (Manoogian II Reference Manoogian2013). In other words, a human designer is asked to manually define morphing bounds over a subset of vertices, followed by Laplacian deformation used to morph the entire mesh (Botsch & Sorkine Reference Botsch and Sorkine2008). This results in a hybrid of the parametric and nonparametric design representations. Note that we use morphable 3D models but only static images for the 2D design representations.
2.3.3 Visceral attributes and geometric variables
While geometric variables via 2D and 3D representations, parametric or nonparametric, capture the physical form of the design as a computer may interpret it, human perceptions are better suited to a different representation (Coates Reference Coates2003; Norman Reference Norman2004). In particular, design attributes such as ‘Friendly’ versus ‘Aggressive’ have been posited to represent human perceptual understanding better than variables such as ‘130 cm long air dam’ (Norman Reference Norman2004).
To develop analytical decision-making models (Papalambros & Wilde Reference Papalambros and Wilde2000), we further assume that the attributes themselves are functions of geometric design variables. Styling attributes are likely nonlinear functions of geometric variables, e.g., slight geometric changes in the edges between a smile and a frown may make large differences in an attribute such as ‘happiness’ (Motors 2014). By gathering customer responses within the space of design attributes versus design variables, we are operating at a level analogous to similarity models in the psychological literature (Tversky & Hutchinson Reference Tversky and Hutchinson1986).
2.4 Quantitative models of product styling
Previous research in quantitative modeling of styling and aesthetics has often come from the marketing community, where conjoint analysis has proven valuable (Green, Carroll & Goldberg Reference Green, Carroll and Goldberg1981). This modeling technique takes a number of variables representing the design’s form as input and elicits customer preferences across a set of discrete points within the design space.
The design community has similarly used conjoint analysis to model styling form in efforts to optimize customer preferences in decision-based design (Hazelrigg Reference Hazelrigg1998; Papalambros Reference Papalambros2002; Chen, Hoyle & Wassenaar Reference Chen, Hoyle and Wassenaar2013). Relevant examples of such applications include 2D vehicle side view silhouettes (Orsborn et al. Reference Orsborn, Cagan and Boatwright2009; Reid et al. Reference Reid, Gonzalez and Papalambros2010) and 2D vehicle faces (Petiot & Dagher Reference Petiot and Dagher2010). Recently, 3D vehicle studies such as perceived safety (Ren et al. Reference Ren, Burnap and Papalambros2013) and vehicle interiors (Poirson et al. Reference Poirson, Petiot, Boivin and Blumenthal2013), as well as virtual reality studies (Tovares et al. Reference Tovares, Boatwright and Cagan2014) have been investigated. Some applications have used nonlinear conjoint models such as explicit feature mappings (Fuge, Stroud & Agogino Reference Fuge, Stroud and Agogino2013) and implicit feature mappings (Ren et al. Reference Ren, Burnap and Papalambros2013). Additional 3D extensions include the use of hierarchical geometric representations that may be used for salient feature extraction (Orbay et al. Reference Orbay, Fu and Kara2015).
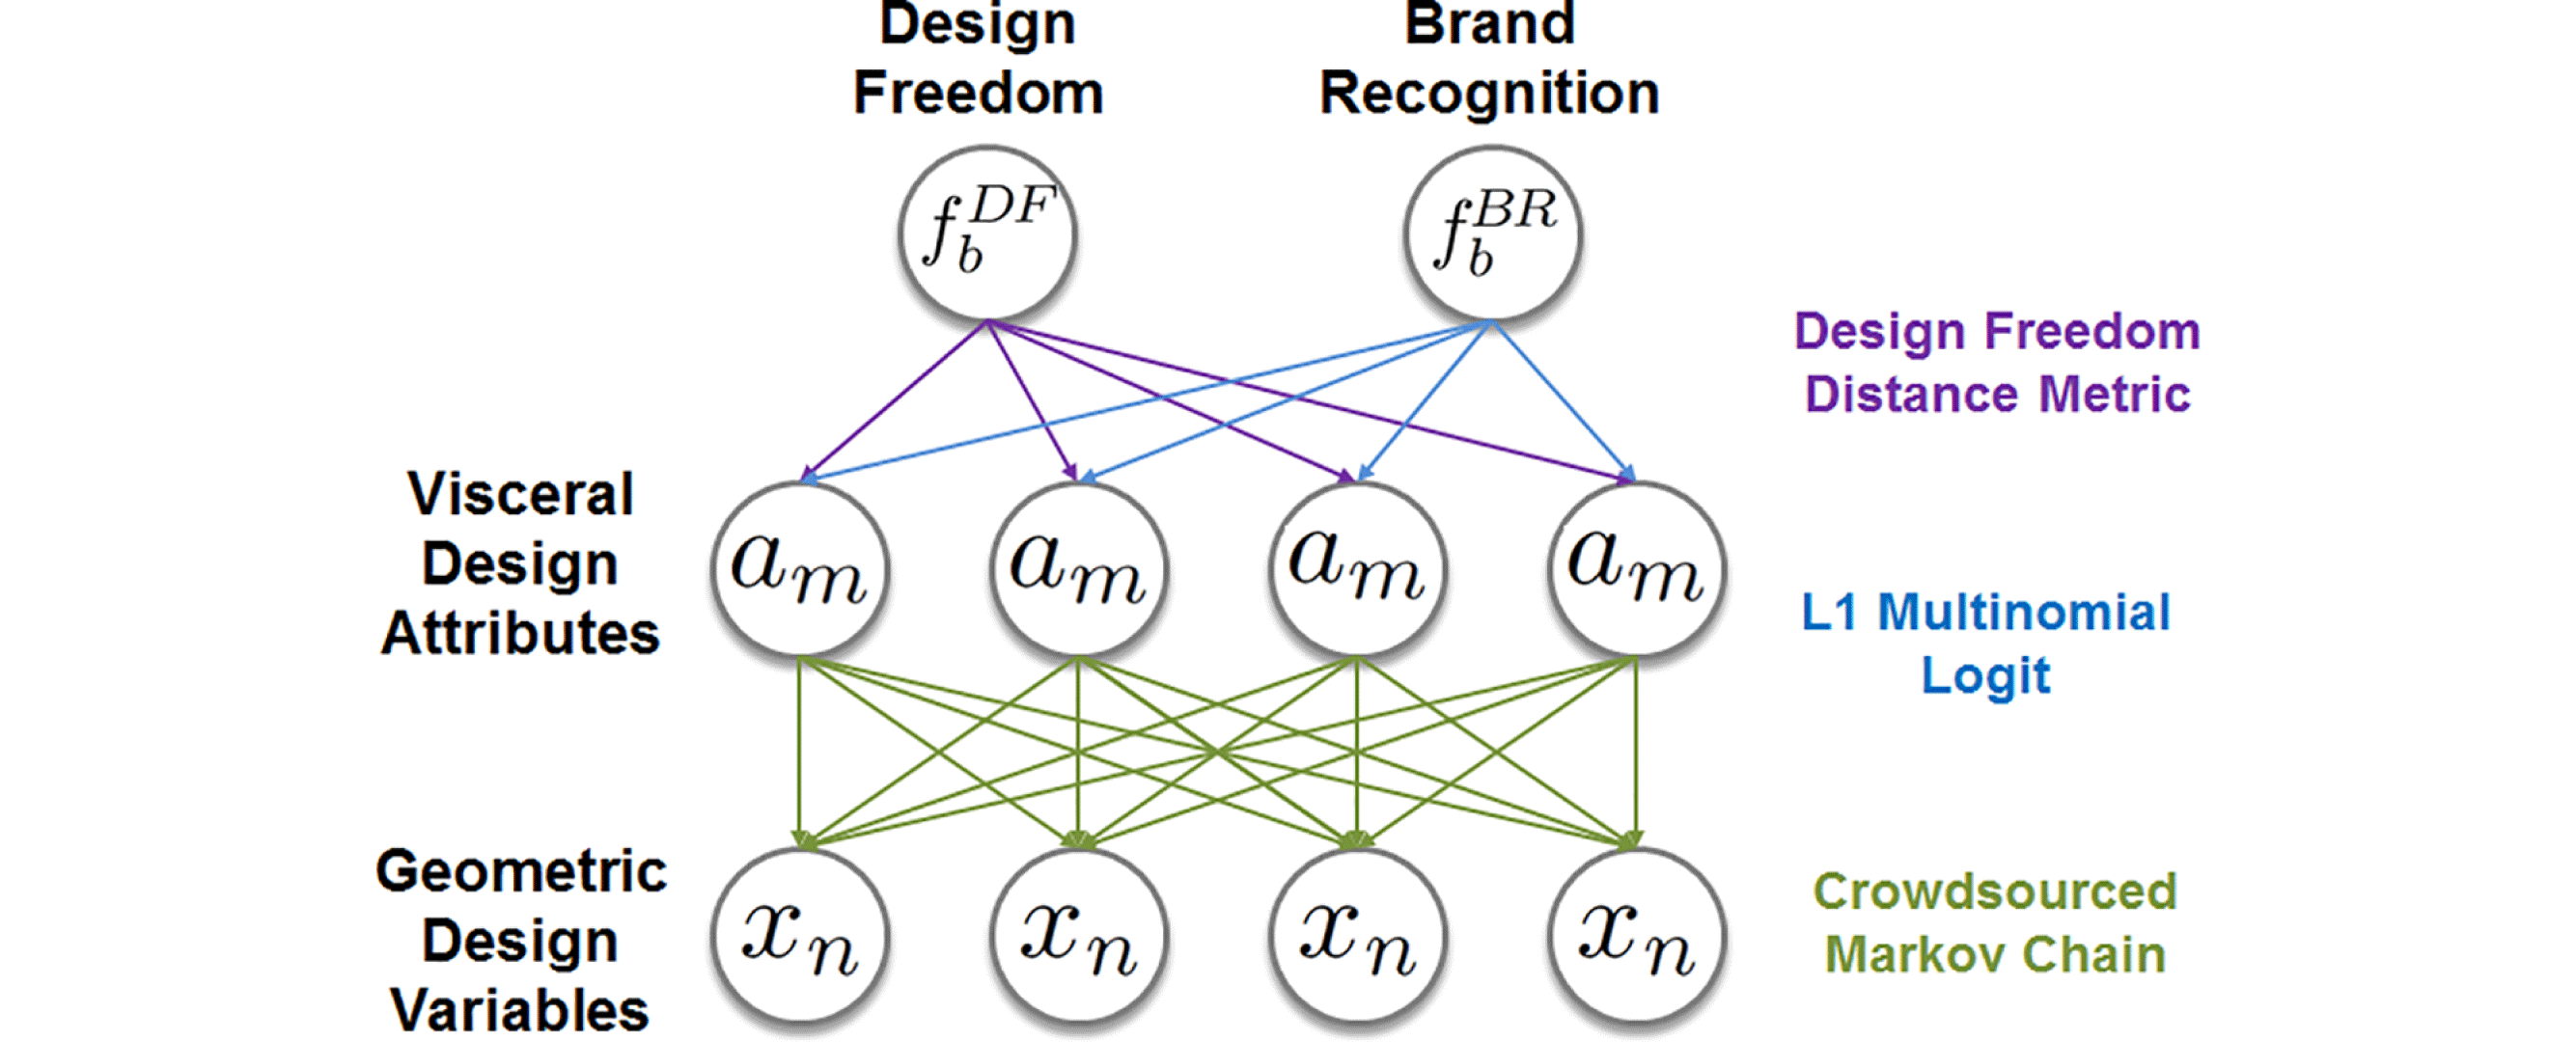
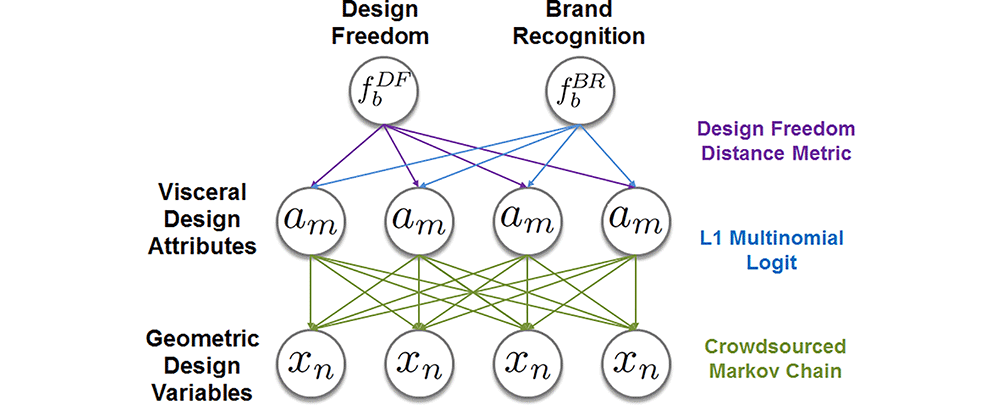
Figure 3. Dependencies between design freedom and brand recognition, design attributes, and design variables. Note that while design freedom and brand recognition are explicit linear functions of design attributes, design attributes are nonlinear functions of geometric design variables implicit in the customer perceptions of vehicles. In other words, we know the function for the top mapping, while we do not know the function for the bottom mapping. On the right-hand side, we denote the functional form of the associated dependencies.
3 Problem formulation
We formally define brand recognition and design freedom, and the manner in which the two are measured. We additionally define how customer responses to conceptual designs are aggregated to assess the overall crowd consensus to changes in conceptual designs.
Let
![]() $f_{b}^{DF}:\mathscr{A}\rightarrow \mathbb{R}$
and
$f_{b}^{DF}:\mathscr{A}\rightarrow \mathbb{R}$
and
![]() $f_{b}^{BR}:\mathscr{A}\rightarrow [0,1]$
denote design freedom and brand recognition, respectively, in which
$f_{b}^{BR}:\mathscr{A}\rightarrow [0,1]$
denote design freedom and brand recognition, respectively, in which
![]() $\mathscr{A}=\{\mathbf{a}=[a_{1},\ldots ,a_{M}]:a_{m}\in \mathbb{R}\}$
is the space of styling attribute vectors, and
$\mathscr{A}=\{\mathbf{a}=[a_{1},\ldots ,a_{M}]:a_{m}\in \mathbb{R}\}$
is the space of styling attribute vectors, and
![]() $\mathbb{R}$
is the real space. Note that as discussed in the background section, this definition assumes the styling design attributes are a common set of inputs to both design freedom
$\mathbb{R}$
is the real space. Note that as discussed in the background section, this definition assumes the styling design attributes are a common set of inputs to both design freedom
![]() $f_{b}^{DF}(\mathbf{a})$
and brand recognition
$f_{b}^{DF}(\mathbf{a})$
and brand recognition
![]() $f_{b}^{BR}(\mathbf{a})$
, and that both are defined over the set of existing and conceptual designs
$f_{b}^{BR}(\mathbf{a})$
, and that both are defined over the set of existing and conceptual designs
![]() $\mathbf{x}\in \{\mathbf{x}=[x_{1},\ldots ,x_{N}]:a_{n}\in \mathbb{R}\}$
for an associated brand
$\mathbf{x}\in \{\mathbf{x}=[x_{1},\ldots ,x_{N}]:a_{n}\in \mathbb{R}\}$
for an associated brand
![]() $b=1\ldots B$
.
$b=1\ldots B$
.
These design attributes
![]() $a_{m_{1}}^{M}$
are defined as the building blocks of customer perceptual representation of design styling, following the idea of how human perception is chunked (Norman Reference Norman2004). Informally, humans conceptualize a vehicle using terms such as ‘sportiness’ rather than a large number of geometric design variables that constitute sportiness such as ‘length of upper air dam.’
$a_{m_{1}}^{M}$
are defined as the building blocks of customer perceptual representation of design styling, following the idea of how human perception is chunked (Norman Reference Norman2004). Informally, humans conceptualize a vehicle using terms such as ‘sportiness’ rather than a large number of geometric design variables that constitute sportiness such as ‘length of upper air dam.’
The design attributes must be empirically manipulated to measure relative changes across brand recognition and design freedom. Accordingly, we parameterize the design attributes as a nonlinear function of a set of predefined geometric design variables denoted by
![]() $\{x_{n}\}_{1}^{N}$
. This parameterization attempts to capture the notion that changing a given design variable may affect multiple attributes at the same time in a complex manner.
$\{x_{n}\}_{1}^{N}$
. This parameterization attempts to capture the notion that changing a given design variable may affect multiple attributes at the same time in a complex manner.
The dependencies of design freedom and brand recognition, design attributes, and design variables are shown in Figure 3. We next define the functional form of each dependency. In particular, we detail the mathematical relationship between (1) design freedom and design attributes, (2) brand recognition and design attributes, and (3) design attributes and design variables.
3.1 L1 multinomial logit for brand recognition
We define brand recognition as a linear combination of design attributes, in which the attributes maximally discriminate between brands. To determine the linear coefficients to predict brand, we assume a multinomial logistic regression functional form, conditioned only on brand-conscious customers and regularized using the L1-norm, as given in Eq. (1).
To train the coefficients
![]() $\mathbf{w}_{b}$
of this model, we use a quasi-Newton optimization algorithm (l-BFGS) to maximize the penalized multinomial likelihood (Papalambros & Wilde Reference Papalambros and Wilde2000). Note that we use here the notation for coefficients from the machine learning literature; these coefficients are also often denoted with the symbols
$\mathbf{w}_{b}$
of this model, we use a quasi-Newton optimization algorithm (l-BFGS) to maximize the penalized multinomial likelihood (Papalambros & Wilde Reference Papalambros and Wilde2000). Note that we use here the notation for coefficients from the machine learning literature; these coefficients are also often denoted with the symbols
![]() $\unicode[STIX]{x1D6FD}$
in marketing and
$\unicode[STIX]{x1D6FD}$
in marketing and
![]() $\unicode[STIX]{x1D703}$
in statistics. The data are conditioned using a hard threshold, where a brand-conscious customer must achieve greater than
$\unicode[STIX]{x1D703}$
in statistics. The data are conditioned using a hard threshold, where a brand-conscious customer must achieve greater than
![]() $T$
percentage correct recognition of brands across a set of existing designs.
$T$
percentage correct recognition of brands across a set of existing designs.
3.2 Design freedom distance metric
Design freedom is the leeway designers have to generate conceptual designs while accounting for many implicit and explicit constraints (Hartley Reference Hartley1996). To capture this leeway, we adopt the information processing flow in Crilly et al. (Reference Crilly, Moultrie and Clarkson2004) by assuming that the communication from designer to customer is conveyed through information of multiple modes – in our case a vector of design attributes and vector of geometric values representing the design artifact.
With this design representation of multiple modes, we define design freedom as a distance from existing designs to a new conceptual design both across design attributes and across geometric variables. This design freedom distance is mathematically captured using a distance metrics; yet while various metrics have been previously used for engineering specifications (Simpson et al. Reference Simpson, Rosen, Allen and Mistree1998), representations such as abstract knowledge databases (Chandrasegaran et al. Reference Chandrasegaran, Ramani, Sriram, Horváth, Bernard, Harik and Gao2013), and text (Fu et al. Reference Fu, Chan, Cagan, Kotovsky, Schunn and Wood2013), these metrics do not accommodate various stakeholder inputs as specifically needed in the current study.
We thus propose a distance metric between two designs
![]() $\unicode[STIX]{x1D6FC}$
and
$\unicode[STIX]{x1D6FC}$
and
![]() $\unicode[STIX]{x1D6FD}$
for brand
$\unicode[STIX]{x1D6FD}$
for brand
![]() $b$
as given in Eq. (2). This metric is used to assign a scalar value that captures both geometric and perceptual styling differences between designs.
$b$
as given in Eq. (2). This metric is used to assign a scalar value that captures both geometric and perceptual styling differences between designs.
 $$\begin{eqnarray}\displaystyle \Vert f_{b}^{DF,\unicode[STIX]{x1D6FC}}-f_{b}^{DF,\unicode[STIX]{x1D6FD}}\Vert & = & \displaystyle \mathop{\sum }_{m=1}^{M}\mathbb{I}_{w_{b,m\neq }0}\left[\vphantom{\mathop{\sum }_{n=1}^{N}}\unicode[STIX]{x1D706}_{1}(a_{m}^{(\unicode[STIX]{x1D6FC})}-a_{m}^{(\unicode[STIX]{x1D6FD})})^{2}\right.\nonumber\\ \displaystyle & & \displaystyle +\,\left.\unicode[STIX]{x1D706}_{2}\mathop{\sum }_{n=1}^{N}r_{b,nm}(x_{n}^{(\unicode[STIX]{x1D6FC})}-x_{n}^{(\unicode[STIX]{x1D6FD})})^{2}\right]\end{eqnarray}$$
where,
 $$\begin{eqnarray}\displaystyle & & \displaystyle a_{m}=\text{ design attributes measured using 2D representation}\nonumber\\ \displaystyle & & \displaystyle x_{n}=\text{ geometric design variables common to both 2D and 3D representations}\nonumber\\ \displaystyle & & \displaystyle \unicode[STIX]{x1D706}_{1}=\text{ importance/normalizing operator of design attributes}\nonumber\\ \displaystyle & & \displaystyle \unicode[STIX]{x1D706}_{2}=\text{ importance/normalizing operator of geometric design variables}\nonumber\\ \displaystyle & & \displaystyle \mathbb{I}_{w_{b,m\neq }0}=\text{ indicator function if attribute }m\text{ is important for brand }b\nonumber\\ \displaystyle & & \displaystyle r_{b,nm}=\text{ sensitivity of attribute }m\text{ to variable }n\text{ for brand }b.\nonumber\end{eqnarray}$$
This distance metric captures stakeholder considerations to the overall design freedom in two ways: First, design freedom implicit in the mind of the customer is captured using
![]() $r_{(b,nm)}$
and
$r_{(b,nm)}$
and
![]() $\mathbb{I}_{w_{b,m\neq }0}$
, both of which are assessed using the customer crowd. Informally, these values capture the notion that differences between two designs exist with both geometric and perceptual representations in the mind of the customer.
$\mathbb{I}_{w_{b,m\neq }0}$
, both of which are assessed using the customer crowd. Informally, these values capture the notion that differences between two designs exist with both geometric and perceptual representations in the mind of the customer.
Second, design freedom explicit from stakeholders within the producing organization is captured using
![]() $\unicode[STIX]{x1D706}_{1}$
and
$\unicode[STIX]{x1D706}_{1}$
and
![]() $\unicode[STIX]{x1D706}_{2}$
, which may represent, say, relative influences of the marketing and engineering departments, respectively. Informally, we use these operators to tune how important it is to maintain an attribute like ‘aggressiveness’ for a marketing campaign, or a certain geometric shape for vehicle aerodynamics. Accordingly, these operators are specific to the brand being considered.
$\unicode[STIX]{x1D706}_{2}$
, which may represent, say, relative influences of the marketing and engineering departments, respectively. Informally, we use these operators to tune how important it is to maintain an attribute like ‘aggressiveness’ for a marketing campaign, or a certain geometric shape for vehicle aerodynamics. Accordingly, these operators are specific to the brand being considered.
Using this distance metric, overall design freedom is assessed as the distance from the current design in Model Year 2014 (MY2014) to a proposed design
![]() $(\mathbf{x}^{\prime },\mathbf{a}^{\prime })$
. Denoting the current design
$(\mathbf{x}^{\prime },\mathbf{a}^{\prime })$
. Denoting the current design
![]() $(\mathbf{x}^{0},\mathbf{a}^{0})$
, design freedom for the proposed design is given by Eq. (3) using vector notation for brevity.
$(\mathbf{x}^{0},\mathbf{a}^{0})$
, design freedom for the proposed design is given by Eq. (3) using vector notation for brevity.
 $$\begin{eqnarray}\displaystyle f_{b}^{DF}(\mathbf{x}^{\prime },\mathbf{a}^{\prime }) & = & \displaystyle \Vert f_{b}^{DF}(\mathbf{x}^{\prime },\mathbf{a}^{\prime })-f_{b}^{DF}(\mathbf{x}^{0},\mathbf{a}^{0})\Vert \nonumber\\ \displaystyle & = & \displaystyle \unicode[STIX]{x1D706}_{1}(\mathbf{a}^{\prime }-\mathbf{a}^{0})^{T}\text{diag}[\mathbb{I}_{\mathbf{w}_{b\neq }0}](\mathbf{a}^{\prime }-\mathbf{a}^{0})\nonumber\\ \displaystyle & & \displaystyle +\,\unicode[STIX]{x1D706}_{2}(\mathbf{x}^{\prime }-\mathbf{x}^{0})^{T}\text{diag}[\mathbf{R}\mathbb{I}_{\mathbf{w}_{b\neq }0}](\mathbf{x}^{\prime }-\mathbf{x}^{0})\end{eqnarray}$$
where,
 $$\begin{eqnarray}\displaystyle & & \displaystyle \mathbb{I}_{\mathbf{w}_{b\neq }0}=Mx1\text{ vector of indicator functions for brand }b\nonumber\\ \displaystyle & & \displaystyle \mathbf{R}=NxM\text{ matrix of attribute {-} variable sensitivities}\nonumber\\ \displaystyle & & \displaystyle \text{diag}[\cdot ]=\text{ operator to transform vectors to diagonal matrices}.\nonumber\end{eqnarray}$$
To calculate the sensitivities of design attributes to design variables
![]() $r_{(b,nm)}$
, we conduct a one-sided
$r_{(b,nm)}$
, we conduct a one-sided
![]() $t$
-test between the baseline design variable
$t$
-test between the baseline design variable
![]() $x_{n}^{0}$
and the morphed
$x_{n}^{0}$
and the morphed
![]() $x_{n}^{\prime }$
from customer responses for a given attribute
$x_{n}^{\prime }$
from customer responses for a given attribute
![]() $m$
and brand
$m$
and brand
![]() $b$
. This hypothesis test sets the
$b$
. This hypothesis test sets the
![]() $r_{(b,nm)}=1$
if the
$r_{(b,nm)}=1$
if the
![]() $p$
-value for the
$p$
-value for the
![]() $t$
-test is less than 0.05, and
$t$
-test is less than 0.05, and
![]() $r_{(b,nm)}=0$
otherwise. The values of the indicator function
$r_{(b,nm)}=0$
otherwise. The values of the indicator function
![]() $\mathbb{I}_{w_{b,m\neq }0}$
are calculated by assigning the value 1 to all nonzero elements of the corresponding weight vector described in Section 3.1. This weight vector is already sparse due to L1 regularization, and is thus suited to picking out attributes that most contribute to the brand styling (Ranawat et al.
Reference Ranawat, Tuteja and Höltta-Otto2012).
$\mathbb{I}_{w_{b,m\neq }0}$
are calculated by assigning the value 1 to all nonzero elements of the corresponding weight vector described in Section 3.1. This weight vector is already sparse due to L1 regularization, and is thus suited to picking out attributes that most contribute to the brand styling (Ranawat et al.
Reference Ranawat, Tuteja and Höltta-Otto2012).
3.3 Crowdsourced Markov chain for design attributes
Our next goal is to develop a method of obtaining the attribute values for each design, for example, ‘this vehicle is 0.7 out of 1.0 for aggressiveness, 0.2 out of 1.0 for distinctiveness,’ and so on. This method is a function that maps a design’s geometric variables
![]() $\mathbf{x}$
to the design’s corresponding attributes
$\mathbf{x}$
to the design’s corresponding attributes
![]() $\mathbf{a}$
.
$\mathbf{a}$
.
Within the design community, this function has conventionally been approximated by explicitly assuming a functional form, such as the linear logit model often used in design utility theory treatments, followed by estimating part-worth coefficients of the assumed model. However, this function is likely highly nonlinear, particularly when dealing with high-dimensional representations required for realistic design stimuli.
Here we take a different approach by assuming that the nonlinear function relating design attributes to design variables is implicitly captured by the responses of brand-conscious customers. By crowdsourcing the attribute values of the designs – asking a crowd of customers to evaluate designs over attributes – we avoid needing to make a priori assumptions regarding this complex nonlinear functional form explicitly. This has advantages as we are capturing a function that may exist in a more expressive function space, allowing complex modeling of nonlinear interactions. Moreover, we avoid the need of explicit mathematical representation of geometric variables, given that realistic 3D vehicle polygon meshes may contain more than 100 000 vertices.
Under this approach, there are several ways to extract attribute values of designs from the evaluations provided by the crowd. We choose to extract these values using only relative comparisons between the set of designs, avoiding the notion of a nonrelative scale, i.e., ‘what would it mean to give a design a 0.4 out of 1.0 ‘aggressive’ score without seeing the entire set of designs, and how could we ensure everyone used the same scale?’
In particular, we ask the crowd to evaluate the attributes of designs as a ranking between just a few designs at a time. Formally, the responses
![]() ${r_{c}}_{1}^{C}$
made by customers
${r_{c}}_{1}^{C}$
made by customers
![]() $c=1\ldots C$
, in which each evaluation is in the form of a partial ranking for a single design attribute. Partial rankings without ties are chosen as more intuitive for human evaluation (Gonzalez & Nelson Reference Gonzalez and Nelson1996).
$c=1\ldots C$
, in which each evaluation is in the form of a partial ranking for a single design attribute. Partial rankings without ties are chosen as more intuitive for human evaluation (Gonzalez & Nelson Reference Gonzalez and Nelson1996).
To obtain attribute values using this set of evaluation responses from the crowd, i.e., to aggregate these partial rankings into numbers for each attribute and for each design, we derive a Markov chain solved using a modified version of PageRank (Brin & Page Reference Brin and Page1998) as given in Eqs (4), (5), and (6). Informally, this Markov chain treats the ranking of all designs for a specific attribute as a set of ‘states,’ for car designs to jump between. Every time a car is ranked above another, that car pair jumps to the higher ranked state. The set of states that correspond to the maximal number of correctly ranked cars is called the ‘stationary distribution.’ Finding this desired final ranking of states requires an iterative optimization procedure.
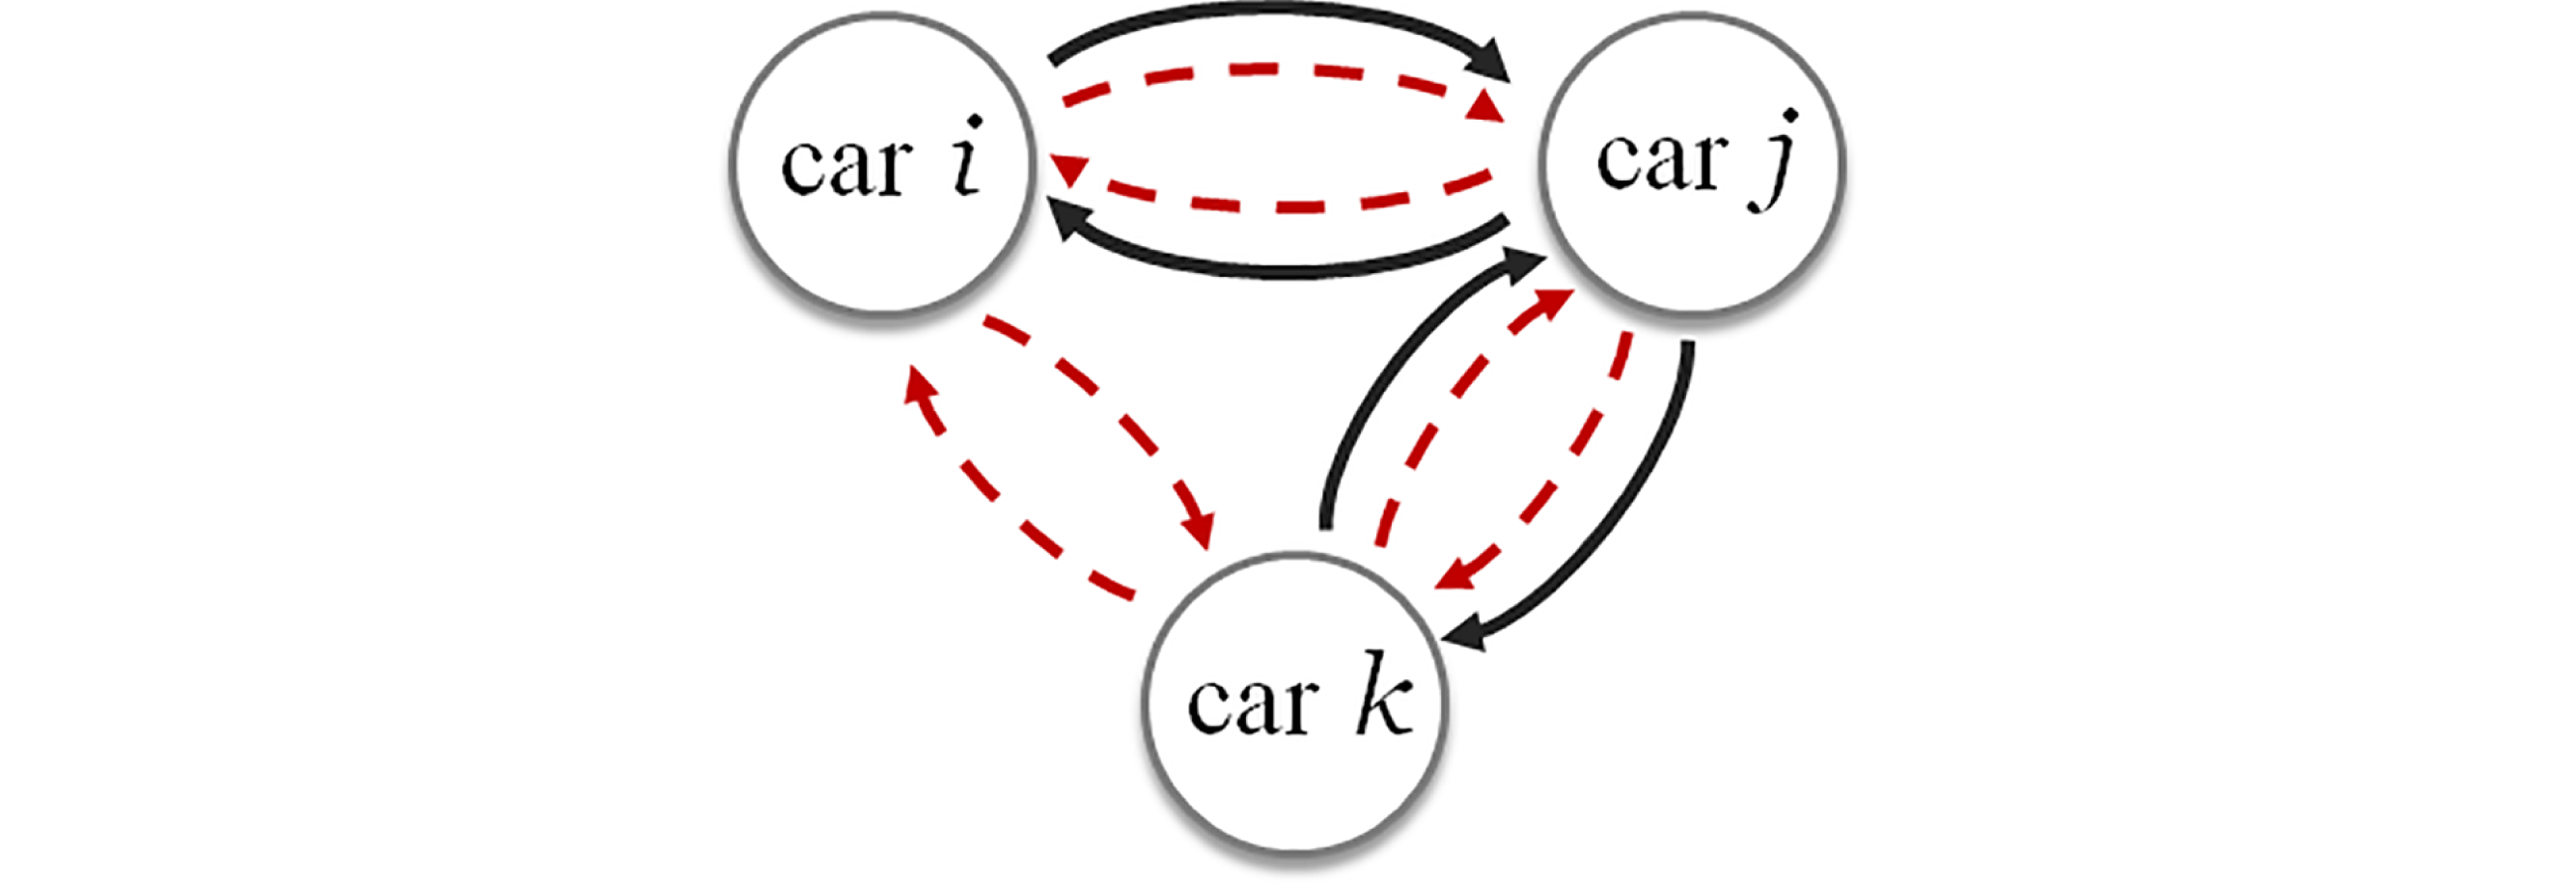
Figure 4. Diagram of Markov chain used to aggregate customer responses in the form of partial rankings of cars to obtain design attribute values for each brand. Black arrows show nonzero transition probabilities from the raw transition matrix, while red dashed arrows show perturbation probabilities added to ensure a unique stationary distribution.
This iterative procedure is characterized by the Markov chain jumping around different states as shown in Figure 4. This jumping action is governed by a transition probability from one state to another, and in our case those transition probabilities depend on partial rankings. The converged stationary probability distribution of the Markov chain is then used as the value of the attribute. Specifically, we define the attribute value as the probability that the car is ranked higher than other cars, thus the attribute value of a car equals its average percentage of the time that it is ranked higher than other competing cars. Following the jumping analogy, if a car is more likely to be ranked higher than others, then the agent will jump into that state more often.
More formally, the transition probability
![]() $P_{ij},i,j=1,\ldots ,N$
from the state representing car
$P_{ij},i,j=1,\ldots ,N$
from the state representing car
![]() $i$
to the state representing car
$i$
to the state representing car
![]() $j$
is defined as the frequency that car
$j$
is defined as the frequency that car
![]() $j$
is ranked higher than car
$j$
is ranked higher than car
![]() $i$
in all partial ranks that contain car
$i$
in all partial ranks that contain car
![]() $i$
. If the transition probability
$i$
. If the transition probability
![]() $P_{ij}$
is large, we define car
$P_{ij}$
is large, we define car
![]() $j$
as being more likely to have greater relative attribute value than car
$j$
as being more likely to have greater relative attribute value than car
![]() $i$
. We denote the transition probability matrix as
$i$
. We denote the transition probability matrix as
![]() $\mathbf{P}=(P_{ij})$
, hereafter referred to as the raw transition probability matrix. The stationary distribution
$\mathbf{P}=(P_{ij})$
, hereafter referred to as the raw transition probability matrix. The stationary distribution
![]() $\unicode[STIX]{x1D70B}$
of a Markov chain is a distribution vector unchanged after the operation of transition matrix
$\unicode[STIX]{x1D70B}$
of a Markov chain is a distribution vector unchanged after the operation of transition matrix
![]() $\mathbf{P}$
, as given in Eq. (4).
$\mathbf{P}$
, as given in Eq. (4).
 $$\begin{eqnarray}\displaystyle & \boldsymbol{\unicode[STIX]{x1D70B}}=(\unicode[STIX]{x1D70B}_{1},\unicode[STIX]{x1D70B}_{2},\ldots ,\unicode[STIX]{x1D70B}_{N}) & \displaystyle \nonumber\\ \displaystyle & \displaystyle \unicode[STIX]{x1D70B}_{i}\geqslant 0\quad \text{and}\quad \mathop{\sum }_{i=1}^{N}\unicode[STIX]{x1D70B}_{i}=1. & \displaystyle \nonumber\end{eqnarray}$$
Consistent with Markov chain theory, there is no guarantee that the raw transition probability matrix
![]() $\mathbf{P}$
will have unique stationary distribution (Ross Reference Ross1996) without some strong assumptions. To achieve uniqueness in the resulting distribution, we make two extensions to convert the raw transition matrix
$\mathbf{P}$
will have unique stationary distribution (Ross Reference Ross1996) without some strong assumptions. To achieve uniqueness in the resulting distribution, we make two extensions to convert the raw transition matrix
![]() $\mathbf{P}$
to a stochastic, irreducible, and aperiodic matrix (Brin & Page Reference Brin and Page1998).
$\mathbf{P}$
to a stochastic, irreducible, and aperiodic matrix (Brin & Page Reference Brin and Page1998).
3.3.1 Extension 1
The rows in
![]() $\mathbf{P}$
containing only 0’s are replaced with
$\mathbf{P}$
containing only 0’s are replaced with
![]() $\frac{1}{N}\mathbf{e}^{T}$
, where
$\frac{1}{N}\mathbf{e}^{T}$
, where
![]() $\mathbf{e}^{T}$
is a column vector consisting of 1’s, and
$\mathbf{e}^{T}$
is a column vector consisting of 1’s, and
![]() $T$
denotes the transpose operator. This adjustment results in a stochastic matrix denoted by
$T$
denotes the transpose operator. This adjustment results in a stochastic matrix denoted by
![]() $\mathbf{S}$
as given in Eq. (5).
$\mathbf{S}$
as given in Eq. (5).
3.3.2 Extension 2
To convert
![]() $\mathbf{S}$
into an irreducible and aperiodic matrix
$\mathbf{S}$
into an irreducible and aperiodic matrix
![]() $\mathbf{G}$
, we use Eq. (6).
$\mathbf{G}$
, we use Eq. (6).
where
![]() $\unicode[STIX]{x1D6FE}$
is a scalar between 0 and 1 controlling the intensity of the perturbation that ensures uniqueness.
$\unicode[STIX]{x1D6FE}$
is a scalar between 0 and 1 controlling the intensity of the perturbation that ensures uniqueness.
With these extensions, a unique stationary distribution exists for
![]() $\mathbf{G}$
. From Eq. (6), the stationary distribution vector
$\mathbf{G}$
. From Eq. (6), the stationary distribution vector
![]() $\boldsymbol{\unicode[STIX]{x1D70B}}$
can be obtained by calculating the eigenvectors of
$\boldsymbol{\unicode[STIX]{x1D70B}}$
can be obtained by calculating the eigenvectors of
![]() $\mathbf{G}$
or by iteratively calculating
$\mathbf{G}$
or by iteratively calculating
![]() $\boldsymbol{\unicode[STIX]{x1D70B}}^{(k+1)}=\boldsymbol{\unicode[STIX]{x1D70B}}^{(k)}\mathbf{G},k=1,2,\ldots$
until convergence. To calculate the values of attributes
$\boldsymbol{\unicode[STIX]{x1D70B}}^{(k+1)}=\boldsymbol{\unicode[STIX]{x1D70B}}^{(k)}\mathbf{G},k=1,2,\ldots$
until convergence. To calculate the values of attributes
![]() $\mathbf{a}_{b}$
for brand
$\mathbf{a}_{b}$
for brand
![]() $b$
based on the set of all partial rankings from customer responses
$b$
based on the set of all partial rankings from customer responses
![]() ${r_{c}}_{1}^{C}$
, we define the attribute value for car
${r_{c}}_{1}^{C}$
, we define the attribute value for car
![]() $i$
as
$i$
as
![]() $\unicode[STIX]{x1D70B}_{m},m=1,2,\ldots ,M$
.
$\unicode[STIX]{x1D70B}_{m},m=1,2,\ldots ,M$
.
4 Experiment
We conducted two experiments to measure how brand recognition changed as design freedom increased. Experiment 1 assessed brand recognition using 2D images of current MY2014 vehicle designs, followed by generation of new morphed concept designs using 3D morphable models. Experiment 2 assessed brand recognition using 2D images of both the MY2014 vehicle designs and the new morphed concept designs.
The data collected from the MY2014 baseline designs allowed us to measure current brand recognition for each brand, as well as develop a predictive model for brand recognition as a function of design attributes. The data collected from the morphed concept designs allowed us to measure brand recognition at various values of design freedom.
4.1 Customers
We gathered a total of 315 customers through the crowdsourcing platform Amazon Mechanical Turk. As online crowdsourcing has been empirically shown to be a noisy process, partially due to various motivations of customers (Gerth, Burnap & Papalambros Reference Gerth, Burnap and Papalambros2012; Pilz & Gewald Reference Pilz and Gewald2013; Sheshadri & Lease Reference Sheshadri and Lease2013; Panchal Reference Panchal2015), we filtered out data from customers using two data processing steps to ensure data fidelity.
First, customers that simply ‘clicked through’ the survey were filtered out by requiring their average time on the 2D portion of the site to be greater than 6 s per ranking. Second, a brand recognition accuracy threshold of 30% was chosen to filter out customers who were not ‘brand-conscious’ as justified in Section 2. For reference, the average brand recognition accuracy for the unfiltered crowd was 32.78%. Brand recognition accuracy was treated as a constant variable across the entire survey, and all data were filtered out for a given participant if he or she did not fall above the threshold.
After filtering mechanisms, 139 customers were retained from a total of 315 customers gathered over two experiments, as described in the experimental procedure. In particular, experiments gathered 196 and 119 customers, of which 96 and 43 remained after filtering, respectively.
4.2 Vehicle brands and models
The brands chosen were Audi, BMW, Cadillac, and Lexus (
![]() $B=4$
), due to their relative similarities over a targeted market segment of luxury vehicles, as well as similarity of product offerings across vehicle classes. For each brand, five models were chosen from MY2014 corresponding to five vehicle classes as given in Table 1.
$B=4$
), due to their relative similarities over a targeted market segment of luxury vehicles, as well as similarity of product offerings across vehicle classes. For each brand, five models were chosen from MY2014 corresponding to five vehicle classes as given in Table 1.
Table 1. Description of the four vehicle manufacturer brands and five associated vehicle classes used in this study


Figure 5. 2D Images of MY2014 Vehicles with brand emblems removed.
4.3 2D images and 3D morphable vehicle models
Images of the vehicle face were sourced from an online vendor. The face viewpoint has been shown to be more correlated with brand recognition than side view or rear vehicle view (Ranscombe et al. Reference Ranscombe, Hicks, Mullineux and Singh2012). Each image consisted of a white vehicle on a white background to minimize confounding interactions from color as shown in Figure 1. Moreover, the brand logo was removed for each vehicle image in order to focus customer responses just on styling as in Orbay et al. (Reference Orbay, Fu and Kara2015). All 2D representations are shown in Figure 5.
Four morphable 3D models, one for each brand, were created as shown in Figure 2. Morphing was precomputed offline using Laplacian deformation and volumetric-based mesh deformation techniques (Botsch & Sorkine Reference Botsch and Sorkine2008). The models were then imported into the web-based survey using the browser-based WebGL renderer, allowing real-time and realistic deformation via client-side graphics processing unit interpolation.
4.4 Design attributes
As discussed above, design attributes link brand recognition with design freedom. We selected ten design attributes given in Table 2 based on input from actual design teams in the automotive industry (Motors 2014).
Table 2. Description of the four vehicle manufacturer brands and five associated vehicle classes used in this study

4.5 Experimental procedure
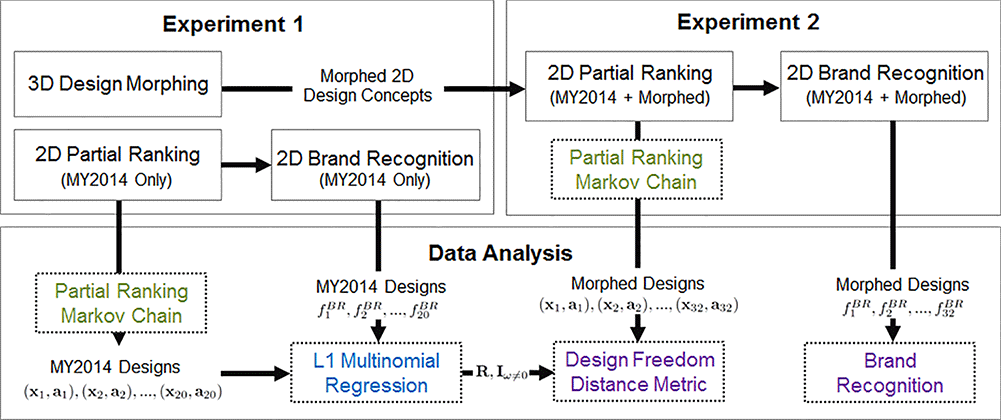
We conducted two experiments: Experiment 1 gathered attribute values and brand recognition accuracies via partial rankings of 2D images of MY2014 baseline designs. This was followed by generation of new morphed concept designs using a 3D morphable model. Experiment 2 similarly gathered attribute values and brand recognition accuracies, except this time using 2D images of both the MY2014 baseline designs mixed with 2D images of the 3D morphed concept designs from Experiment 1. The overall procedure is given in Figure 6, and was as follows.

Figure 6. Overview of the experimental procedure for both Experiment 1 and Experiment 2. Experiment 1 asked participants to give partial rankings of current MY2014 baseline designs for a given design attribute, followed by asking which brand each of the images corresponded to. Participants were then asked to morph a 3D design to create new concept designs given the same design attribute. Experiment 2 asked a different set of participants to give partial rankings of current MY2014 baseline designs mixed with images of the morphed concept designs from Experiment 1. Similarly, participants were then asked which each brand the images corresponded to.
4.5.1 Experiment 1
Participants were first directed to an introduction page, where they were given instructions on ranking vehicles according to a semantic differential. This semantic differential consisted of only one of the ten attributes from low to high value or vice versa to act as a counterbalance for ordering biases. Over the entire interactive survey, a participant was always given the same semantic differential to reduce participant burden.
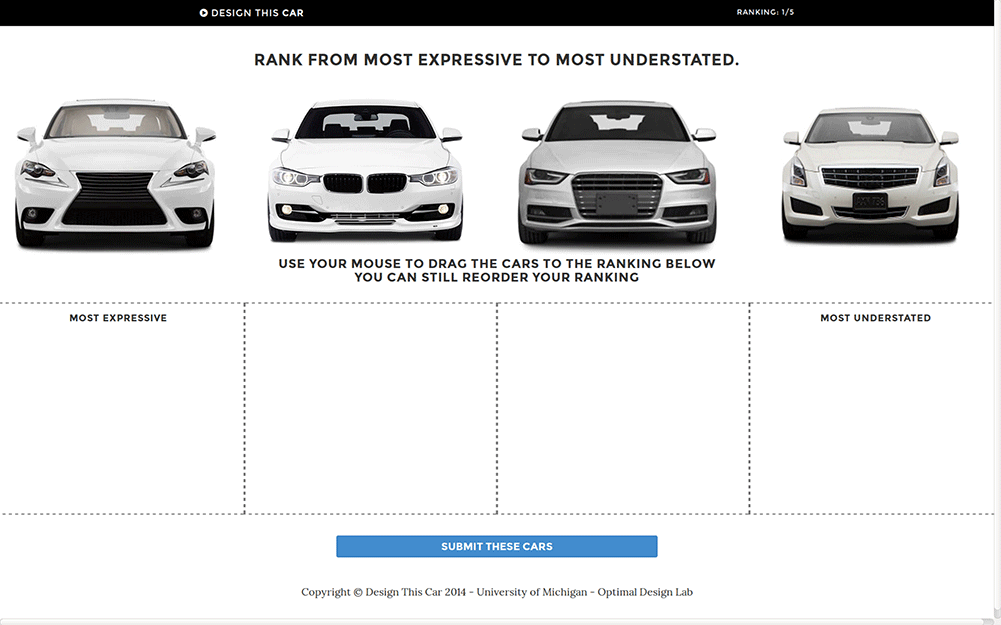
Next, participants were directed to the 2D design ranking page, with the four vehicles in a top row and four outlined placeholders in a bottom row as shown in Figure 7. Instructions on the page were given to drag and drop the four MY2014 baseline designs from the top row to the bottom row using the mouse, including possibility of reordering the partial ranking. Upon clicking the ‘Submit’ button for the partial ranking, participants were then asked to choose the brand of each MY2014 baseline design using a drop-down menu with 34 possible options (e.g., Audi, Volvo, Toyota).

Figure 7. Snapshot of 3D morphing design from online web application.
After participants chose a recognized brand for each of the vehicles, they were allowed to continue to the next partial ranking. After participants completed five partial rankings on the 2D portion of the site, they were directed to the 3D portion of the site for generating new designs. In this portion, each participant was given a randomly chosen 3D model in the midsize vehicle segment from the four brands as shown in Figure 8. Participants were then asked to maximize the same design attribute as their semantic differential from the 2D portion of the site by morphing the 3D design using four sliders. They were able to rotate the 3D vehicle model to assess the gestalt of the face. Upon submitting their chosen 3D design, participants were then directed to a short survey in which they were asked basic demographic information as well as task relevant information.
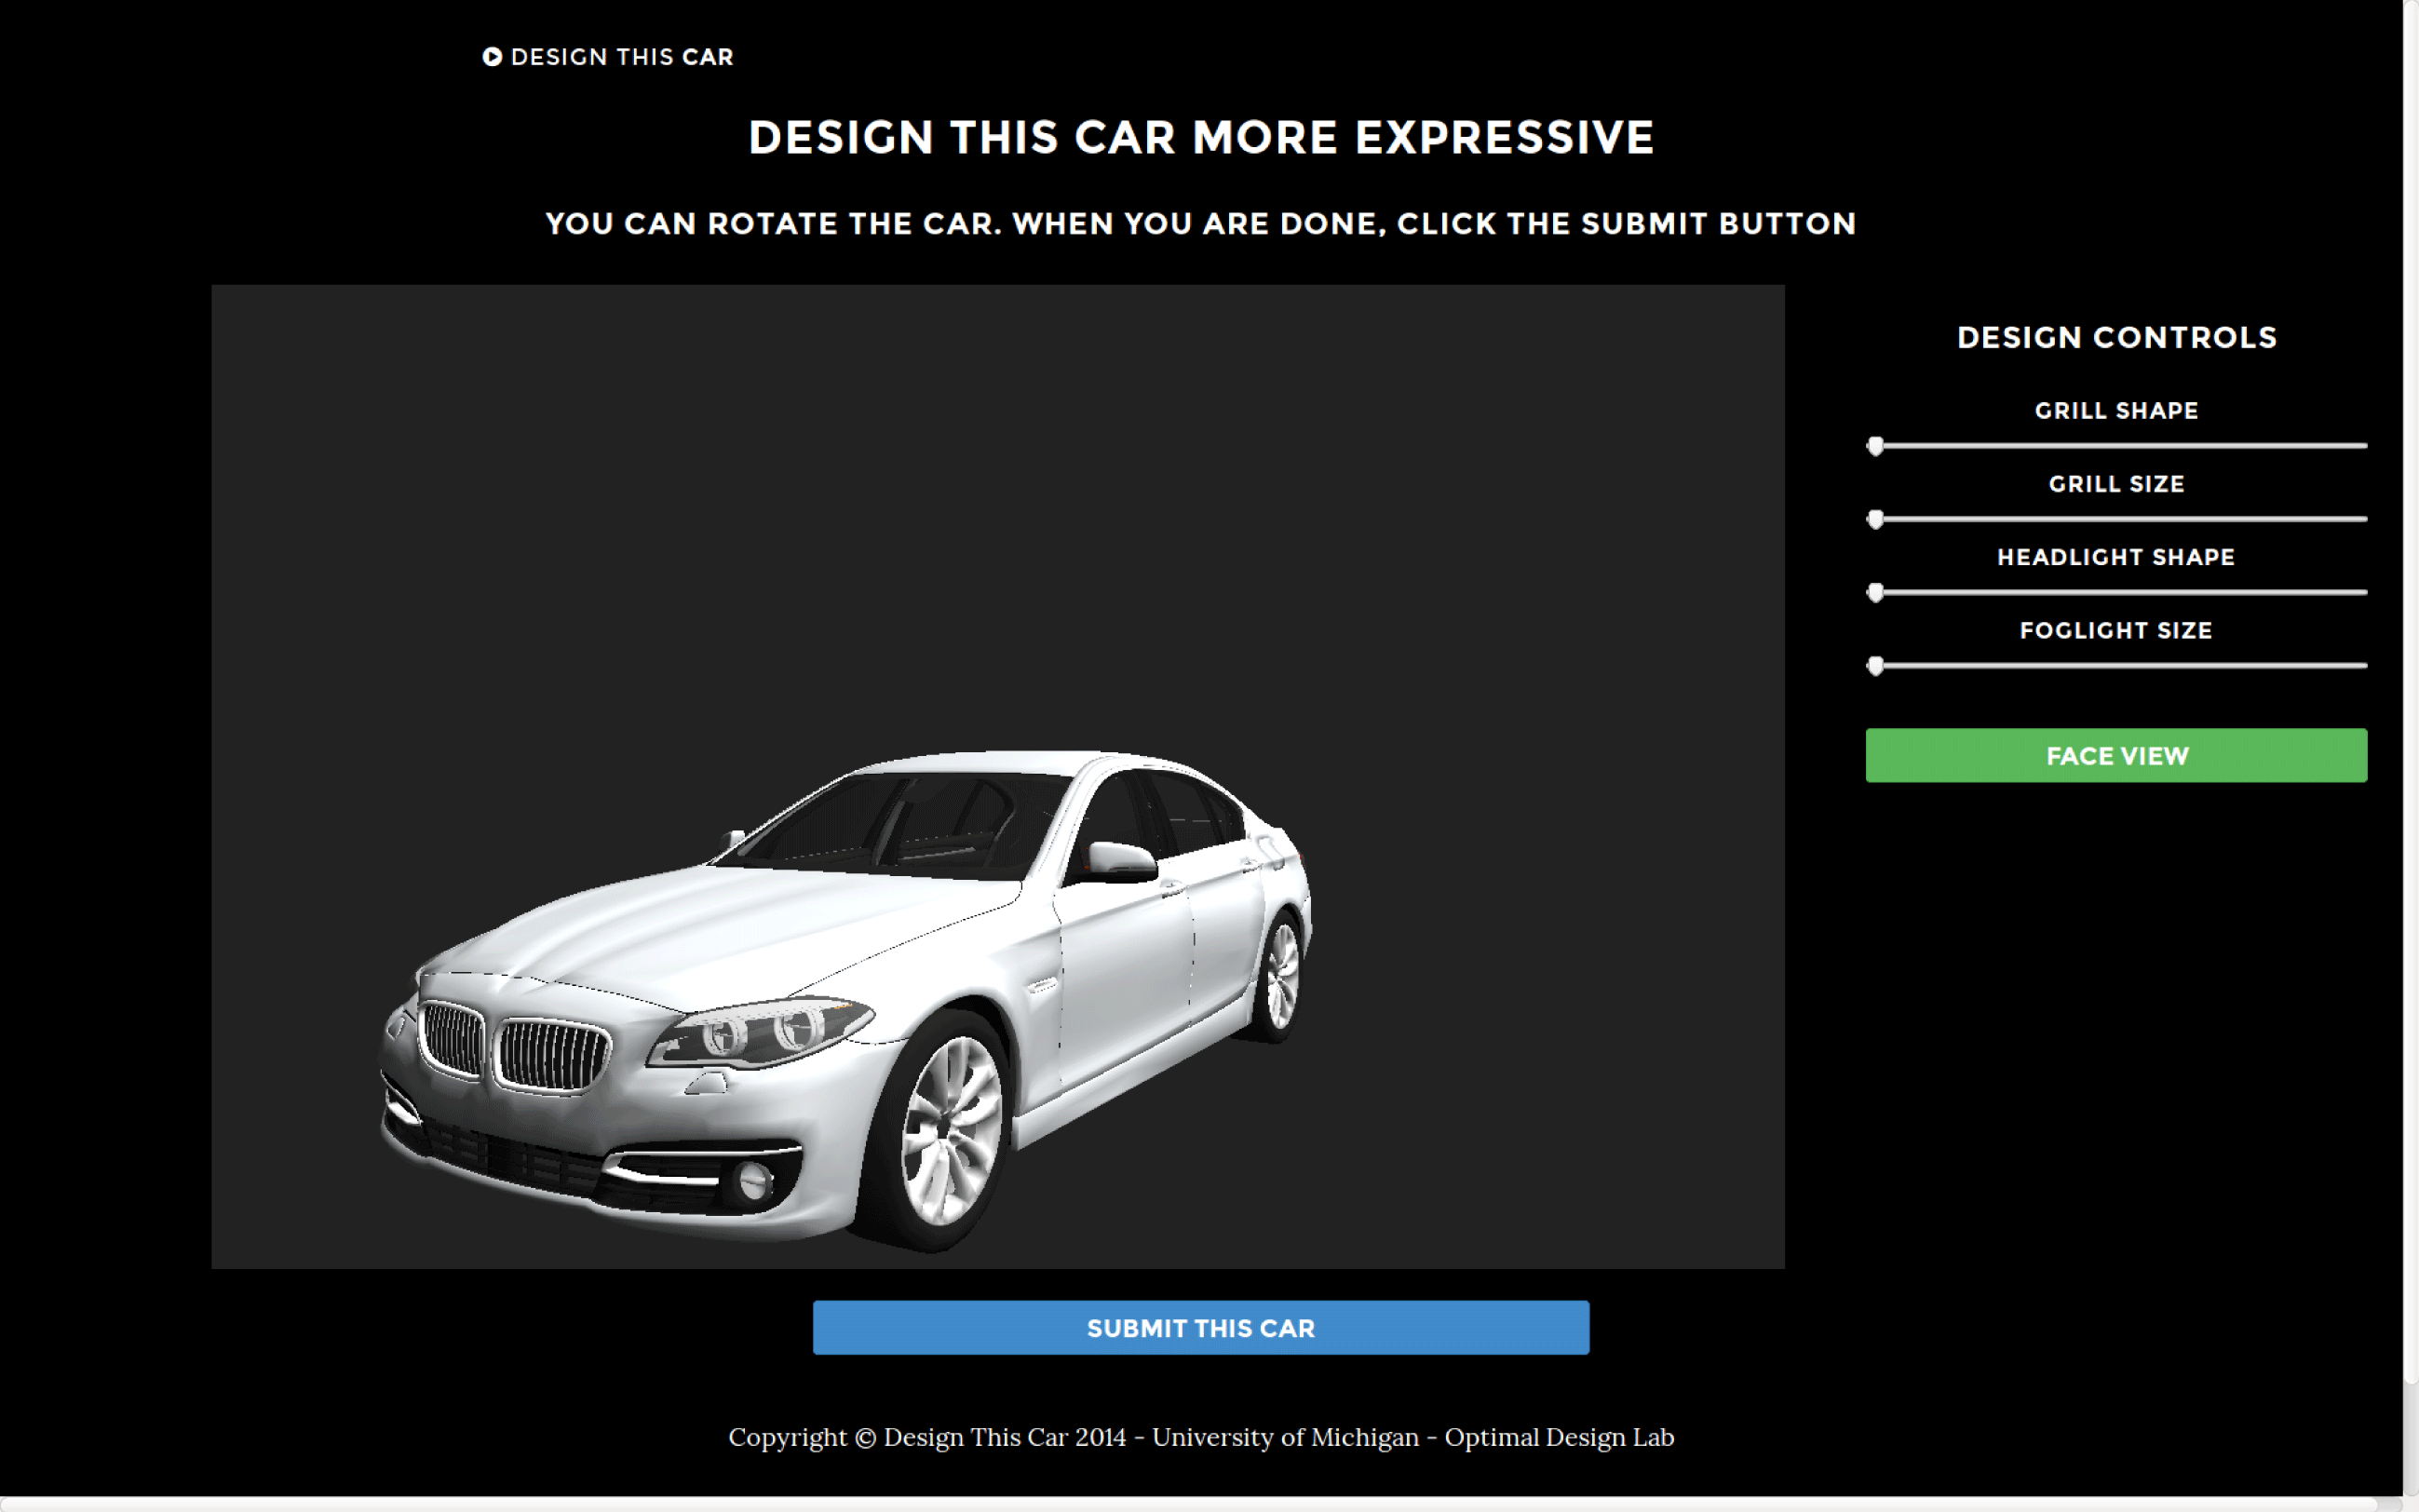
Figure 8. Snapshot of 3D morphing design from online web application.
4.5.2 Experiment 2
A new set of participants was asked to give partial rankings for a randomly assigned design attribute, but now with both 2D images of MY2014 baseline designs mixed with 2D images of face views of the 3D morphed concept designs from Experiment 1. Recall that this mixture of MY2014 baseline designs and morphed concept designs is necessary to get relative attribute values using the partial ranking Markov chain method derived earlier. A total of 52 possible 2D images was shown to participants, 20 from the original MY2014 baseline designs given in Table 1, and 32 from 3D designs morphed concept designs from Experiment 1.
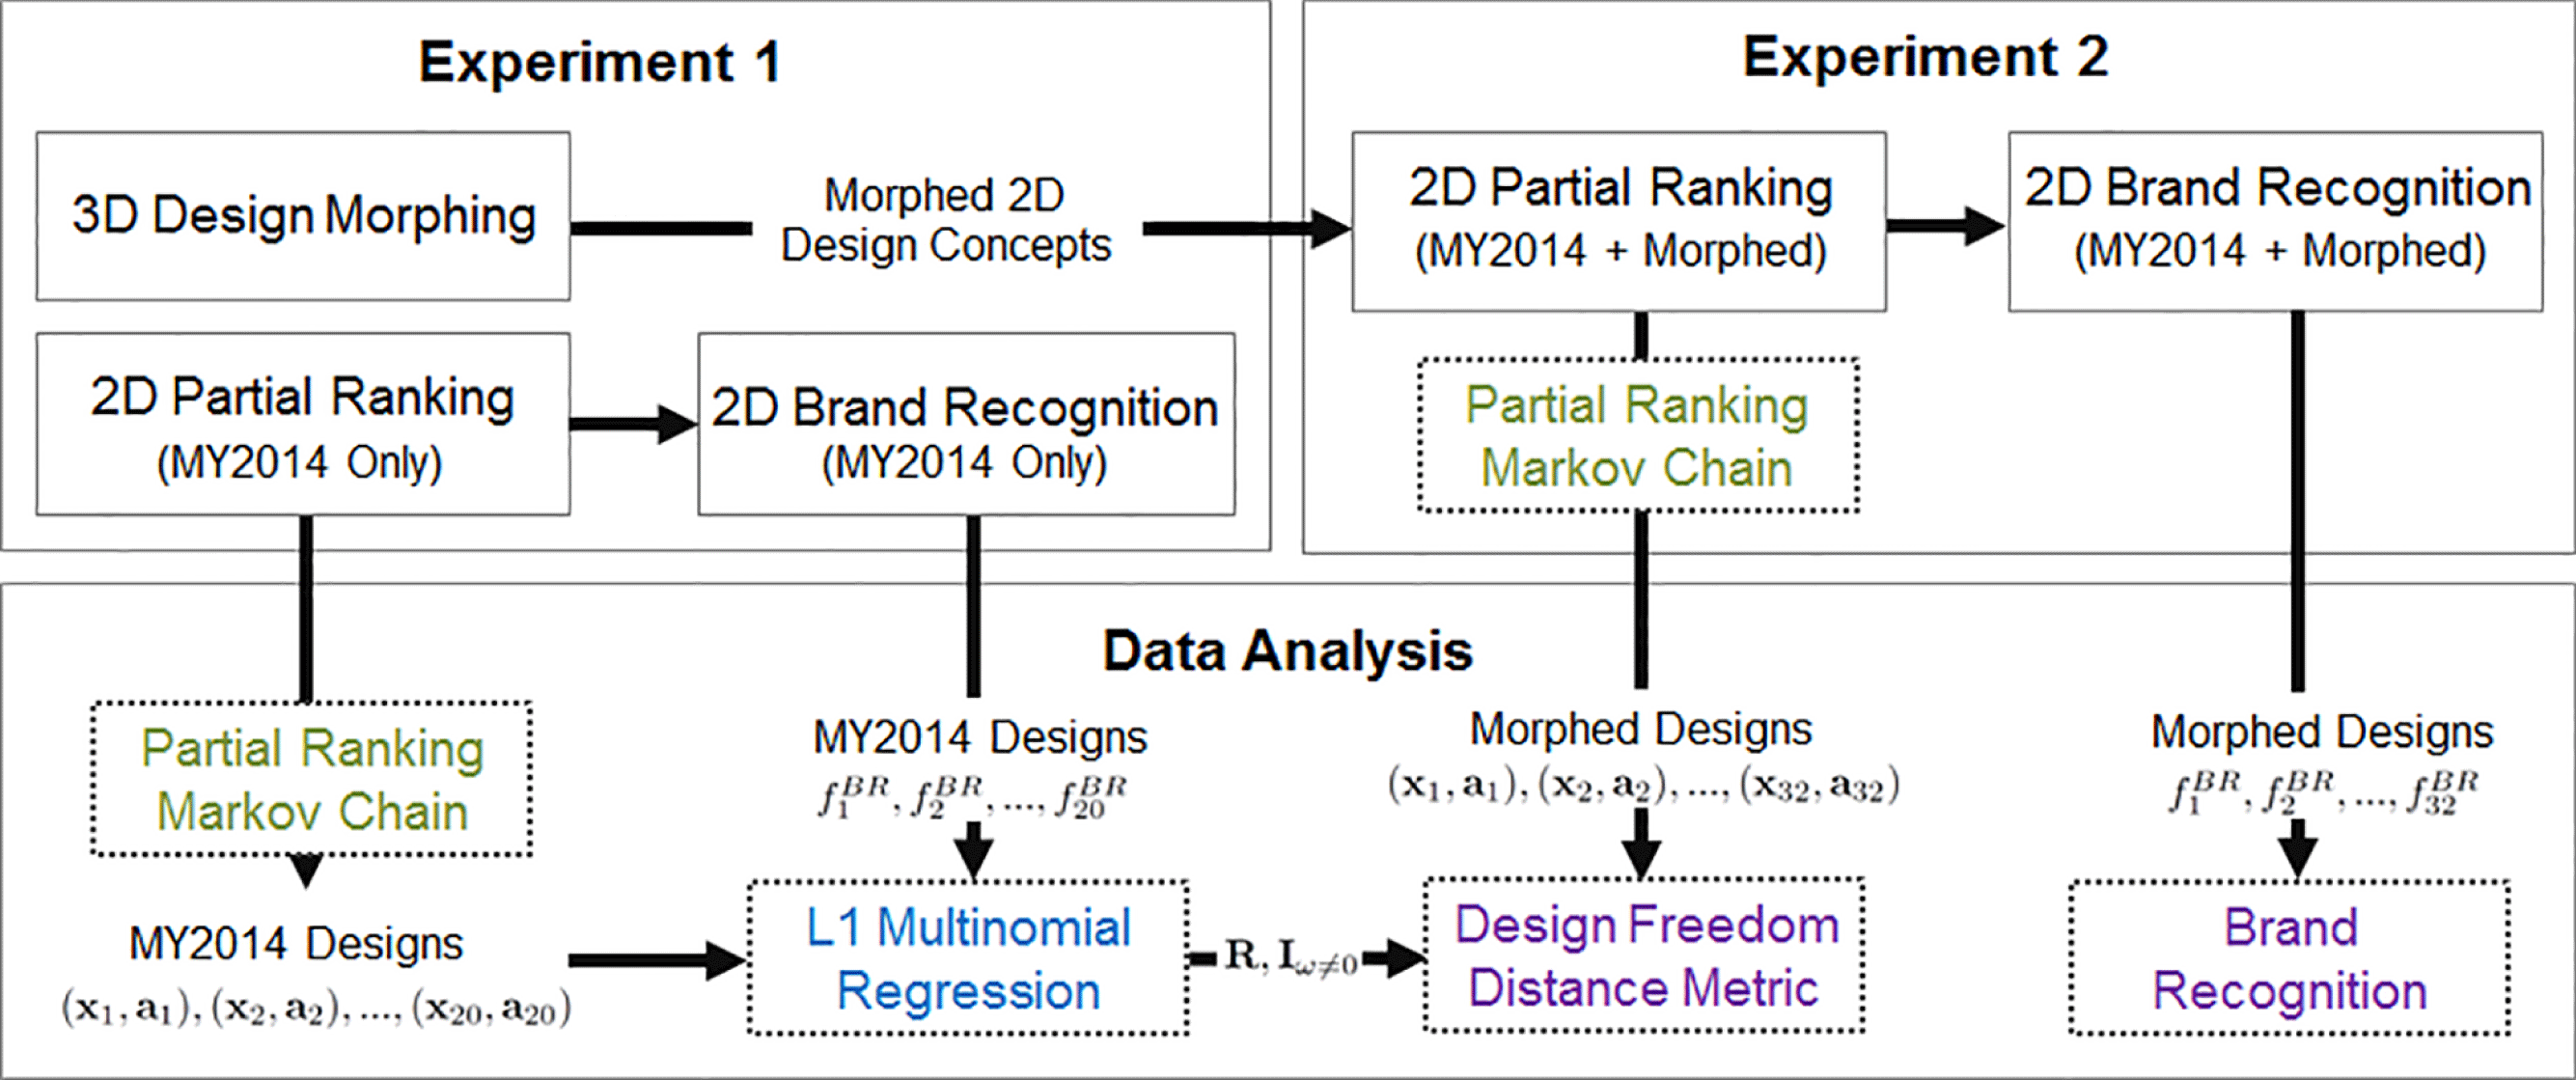
Figure 9. Diagram of the data flow and methods used in the data analysis of the experiment. As described earlier and shown in Figure 5, Experiment 1 provides the Partial Ranking Markov Chain and L1 Multinomial Regression with data from only MY2014 vehicle designs, thus provided the attribute–variable sensitivities
![]() $\mathbf{R}$
and brand–attribute sensitivities
$\mathbf{R}$
and brand–attribute sensitivities
![]() $\mathbb{I}_{(\unicode[STIX]{x1D714}\neq 0)}$
. Experiment 2 provides the Partial Ranking Markov Chain with combined MY2014 and morphed vehicle designs, of which only morphed design attributes and variables are passed on to the Design Freedom Distance Metric. The values of design freedom for each morphed design are then compared with their corresponding brand recognition to obtain the desired slope on a brand-by-brand basis.
$\mathbb{I}_{(\unicode[STIX]{x1D714}\neq 0)}$
. Experiment 2 provides the Partial Ranking Markov Chain with combined MY2014 and morphed vehicle designs, of which only morphed design attributes and variables are passed on to the Design Freedom Distance Metric. The values of design freedom for each morphed design are then compared with their corresponding brand recognition to obtain the desired slope on a brand-by-brand basis.
4.6 Brand recognition versus design freedom data analysis
We give a diagram in Figure 9 of the data analysis using the methods detailed and developed in Section 3, and list this methods flow here: We aggregated the partial rankings from each brand-conscious participant using the method described earlier to obtain the design attribute values for each new conceptual design. These design attributes were used to build a model of brand recognition. The filtered data included participants from 2D images of both morphed and nonmorphed designs due to the relative values obtained using the partial ranking aggregation method.
Brand recognition was assessed by calculating the number of correct responses to the set of 32 morphed conceptual designs over the total number of times that particular conceptual design showed up in the partial rankings. Design freedom was calculated using the metric described above. The operators
![]() $\unicode[STIX]{x1D706}_{1}$
and
$\unicode[STIX]{x1D706}_{1}$
and
![]() $\unicode[STIX]{x1D706}_{2}$
are chosen to scale the design freedom by subtracting the mean and dividing the standard deviation of each brand’s design variables and design attributes, respectively, resulting in a normalized design freedom. This operation was chosen on a brand-by-brand basis as this did not change the brand recognition versus design freedom distributions.
$\unicode[STIX]{x1D706}_{2}$
are chosen to scale the design freedom by subtracting the mean and dividing the standard deviation of each brand’s design variables and design attributes, respectively, resulting in a normalized design freedom. This operation was chosen on a brand-by-brand basis as this did not change the brand recognition versus design freedom distributions.

Figure 10. Brand recognition versus design freedom for the four vehicle brands in this study over 2D images taken of the conceptual designs generated during the 3D portion of the experiment. Brand recognition accuracy is defined as the percentage of time a brand-conscious customer – a customer who correctly identified more than 30% of the MY2014 baseline vehicle brands – was able to correctly recognize a new morphed design. Note that design freedom values have been normalized within the brand such that the four brands may be meaningfully compared – this operation results in negative values of design freedom though the original values are always nonnegative.
5 Results
Four plots depicting the empirical relationships between brand recognition and design freedom for each manufacturer are given in Figure 10. Each plot includes a trend line obtained using Theil–Sen robust linear regression to assess, to first order only, how fast brand recognition decreases as design freedom is increased (Sen, 1968). The slopes of each of these trend lines are given in Table 3. As given by the median absolute deviation, linear relations for Audi and Lexus are not very meaningful but one can still discern a trend. Histograms showing the marginal distributions are also plotted in Figure 10 to convey the relative coverage of the data for each brand. Note that while it is highly unlikely that these trends are strictly linear, linear regression is used to capture general trends.
The brand recognition versus design freedom slope for each of the four manufacturers is negative, a result obtained entirely from the data, confirming intuition that increasing design freedom results in decreased brand recognition. From these slopes, we can see that BMW and Cadillac have the quickest loss of brand recognition with increasing design freedom. These results suggest that designers at BMW have much less leeway in their freedom to create future design concepts without sacrificing brand image and heritage. Cadillac is second in this ordering, yet has significantly less sharp of a slope, suggesting that designers at Cadillac are not as constrained as designers at BMW.
Table 3. Slope coefficients of Theil–Sen robust linear model fit to brand recognition versus design freedom for the four brands in this study

Lexus and Audi are shown to be third and fourth in this ranking; however, both of these manufacturers have results that are less meaningful due to both poor linear fit as given by Table 3, as well as low overall brand recognition. In particular, Figure 11 shows the overall brand recognition accuracy across the four brands for both brand-conscious customers and non-brand-conscious customers. We observe that BMW and Cadillac have the most recognizable brand, justified as the ‘All Customers’ data consist of over 5428 brand identifications from a pool of 315 customers. Audi and Lexus were found to have the lowest brand recognition, both among brand-conscious customers and nonfiltered customers.
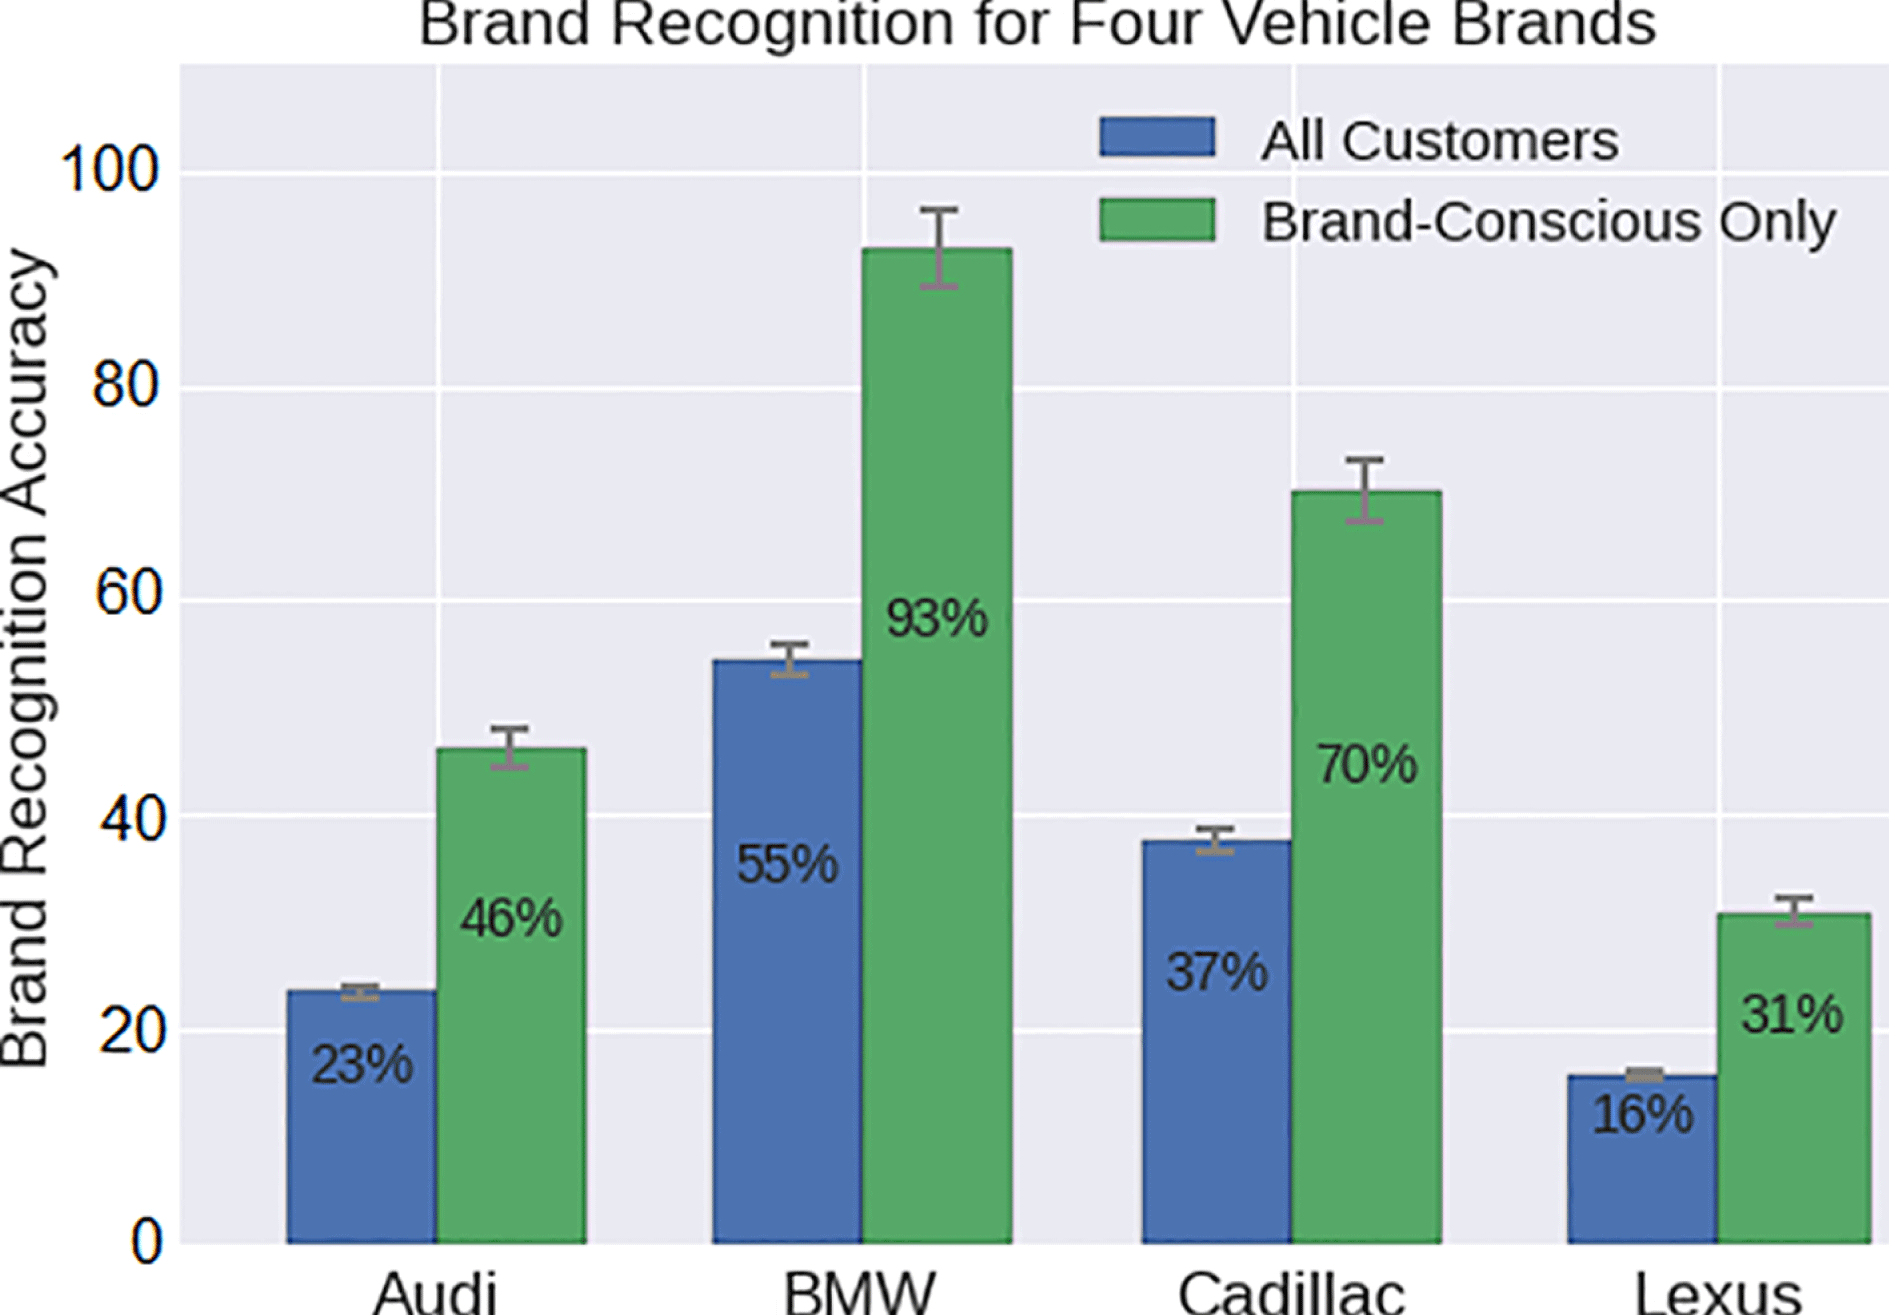
Figure 11. Brand recognition for the four vehicle brands in this study. Brand-conscious customers refer to those customers who could correctly identify at least on average 30% the brands of baseline (MY2014) designs.
5.1 Application to industry
The study was inspired by working with real automotive design teams, and direct practical implementation seems likely. One such implementation may be a tool to generate ‘thought seeds’ to act as inspiration for new design concepts. Such thought seeds may be used at very early stages of the design process in an effort to inspire creativity in directions that are most likely successful in the marketplace. Another implementation may be a check for promising design concepts such that they may be steered away from areas of ‘too much brand recognition’ and not enough innovation and appeal, or on the other hand, ‘too much design freedom’ and not enough adherence to brand.
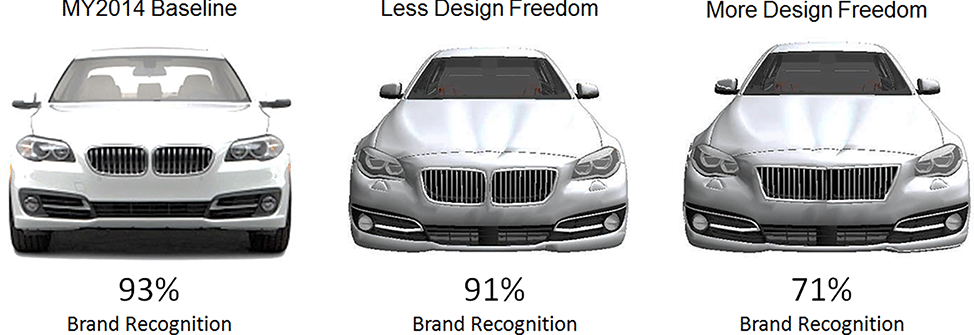
A future implementation could be a decision support tool for product researchers and strategic design managers to document explicitly which visceral design attributes and geometric design variables have the most leeway when creating a future design. As an example, we show in Figure 12 a baseline BMW 5 Series, along with two morphed BMW 5 Series with the least and most design reach from the baseline according to the data.
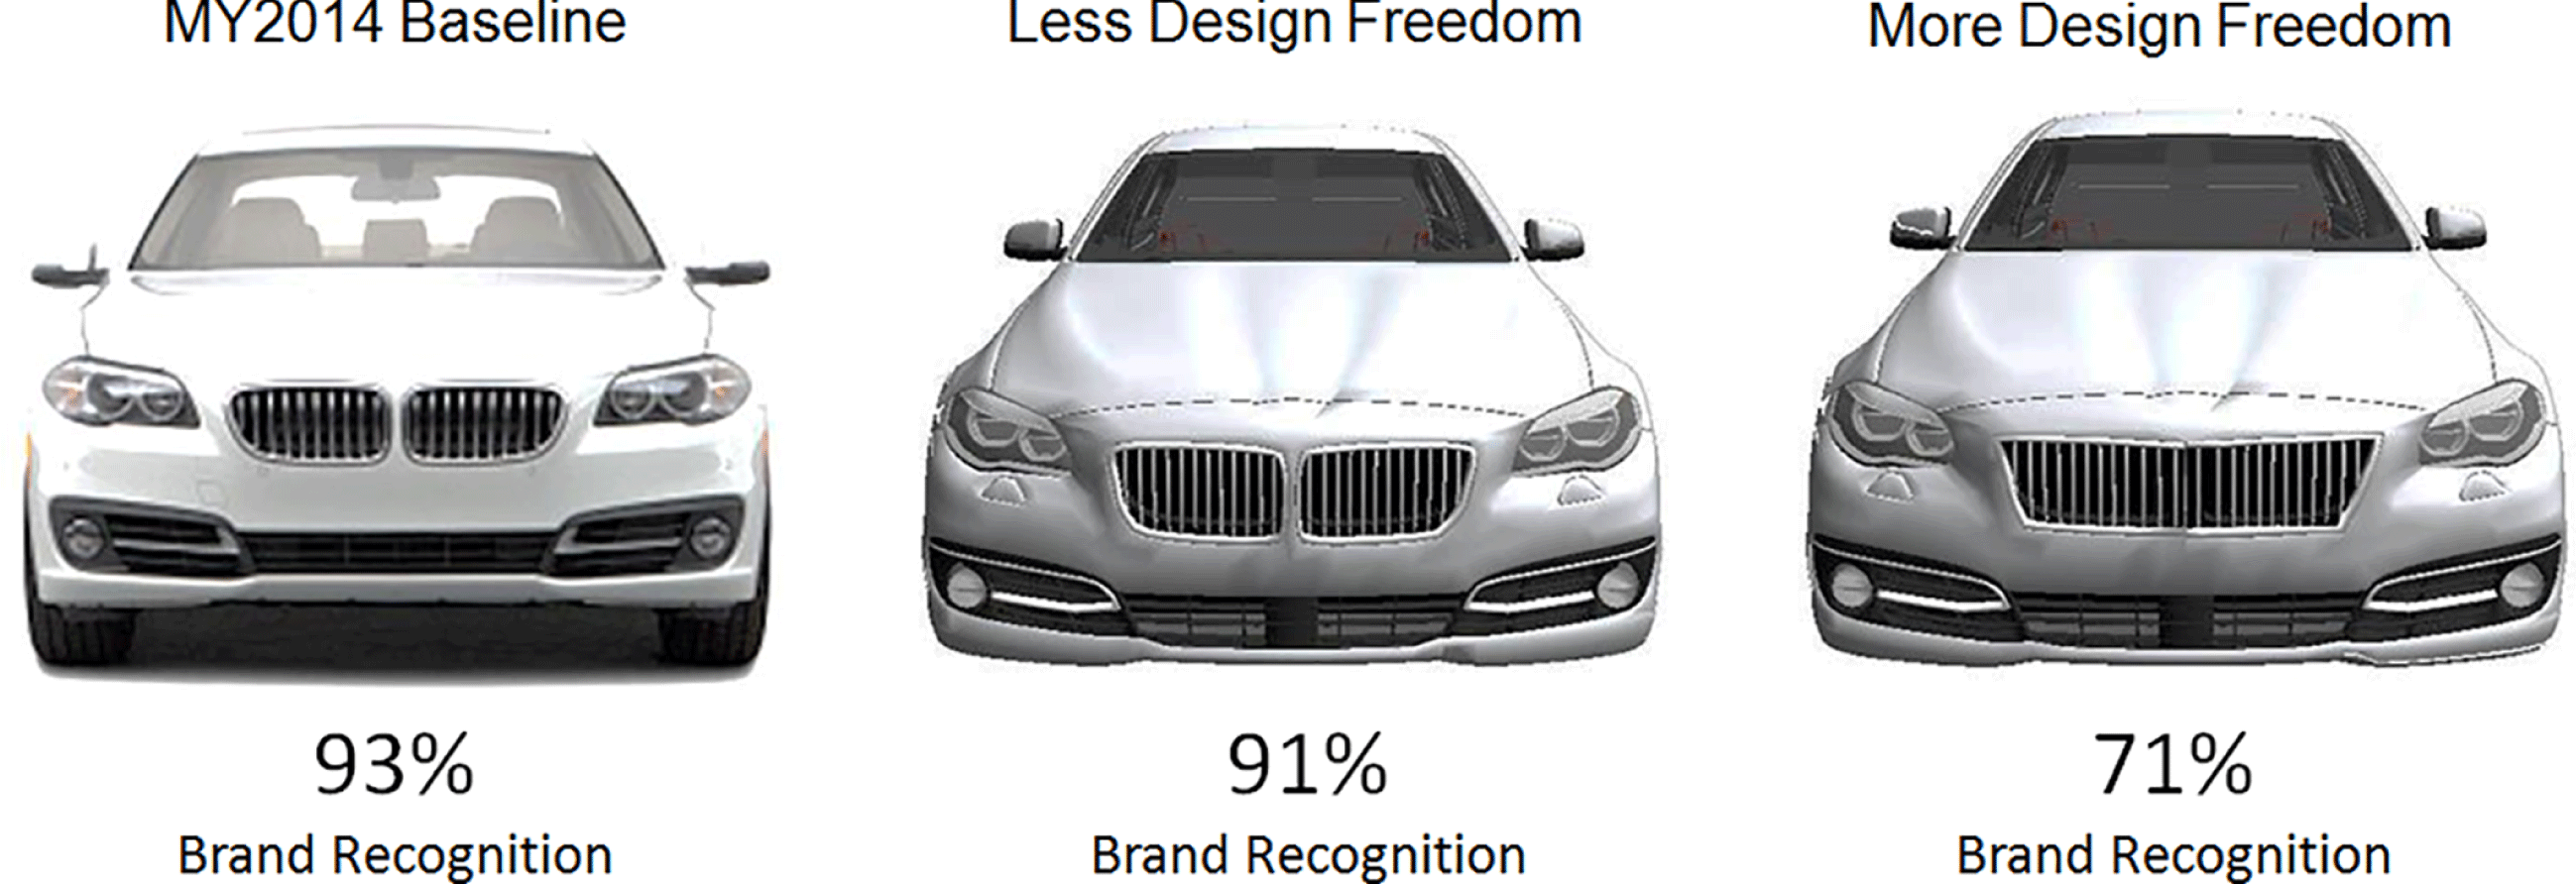
Figure 12. Example application to industry of the approach and results of this study. Three representations are given corresponding to the MY2014 Baseline BMW 5 Series, the morphed BMW 5 Series with the least design freedom from the baseline, and the morphed BMW 5 Series with the most design freedom from the baseline according to the data. Note that the MY2014 baseline is a 2D image, while the two morphed vehicles are images of the 3D morphing model.
We can see that the ‘kidney bean’ grill significantly affects the relationship between design freedom and brand recognition. This was intuited a priori and is only confirmed by the present analysis, i.e., we did not find this result introspectively – see the Limitations section for more discussion of the lack of ability to ask ‘why’ questions in the present state of this research.
Such tools can augment the experience and intuition of designers and strategic design managers using real-time feedback from a targeted crowd of customers. This tool could be combined with more advanced 3D design and semantic representations (Yumer et al. Reference Yumer, Chaudhuri, Hodgins and Kara2015), gamification of real-time crowd feedback (Ren, Bayrak & Papalambros Reference Ren, Bayrak and Papalambros2015), and advances in virtual and augmented reality technologies (Faas et al. Reference Faas, Bao, Frey and Yang2014; Ramani et al. Reference Ramani, Lee and Jasti2014; Shankar & Rai Reference Shankar and Rai2014; Tovares et al. Reference Tovares, Boatwright and Cagan2014). Combinations of these recent technologies, all characterized by having a human-in-the-loop, would likely improve the outcomes of such efforts.
5.2 Limitations
Perhaps the most limiting aspect of this work is the inability to ask ‘why’ design freedom trades off with brand recognition; in particular, which changes in the aesthetic styling of the design most affect brand recognition. This is due to the setup of this work itself, in that we are dealing with a nonparametric and nonlinear mapping between the geometric design variables and perceptual design attributes, up to the functions representing design freedom and brand recognition themselves. Since we do not even know the functional form of this mapping (due to being obtained by the partial ranking Markov chain) much less its inverse, we are not able to perform such introspection. Such a limitation provides further justification for future work into such nonlinear function introspection, with particularly promising avenues in the area of ‘feature learning’ and ‘feature interpretation’.
The design space spanned by the parameterization of geometric variables for the 3D models does not capture the entire set of possible vehicle face design concepts. While this is in part why we assumed brand recognition as a linear function of attributes – and attributes as an implicit nonlinear function of geometric variables – it must be noted that future studies may greatly differ in their parameterizations.
Filtering the data for brand-conscious customers has some limitations. We assumed that brand recognition accuracy is a static quantity throughout the survey. This does not account for familiarity with the brands after consistently seeing the same four images throughout the survey. Further, a larger number of data points would reduce the uncertainty in Figure 10, as well as allowing filtering on customers with higher average brand recognition accuracy over current MY2014 vehicles.
Several limitations to the crowdsourced function estimation approach are noted. First, attribute values will change depending on which cars are involved in the ranking. Second, the formulation assumes that customers are homogeneous in their perceptions of the design attributes. While this assumption is certainly not always true, we mitigate the effect of heterogeneity by normalizing for the relative contribution of a design attribute to either design freedom or brand recognition as given in Eq. (6). Finally, we note that including heterogeneity in customer responses to design attributes may significantly increase fidelity of the brand recognition prediction model. Such heterogeneity may be captured using models that incorporate clustering formulations or formulations that impose deviations from a common crowd prior distribution (Evgeniou, Pontil & Toubia Reference Evgeniou, Pontil and Toubia2007; Abernethy et al. Reference Abernethy, Evgeniou, Toubia and Vert2008).
This study only considered designs from MY2014, limiting these static findings from time-series trends. Future work considering design data over a number of years would provide additional insight as brands and design languages often undergo dramatic shifts (Tucker & Kim Reference Tucker and Kim2011; Ma, Kwak & Kim Reference Ma, Kwak and Kim2014). Furthermore, this study considered only luxury brands, in part because such brand imagery tends to be more recognizable. Insights into whether the same findings and methodology are appropriate for nonluxury brands would be interesting to explore. Further, design domains besides automotive offer additional opportunities for exploration.
6 Conclusion
Design freedom and brand recognition are considerations that were measured for four vehicle manufacturers – Audi, BMW, Cadillac, and Lexus – since balancing between these two considerations has been shown to significantly influence customer purchase decisions. Two experiments were conducted for measuring changes in ten styling design attributes common to both design freedom and brand recognition for automotive designs. The first experiment solicited customer responses to existing MY2014 vehicle designs according to these design attributes, followed by a stage of interactively creating new morphed vehicle concept designs; while the second experiment solicited customer responses to both the existing MY2014 vehicle designs and the new concept designs.
The data from these experiments were input to a design freedom metric function, giving a value of design freedom for each design concept. These values of design freedom were plotted against the design concept’s corresponding brand recognition on a brand-by-brand basis. Results showed that brand recognition is highly dependent on the particular vehicle manufacturer, but we were able to measure tradeoffs between design freedom and brand recognition for BMW and Cadillac. In particular, we found that BMW has the sharpest relationship between increasing design freedom and decreasing brand recognition, suggesting that designers at BMW have significantly less leeway during the design of new concepts in contrast to other premium market segment manufacturers. Cadillac has more leeway during the design process; however, brand recognition still drops precipitously with too much design freedom. Our results for Audi and Lexus were less conclusive, due to spread in the data and low absolute brand recognition, respectively.
The methodology given in this work is an additional step toward predictive modeling of aesthetic styling in the automotive design process with the goal of augmenting human intuition during the strategic design decision process. The current work is not able to answer ‘why’ design freedom and brand recognition trade off at the rate they do, due to the unknown functional form of the nonparametric and nonlinear predictive models used in the computations; accordingly, further work focused on interpretation is warranted and would increase the value of such research for real design teams.
Acknowledgments
An earlier version of this work appeared in the 2015 ASME International Design Technical Conference (Burnap et al. Reference Burnap, Hartley, Pan, Gonzalez and Papalambros2015a ). The authors would like to thank anonymous reviewers for both the conference and journal version of this study. The authors would also like to thank Evox Image Holdings (‘EvoStock.com,’ 2014) for use of their image data, and Humster3D (‘Humster3D,’ 2014) for use of their 3D model data. This research has been partially supported by General Motors Corporation and the National Science Foundation under Grant No. CMMI-1266184. This support is gratefully acknowledged. The opinions expressed in this paper are solely those of the author and do not reflect opinions of the sponsors.


