INTRODUCTION
Although acute gastroenteritis (AG) is typically mild and self-limiting, it causes substantial morbidity as well as an economic burden to the population and healthcare system. In France, surveillance of AG is based on notification from general practitioners (GPs), hospital physicians and laboratories [1]. However, this type of surveillance underestimates the true burden of AG due to underreporting, and does not capture cases who do not seek medical care. We conducted a national population-based study in order to obtain more accurate estimates of the incidence and the burden of self-reported AG and describe healthcare-seeking behaviour for AG in the French population in 2009–2010. This information is important for guiding public health decision-making and priority setting and contributes to a more accurate interpretation of the data derived from healthcare provider-based AG surveillance systems.
MATERIAL AND METHODS
Study design and population
We carried out a retrospective cross-sectional telephone survey between May 2009 and April 2010 in a random sample of the French population. The French overseas administrative districts (Guyane, Antilles, Réunion Island) were not included in this study.
The study population included all people living in residential households in France who were connected to a land telephone line and who spoke French. Households and household members were randomly selected for interview. Each month a list of 2800 numbers was selected randomly from the French telephone directory. Each number was then incremented by one, in order to generate a list that also included unlisted telephone numbers. At least 20 attempts were made at different times of the day (between 16:00 and 21:00 hours during the week and between 10:00 and 14:00 hours on Saturdays) before a phone number was abandoned. All non-residential households, such as offices, institutions or holiday homes, were excluded from the study.
At the second stage, one person aged ⩾5 years and one child aged <5 years (if any) were randomly selected from the household members by selecting the person who had the next birthday. If the selected person was aged between ⩾12 years and <18 years, a parent could choose to answer for the child or allow the child to answer. If the person was aged <12 years, one parent was asked to answer on the child's behalf.
All interviews were conducted by professional interviewers, using Computer Assisted Telephone Interviews (CATI). The interviewers were monitored by supervisors (ratio 6:1). Daily quality controls were performed by supervisors. A pilot study was conducted in March–April 2009 (169 interviews). A sample size of 9600 (800 per month) was calculated in order to estimate an expected 4-week incidence of AG of 5% with a precision of ±0·5%, and an expected consultation rate in cases of 25% with a precision of 4% and a significance level of 5%.
Data collection
A case of AG was defined as having ⩾3 liquid stools or any vomiting in a 24-h period with onset of symptoms within the 4 weeks before the interview, as recommended by the International Collaboration on Enteric Disease ‘Burden of Illness’ Studies [Reference Majowicz2]. When respondents stated that vomiting or diarrhoea was due to non-infectious causes such as chronic gastrointestinal disorders, overeating, excess alcohol consumption, pregnancy, menstruation or medication, the episode was excluded. A 7-day symptom-free interval was defined to distinguish multiple episodes.
The gender and age of each respondent were collected, as well as sociodemographic characteristics of the household: household size and age of persons living in the household, education level and occupation of the head of the household.
Cases were asked questions on symptoms, duration of illness, illness in other household members, use of healthcare services, diagnostic methods, treatment practices and the effect of their illness on work and daily activities. In case of multiple episodes, only the most recent episode of AG was described.
Analysis of the data
All estimates took into account the sampling design components (primary sampling unit, sampling weights). For each respondent, sampling weights were adjusted by age, gender, region, household size and size of town population. The 4-week incidence was calculated by dividing the number of episodes of AG with onset of symptoms within the 4 weeks prior to interview divided by the total number of respondents. The incidence rate of AG per person/year was calculated by dividing the 4-week incidence by 28 and then multiplying by 365.
Possible determinants of AG and healthcare-seeking behaviour were investigated using univariate and multivariable logistic regression. Explanatory variables tested were: age, gender, number of children aged <5 years and number of persons in the household, Individuals benefiting from state health insurance for people with low income and resources, season, size of town population, educational level, and occupation of the head of the family. Symptoms and duration of illness were additional explanatory variables tested for healthcare-seeking behaviour. Age and gender were forced into the model regardless of statistical significance so that parameter estimates for gender were adjusted for age and vice versa. The other explanatory variables were introduced into the multivariable model if they were associated with the outcome at a P value of <0·2 in the univariate analysis. A global P value was calculated for categorical variables (Wald's test).
The final multivariable model was built using backwards elimination. Only age, gender and variables with P<0·05 were kept in the final model. Odds ratios, adjusted odds ratios and 95% confidence intervals (95% CI) are presented for the main findings. Only significant variables in the univariate analysis (P<0·2) are listed in the results.
Interaction effects and collinearity between variables were tested. To assess whether any variables in the final model were subject to confounding by any variables that had been omitted from the final model, each omitted variable was re-introduced individually (results not shown). Confounding was determined by looking for a change of ⩾30% in regression coefficients. Data analyses were performed using Stata 9.2 (StataCorp, USA).
RESULTS
Response rate
Of the 32 676 phone numbers selected, contact was established with 17 036 households; 1053 phone numbers were excluded because they did not correspond to a residential household. Of the 15 983 households eligible for the survey, 8905 agreed to participate (response rate 55·7%). Reasons for refusal were (more than one response possible): ‘lack of time’ (42%), ‘not interested in the survey’ (42%), ‘never answer to interviews’ (21%). From the 10 130 persons randomly selected, 10 080 were included in the survey.
Estimated incidence of AG
Of the 10 080 persons included in the survey, 559 individuals reported 596 episodes of an illness that included diarrhoea or vomiting in the preceding 28 days. Of these episodes 276 (46%) were declared due to non-infectious causes. These respondents were maintained in the non-case group. Two hundred and sixty-three episodes of AG fulfilled the criteria of the case definition, and were reported by 260 respondents.
The incidence rate of AG was estimated at 0·33 cases/person-year (95% CI 0·28–0·37). The incidence by study month peaked in January 2010.
Distribution
Incidence peaked in the 0–5 years age group (0·74 cases/person-year, 95% CI 0·55–0·93) and declined significantly with age (P<10−4). In the 30–64 years age group, the incidence rate was significantly higher in females than males (0·32 vs. 0·16 cases/person-year, P=0·007) (Fig. 1).

Fig. 1. Incidence of acute gastroenteritis, by age group and gender, France, May 2009 to April 2010 (n=10 080).
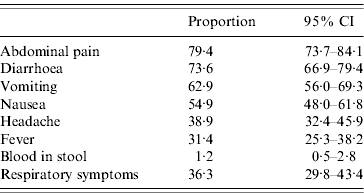
It was estimated that 88·3% (95% CI 83·0–92·1) of the cases were no longer symptomatic at the time of interview. The mean duration of illness of these cases was 2·9 days (95% CI 2·6–3·2). Abdominal pain/cramps was the most frequent symptom (79·4%), followed by diarrhoea (73·6%), vomiting, nausea, fever and bloody diarrhoea (Table 1). Thirty-six percent reported concomitant respiratory symptoms (nasal congestion, sneezing, cough, sore throat, otitis) (Table 1). These cases were significantly younger (22·9 vs. 29·0 years, P=0·03) and had a longer duration of illness (3·5 vs. 2·6 days, P=0·02) than cases who did not report concomitant respiratory symptoms. Having fever or having a headache was significantly associated with having respiratory symptoms in univariate analysis.
Table 1. Symptoms of acute gastroenteritis, France, May 2009–April 2010 (n=260)
CI, Confidence interval.
In adult cases who had a professional activity, 29·1% (95% CI 19·0–41·7) were absent from work for at least 1 day because of their illness, with a median duration of absence of 2 days (range 1–8 days). When a child had AG, an adult was absent from work at least 1 day in 15·8% (95% CI 19·0–41·7) of the cases, with a median duration of absence of 1 day (range 1–3 days).
Twenty-nine percent of the cases (95% CI 22·7–36·3) reported that at least one other person living in the same household had suffered from diarrhoea or vomiting during the week before or after the episode of the case. The mean attack rate in the affected households (of at least two individuals) was 43·6% and the mean number of cases additional to the index case in the household was 1·5 cases. Travelling outside France in the 4 weeks prior to the AG episode was reported by 6·9% (95% CI 3·8–2·1) of cases.
Determinants of AG
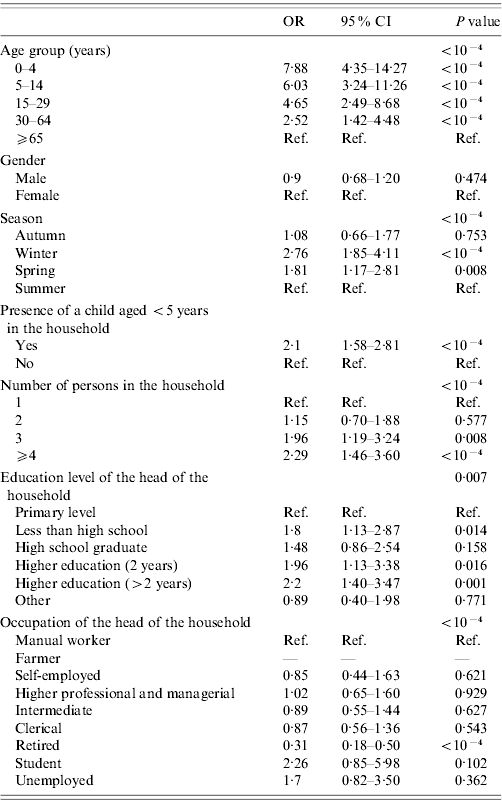
Age group, gender, season, presence of a child aged <5 years, number of persons in the household, education level, and occupation of the head of the household were associated with AG at the P<0·2 level in univariate analysis and included in the multivariable model (Table 2). The size of the town's population (P=0·52) and having state health insurance for people with low income and resources (P=0·84) were not associated with AG and therefore not included in the multivariable model (Table 2).
Table 2. Determinants of acute gastroenteritis, univariate analysis, France, May 2009–April 2010 (n=10 080)
OR, Odds ratio; CI, Confidence interval.
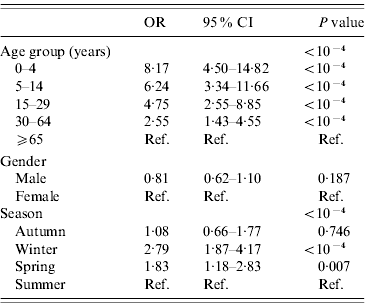
The final multivariable model included gender, age group and season (Table 3). Children, young adults and adults had a significantly higher risk of gastroenteritis in the multivariable logistic regression compared to elderly persons (⩾65 years). The risk of gastroenteritis was higher in winter and spring compared to summer.
Table 3. Determinants of acute gastroenteritis, final multivariable model, France, May 2009–April 2010 (n=10 080)
OR, Odds ratio; CI, Confidence interval.
Healthcare-seeking behaviour
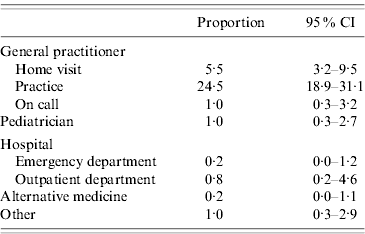
It was estimated that 33·4% (95% CI 27·1–40·3) of AG cases consulted a physician (usually a GP) for 31·0% (95% CI 24·9–37·9) of all cases (Table 4). The two individuals (0·8%) that consulted a hospital outpatient department also consulted a GP.
Table 4. Consultation for acute gastroenteritis, France, May 2009–April 2010 (n=255)
CI, Confidence interval.
The consultation rate was 40·3% (95% CI 28·5–53·4) in children aged <5 years, 42·2% (95% CI 27·4–58·1) in children aged 5–14 years, 28·1% (95% CI 20·3–37·4) in adults aged 15–64 years and 43·2% (95% CI 20·3–69·5) in elderly persons aged ⩾65 years. The main reported reasons for consultation (more than one response possible) were: prolonged symptoms (49%), vomiting (31%), diarrhoea (28%) and unusual/strange symptoms (27%). The main reasons for non-consultation (more than one response possible) were: quick recovery/no serious symptoms (64%) and feeling that a consultation was not necessary (47%). The mean number of consultations was 1·1, with a median of one consultation (range 1–4). The mean delay before consultation was 1·5 days (95% CI 1·2–1·8), with a median of 1 day (range 0–8). Of the cases who consulted a physician, five persons (7·7%; 95% CI 3·0–18·4) had a faecal sample requested, and four of them submitted a sample for testing. None of these four cases knew the result at the time of interview. One person (0·7%) aged 30 years was admitted to hospital.
Determinants of consultation for AG
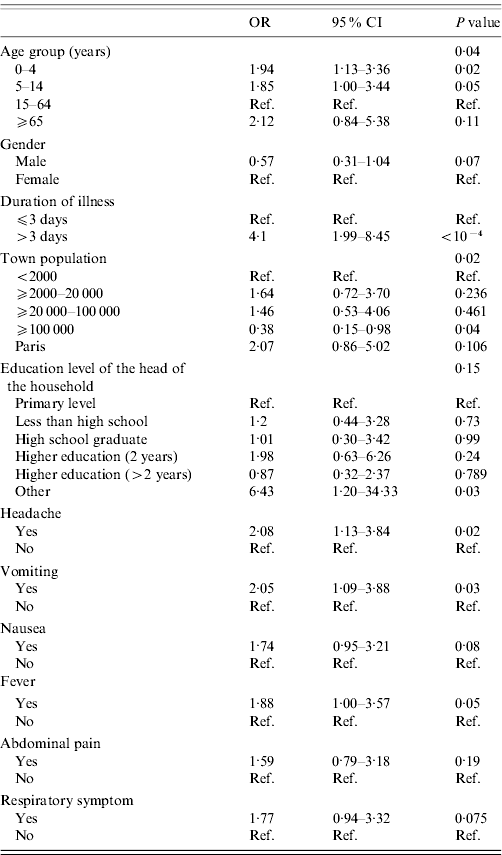
Gender, age, town population, education level of the head of the household, duration of illness and symptoms (abdominal pain, vomiting, nausea, headache, fever, respiratory symptoms) were associated with consultation for AG at the P<0·2 level in univariate analysis and included in the multivariable model (Table 5). The number of children aged <5 years (P=0·98) and number of persons in the household (P=0·31), having state health insurance for people with low income and resources (P=0·85), season (P=0·82), occupation of the head of the household (P=0·60) and symptoms (diarrhoea, blood in stool) were not associated with consultation for AG and therefore not included in the multivariable model (Table 5).
Table 5. Determinants of consultation for acute gastroenteritis, univariate analysis, France, May 2009–April 2010 (n=255)
OR, Odds ratio; CI, Confidence interval.
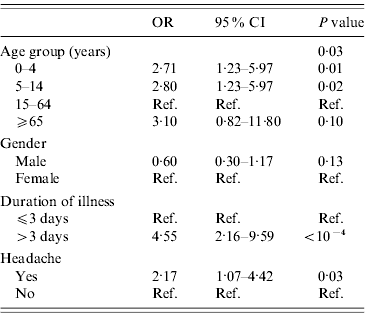
The final multivariable model included age group, gender, having a headache and duration of illness (Table 6). Children aged <15 years were more likely to consult for gastroenteritis in the multivariable logistic regression compared to adults (30–64 years). A long duration of illness (P<10−4) and having headache (p=0·03) were also associated with consultation for gastroenteritis (Table 6).
Table 6. Determinants of consultation for acute gastroenteritis, final multivariable model, France, May 2009–April 2010 (n=255)
OR, Odds ratio; CI, Confidence interval.
Medication and hygiene
It was estimated that 76·3% (95% CI 69·7–81·8) of AG cases used medication. The source of medication was the family medicine chest for 41·9% (95% CI 35·0–49·0) of the cases; 30·9% (95% CI 24·8–37·7) used medication bought after prescription and 8·9% (95% CI 5·7–13·7) used over-the-counter drugs. The mean duration of treatment was 3·1 days (95% CI 2·7–3·5) and was significantly longer for cases who consulted (4·7 days vs. 2·1 days, P<10−4).
Of AG cases aged >14 years, 47·4% (95% CI 38·4–56·5) stated washing their hands more often than usual while they were sick.
Oral rehydration solutions (ORS) were available in 24·0% (95% CI 23·1–24·9) of the households. The availability of ORS was higher when a child aged <5 years was present in the household (46·8 vs. 20·4%, P<10−4) and in small towns (<20 000 inhabitants) compared to larger cities (27·1 vs. 23·0%, P=10−4).
In order to evaluate the impact of the length of recall period, we calculated AG incidence with onset of symptoms within 1 week before the interview. This incidence was estimated at 0·60 cases/person-year (95% CI 0·48–0·73) and was significantly higher than the incidence estimated with a recall period of 4 weeks (P<10−4).
DISCUSSION
Our results indicate that there are 0·33 episodes of AG per person/year, which, generalized to the French population, suggests more than 21 million episodes and 7 million medical consultations each year in France. Generally there is one episode of AG every 3 person-years. This frequency is lowest in the elderly and highest in children aged <5 years who experience an episode of AG every 16 months.
The description of healthcare-seeking behaviour for AG in the French population allows a more accurate interpretation of the data derived from existing provider-based AG surveillance systems. One out of every three cases consulted a physician for their illness, essentially the GP; only 0·16% of the cases went to a hospital emergency department. Cases with a long duration of illness and young children were more likely to consult. It was estimated that a stool sample was requested for 7·7% of cases who consulted a physician. These results indicate the magnitude of underestimation of the true burden of AG via provider-based and laboratory-based surveillance systems. In addition, there is an underrepresentation of cases aged 30–64 years in provider-based surveillance systems since this age group seeks less medical care than the young and the elderly.
Limitations of this study are those common to other retrospective telephone surveys, in particular the refusal of households to respond, the non-inclusion of households with cell phones only, and potential recall bias. The response rate of 55·7% of our study is within the range of rates reported in similar surveys. A cell phone-only sample was not included because of the high cost. This may have resulted in an underrepresentation of young adults and particularly those living alone in urban areas. However, we used weighting to adjust for this potential non-coverage bias. A recall bias exists in our study as the incidence estimated with a recall period of 1 week is significantly higher than the incidence estimated with a recall period of 4 weeks.
The incidence rate of 0·33 episode/person-year is low compared to other retrospective telephone surveys in developed countries (ranging from 0·42 to 1·3 episodes/person-year) [Reference Gauci3–Reference Wheeler13], but higher than rates from prospective follow-up studies in England and Wales (0·19) [Reference Wheeler13] and The Netherlands (0·28) [Reference De Wit14]. However, study design and different case definitions have an impact on these results and need to be taken into account when comparing rates reported in other studies. The higher incidence rates based on recall rather than prospective follow-up may be due to recall bias, i.e. the tendency to ‘telescope’ illness events in the recent past. This telescoping effect may also contribute to the higher rates observed based on a 1-week recall period rather than a 4-week recall period, since the impact of this effect is likely to be higher over a shorter recall period. In order to improve comparability with studies in other countries, we used the case definition and 4-week recall period recommended by the International Collaboration on Enteric Disease ‘Burden of Illness’ Studies [Reference Majowicz2]. The exclusion rate due to non-infectious causes in our study is much higher than in most other studies; 46% of the episodes were excluded compared to 28·6% in New Zealand [Reference Adlam4], and 16% in Ontario [Reference Sargeant, Majowicz and Snelgrove15]. This high exclusion rate may be due to more restrictive exclusion criteria resulting in a lower estimate of the incidence of AG.
It is unlikely that the low incidence rate found in our study is due to a particularly mild AG winter outbreak in the 2009–2010 season, since the consultations for AG during the study period, estimated through the GP sentinel network, was slightly higher than over the same period in the last 5 years [16].
Despite differences in AG incidence, overall age and sex patterns were similar to those observed in other developed countries with the highest age-specific incidence in young children, the lowest in adults aged ⩾65 years and a higher incidence in females aged 30–64 years [Reference Adlam4, Reference Scallan10, Reference Majowicz, Horrocks and Bocking11]. The seasonality of AG with a peak of incidence during the winter is seen yearly in AG surveillance data in France as in other Northern Hemisphere countries.
The mean duration of illness (2·9 days) is at the lower end of the spectrum of reported results in other retrospective telephone surveys [Reference Gauci3, Reference Kuusi9, Reference Majowicz12]. The proportion of symptomatic cases at the time of interview (11·7%) is in the range reported by other countries (7–18%) [Reference Gauci3–Reference Ho5]. Similarly, the proportion of cases with respiratory symptoms (36·3%) was similar to those observed in other developed countries with rates ranging from 29% to 47% [Reference Hall17]. These cases were younger and had a longer duration of illness than cases who did not report concomitant respiratory symptoms. These characteristics (age, duration of illness) were also associated with a higher consultation rate. However, the presence of respiratory symptoms was not independently associated with a higher consultation rate in the multivariable analysis.
The proportion of cases that consulted a physician (33%) was higher than the proportions observed in other developed countries, e.g. Ireland (19·5%) [Reference Scallan10], Norway (17%) [Reference Kuusi9], New Zealand (22%) [Reference Adlam4] and USA (19·5%) [Reference Jones8]. Similar consultation rates were reported in 2010 during two large waterborne outbreaks in France (32·5% and 37·0%, respectively; source InVS, unpublished data). The estimated proportion of AG cases that used medication (76·3%) is also higher than reported in other developed countries, especially the proportion of cases that used the family medicine chest as source of medication (41·9%). These differences may be due to characteristics of the French healthcare system (high number of GPs per population, high coverage of the social security system) and their impact on healthcare-seeking behaviour.
In recent years, health education messages in France have focused on the importance of hand washing to avoid secondary transmission of AG and ORS for the prevention of dehydration. Part of the French population appears to be aware of this risk for transmission and dehydration since almost half of the cases aged >14 years stated they washed their hands more often than usual while they were sick, and 24% of the households stated having ORS available. Further educational efforts may contribute to reduce the burden of AG in the community.
CONCLUSION
AG causes a significant burden of illness in the French population and is a frequent cause for consultation. Actual GP, laboratory and hospital-based surveillance systems underestimate this burden as one out of every three cases consulted a GP, a stool sample was requested for one out of every 40 cases and <1 out of every 100 cases attended hospital.
ACKNOWLEDGEMENTS
The authors thank all individuals interviewed for the survey. This project was funded by the French Institute for Public Health Surveillance.
DECLARATION OF INTEREST
None.


