INTRODUCTION
Acute haemorrhagic conjunctivitis (AHC), commonly caused by enterovirus 70 and coxsackievirus A24, is a highly contagious infectious disease characterized by the rapid onset of ocular pain, eyelid swelling, a foreign body sensation, and excessively red eyes [Reference Sklar1, Reference Wright2]. AHC outbreaks often occur in schools during summer and autumn [Reference Kishore3–Reference Yan5], with quick dissemination, high transmissibility, and a short incubation period [Reference Wright2]. Since the first reported outbreak of AHC in China in 1971 [Reference Mu6], outbreaks of AHC have been reported regularly [Reference Wu4, Reference Yan5, Reference Meng7, Reference Mu8]. This could significantly interfere with daily life and the provision of education in schools. Currently, there is no known treatment for AHC; therefore, control measures, including isolation and school closure, are often implemented during an AHC outbreak. Isolation effectively controls the spread of infectious diseases [Reference Shen9–Reference Zhang and Wang11], and school closure is considered effective for preventing the spread of influenza [Reference Heymann12, Reference Copeland13]; however, some studies have shown that school closures might only slightly reduce the cumulative infection rate [Reference Cauchemez14–Reference Kawano and Kakehashi16]. Therefore, controversy remains regarding the effectiveness of school closures. Limited research has been conducted regarding the comparative effectiveness of control measures for AHC [Reference Chen17], and the quantitative effectiveness of these measures remains unclear. A list of optimized control measures for AHC outbreaks is urgently needed to assist public health departments in China to develop policies.
Dynamic models, such as the susceptible-infected-recovered (SIR) model that successfully simulates the prevalence of infectious diseases [Reference Chen18, Reference Chen and Liu19], have been used to evaluate the efficacy of preventive and control measures for infectious diseases. Thus, the main objectives of this study were to build a SIR model to simulate the control of the AHC outbreaks that occurred between 2004 and 2015 in schools in Changsha city, to simulate the transmission dynamics of AHC, to quantitatively assess the efficacy of control measures (isolation, school closure, and combined interventions), and to provide a reference for AHC control strategies.
METHODS
Data collection
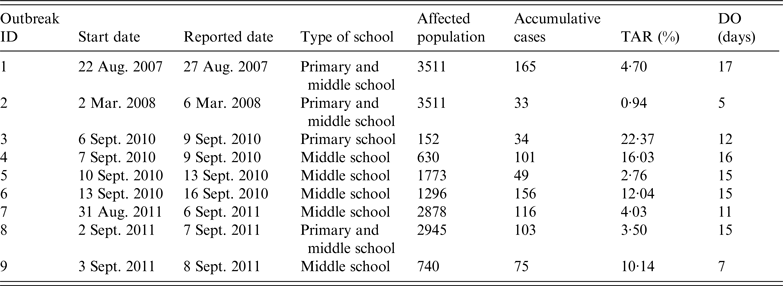
Data on AHC outbreaks were downloaded from the China Information System for Disease Control and Prevention, which is a web-based reporting system of national notifiable infectious diseases and public health emergencies. We collected information on all outbreaks reported from 1 January 2004 to 31 December 2015, in Changsha, China; data on nine AHC outbreaks occurring in schools were collected (Table 1). The data included the type of school (primary, middle, high school), school population, dates when the outbreaks were reported, and date of symptom onset for all cases. The AHC cases were confirmed to meet the WS 217–2008 diagnostic criteria for AHC [20]; AHC cases were diagnosed clinically based on a history of infectious agent exposure and characteristic findings, such as sudden onset of ocular pain, foreign body sensation, conjunctival hyperaemia, chemosis, and subconjunctival haemorrhages.
Table 1. Characteristics of nine acute haemorrhagic conjunctivitis outbreaks in Changsha city, China, 2004–2015

TAR, Total attack rate; DO, duration from illness onset date of the index case to illness onset date of the last case.
Outbreaks are listed in chronological order.
Modelling AHC without an intervention
A SIR model [Reference Kermack and McKendrick21, Reference Hethcote22] was built to simulate the normal transmission of outbreaks in schools, that is, without intervention. The SIR model [Reference Mu6, Reference Meng7] divides the population into three categories of individuals according to disease status (Fig. 1): susceptible (S), infected (I), and recovered (R). It assumes that a certain proportion of individuals move between the categories because of infection or recovery, or for other reasons. Several assumptions were built into the formulation of our SIR model based on the characteristics of AHC disease [Reference Wright2] and previous studies [Reference Chen18, Reference Chen and Liu19]. First, births, deaths, and migrations were omitted from the SIR model, since the AHC outbreaks usually occurred in student populations in which birth, death, and migration were negligible. Second, every individual in the population was assumed to have an equal probability of contracting the disease, β (the contact or infection rate of the disease). Therefore, the number of new infections was βSI at time t. Third, given the short incubation period of AHC, its impact on disease transmission was insignificant; therefore, the incubation period was ignored in our equations [Reference Chen18, Reference Chen and Liu19]. Fourth, since the fatality rate of AHC is low and asymptomatic infection is rare [Reference Waterman23, Reference Reeves24], these were both ignored. Fifth, a number equal to the fraction of infected individuals (γ, which represents the mean recovery rate, or 1/γ the mean infective period) leaving per unit time to the recovered category (the number of newly recovered individuals) was γI at time t. The final SIR model is given by the following equations:
 $$\left. \matrix{dS/dt = {\rm} - \beta SI, \hfill \cr dI/dt = \beta SI\gamma - \gamma I, \hfill \cr dR/dt = \gamma I, \hfill} \right\}$$
where dS/dt, dI/dt, and dR/dt denote the number of individuals (n) at time t in the corresponding categories.

Fig. 1. Dynamic acute haemorrhagic conjunctivitis transmission model.
Counter-measures
The interventions for controlling a viral infectious disease outbreak include pharmaceutical (typically antiviral agents and vaccination) and non-pharmaceutical (isolation and school closure) interventions. Unfortunately, there is no vaccine or antiviral treatment for AHC. Hence, for AHC outbreaks, the quantitative and effective interventions are likely to be isolation and school closure. The stage at which isolation is implemented and the duration of school closure are important. According to the natural history of AHC, the duration from illness onset to recovery is 7–10 days. Under these circumstances, we evaluated the effectiveness of isolation in different stages according to the actual epidemic curve and based on individual outbreaks, such as days 2, 4, 6, and 8 in outbreak number 4; different durations of school closure (3, 6, or 9 days); and different combinations of the two interventions.
Case isolation modelling
When isolation was added to the SIR model at time t (t = π), we assumed that strict isolation would be adopted once the infected individual was identified; subsequently, the infected individual, who left the infected category to enter the recovered class, was not infectious. Therefore, β was equal to zero after isolation. Thus, the function of parameter β along with time was as follows:
where π is the initial time (days) of isolation. In our study, we simulated different scenarios when isolation was implemented at different stages. For example, in outbreak number 4, isolation was implemented on days 2, 4, 6, and 8; thus, π = 2, 4, 6, and 8, respectively.
In addition, the effective implementation of case isolation required supplementary measures, including disinfection of the environment that was contaminated by the isolated case, inspection of all healthy persons, and instituting a class absence. Therefore, case isolation in model (2) was a package that included supplementary measures.
School closure modelling
During a school closure, all staff and pupils return home. Person-to-person contact is severed, and β = 0. Once the school closure interval is complete, the school population returns, and the transmission mode reverts to the SIR model. In this case, the function of parameter β along with time is as follows:
 $$f\,(\beta ) = \left\{ {\matrix{ {\beta,} & \!\!\!\!\!\!\!\!\!\!\!\!{(t \lt \pi _1)} \cr {0,} & {(\pi _1 \le t \le \pi _2)} \cr {\beta,} & \!\!\!\!\!\!\!\!\!\!\!\!{(t \gt \pi _2)} \cr}} \right.$$
where π 1 (days) is the initial date of the school closure, π 2 (days) is the end of the school closure, and Δπ = π 1 – π 2 (days) is the interval of the school closure. We simulated school closures of 3, 6, and 9 days; therefore, Δπ = 3, 6, and 9.
Modelling combinations of the intervention strategies
For all of the school outbreaks, we simulated combinations of interventions of case isolation and school closure to examine their impact on the efficacy of outbreak control: (i) isolation implemented at different stages according to the epidemic curve (days 2, 4, 6, or 8) relative to the outbreak and (ii) school closures of 3, 6, or 9 days, where school closure and isolation were implemented on the same day.
Parameter estimation
In the SIR model, there were two parameters: β and γ. There is currently no known treatment for AHC, and the viral infection generally resolves spontaneously. Given that the infectious period of AHC is 7–10 days, 8 days were selected as the average infectious period [Reference Chen18]; thus, γ was 0·125. β values for the nine school outbreaks were generated by curve fitting of the SIR model and reported data.
Effective reproduction number
In epidemiological models, the effective reproduction number (R eff), which quantifies the transmission potential of a disease, is an important quantitative parameter that determines whether an epidemic occurs (R eff > 1) or if the disease simply dies out (R eff < 1) [Reference Xu and Zhang25]. R eff equals the average number of secondary infections caused by a single infected person during his/her entire infectious period in a wholly susceptible population. In the SIR model, the effective reproduction number is:
where S (t) denotes susceptible individuals at time t. R eff was divided into two parts (R unc and R con) before and after the intervention, where R unc and R con represent the uncontrolled and controlled effective reproduction numbers, respectively.
Intervention assessment
The total attack rate (TAR), duration of outbreak (DO, duration in days from index case to last case), and number of peak cases were used to assess the effectiveness of the outbreak control interventions. Epidemic curves were compared to evaluate the effectiveness of using the containing strategies compared with using no intervention and with the actual strategies implemented by the health departments and schools.
Simulation methods
We fitted the data from the nine outbreaks to a SIR model curve to estimate β of each outbreak. β was further divided into two parts (β unc and β con) when simulating the reported data, where β unc and β con represent the infection rate before and after the intervention, respectively. β = β unc was adopted as a baseline outbreak to simulate the effects of case isolation, school closure, and combined interventions in all nine outbreaks. Berkeley Madonna 8.3.18 (www.berkeleymadonna.com/download.html) and Microsoft Office Excel 2003 (Microsoft Corp., USA) software were employed for model simulation and figures. The fourth-order Runge–Kutta method, with tolerance set at 0·001, was used to perform curve fitting. While the curve fitting is in progress, Berkeley Madonna displays the root mean square deviation between the data and best run so far. The coefficient of determination (R 2) from the reported and model data was used to judge the goodness of fit.
RESULTS
Characteristics of AHC outbreaks
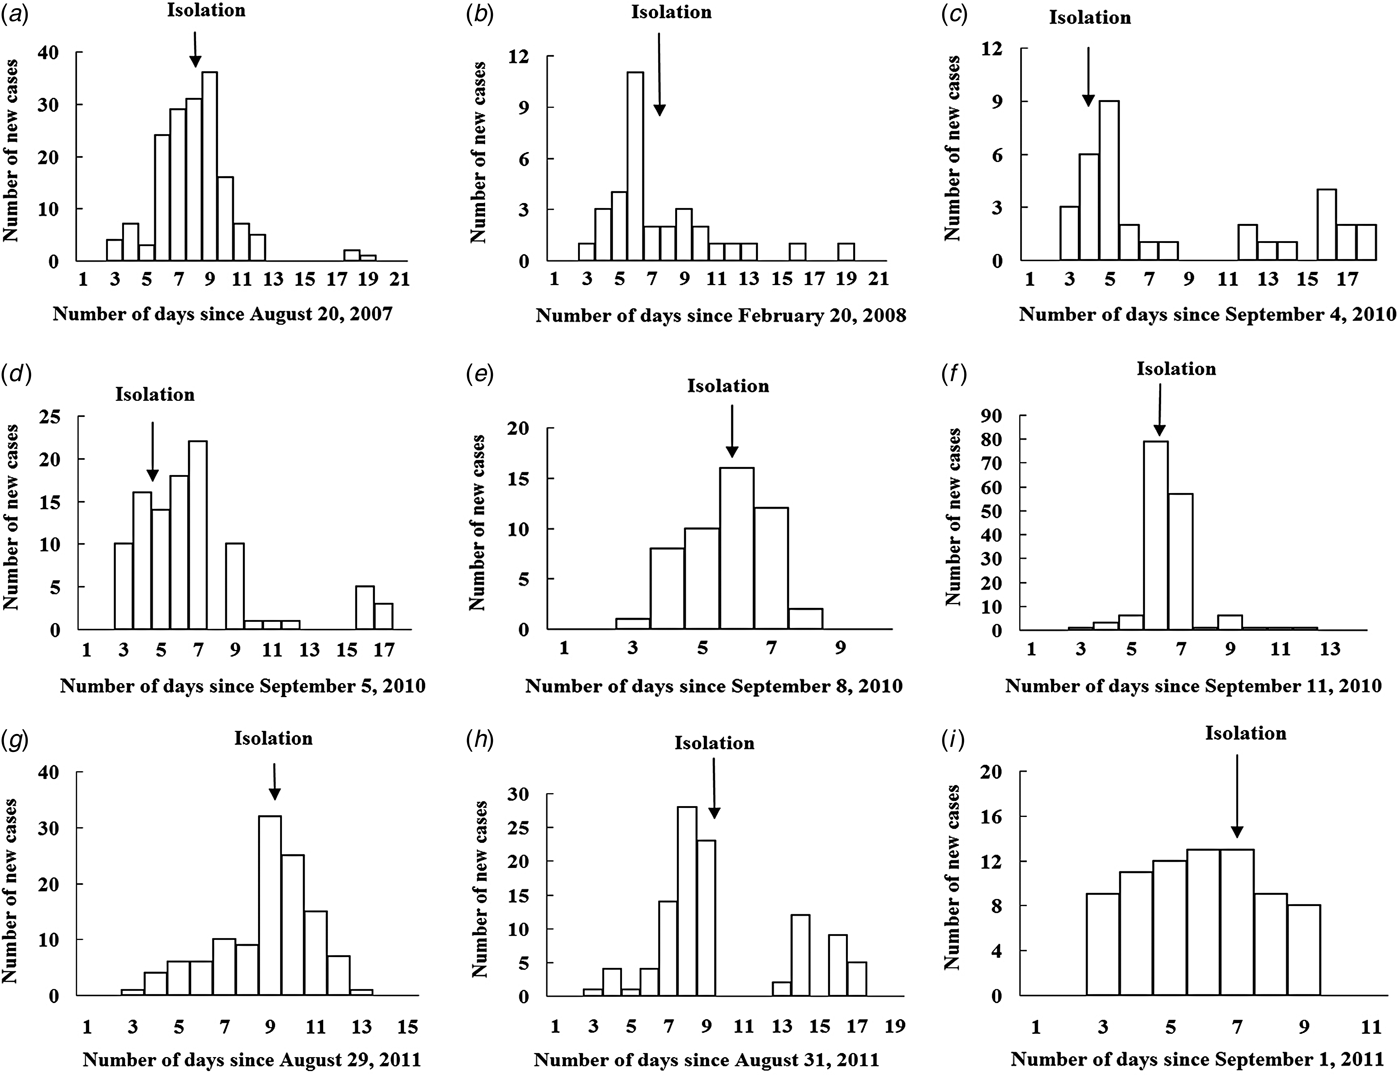
There were nine outbreaks in of AHC in Changsha city between 2004 and 2015. Two were reported in 2007/2008, and seven were reported in 2010/2011. About 88·9% of the outbreaks were reported during autumn, especially in September (66·7%). All outbreaks occurred in schools, most of which were middle schools. Of the 17 436 individuals affected in all nine school outbreaks, 832 were infected, with an average TAR of 4·77% (range 0·94–22·37%). The mean DO was 13 days (range 5–17 days) (Table 1). In these nine outbreaks, isolation was the main outbreak intervention (Fig. 2).

Fig. 2. Temporal distribution of new acute haemorrhagic conjunctivitis cases in nine outbreaks. Panels (a)–(i) represent outbreaks 1–9, respectively.
Results of curve fitting
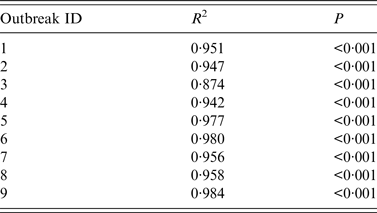
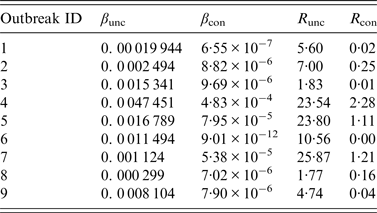
The results of curve fitting of the reported data and SIR models with or without isolation showed that the simulated results agreed well with the reported data (Fig. 3), and the R 2 ranged from 0·874 to 0·984 (P < 0·001) (Table 2). The relative transmission rates β unc, β con, R unc, and R con are summarized in Table 3. The median R unc of the nine outbreaks was 7·00 (range 1·77–25·87); the median R con of the nine outbreaks was 0·16 (range 0·00–2·28).

Fig. 3. Curve fitting of reported data and SIR models with or without isolation. Panels (a)–(i) represent outbreaks 1–9, respectively. The red line represents the SIR model with no intervention that was employed for curve fitting for the days before the local Centers for Disease Control investigated and implemented an isolation strategy, and the green line depicts a SIR model with isolation that was employed for curve fitting for the days thereafter. Prevalence, i = I/N, where I is the number of infectious individuals and N is the total number of persons.
Table 2. Coefficient of determination (R2) of nine acute haemorrhagic conjunctivitis outbreaks in Changsha city, China, 2004–2015

Outbreaks are listed in chronological order.
Table 3. Results of curve fitting and the effective reproduction numbers of nine acute haemorrhagic conjunctivitis outbreaks in Changsha city, China, 2004–2015

R unc, Effective reproduction number (uncontrolled); R con, effective reproduction number (controlled).
Outbreaks are listed in chronological order.
SIR without intervention
The simulation results showed that the number of cases increased heading into the peak, then decreased until no cases existed, indicating that the outbreak was complete. In the absence of any intervention, almost all students and staff would be infected during the outbreaks, yielding TARs ranging from 98·98% to 99·94% (Fig. 4A) and DOs ranging from 53 to 83 days (Fig. 4B).

Fig. 4. Effectiveness of different intervention strategies displayed by part (A) total attack rates (TARs), part (B) duration of outbreaks (DOs), and part (C) number of peak cases. Panels (a)–(i) represent outbreaks 1–9, with R 0 = 5·60, 7·00, 1·83, 23·54, 23·80, 10·56, 25·87, 1·77, and 4·74, respectively. The TARs, DOs, and number of peak cases are plotted on the vertical axis. Intervention strategies are listed on the horizontal axis. To show the effectiveness of different isolation strategies, the outbreak was divided into three stages (early, middle, and late) before the peak. N, No intervention; I1/I2/I3, isolation implemented in the early/middle/late stage, respectively; C1/C2/C3, school closure for 3, 6, or 9 days, respectively (beginning on day 3 for all outbreaks).
Case isolation
The SIR model designed to simulate the effects of isolation on different days of the outbreaks demonstrated that the number of cases dropped dramatically after isolation was implemented: the earlier isolation was adopted, the lower the morbidity peak, and the smaller the TAR. The curves were almost the same as those without intervention when the interventions were implemented close to or after the peak, with similar TARs and DOs. Therefore, earlier isolation resulted in greater efficacy of outbreak control (Figs 4, 5).

Fig. 5. Effectiveness of different isolation strategies during acute haemorrhagic conjunctivitis outbreaks. Panels (a)–(i) represent outbreaks 1–9, respectively. Isolations were implemented before the peak of each outbreak, for which three to four kinds of isolation strategies were employed. The colour-coded curves indicate the prevalence according to different strategies. Prevalence, i = I/N, where I is the number of infectious individuals and N is the total number of persons.
School closure
School closure occurred on day 3 of all of the outbreaks, and the SIR model was used to simulate the effects of school closure for 3, 6, or 9 days. Figure 6 shows that the infections declined once school closure occurred, but they gradually resumed heading into the peaks (about 80–100% of the peak with no intervention). Three instances of school closure had the same TARs, which were almost the same as that of no intervention (TARs close to 100%) (Fig. 4A), but had different peak times and DOs (Figs 4B and 6). With longer school closures, the peak time was delayed further, and the DOs were longer.

Fig. 6. Effectiveness of different school closure strategies during acute haemorrhagic conjunctivitis outbreaks. Panels (a)–(i) represent outbreaks 1–9, respectively. Three kinds of school closure strategies were implemented for each outbreak. The colour-coded curves represent the prevalence according to different strategies. Prevalence, i = I/N, where I is the number of infectious individuals and N is the total number of persons.
Combined intervention
According to the mechanism of our mathematical model, β was equal to zero after isolation or during the period of school closure. Therefore, models that consisted of isolation and school closure were the same as the models with isolation scenarios. The simulation results demonstrated that the curves of the combined intervention strategies were the same as the corresponding isolation measures employed alone.
DISCUSSION
The present findings have several public health implications. First, the basic reproduction numbers of AHC outbreaks in schools were estimated for the first time in China using all of the reported outbreak data for a large city. The simulation results from the SIR modelling showed that the mean R unc of the nine outbreaks in Changsha city was 7·00 and that all susceptible individuals would be infected during the outbreaks, demonstrating that outbreaks could spread quickly. Second, the effectiveness of the interventions (case isolation, school closure, and combined strategies) was quantified by our models. An isolation programme could be an effective primary intervention during AHC outbreaks in schools, as the number of cases dropped markedly after isolation. However, the effects of isolation varied depending on the timing of the intervention; the TARs were higher, and DOs were longer with later implementation of isolation. Therefore, earlier isolation results in more effective outbreak control. The optimal time to undertake isolation measures is within the first 5 days of an outbreak, when the outbreak is developing relatively slowly. Third, the results of our models indicate that school closure is not recommended. Although the number of cases decreased once school closure was implemented, similar to isolation, cases increased when school closure was reversed. Moreover, the curve and TARs were similar to those of no intervention, and longer school closures resulted in longer DOs. Therefore, school closure only prolongs the DO, delays the peak of an outbreak, and has little effect on controlling the spread of an AHC outbreak. Furthermore, the curves of the combined strategies were the same as those of the corresponding isolation measures. In many countries, school closure, a non-pharmaceutical intervention, is a key component of plans to mitigate the effects of infectious disease epidemics. Although school closure reduces the effect of an epidemic [Reference Halder26, Reference Davis27], the disease may spread to communities or other schools due to an increase in social activities outside of school [Reference Luo28]. Moreover, the primary caregivers of children tend to work to earn an income. Thus, school closure may result in economic loss and other detrimental effects. A study conducted in England suggested that a week of school closure could cost 0·2–1·2 billion pounds, and a 12-week school closure could decrease GDP by 1·0% [Reference Sadique29]. In addition, Liu et al. [Reference Liu30] found that primary- and middle-school students in affected areas displayed infection-related phobias and emotional disturbance during the closure. Therefore, for AHC outbreaks, isolation, but not school closure, might be recommended, particularly given the severity of the disease.
Until recently, there were no clear regulations on whether an AHC outbreak should be reported as a public health emergency. The Chinese public health emergency reporting system was initiated in 2004 to record outbreaks of infectious diseases identified by local epidemiologists. For instance, hand, foot, and mouth disease (HFMD) or mumps should be reported to the public health emergency reporting system when at least 10 HFMD or mumps cases occur within 1 week in the same setting, such as a village, community district, nursery, or school [31, 32]. Similar to HFMD and mumps, AHC is a Class C infectious disease in China and is unlikely to cause severe symptoms; however, it is very contagious, with an R unc of 7·00. For example, if 10 cases occurred in a school without any control measures, 70 new cases would occur during the entire infection period of the initial 10 cases; similarly, 140 cases would be infected by an initial 20 cases, without taking into account secondary infections. Therefore, a greater number of cases results in longer outbreak durations and a greater negative effect on the school. Given the characteristics of AHC outbreaks and their influence on daily life, AHC should be reported to the public health emergency reporting system in China based on the same criteria as HFMD and mumps.
Of note, our study has the following limitations. First, the models did not consider the incubation period or asymptomatic infections. Although the incubation period of AHC is extremely short, and the proportion of individuals with asymptomatic infection is very low, omitting them from the model may have slightly affected the simulated data. Second, it was difficult to estimate the 95% confidence intervals for R unc and R con in our model, which may have had minor effects on the results. Third, we modelled a theoretical isolation and did not consider all actual interventions; therefore, differences remained between the simulation and the actual outbreak. However, our model did quantitatively reflect an actual outbreak.
ACKNOWLEDGEMENTS
We thank Heng Zhang, Yaman Li, Weihong Hu, Yelan Li, and Zhiyu Wang from the Office for Disease Control and Emergency Response, Changsha Center for Disease Control and Prevention for their helpful advice.
DECLARATION OF INTEREST
None.


