INTRODUCTION
Health-care workers (HCWs) are recognized as a high-risk group for tuberculosis (TB) infection [Reference Menzies, Joshi and Pai1], and measures to control TB infection in health-care settings including evaluation of incidence of TB infection are considered essential. Screening for TB infection has generally been performed using the tuberculin skin test (TST), but specificity of the TST is compromised by BCG vaccination [Reference Huebner, Schein and Bass2]. Recently, the interferon-gamma (IFN-γ) release assays (IGRAs) using M. tuberculosis (Mtb) antigens encoded within the RD1 region of Mtb genome have been developed, and since the RD1 region is absent from all BCG substrains (and most non-tuberculous mycobacteria), these IGRAs are unaffected by prior BCG vaccination [Reference Lalvani3]. Therefore, there is now considerable interest in replacing the TST with an IGRA for the diagnosis of TB infection. One of these IGRAs, QuantiFERON®-TB Gold (QFT-G; Cellestis Inc., Australia), is currently approved as a diagnostic reagent in Japan and has been shown to detect both latent TB infection (LTBI) and active TB [Reference Rothel and Andersen4]. QFT-G has been recommended in the guidelines of the U.S. Centers for Disease Control and Prevention [Reference Jensen5] and the Japan TB Society [6], for monitoring TB infection in high-risk groups including HCWs.
We have previously demonstrated the usefulness of QFT-G for screening HCWs for infection [Reference Harada7]. However, in order to estimate the incidence of new TB infection in HCWs by conversion of QFT-G results, serial QFT-G tests are required. In this study, we performed serial QFT-G tests in HCWs from a hospital with isolation beds for TB to investigate the rates of conversions and reversions of the test in serial screenings.
MATERIALS AND METHOD
Subjects
Study subjects were HCWs who worked at Fukujuji Hospital between 2003 and 2007. Fukujuji Hospital has 370 beds including 60 beds for TB isolation (before 2006 there were 91 TB isolation beds). The average number of annual admissions of TB patients from 2003 to 2007 was 356, and 254 of them were sputum smear-positive. Four Fukujuji HCWs developed TB between 2000 and 2002; three culture-positive cases were diagnosed with specimens obtained by fibrebronchoscopy and one had tuberculous pleuritis. TB infection control procedures include screening of all symptomatic persons with X-ray and sputum examination, notification of TB cases to public health officials, educating staff about TB control activities, biannual regular chest X-ray of all staff and TST screening for LTBI. However, due to the high coverage of BCG vaccination and re-vaccination, about 70% of HCWs show an erythema of ⩾30 mm at their baseline test (which is roughly equivalent to an induration of ⩾15 mm) [Reference Kimura, Comstock and Mori8]. This high TST-positive rate effectively removes the possibility of HCWs being serially tested with TST. Infection control measures against nosocomial TB transmission were revised in 2000 to follow the U.S. CDC guidelines [9]; these changes included formation of an infection control committee, negative pressure isolation rooms and use of N95 respirators.
Serial QFT-G tests
Voluntary QFT-G tests were performed after consent from HCWs in February 2003, 2005, and 2007 and those who were examined twice or three times were included in this study. The QFT-G test was performed as previously described [Reference Harada7], and results were interpreted according to the manufacturer's instructions. A conversion was defined as a change from a negative to positive QFT-G result; a reversion occurred when a previously positive result was negative on retesting. The incidence of conversions and reversions were evaluated, along with analysis of potential relationships between test results with independent factors such as gender, age, occupation, and workplace. Those that showed positive in 2003, negative in 2005 and positive in 2007 were not included in the analysis of conversion.
Statistical analysis
The odds ratio (OR) including confidence interval (CI) was calculated for single-variable analysis and logistic regression was performed for multivariable logistic regression of proportions of conversion and reversions using SPSS software version 9 (SPSS Inc., USA). Trend analysis of IFN-γ production was done with linear regression. Increase and decrease of IFN-γ for each person was tested with Wilcoxon matched-pair signed-ranks test. P values <0·05 were considered as statistically significant.
Reproducibility of QFT-G test
To validate the reproducibility of the QFT-G test, eight samples were examined 48 times using five different lots of QFT-G kits (eight times for one lot of QFT-G kits). The mean, standard deviation (s.d.) and range were calculated for each sample.
RESULTS
Characteristics of HCWs
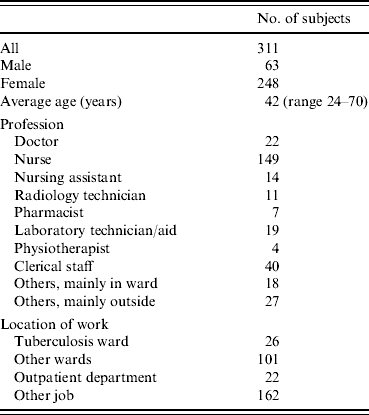
Of the 425 persons who were employed by Fukujuji Hospital in 2005, 406 were identified as working over a period covering at least two of the three testing points in 2003–2007; 311 employees (77%) were tested two or more times with QFT-G. Demographic information, job and workplace within the hospital of these subjects are shown in Table 1. Since 2003, the duration of HCWs working at the hospital ranged from 6 months to 35 years with a median of 7 years. No HCWs developed active TB and no HCWs were treated for LTBI during the study period. The following analysis was done using these 311 persons.
Table 1. Age, sex, job and workplace of hospital workers studied
QFT-G conversion in serial testing and annual incidence of TB infection
Table 2 shows the conversion and reversion results. Overall, 283 HCWs who were negative on their first QFT-G test were followed for 848 person-years; five HCWs (1·8%) had a QFT-G conversion. Assuming QFT-G conversions were all attributable to true infection, this equated to an annual incidence of TB infection of 0·6/100 person-years (5/848) with a 95% CI of 0·2–1·4/100 person-years. Table 3 shows the risk factors for the conversion. Employees working in the TB isolation wards were more likely to have a positive QFT-G response (OR 8·6, 95% CI 1·4–54) compared to other employees even after adjusting for age and sex in multivariate analysis (P=0·014, Table 4). One person was indeterminate due to high background on all three occasions tested and this case was not included in the denominator of conversion or reversion.
Table 2. Response profile for all subjects
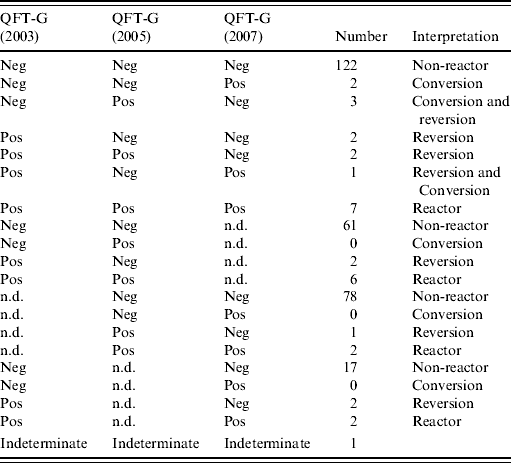
QFT-G, QuantiFERON®-TB Gold test; Neg, negative; Pos, positive; n.d., not done.
Table 3. Number, proportion, and annual incidence of conversion in QFT-G negative hospital staff
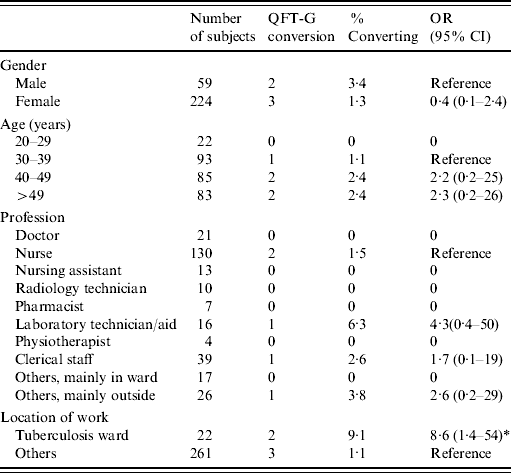
QFT-G, QuantiFERON®-TB Gold test; OR, odds ratio; CI, confidence interval.
n.s., Not significant.
* Elevated odds ratio, although not reaching significance at the 95% level.
Table 4. Multiple logistic regression of risk factor for QFT-G conversion
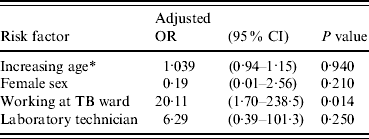
QFT-G, QuantiFERON®-TB Gold test; OR, odds ratio; CI, confidence interval.
* Age was analysed as a continuous variable.
For those originally QFT-G-positive persons, negative trend was found (linear regression coefficient −0·378, s.e.=0·175, P<0·05). The Wilcoxon rank sum test showed that more persons reverted than converted when 2003 and 2005 test results (z 0=4·922, P<0·05) or 2003 and 2007 test results (z 0=3·897, P<0·05) were compared, but not when 2005 and 2007 test results were compared (z 0=0·005, not significant).
QFT-G reversion in serial QFT-G tests
Thirty-one HCWs with a positive QFT-G result and repeat testing were followed for a total of 88 person-years; 13 HCWs (41%) had a QFT-G reversion. This equated to an annual incidence of reversion of 15/100 person-years (13/88) with a 95% CI of 8·1–24/100 person-years.
Level of responses for those HCWs with QFT-G conversion or reversion
An examination of the magnitude of changes in IFN-γ responses in the QFT-G assay for those subjects with conversion or reversion is shown in Table 5, and Figures 1 and 2. The highest change of IFN-γ response in the QFT-G assay for the five people who converted to positive was 0·60 IU/ml (range 0·13–0·60), much lower than the median response of >2 IU/ml for those who were QFT-G positive at each testing point. Interestingly, two persons whose increase was >0·35 IU/ml were both working at the TB ward. Similarly the changes in IFN-γ response for those people with reversion were all <1 IU/ml with the exception of two individuals (2·12 and 1·51 IU/ml), and all IFN-γ values obtained after reversion were higher than the median response for those HCWs negative at each testing point.
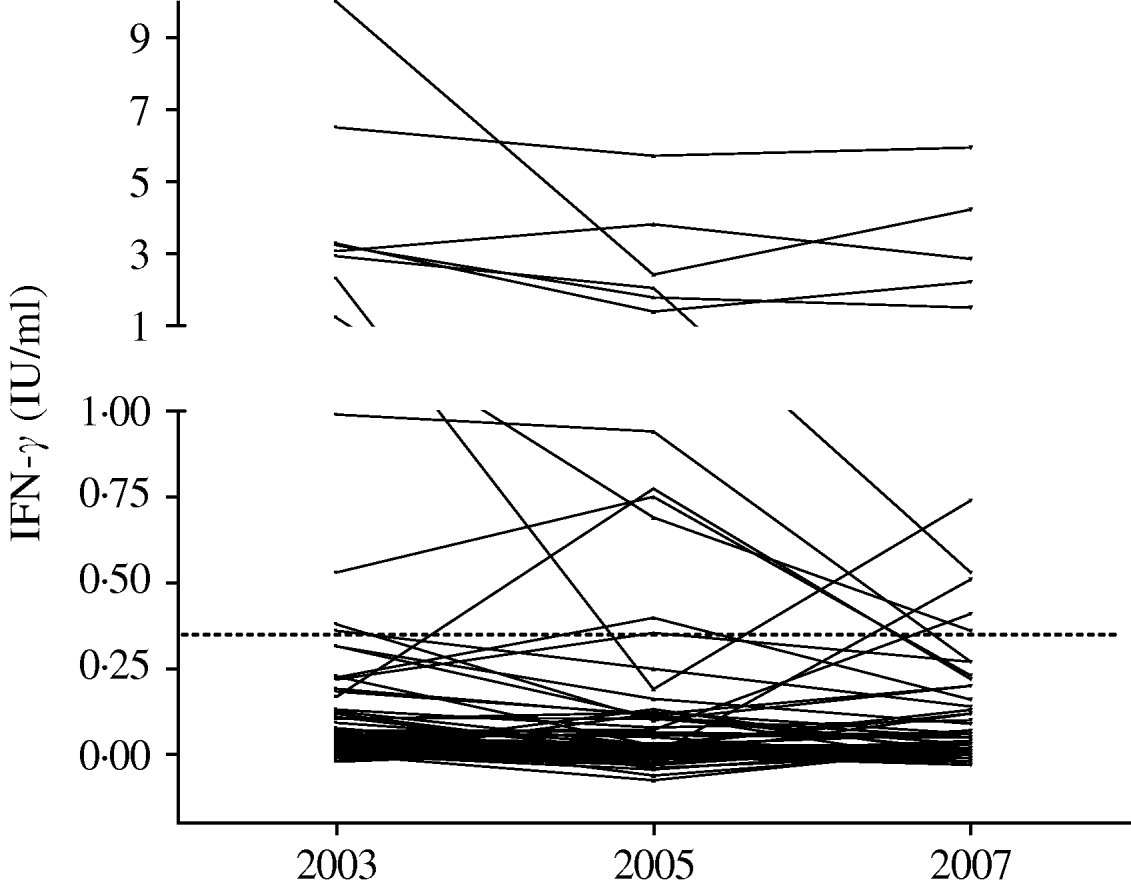
Fig. 1. QuantiFERON®-TB Gold responses for the 139 hospital workers tested three times. The dotted line represents the cut-off for the test (0·35 IU/ml).
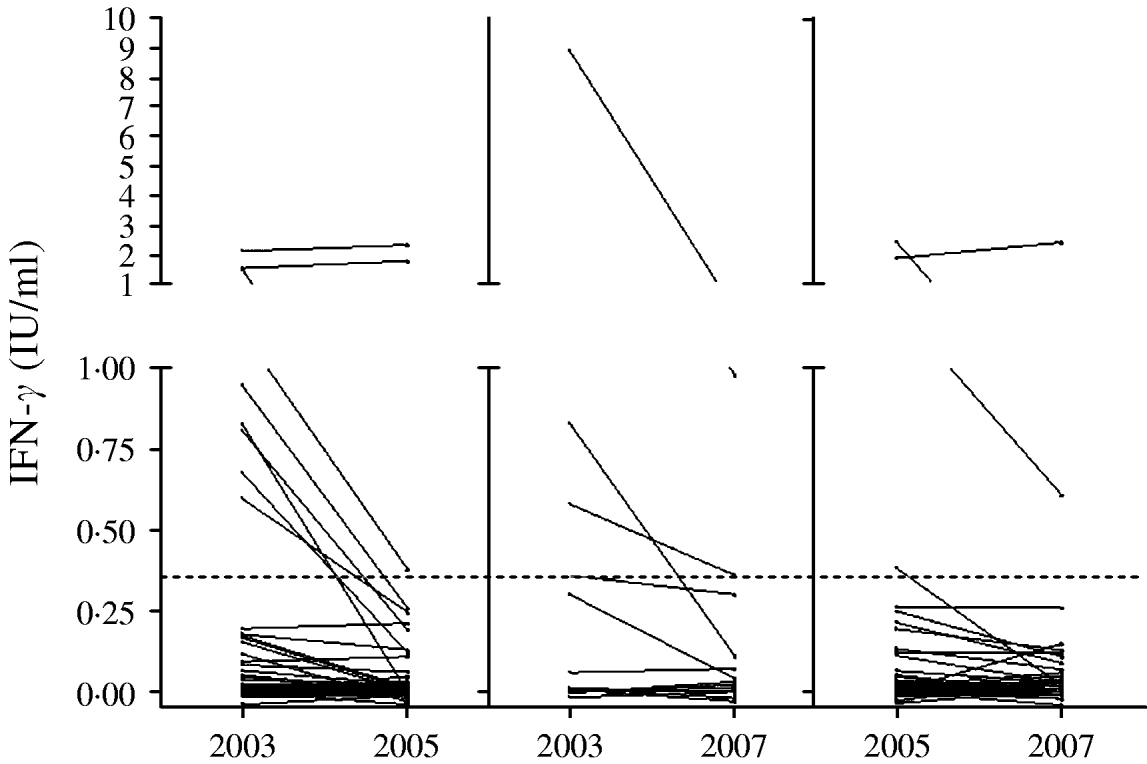
Fig. 2. QuantiFERON®-TB Gold responses for those subjects who were tested on two occasions. Left: 2003 and 2005 (n=69); middle: 2003 and 2007 (n=21); right: 2005 and 2007 (n=81). The dotted line represents the test's cut-off.
Table 5. Changes of IFN-γ responses (IU/ml)

QFT-G, QuantiFERON®-TB Gold test; n.a., not applicable; n.d., not done.
QFT-G, positive reactions are underlined.
Reproducibility test of QFT-G
Table 6 shows that the mean, s.d. and range of reproducibility test of QFT-G. samples with low IFN-γ levels have smaller s.d., but the ratio of s.d. to mean was smaller in samples with higher IFN-γ levels. For those on the borderline of positive and negative, the ratio of s.d. to mean was 0·20.
Table 6. Reproducibility test of QFT-G (48 times examination for each sample)
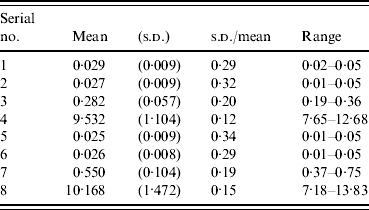
QFT-G, QuantiFERON®-TB Gold test; s.d., Standard deviation.
DISCUSSION
If we assume that all people who converted to a positive QFT-G result were truly infected with Mtb, the incidence of new TB infection in our hospital was 0·6/100 person-years, almost 10 times higher than the estimated incidence of infection (0·07/100 person-years) for the general population in Japan [Reference Aoki10]. It is unclear if the Mtb infection rates found at Fukujuji Hospital are representative of those in other, similar hospitals in Japan. However, the incidence of TB is high in nurses in Japan [Reference Ohmori11] and our findings are in accord with those from several developed countries estimating the incidence of TB infection in HCWs as between 0·2 and 3·3/100 person-years [Reference Menzies, Joshi and Pai1]. A limitation of this study, and indeed a limitation of other studies investigating the use of serial IGRA testing, is the lack of definitions for what constitutes a conversion or reversion. We chose to follow the CDC-recommended approach of a conversion consisting of a change from a negative to a positive QFT-G response [Reference Jensen5]. Similarly, we chose to define a reversion as a change from positive to negative. As seen for other studies of serial IGRA testing, we observed a number of conversions and reversions [Reference Pai12–Reference Perry16]. There are two main factors likely to be associated with variability in serial IGRA testing, those technical and those biological. Considering the generic variability of the ELISA system used to measure IFN-γ production in the QFT-G test and the single defined QFT-G cut-off of 0·35 IU/ml, it is obvious that small variations will occur between assays and may result in apparent conversion or reversion for those with responses close to the cut-off. In addition, the QFT-G test involves a whole-blood incubation step and factors such as time to, and/or duration of, blood culture after blood collection may also cause variability in response for those close to the cut-off. Veerapathran et al. [Reference Veerapathran17] discussed that increases of >16% in IFN-γ levels are statistically improbable from their short-term repeated tests. Our result shows wider range of variation on repeated testing.
Biological variability might be expected between tests conducted some time apart. Immune responses are not static and would be expected to alter with time and infection status. It has also been suggested that QFT-G responses may correlate with mycobacterial load [Reference Andersen18], and the test responses might be expected to alter as the association between an individual's immune response and their Mtb infection alters. Mori and colleagues suggested that QFT-G responses wane with time in people who have presumably cleared their infection without chemotherapy [Reference Mori19]. Clearance of Mtb infection as a result of chemotherapy or natural immunity will result in loss of the ESAT-6 and CFP-10 required for maintaining the specific immune response and thus result in a likely loss of QFT-G responses with time. This may be the reason for at least some of the observed reversions of QFT-G responses and the tendency for IFN-γ responses to decline in our study.
It is difficult to determine what factors among infection, technical variability and biological viability were responsible for the QFT-G conversions and reversions seen in our study without a gold standard for LTBI. The increase of IFN-γ responses were relatively small in converters and the proportion of reversion was high. As similar observations of transient QFT conversion were recently reported by Perry et al. [Reference Perry16], care should be taken when interpreting conversion or reversion of QFT-G test results especially for those close to the cut-off value. A recent study suggested that the prognostic value of QFT for progression to active TB is high and appears to be associated with stronger responses [Reference Diel20]. Similarly, Higuchi and colleagues recently demonstrated that subjects with high levels of IFN-γ production in response to Mtb-specific antigens in the QFT-G test have a higher possibility of developing active TB than QFT-G-positive subjects with lower levels of IFN-γ [Reference Higuchi21]. Although these findings are very promising, further validation is required.
To minimize non-specific variability, several definitions for conversion have been proposed. Pai et al. [Reference Pai12] proposed two criteria for conversion in the QFT-G In-Tube (QFT-IT) assay; (1) ‘baseline IFN-γ <0·35 IU/ml and follow-up IFN-γ ⩾0·70 IU/ml’ and (2) ‘baseline IFN-γ <0·35 IU/ml and an absolute increase of at least 0·35 IU/ml over the baseline value’. The first criterion would have identified only one person as a converter, and the second criterion would have identified two HCWs. Interestingly, and in support of the second criterion, these two HCWs were those that had the significant risk of working in a TB ward. If we adopt Pai's second criteria as representative of true conversion and thus recent infection, the incidence of new TB infection in our hospital would be 0·2/100 person-years (2/848 person-years). Veerapathran et al. [Reference Veerapathran17] have proposed for a conversion that there is: (1) change from negative to positive result and (2) at least 30% increase in the baseline IFN-γ value. With these criteria, our results did not differ from the CDC definition of conversion. Pai et al. [Reference Pai22] also proposed that a person whose IFN-γ result increased from <0·20 and exceeded 0·50 IU/ml on the repeat test was considered to have a ‘true conversion’. This criterion would result in identification of the same two conversion cases as Pai's first criterion. If we utilize the definition of conversion as a person whose IFN-γ result increased from <0·10 to >0·35 IU/ml on the repeat testing [Reference Harada23], the number of converters would be two and the incidence of new TB infection would be 0·3/100 person-years (2/776 person-years). Another limitation of our study was the use of QFT-G, not QFT-IT which is more sensitive [Reference Harada24]. We used QFT-G because of the unavailability of QFT-IT in Japan and continuity of the tests.
In summary, incidence of TB infection in HCWs in Japan was 0·6/100 person-years and higher than for the general population. Mtb infection control measures should be maintained and strengthened at hospitals. Criteria for defining QFT-G conversion and reversion need to be further investigated, considering that a relatively small change of IFN-γ production results in conversions and reversions and the high proportion of reversion in converters.
ACKNOWLEDGEMENTS
The authors acknowledge the technical support with statistics of Mr Kazuhiro Uchimura, Research Institute of Tuberculosis. This study was supported by a grant for a ‘study for effective tuberculosis control, including a cost-benefit analysis of periodic health examination and BCG’ headed by Dr. Nobukatsu Ishikawa, among emerging and re-emerging infectious diseases grants from the Japanese Ministry of Health, Labor and Welfare (grant no. 17210601).
DECLARATION OF INTEREST
None.


