Introduction
Being infected with one sexually transmitted infection (STI) is a strong risk factor for contemporaneous and subsequent infection with another STI [Reference Rottingen, Cameron and Garnett1]. A large body of epidemiological evidence has, for example, demonstrated that a range of bacterial, eukaryotic and viral STIs are risk factors for HIV acquisition and transmission [Reference Rottingen, Cameron and Garnett1]. Numerous biological mechanisms support this association being causal: STIs can disrupt mucosae, recruit HIV target cells and increase HIV viral loads in plasma and genital secretions [Reference Fox and Fidler2]. These findings led to calls that improved STI management should constitute a crucial part of HIV control [Reference Grosskurth3].
Randomised controlled trials (RCTs) have, however, largely failed to show that improved STI control lowers HIV incidence. One review of this topic, for example, noted that only one of eight such RCTs showed an effect on HIV incidence and this was in a population with an unusually low HIV prevalence (for Eastern Africa) [Reference Gray and Wawer4].
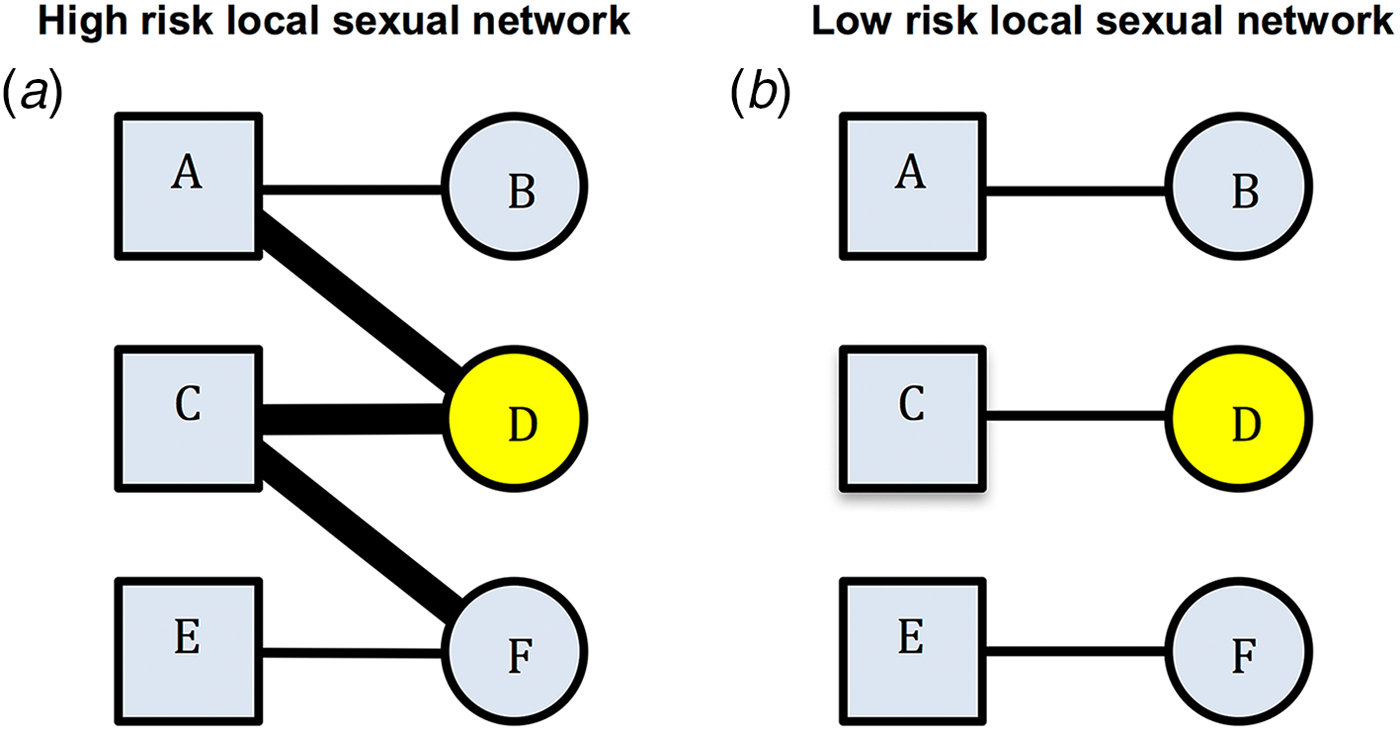
An alternative/complementary explanation for the association between past and incident STIs is residual behavioural confounding [Reference Gray and Wawer4–Reference Mertens, Hayes and Smith6]. The same behavioural risk factors apply (to differing extents) to all STIs and some of these risk factors are extremely difficult to control for [Reference Mertens, Hayes and Smith6]. Residual confounding may therefore explain part of the association between STIs. Certain local sexual networks (LSNs) can be characterised by high rates of partner concurrency (sexual relations with overlapping dates), partner change, age-mixing and low rates of circumcision and condom usage. Such a network would be considered as being a high-risk LSN (HR-LSN, Fig. 1a). A network without these risk factors would be considered as constituting a low-risk LSN. Of note, these characteristics depend on the behaviour of an individual's partners and their partners. This is illustrated in Figure 1. Here, individual B has the same risk behaviours in both the high-risk and the low-risk sexual network. However, B is at considerably higher risk for STI in the high-risk network due to the behaviour of her partner and his other partners. The edge-width, or width of the black bar connecting individuals, in Figure 1, is proportional to the risk of transmission of STIs between serodiscordant pairs. A wider bar signifies greater risk. This risk is determined by factors such as condom use and presence of other STIs such as herpes simplex virus-2 (HSV-2) and bacterial vaginosis (BV) [Reference Esber7]. Individuals in the HR-LSN have a more connected network and such networks have been shown to have a higher prevalence of BV and HSV-2 [Reference Kenyon8, Reference Kenyon9]. These in turn increase the probability of acquisition and transmission of other STIs [Reference Brotman5, Reference Esber7]. Previous studies have frequently assumed that the relationship between the prevalent BV/HSV-2 and any new STI was causal [Reference Brotman5, Reference Buve10, Reference Weiss11]; however, we hypothesise that the role of the HR-LSN has been overlooked in such studies [Reference Kenyon8, Reference Kenyon9]. Typically, studies are unable to adequately assess and therefore control for LSN [Reference Gray and Wawer4, Reference Mertens, Hayes and Smith6]. It may be that the LSN is offering a measureable amount of protection from incident STI and the protection is not solely derived from the vaginal microbiota. A focus on the LSN would open up new avenues for focused interventions.

Fig. 1. Comparison of high-risk (left) and low-risk (right) local sexual networks for individual B for acquisition of STIs. Individual D has STI A (yellow). The edge-width (width of the bar between individuals) is proportional to the risk of transmission of STIs between serodiscordant individuals (as defined by condom use, presence of BV, HSV-2, etc.). B's risk for acquisition of STI A is greater in the high- than the low-risk network despite no difference in her reported risk profile (excluding partner concurrency if this is asked for).
Establishing whether STI clustering at an individual level is best explained by biological enhancement (BE) or behavioural confounding/network structure has important consequences. If it is the former, then high STI prevalence populations require enhanced STI screening and treatment. If however the HR-LSN plays a dominant role, then enhanced screening and treatment may have lower impact on STI incidence whilst promoting the generation of antibiotic resistance [Reference Lewis12, Reference Kenyon, Osbak and Vandenbruane13]. In this paper, we assess the association between incident BV, Chlamydia trachomatis (CT), Neisseria gonorrhoeae (NG) and Trichomonas vaginalis (TV) and the presence of these infections at the prior visit in a longitudinal cohort of women. We then assess if this relationship remains after controlling for potential confounders including two markers of LSN (number of cumulative STIs and partner concurrency).
Methods
We performed a secondary data analysis of the Longitudinal Study of Vaginal Flora. The study recruited 3 620 15 44-year-old women between 1999 and 2003 when they presented for a routine health assessment at any one of 12 clinics in the Birmingham, Alabama area. Women were excluded if they were pregnant, had significant gynaecological or medical conditions, or were planning to leave the area in the upcoming 12 months. All participants provided informed consent and the study was approved by local Institutional Review Boards – for further details of study methodology please see [Reference Brotman14, Reference Klebanoff15].
Participants were seen at an initial visit, then every 3 months for a further four visits. At each visit they followed a structured interview and had vaginal and endocervical swabs collected at the time of pelvic examinations. The endocervical swabs were inoculated onto Thayer–Martin agar plates for culture of NG. The diagnosis of NG and CT was based on culture positivity or testing positive by Abbott LCx ligase chain reaction (Abbott Laboratories, Abbott Park, Illinois, USA). TV diagnosis was based on either culture (In-Pouch) or microscopic evidence of motile trichomonads. Vaginal smears were used to characterise BV via the Nugent method [Reference Nugent, Krohn and Hillier16]. BV was defined as a score of 7 or more. There is a considerable debate as to whether or not BV is an STI [Reference Brotman17]. A reasonable argument has been made that BV is best considered as a sexually associated dysbiosis [Reference Brotman17, Reference Bradshaw18]. We refer to BV as an ‘STI’ for brevity purposes in this paper. Women found positive for CT, NG, TV or BV were treated according to the CDC STI treatment guidelines at the time of the study (1999–2003) [Reference Workowski19]. The preferred therapy for CT was doxycycline or azithromycin and for NG was cefixime, ceftriaxone, ciprofloxacin or doxycycline. An alternative option for NG was ofloxacin plus azithromycin [Reference Workowski19]. The preferred therapy for BV was metronidazole 500 mg twice daily for 7 days or 2 g single dose, whereas for TV metronidazole, 2 g single dose was preferred and 500 mg twice a day for 7 days was the alternative choice. Due to the overlapping efficacy of the therapies for BV/TV and CT/NG (detailed above), we control for treatments of these pairs of infections in the preceding study period (Table 1).
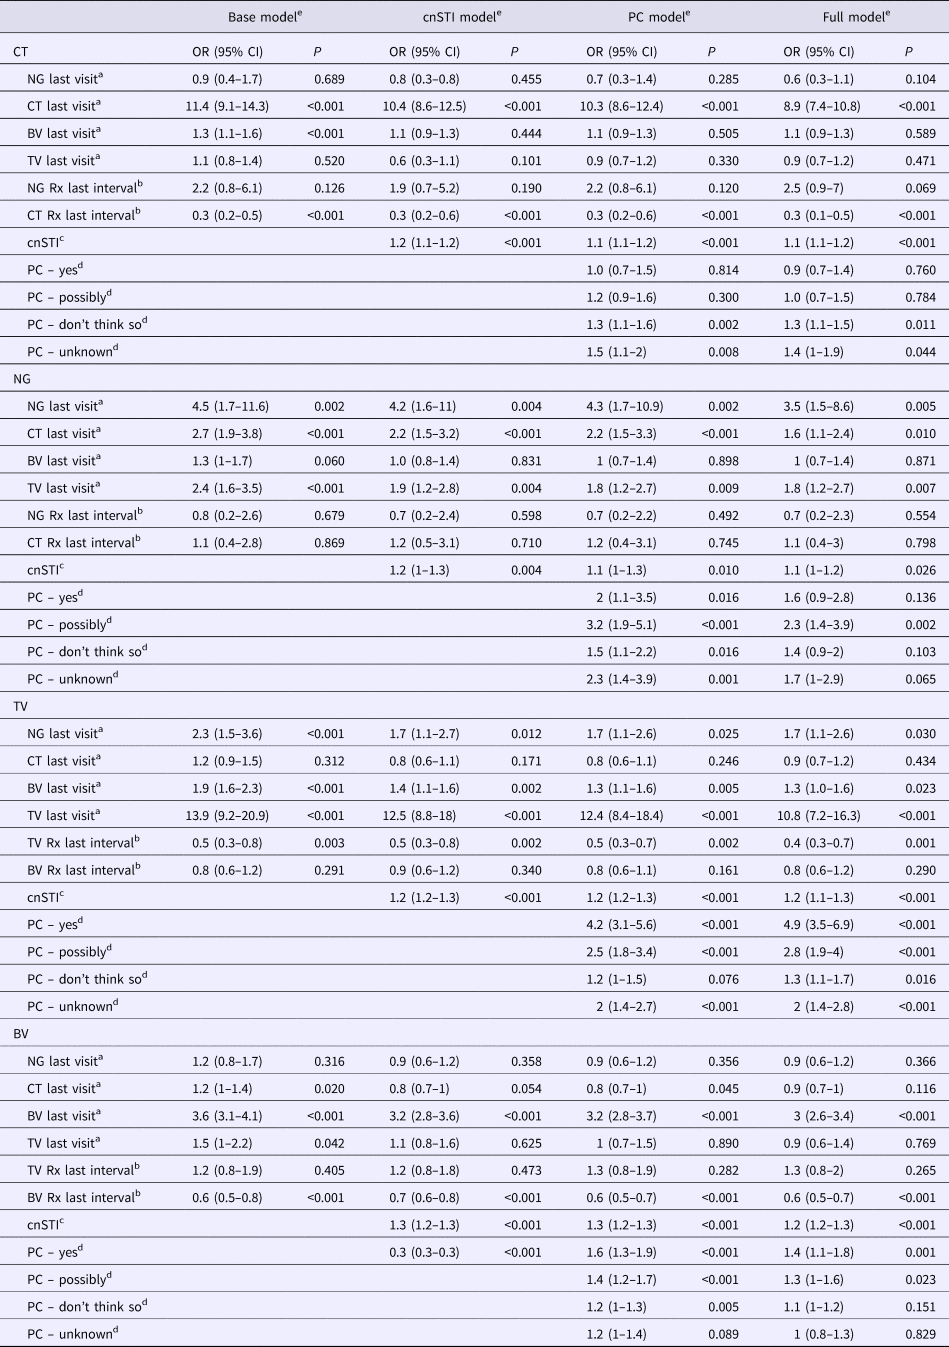
Table 1. Adjusted odds ratios for the presence of each STI at all visits given the presence of other STIs at the prior visit – mixed-effects logistic regression (adjusted odds ratios (95% confidence intervals))

cnSTI, cumulative number of STIs; PC, partner concurrency; BV, bacterial vaginosis; CT, Chlamydia trachomatis; NG, Neisseria gonorrhea; TV, Trichomonas vaginalis.
a This STI was present at the previous visit.
b STI treatment was issued for this STI in the last study interval.
c The cumulative number of STIs (NG, CT and TV) diagnosed prior to the current visit.
d Partner concurrency (PC) in the preceding study period. The reference group are those reporting no PC in the preceding period.
e The ‘base model’ controls for other STIs presence of other STIs at the previous visit and the ‘cnSTI model’ then adds the cumulative number of STIs the person was diagnosed with prior to the visit, the ‘PC model’ adds reported partner concurrency (PC) and the ‘full model’ adds a range of demographic and behavioural confounders – age (three categories), number of sex partners in the preceding study period (continuous variable), self-defined racial/ethnic group, reported receptive anal sex in the preceding study period, reported receptive oral sex in the preceding study period, frequency of vaginal sex per week in the preceding study period (three categories), frequency of condom use in the last study interval (three categories), education attained (three categories).
We use two indirect measures of the risk profile of the local sex network:
1. Partner concurrency. This refers to a woman reporting that her partner had another partner in the recent past. It is thus a measure of how connected one's partner is to others in the local network. This has been shown in a range of studies to be an independent predictor of incident STIs [Reference Potterat20–Reference Kenyon22]. This variable was defined based on the question: ‘Do you think that any of your sex partners had sex with anyone other than you in the past 6 months (baseline visit)/30 days (visits 2–5)?’ They were asked to choose between the following options which were read out to them: ‘yes, definitely’, ‘yes, possibly’, ‘do not think so’, ‘definitely not’. If they were unable to answer, the interviewer could classify their answer to this question ‘unknown’ or ‘refused to answer.’
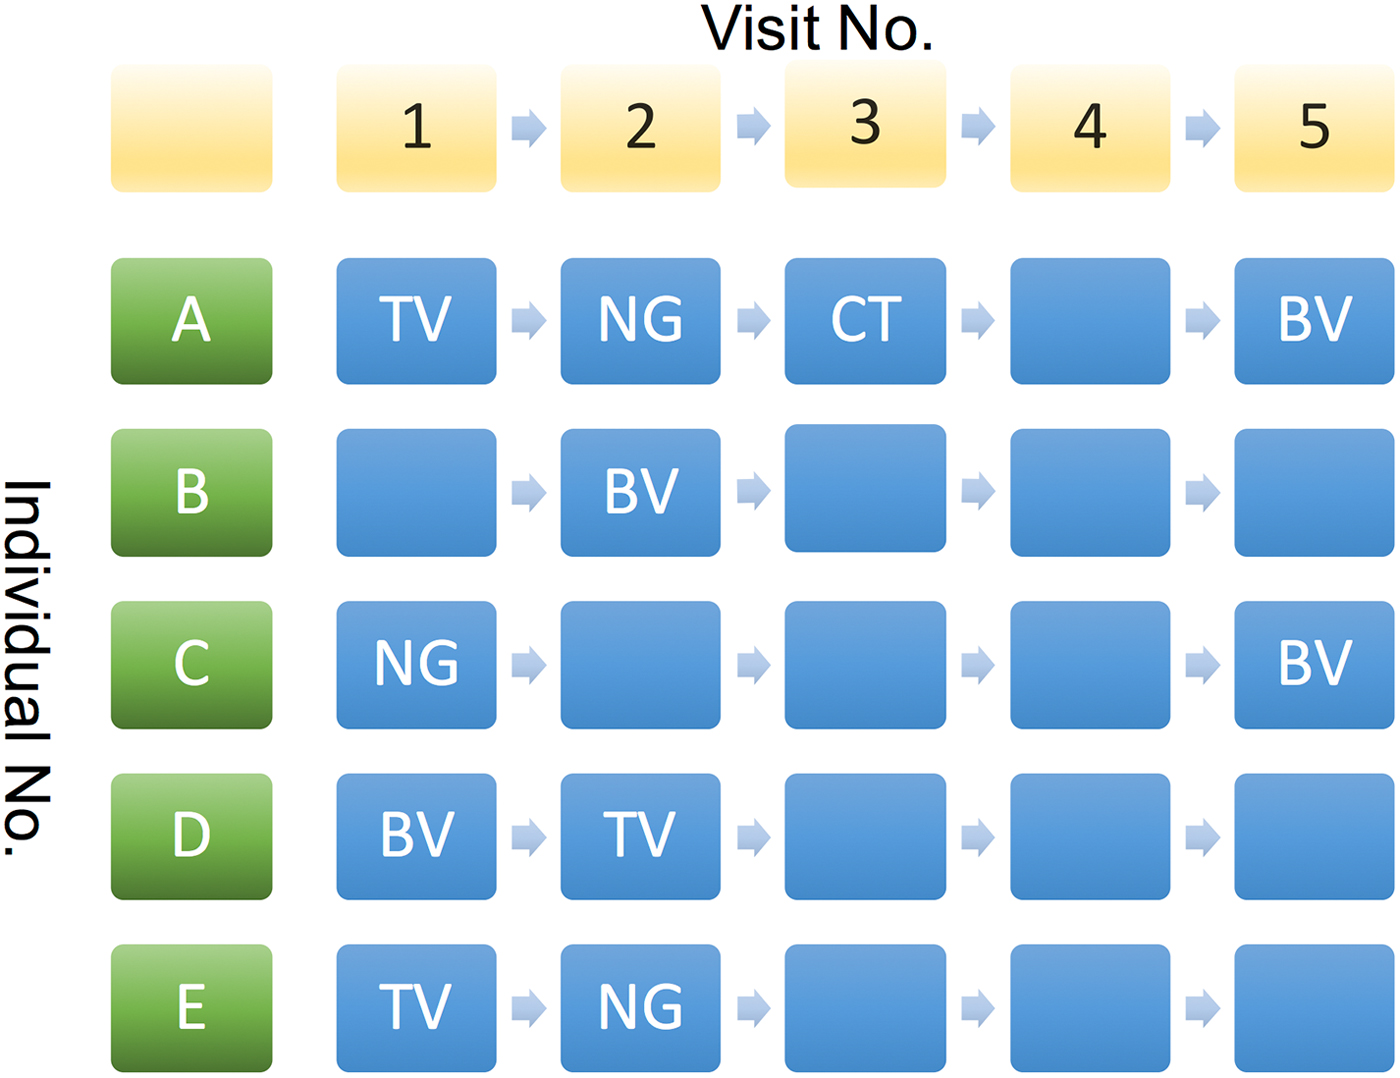
2. The cumulative number of STIs (cnSTI). This variable was constructed by summing the total number of episodes of NG, CT and TV each individual had been diagnosed with prior to each visit. This number can be construed as representing a composite indicator of exposure to the risk that includes the person's behaviour and that of those in their surrounding network. It may thus be used as an indirect measure of LSN. This is illustrated in Figure 2 where at visits 4 and 5, individual A has a cnSTI of 3 vs. 0 for individual B.

Fig. 2. Illustration of various possible sequences of STI diagnoses by visit number for study participants. See text for details.
We evaluate the relationship between incident STIs in two ways:
1. Controlling for cnSTI and PC: We use mixed-effects logistic regression models to assess the odds ratio for a diagnosis of NG, CT, TV or BV following a diagnosis of any of these four STIs at the prior visit, controlling for receipt of medication for these STIs (base models). The specific STI treatments that are controlled for are specified in Table 1. Additional models were then constructed to control for the cnSTIs (cnSTI models). The hypothesis tested in the cnSTI models was that if the association between STIs was due solely to BE, then the cnSTI variable should not be associated with incident STIs, because the presence of STI at the prior visit was controlled for. In the third set of models (PC models), we control for partner concurrency and then in the final models (full models) we, in addition, control for a range of demographic and behavioural confounders that were selected based on a literature review and biological plausibility. These variables are listed in Table 1.
2. Skip analysis: In this analysis, we compared the odds ratio for each of the 16 possible STI sequences (STI a, b, c or d followed by STI a, b, c or d) when the sequence did, and did not, involve contiguous visits. For each STI pair combination (e.g. STIa followed by STIb), we constructed mixed-effects logistic regression models with STIb as the outcome variable and STIa-at-the-last-visit and STIa-at-any-prior-visit-except-the-last-visit as the exposure variables.
We assumed that if we found an association between an STI from the current visit and an STI from any previous visit except for the last, then this association is best explained by behavioural confounding and not BE. Thus, if individual C in Figure 2 was successfully treated for NG at her first visit and tested negative for it at her subsequent three visits, then it is not plausible that NG could have enhanced her risk of acquisition of BV at visit 5.
Individuals were not censored after their first positive diagnosis and each woman could thus be diagnosed with each STI up to five times. Variables that measured the incidence were coded as missing for baseline visits, as we did not know if the person had that infection at a period 3 months prior to the baseline visit. Cases/intervals with missing data were dropped from the analyses. All analyses were done using Stata version 13. A P-value of <0.05 was considered statistically significant. All participants provided informed consent and the study was approved by local Institutional Review Boards (FLORA, 1999–2002). Secondary data analysis was approved by the Human Research Protections at the University of Maryland, Baltimore.
Results
In total, 3620 women participated in the study. They were young (mean age 25.3, standard deviation 6.95) and predominantly African-American (79.9%). More detailed descriptions of participant characteristics are available elsewhere [Reference Brotman5, Reference Brotman14].
Controlling for cnSTI and PC
Controlling for the presence of STI treatment since the previous visit (base models), the following associations were statistically significant: BV as a risk factor for CT (OR 1.3, 95% CI 1.1–1.6); CT (OR 2.7, 95% CI 1.9–3.8) and TV (OR 2.4, 95% CI 1.6–3.5) as risks for NG; BV (OR 1.9, 95% CI 1.6–2.3) and NG (OR 2.3, 95% CI 1.5–3.6) as risks for TV; and CT (OR 1.2, 95% CI 1.0–1.4) in addition to TV (OR 1.5, 95% CI 1.0–2.2) as risks for BV (Table 1; Supplementary Table S1).
In the cnSTI models, we, in addition, controlled for the cumulative number of STIs diagnosed. In the case of incident CT and BV, no other STIs were associated with these infections. CT and TV however remained risk factors for subsequent NG (CT: OR 2.2, 95% CI 1.5–3.2; TV: OR 1.9, 95% CI 1.2–2.8), as did BV for TV (OR 1.4, 95% CI 1.1–1.6). Interestingly, the cnSTI was a significant predictor of each incident STI (OR range: OR 1.2, 95% CI 1.0–1.2 to OR 1.3, 95% CI 1.2–1.3).
The addition of partner concurrency to the models (PC models) did not change the relationship between STIs found in the cnSTI models. Partner concurrency and cnSTI were significantly associated with each of the four incident STIs (partner concurrency: P-values <0.001 to 0.010; cnSTI: P-values <0.001 to 0.010; Table 1).
After controlling for the full range of demographic, biological and behavioural variables, cnSTI and partner concurrency remained associated with each of the four STIs (partner concurrency: P-values <0.001 to 0.040; cnSTI: P-values <0.001 to 0.026; Table 1). CT (OR 1.6, 95% CI 1.1–2.4) and TV (OR 1.8, 95% CI 1.2–2.7) were associated with incident NG and BV (OR 1.3, 95% CI 1.0–1.6) and NG (OR 1.7, 95% CI 1.1–2.6) with incident TV.
Skip analysis
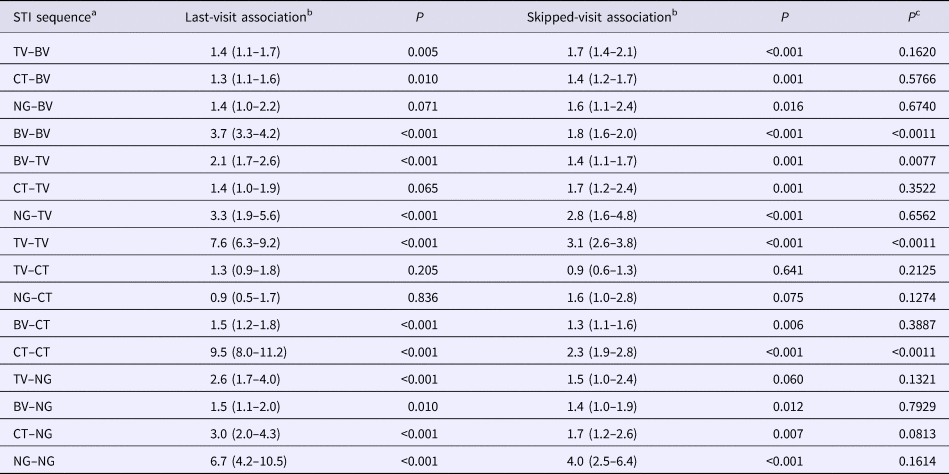
Out of the 16 STI pair sequences, 12 involved sequences between different STIs. When considering contiguous visits, in eight out of 12 of these STI pair comparisons, the first STI was associated with a significantly enhanced odds ratio of the second STI (Table 2). Considering skipped-visit associations, nine of 12 of the combinations were significantly positively associated. In only one of these 12 STI pairs was there a statistically significant difference in the strength of the odds ratio (BV followed by TV: last-visit association – OR 2.1 (95% CI 1.7–2.6), skipped-visit association – OR 1.4 (95% CI 1.1–1.7); P = 0.008; Table 2; Supplementary Table S2).
Table 2. Comparison of adjusted odds ratios for the presence of each STI at all visits given the presence of other STIs at the immediately prior visit (last-visit association) and at a prior visit excluding the immediately prior visit (skipped-visit association, mixed-effects logistic regression – adjusted odds ratios (95% confidence intervals))

a STI sequence: this refers to the ordering of the STIs being investigated. Thus, the sequence STIa–STIb is defined as STIa being present at a previous visit and STIb at the current visit.
b The ‘last-visit association’ refers to the association between the two STIs on the current and immediately prior visits, whereas the ‘skipped-visit association’ refers to the association between STIb at the current visit and STIa at a visit prior to the last visit.
c P value for comparison of OR of last-visit vs. skipped-visit association.
Discussion
We found evidence supportive of both the BE and behavioural confounding/sexual network hypotheses.
Evidence for BE
After controlling for a wide variety of demographic, behavioural and biological factors, CT and TV remained as risk factors for subsequent NG infection and BV and NG for TV infection. These findings are compatible with the BE hypothesis. However, our methods for evaluating residual behavioural confounding were somewhat crude in that they were based on one categorical self-reported measure, and thus it is possible that studies that are better able to capture the sexual network would find less BE.
Evidence for LSN connectivity
We also found evidence supportive of the LSN hypothesis that posits that more dense LSNs would generate a higher rate of initial and repeat infections of all STIs. Partner concurrency and cnSTI were the variables we used to measure the LSN effect. In each of the models where they were assessed, cnSTI and partner concurrency were positively associated with each of the incident STIs. These findings are consistent with the studies that found positive associations between partner concurrency and incident STIs [Reference Kenyon8, Reference Kenyon9, Reference Potterat20–Reference Kenyon23]. We further found that controlling for cnSTI reduced the number of STIs significantly associated with incident STIs from seven in base models to four in cnSTI model. Similarly, the association between skipped-visit STIs was positive in 9/12 vs. 8/12 pairs for last-visit STIs. In only one pair was the association significantly stronger in the last visit than the skipped-visit analysis. Taken together, these findings suggest that the strong associations between incident STIs cannot be explained solely by BE and that LSN structure plays an important role.
Detection of an STI at the immediately prior visit was a considerably stronger risk factor for the detection of the same STI at the current visit than detection of that STI at a more remote visit. Controlling for treatment received in the intervening period made little difference to the value of the odds ratios for the last-visit analysis. These results could be explained by persistent infection with low treatment rates or suboptimal treatment or by reinfection.
Previous studies have found that a previous diagnosis of an STI is a strong risk factor for a subsequent STI diagnosis [Reference Brotman5, Reference Weiss11]. As a result, guidelines are increasingly recommending enhanced STI prevention interventions for persons diagnosed with STIs: these range from commencing HIV pre-exposure prophylaxis to interval retesting to assess for reinfection [Reference Horner24, Reference Workowski and Bolan25]. Our findings build on these and suggest that including cumulative number of STIs and partner concurrency may enable better prediction of subsequent risk of STI. Our findings also complement those of others who have found that sexual network factors such as partner concurrency are important determinants of STI incidence at the level of individuals and populations [Reference Kenyon8, Reference Potterat20, Reference Ghani, Swinton and Garnett21].
Our analysis is limited in a number of ways. The women were tested every 3 months which may not be frequent enough to be able to detect fine-grained associations between incident STIs. The vaginal microbiota, for example, has been shown to be subject to rapid fluxes on a day-to-day basis in response to various known and unknown stimuli [Reference Ravel26]. The behavioural data are self-reported and therefore subject to well-described biases such as the respondent bias. We cannot rule out the possibility that the associations we found are determined by unmeasured confounders. Participants could give one of five answers to the partner concurrency question. In our multivariable analysis, those who answered ‘no’ to this question (i.e. that their partners had no other partners) were the reference group. Whilst all four STIs were positively associated with at least one of the four remaining answer, there was a variation in which the answer was associated with the STI (Table 2). Although we have no clear explanation for this result, other studies have found that reporting possible PC carries the same or a higher risk of HIV infection [Reference Helleringer, Mkandawire and Kohler27] and STI acquisition [Reference Kenyon23, Reference Drumright, Gorbach and Holmes28] as reporting definite PC. Our definition of PC depended on participant reporting which has been shown to be of varying accuracy [Reference Helleringer, Mkandawire and Kohler27, Reference Drumright, Gorbach and Holmes28]. It may thus have misclassified PC in a proportion of participants. This misclassification bias would, however, be expected to bias the outcome towards the null hypothesis. We have assumed that a skip-visit association is best explained by behavioural confounding. It is however possible that the first STI produces damage to the genital tract which then enhances the person's susceptibility to subsequent STIs. BV is not a conventional STI but rather a sexually associated polymicrobial infection that is influenced by a wide array of factors in addition to sexual risk factors [Reference Brotman17]. We did not control for all these non-sexual risk factors and thus cannot exclude the possibility of residual confounding. Finally, the study was conducted 15 years ago and the population was largely African-American. The results may therefore not be generalisable to other populations including contemporaneous populations.
As noted in the introduction, the close relationship between HR-LSN and the prevalence of various STIs means that an association between incident STIs should not be assumed to be causal. A reasonable case can be made to consider sexual network structure as an important determinant of the prevalence of BV, HSV-2, TV, CT and NG [Reference Kenyon8, Reference Kenyon9, Reference Potterat20, Reference Ghani, Swinton and Garnett21, Reference Kenyon and Hamilton29]. If the higher prevalence of HSV-2 and BV then enhances the susceptibility and transmission of the other STIs, then this effect is also indirectly a product of the HR-LSN and controlling for HSV-2/BV could be construed as a form of overcontrolling. Our results complement those from other studies that find that much of the clustering of STIs that occurs at individual and population levels is due to differences in LSN [Reference Kenyon22, Reference Morris30, Reference Kenyon, Osbak and Buyze31].
Future study designs that could more successfully disentangle these relationships would include longitudinal cohort studies that collect more complete sexual network data and include frequent STI testing.
Supplementary material
The supplementary material for this article can be found at https://doi.org/10.1017/S0950268818002157


