INTRODUCTION
A variety of mathematical and computational models have been proposed for elucidating the nonlinear transmission dynamics of epidemics and for enhancing our understanding of the spread of diseases and the immune responses that subsequently occur within the infected host [Reference Nowak and May1–Reference Van Kerkhove3]. To date, important results have been obtained from mathematical modelling of viral dynamics for human immunodeficiency [Reference Perelson4–Reference Nowak and Bangham6], hepatitis B [Reference Marchuk7, Reference Nowak8], hepatitis C [Reference Neumann9] and influenza viral infections [Reference Baccam10–Reference Chang and Young12].
The kinetics of the human influenza virus life-cycle is a complex process that involves many important factors, including the rate at which epithelial cells are produced and infected, and the rate at which viruses are produced from such epithelium. These said processes are influenced by intrinsic cellular dynamics and extrinsic immunological factors. Thus, computer simulation would be a valuable tool to assess the potential contribution and relative importance of each factor, especially when unexpected scenarios are difficult to replicate experimentally [Reference Baccam10, Reference Chang and Young12].
Modelling the dynamics of influenza virus infection has progressed significantly. Baccam et al. [Reference Baccam10] provided two models describing the kinetics of such infection in humans: a target cell-limited model and a target cell-limited model with delayed virus production. These authors used data from experimentally infected volunteers to estimate various parameters of the viral life-cycle using mathematical models. Their findings suggested that modelling with the target cell-limited model with delayed virus production was more realistic because infected cells began producing influenza virus for nearly 5 h. In addition, Chang & Young [Reference Chang and Young12] developed a model based on simple scaling laws as delineated by ordinary differential equations that describes the time-courses of the numbers of infectious viral particles, activated cytotoxic T-lymphocytes (CTLs), interferon (IFN) molecules, infected cells, uninfected cells, and the subset of uninfected cells that are protected from viral infection by IFN. They found that the rise time, duration, and the severity of influenza A infection could be expressed as a function of the initial viral load with relevant parameters based on the developed scaling laws.
A target cell-limited model with delayed virus production can also be incorporated with an indoor aerosol transmission model and a population dynamic susceptible-exposed-infective-recovery model to quantify the influenza infection risk in the human upper respiratory tract [Reference Chen13]. Chen et al. [Reference Chen13] revealed that the influenza infection risk in a school setting could be estimated appropriately by combining the viral kinetics and different exposure parameters with environmental factors.
Experimental viral infection of human influenza A can be utilized to investigate local and systemic cytokine responses during the infection period [Reference Hayden14], even after oral or intravenous neuraminidase inhibitor administration [Reference Hayden15–Reference Calfee18]. Different experimental trials have assessed dosing, formulation, and host responses on daily viral titre, viral shedding, peak titre, days of shedding, and clinical symptom scores. However, consideration of the variations in the selected coefficient from influenza infection data remains a major analytical challenge for validating viral dynamics models.
In the present work, for the practical aim of estimating system parameters from experimental infection data of human influenza, we sought to develop a mathematical model by combining the target cell-limited model with delayed virus production [Reference Baccam10] with a model that considers the effects of the immune response, including IFN and CTL factors [Reference Chang and Young12]. More importantly, this modified model was used to perform sensitive analysis and was validated with experimental infection data of human influenza A. We believe that such a framework could be incorporated explicitly into influenza control modelling schemes.
MATERIALS AND METHODS
Study data
Ten published experimental infection studies of human influenza A(H1N1) were used as the study data (see Table 1). Briefly, participants were inoculated intranasally (0·25 ml per nostril) with H1N1 on day 0 with a dose ranging from 104·5 to 107 of tissue culture infective dose (TCID50). The test age groups were healthy young men and women. The number of infected people ranged from eight to 59 with shedding durations ranging from 2 to 5·1 days. Nasal washings were collected before viral inoculation for the detection of virus infection and collected from days 0 to 8 for virus isolation.
Table 1. Summary of used experimental human influenza A(H1N1) infection data
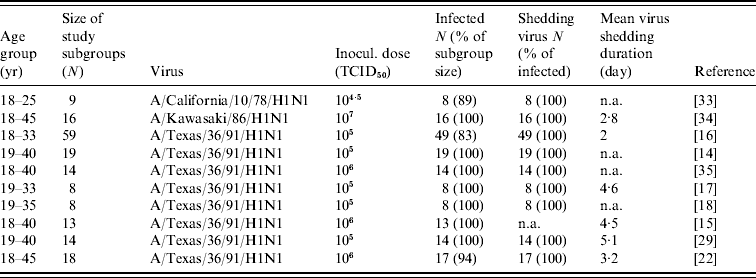
TCID50, Median tissue culture infective dose; N, sample size; n.a., not available.
The age groups, size of study subgroups, numbers of infected people, numbers of shed virus and shedding durations were all recorded. The main differences were found in inoculated dose, experimental sample size, and the mean virus shedding duration. For safety considerations, young and healthy men and women were used. Sex distinctions were deemed irrelevant. A high percentage of the subgroup became infected, and, of those infected, nearly 100% shed virus. Eight published studies used the same virus strain.
We estimated the daily-based average viral titres (log TCID50 ml−1) from the published study data from day 0 (time of inoculation) to day 8. Statistical analysis was performed using free virions from our modified viral dynamics model and daily-based average viral titres from the experimental influenza infections. Didger 4 software (Golden Software Inc., USA) was used for data collection from the published studies.
Model
Viral dynamics models have several assumptions [Reference Nowak and May1]: (1) uninfected cells encounter free virus, becoming infected cells; (2) the rate of production of new infected cells is proportional to the product of the density of uninfected cells multiplied by the density of free virions; (3) free virions are produced by infected cells; (4) uninfected cells, infected cells and free virions die at certain rates; and, (5) uninfected cells are constantly replaced by the system.
By studying a model of influenza viral dynamics that builds on past well-developed models [Reference Baccam10, Reference Chang and Young12], we explored the consequences of host–pathogen interactions at three levels: (a) the epithelial cell level; (b) the human immune response level (including the role of IFN and CTLs); and, (c) the virus level. The essential features of this model are depicted in Figure 1.
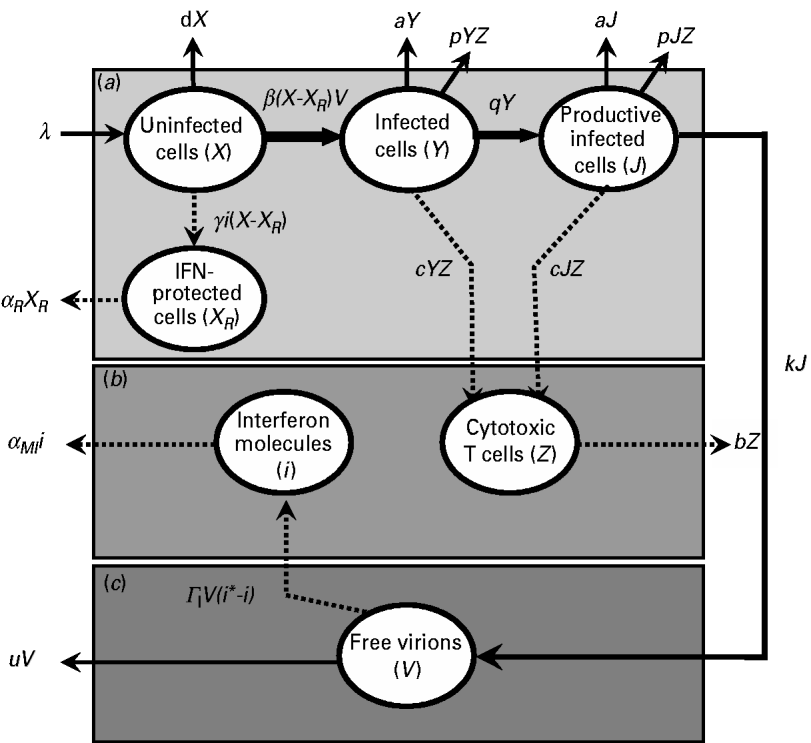
Fig. 1. Schematic representation showing the pathway interactions of influenza virus infecting human lung epithelial cells at: (a) the epithelial cell level; (b) the human immune response level; and (c) the virus level. The definition of symbols and their detailed descriptions are given in the text and Table 2.
Briefly, after influenza A virus infects epithelial cells, progeny virions are usually not detected for 6–8 h [Reference Baccam10]. This delay in the production of free virions can be modelled by defining two separate populations of infected epithelial cells: one population (Y) is infected but not yet producing virus and the second population (J) is actively producing virus, a so-called productive infection [Reference Baccam10]. Therefore, at the epithelial cell level (Fig. 1 a), uninfected cells (X) can be infected by free virions (V), becoming a cell population as defined by Y. After 6–8 h, following viral entry and replication, this epithelial population becomes capable of actively producing virions as defined by J.
The rate λ (d−1) is the equilibrium between the production rate of epithelial cells and their natural death at rate −dX. The conversion of uninfected to infected cells is defined by the rate −β(X−X R )V, where β (d−1 virion−1) represents the infection rate of an unprotected epithelial cell per virion and X R represents IFN-protected cells. The rate of change of population Y contains the same infection rate term, β(X−X R )V, and a decay term, −aY, due to viral cytolytic effects with a (d−1) representing the reciprocal of the infected epithelial cell's lifespan. An additional loss term, −pYZ, describes the action of CTLs with p (d−1 CTL−1) representing the rate of CTL-induced destruction of infected epithelial cells. The transition rate q (d−1) represents the transition from Y to J. Here, we assumed that a decay term –aJ represents viral cytolytic effects, and an additional loss term –pJZ represents the action of CTLs on the system. The transition rate k (d−1 infected cell−1) represents infected epithelial cells (J) that become capable of producing free virions (V). At the human immune response level (Fig. 1 b), CTLs (Z) can be induced and activated by Y and J. The rate of change of virus-specific CTLs contains a production rate, c(Y+J)Z, and a natural decay rate, −bZ, where c (d−1 infected cell−1) is the production rate of induced CTLs per infected epithelial cell, and b (d−1) is the reciprocal of the CTL lifespan. Uninfected epithelial cells (X) that become IFN-protected (X R ) are described by the production term γi(X−X R ), where γ (d−1 IFN−1) represents the rate constant for the induction of the IFN-induced anti-viral state. In addition, the term, −α R X R , with α R (d−1) representing the rate of IFN-protected epithelial cell decay, represents the natural decay term.
IFN cytokines, represented by the total number of IFN molecules, i, can protect cells (X R ) from becoming infected. The rate of change in the number of IFN molecules contains both a natural decay term, −α MI i, and a production term, &Ggr; I V(i*−i), which describes the virus-induced activation of IFN-producing macrophages. The term α MI (d−1) is the rate of loss of IFN-producing macrophages. The term &Ggr; I (d−1 virion−1) is the induction rate for IFN production. The term i* is the effective production rate number for IFN.
The present model used free virions in epithelial cells (V) to represent the virus level (Fig. 1 c). The term kJ describes the production of virions from infected cells at rate k, and the term –uV describes the natural decay of the virion at a rate u.
The system of ordinary differential equations corresponding to the model in Figure 1 and based on previous work are as follows [Reference Baccam10, Reference Chang and Young12]:
Model implementation
The definitions, symbols, input values, and expected physiological ranges of parameters in this influenza model are summarized in Table 2. The input parameters of biological characteristics were derived from experimentally infected volunteers [Reference Murphy19–Reference Beauchemin, Samuel and Tuszynski21]. The physiological ranges for individual differences could also be estimated.
Table 2. Definition, symbols, input values, and expected physiological ranges of parameters in the modified influenza virus dynamic model
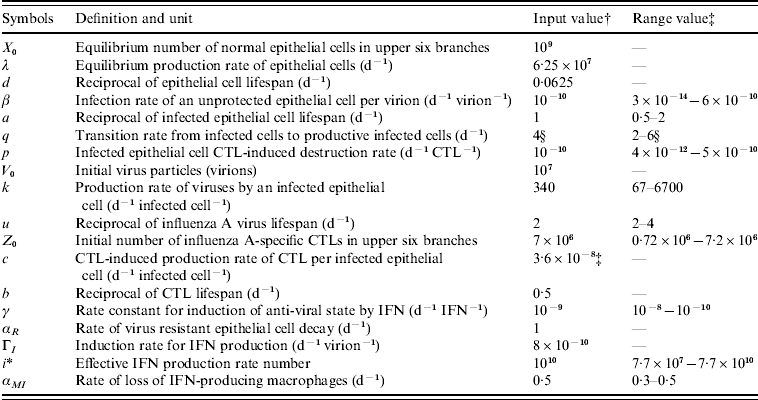
CTL, Cytotoxic T-lymphocyte; IFN, interferon.
† Adopted from Murphy et al. [Reference Murphy19] (cited in Chang & Young [Reference Chang and Young12]).
‡ All of the estimated physiological ranges shown are based on the parameter estimates in Bocharov & Romanyukha [Reference Bocharov and Romanyukha20], except for the value of c which was directly obtained from Beauchemin et al. [Reference Beauchemin, Samuel and Tuszynski21].
§ Adopted from Baccam et al. [Reference Baccam10].
To identify the most significant sensitive parameters in our model, we performed a sensitivity analysis for four parameters involving production rates λ and k with infection rate β and transition rate q, respectively. This quantitative analysis can show robustness of the effects of free virion dynamics when model assumptions are made and when key parameters are varied. The sensitivity analysis was performed by varying the key production and destruction rates of λ, q, k, and β, ranging from 0 to 6·57×107 d−1, 2–6 d−1, 67–6700 d−1 infected cell−1, and 3×10⁻¹⁴ to 6×10⁻¹⁰ d−1 virion−1, respectively. Model validation was also performed based on the selected study data. Here we used a coefficient of determination (r 2) and P values as the quantitative criterion for the model validation. Model simulations were performed using Berkeley Madonna 8.0.1 (as developed by Robert Macey and George Oster of the University of California at Berkeley).
RESULTS
Influenza viral dynamics
We found that uninfected cells (X) decreased in number from the initial values of 109 cells by virtue of free virion infection whereas IFN-protected cells (X R ) increased rapidly at days 2–3 and reached a peak value of 8·2×108 cells at day 3·4, showing an 89% protection by IFN at this time-point (Fig. 2 a). On the other hand, the peak values of non-productive infected cells (Y) and productive infected cells (J) occurred at days 2·5 and 7 with 9·55×106 cells and 3·54×107 cells, respectively (Fig. 2 a).
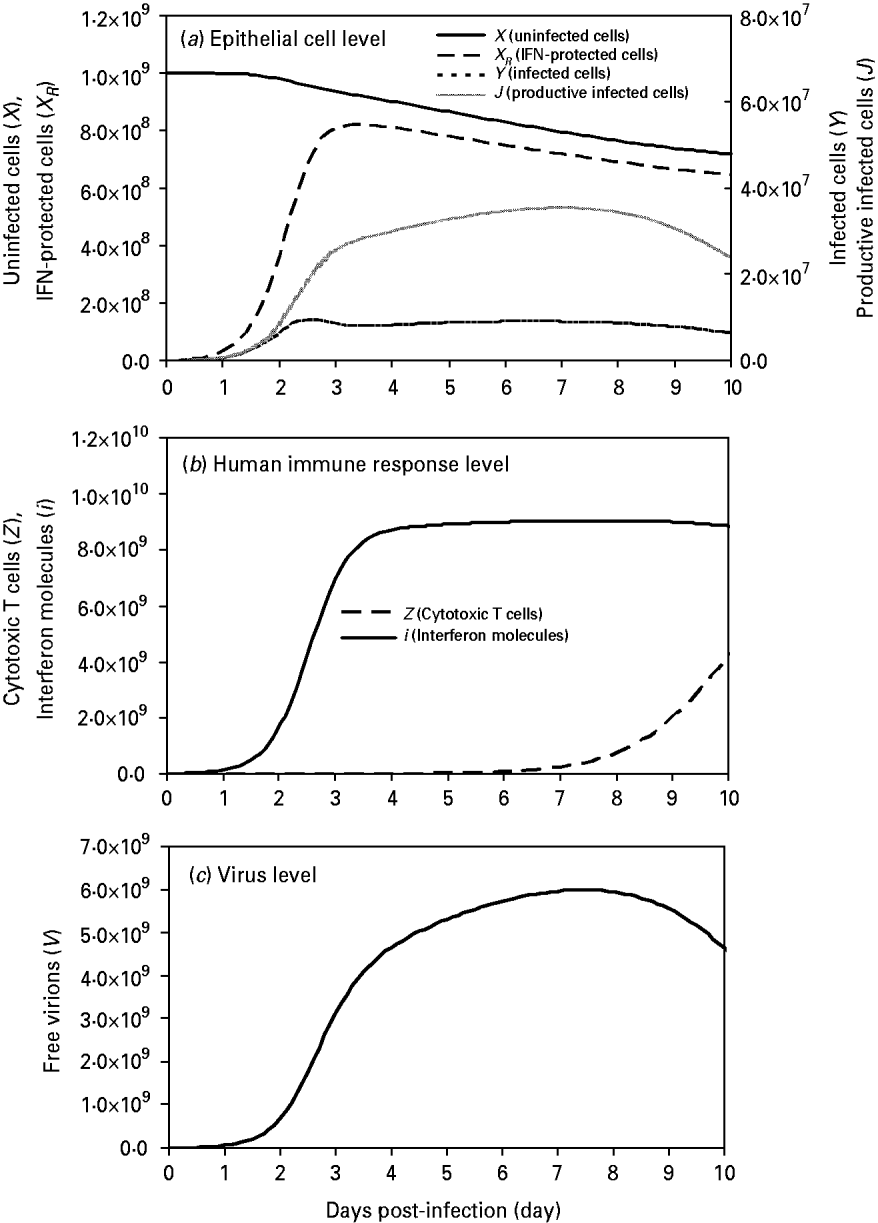
Fig. 2. Model influenza A variables at the three levels: (a) at the epithelial cell level: parameters include X (uninfected cells), X R (IFN-protected cells), Y (infected cells), and J (productive infected cells); (b) at the human response level: parameters include Z (CTLs) and I (IFN molecules); (c) at the virus level: parameters include V (free virions) with an initial viral load of 107 virions. Input values of these parameters are presented in Table 2.
At the immune response level, the first responder to influenza A infection was IFN(i), with production of this cytokine beginning <2 h after viral infection, reaching a peak between days 3 and 4 (Fig. 2 b). By contrast, CTL responders (Z) were much slower, showing peak activity at day 10 (Fig. 2 b). At the virus level, a high viral titre appeared at day 2 and reached a peak value of 5·96×109 virions by day 7 (Fig. 2 c).
Human experimental viral titre concentration
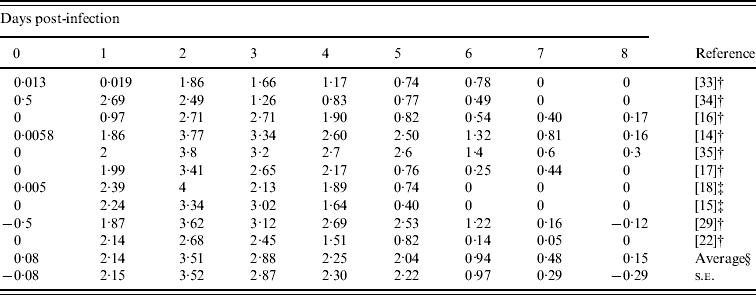
Table 3 gives the daily-based average viral titres in the previous studies included in this report. Most viral titres were recorded on days 0–8, except the study by Barroso et al. [Reference Barroso22] which sampled twice (in morning and afternoon) on days 1–3, and only once on days 4–7. In order to estimate the daily-based average viral titres, we used approximate values from this study [Reference Barroso22]. The overall patterns started after day 1 and approached towards peak viral titres during day 2 with a measure of 103·51 TCID50 ml−1 and then slowly decreased to <101 TCID50 ml−1 by day 6.
Table 3. Daily-based average viral titers (log TCID50 ml−1) which was estimated by the results of viral titres in experimental influenza virus infection
† Mean values.
‡ Median values.
§ Arithmetic average of 10 viral titers (log TCID50 ml−1) on a specific day.
Parameter sensitivity analysis
To evaluate the variability of parameters that significantly contribute to free virions, sensitivity analyses were performed. The time-course of free virions was used to show the model's sensitivity to variations in parameters λ, q, k, and β, respectively (Fig. 3). When the modified influenza viral dynamics model was subjected to an input parameter of λ ranging from 0 to 6·27×107 d−1, free virions decreased accordingly after day 3 post-infection, whereas a similar effect on q was noted when parameters ranged from 2 to 6 d−1 (Fig. 3 a, b).

Fig. 3. Sensitivity analysis of λ [equilibrium production rate of epithelial cells (d−1)], q [transition rate from Y to J (d−1)], k [production rate of viruses from infected epithelial cells (d−1 infected cell−1)] and β [reciprocal of epithelial cell lifespan (d−1 virion−1)] are presented. The expected physiological ranges of these four parameters are given in Table 2.
We also found that the infection rates of uninfected cells (to become infected cells) increased when input parameters of the infection rate β were increased from 6×10⁻¹⁰ to 3×10⁻¹⁴ d−1 virion−1. Similarly, free virions in epithelial cells increased with an increasing value of k, the virus production rate from infected epithelium (Fig. 3 c–f).
Pearson correlation analysis [Reference Helton and Davis23] was used to determine the optimal parameter inputs, with the best statistical significance, between the daily-based average viral titres and the prediction of free virions that varied with physiological ranges of parameter input. Our results indicated that input values of k=4000 and β=5×10⁻¹⁰ resulted in a significant correlation between experimental human infection data shown in Table 3 and model predictions (r=0·99, P<0·0001) (Table 4, Fig. 4). This sensitivity analysis suggested that the infection rate of an unprotected epithelial cell (β) is likely to play an important role in shaping the viral dynamics, whereas the viral production rate from infected epithelial cells (k) is the second most sensitive parameter in this model.

Fig. 4. (a) Model validation of the present virus dynamics model against the daily-based average viral titres data. (b) A comparison of our modified model with the target-cell limited model with delayed virus production [Reference Baccam10] and the immune response model [Reference Chang and Young12]. The data (mean±s.e.) have the same values with a different scale as shown in Table 3.
Table 4. Optimal Pearson correlation analysis between experimental human infection data (Table 3) and modelling results from the modified virus dynamic model

Model validation
To test this prediction, we performed the model's validation with derived optimal estimates of production rate k and infection rate β values. Figure 4 a shows the time-course of predicted free virions in epithelial cells with the optimal parameters of k=4000 and β=5×10⁻¹⁰ against the experimental data of daily-based average viral titres shown in Table 3. Generally, the results were in agreement with the experimental data trend, except on days 6–8 where a decreasing trend was noted. This may be due in part to individual immune variations in response to influenza virus. Moreover, with regard to Table 3, there were 2–6 missing data points of the daily-based average viral titres at days 6–8 post-infection.
This study also compared the predictive capacities for free virions among the target-cell limited model with delayed virus production [Reference Baccam10], the immune response model [Reference Chang and Young12] and our modified viral dynamics model (Fig. 4 b). Our results indicated that our model fit experimental data of the dynamics of free virion production (r 2=0·99, P<0·0001) better than the target-cell limited model with delayed virus production (r 2=0·85, P=0·0004) and the immune response model (r 2<0·1, P=0·955) (Fig. 4 b). This indicates our model as performing better than the others during validation. On the other hand, this study presents the results of viral dynamics modelling by considering the optimal input at β=5×10⁻¹⁰ (Table 4, Fig. 5 a). Figure 5 b shows the rapid rise in IFN at 1–2 days after introduction of the virus followed by a broad maximum between days 2 and 3. The IFN production begins within hours and peaks at between 72 and 92 h. Figure 5 c shows the rapid rise in CTL immunity between days 3 and 6. Figure 5 d shows that the maximum total number of free virions during infection is 103-fold higher than the initial number introduced (V 0=107).
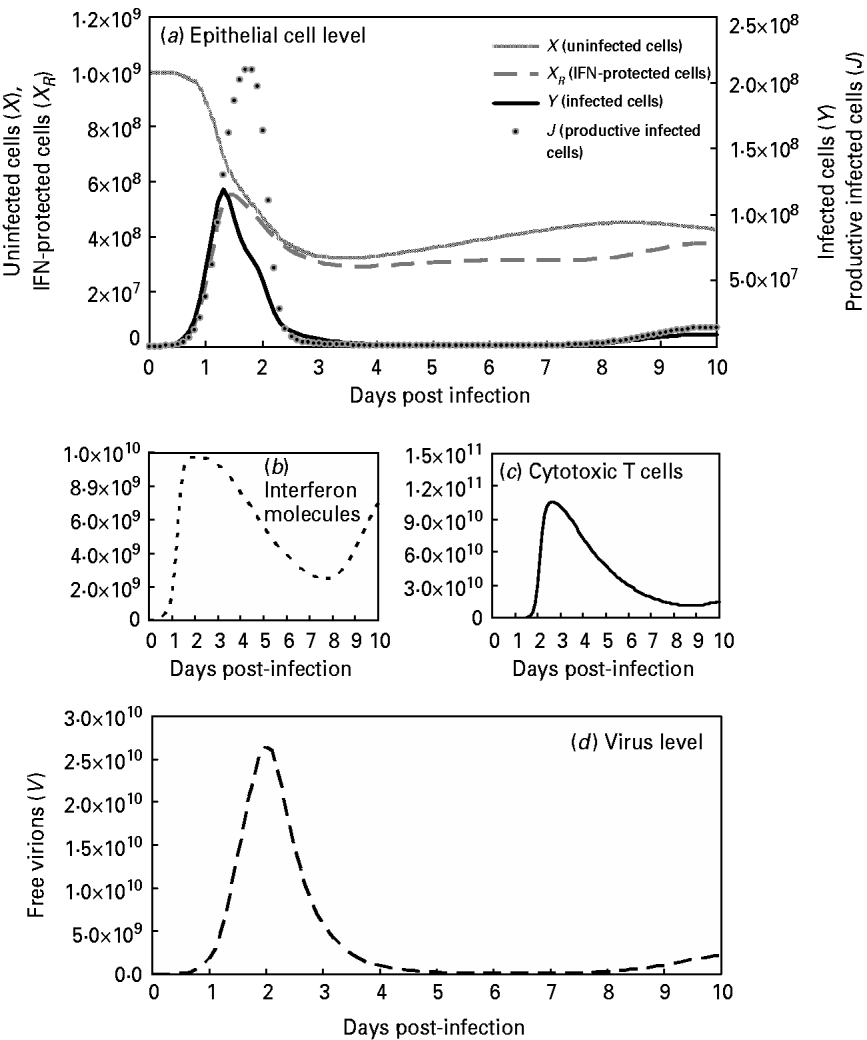
Fig. 5. Model influenza A variables with optimal Pearson correlation analysis (β=5×10⁻¹⁰; Table 4) at: (a) the epithelial cell level with parameters X (uninfected cells), X R (IFN-protected cells), Y (infected cells), and J (productive infected cells); (b) the human immune response level with parameters I (interferon molecules); (c) [Z (CTLs)] and (d) the virus level with the parameter V (free virons).
DISCUSSION
Mathematical models have long been recognized as useful tools for exploring complicated relationships that underlie infectious disease transmission [Reference Keeling and Rohani24]. The accuracy of the predictions obtained from mathematical modelling depends on the accuracy of the estimated parameters used in the model. To this end, good parameter estimates are needed to understand and model the potential spread of influenza while the interpretation of data from experimental infection studies provides validation of mathematical model predictions for different influenza infection scenarios. Moreover, the dynamics of viral shedding and symptoms following influenza virus infection are key factors when considering epidemic control measures [Reference Baccam10, Reference Hayden14].
Our study developed a modified viral dynamics model that builds on past models of a target cell-limited model with delayed virus production introduced by Baccam et al. [Reference Baccam10] and Chung & Young [Reference Chang and Young12]. Here, we adopted these two models and compared the results by fitting the models to experimental human infection data. Results showed that our present model seemed to fit data better than each individual past model. Our results indicate a mechanistic explanation for the associations between epithelial cells, human immune responses, and virus dynamics. These mechanistic insights were supported by the experimental human infection results. Our study also revealed that the maximum total number of free virions (V(t)) during infection is 103-fold higher than that of the initial number introduced (V 0). This result is supported by previous research, indicating that this is within the range of 10–105 that has been observed in other experimental data [Reference Baccam10, Reference Fritz17, Reference Murphy19, Reference Bocharov and Romanyukha20, Reference Mogensen, Virelizier and Gresser25–Reference Murphy, Webster, Fields, Knipe, Melnick, Chanock, Roizman and Shope27]. Our model thus had higher performance when accounting for the human immune response level, which incorporated the three additional parameters of IFN-protected cells (X R ), CTLs (Z), and IFN molecules (i). Overall, this inclusion improved experimental data fitting. Therefore, the modified model we developed described appropriately the available experimental data.
The complexity of the model is determined by the purpose of the study and the amount of information in the dataset. As a rule of thumb, it is not advantageous to use a more complex model when a simpler model provides an adequate fit to the data. Undoubtedly, many factors influence the relationship between primary influenza infection and immune response outcome. Thus, several limitations and difficulties existed in this study. The concentration units used for model validation were different between the experimental free virions shedding data and that of simulated free virions. Handel et al. [Reference Handel, Longini and Antia28] provided the unit conversion for 1 TCID50 ml−1 of nasal wash as corresponding to nearly 102–105 free virions at the site of infection. In fact, we think that this is a relatively large range for this conversion. Our goal, however, was not to obtain precise conversion numbers, but to examine the qualitative effects of variation in the infection rate of unprotected epithelial cells and viral production from infected epithelial cells, and how these parameters affect viral dynamics. Besides, no available data so far allowed for validating this conversion.
Furthermore, there is difference in the time-scales in human infection experiments. Many previous studies have focused on the beginning of inoculation and drug administration in that the trials were conducted twice daily [Reference Hayden15]. However, several studies were conducted daily with a mean viral titre [Reference Kaiser, Briones and Hayden29] based on inoculation on day 0. Hence, we defined the inoculation as the first day (day 0) and estimated the following average viral titres on days 0–8.
When humans are infected by influenza virus, innate immune responses are particularly important as the first line of defence against infection; however, adaptive immune responses are also critical for the ultimate control and clearance of influenza A virus infection [Reference McGill, Heusel and Legge30]. In order to consider the compartmentalization of influenza infection, Hancioglu et al. [Reference Hancioglu, Swigon and Clermont11] and Lee et al. [Reference Lee31] proposed more complex models to simulate human immune response to influenza A virus infection in different situations with different objectives. The major difference between our study and the above two studies rests in the number of immune response parameters used for modelling. In the present study, we constructed a simple model of viral dynamics by using three parameters based in part on models developed previously, whereas Hancioglu et al. [Reference Hancioglu, Swigon and Clermont11] and Lee et al. [Reference Lee31] used at least twice as many immune response parameters than our model.
In conclusion, by simulating an advanced model of viral dynamics and applying it to experimental infection data of human influenza, we obtained important estimates of the infection rate of an epithelial cell. This work provides epidemiologically meaningful results and merits further efforts to understand the causes and consequences of influenza pandemics by placing experimental infection data in a predictive framework of viral dynamics in order to develop pertinent mitigation strategies. Our results suggest that the infection rate of an unprotected epithelial cell has an important role in viral dynamics. This modified model could be used for predicting the adaptive immune response [Reference Lee31], antiviral use, or antiviral drug resistance induced by drug selection pressure [Reference McCaw32]. Furthermore, it is anticipated that this work could provide an important analytical tool to estimate key parameters in experimental and epidemiological studies related to drug-resistant influenza virus in immune response dynamics. Detailed understanding of system dynamics and interaction between various factors will require further development of the existing analytical models.
ACKNOWLEDGEMENTS
This study was financially supported by National Science Council of Taiwan, Republic of China under Grant NSC 97-2314-B-040-006-MY2.
DECLARATION OF INTEREST
None.


