


Impact Statement
Flows of dry and wet granular suspensions through constrictions have long been studied, from the regular discharge of sand in antique hourglasses to the granular flows within silos or even the clogging of particles under confinement. We here describe a novel and versatile two-dimensional microfluidic hopper to investigate the flow and clogging dynamics of dense suspensions. The set-up combines an in situ microfluidic fabrication technique with a pneumatic valve at the orifice to print and concentrate particles of controllable shape. We here demonstrate that the microfluidic flow and clogging of dense suspensions of hard monodisperse disk-shaped particles are reminiscent of well-established behaviours in conventional granular hoppers. By conducting experiments under different driving forces, we report a constant particle discharge rate that depends on the flow driving mechanism and follows well-established stochastic clogging laws. Such results might contribute to bridging the gap between dry granular media and dense wet suspensions. Finally, the versatility and tunability of the microfluidic hopper pave the way for systematic experimental studies on complex granular suspensions involving particles of varying shapes and deformability, of obvious interest in practical applications.
1. Introduction
Granular flows through bottlenecks are observed across a wide range of situations, both in nature and industry. These flows can involve dry granular materials, such as in grain silos (Jenike, Reference Jenike1967) and hourglasses (Pongó et al. Reference Pongó, Stiga, Török, Lévay, Szabó, Stannarius, Hidalgo and Börzsönyi2021), or particles suspended in a viscous fluid, as found in blood vessels (Patnaik et al. Reference Patnaik, Das, Mishra, Mohanty, Satpathy and Mohanty1994) and ink-jet printing processes (Croom et al. Reference Croom, Abbott, Kemp, Rueschhoff, Smieska, Woll, Stoupin and Koerner2021). Research on particulate flow through a narrow orifice dates back to the mid-1800s, with early studies focusing on the gravity-driven discharge of dry grains from silos (Hagen, Reference Hagen1852; Janssen, Reference Janssen1895). Unlike liquids flowing from a container, grains exit a silo at a constant rate, independent of the filling height. While this constant discharge rate has long been attributed to pressure saturation at the bottom of the silo (Sperl, Reference Sperl2006; Tighe and Sperl, Reference Tighe and Sperl2007), more recent studies suggest that it is instead due to the constant exit velocity of particles in the outlet region (Aguirre et al. Reference Aguirre, Grande, Calvo, Pugnaloni and Géminard2010).
The dependence of the constant particle discharge rate on the orifice and particle sizes in granular gravity-driven flows is commonly described by the Beverloo law (Beverloo et al. Reference Beverloo, Leniger and van de Velde1961). While some of the physical concepts underlying this law have been questioned in recent studies (Janda et al. Reference Janda, Zuriguel and Maza2012; Mankoc et al. Reference Mankoc, Janda, Arévalo, Pastor, Zuriguel, Garcimartín and Maza2007; Rubio-Largo et al. Reference Rubio-Largo, Janda, Maza, Zuriguel and Hidalgo2015; Zhou et al. Reference Zhou, Lagrée, Popinet, Ruyer and Aussillous2019), its scaling remains universally observed across a wide range of situations (Nedderman et al. Reference Nedderman, Tüzün, Savage and Houlsby1982). It can even be applied to systems with fundamentally different driving mechanisms, including particles floating at the surface of a flowing fluid (Guariguata et al. Reference Guariguata, Pascall, Gilmer, Sum, Sloan, Koh and Wu2012) or transported on a conveyor belt moving at constant velocity (Aguirre et al. Reference Aguirre, Grande, Calvo, Pugnaloni and Géminard2010). When the orifice size becomes sufficiently small relative to the particle diameter, flow can be impeded by the formation of a clog at the constriction, leading to temporary or permanent interruptions of the discharge process. This phenomenon, observed in both dry systems (Zuriguel, Reference Zuriguel2014) and suspension flows (Dressaire and Sauret, Reference Dressaire and Sauret2016; Marin and Souzy, Reference Marin and Souzy2025), can significantly impact the performance of various industrial processes.
Both the discharge and clogging of particles through a narrow orifice are controlled by a large number of parameters, including the particle size (Beverloo et al. Reference Beverloo, Leniger and van de Velde1961; Janda et al. Reference Janda, Zuriguel, Garcimartín, Pugnaloni and Maza2008), shape (Ashour et al. Reference Ashour, Wegner, Trittel, Börzsönyi and Stannarius2017), polydispersity (Zhou et al. Reference Zhou, Ruyer and Aussillous2015), deformability (Tao et al. Reference Tao, Wilson and Weeks2021) and solid fraction (Vani et al. Reference Vani, Escudier and Sauret2022). The roles of channel geometry (Genovese and Sprakel, Reference Genovese and Sprakel2011; Vani et al. Reference Vani, Escudier, Jeong and Sauret2024) and the presence of a liquid phase (Koivisto and Durian, Reference Koivisto and Durian2017; Marin et al. Reference Marin, Lhuissier, Rossi and Kähler2018; Souzy and Marin, Reference Souzy and Marin2022) have also been analysed. Understanding real flows, which generally involve particles with complex properties, requires the ability to control various of these parameters within the same experimental set-up. Yet, most existing studies rely on pre-existing or commercially available particles, offering limited control over particle properties.
In this paper, we present an experimental model system designed to study the flow of suspensions with tuneable properties through a bottleneck in a two-dimensional configuration. Experiments are performed in a microfluidic hopper channel, where in situ fabricated particles are transported through a constriction by a viscous fluid. While our experimental set-up allows for a precise control over particle shape, deformability and volume fraction, this study only focuses on the flow of densely packed, hard, disk-shaped particles. We demonstrate that, despite fundamental differences with dry granular silos, our microfluidic experimental system discharges at a constant rate under both imposed flow rate and pressure conditions. Furthermore, we characterise the discharge rate as a function of particle size under both drivings, and show that the stochastic laws governing particle clogging are recovered. This makes our set-up an effective model system for studying particulate flow through bottlenecks across a wide range of configurations.
The paper is organised as follows: we first present the experimental set-up and particle fabrication method, and characterise the driving force in our system. We then examine the discharge of a dense packing of hard disk-shaped particles, and apply our system to the study of the hopper discharge and the clogging of particles. Finally, we give perspectives for future work involving more complex particle suspensions.
2. Materials and methods
2.1. Experimental set-up
We experimentally study the discharge of a dense suspension of hard disk-shaped particles through a two-dimensional microfluidic hopper. Both particle fabrication and discharge experiments are conducted in a Polydimethylsiloxane (PDMS) channel with fixed length $L=24$
mm, width
$L=24$
mm, width $w=5$
mm and thickness
$w=5$
mm and thickness $H=92$
µm, as depicted in Figure 1(a). The channel features a hopper geometry, with a constriction of varying width
$H=92$
µm, as depicted in Figure 1(a). The channel features a hopper geometry, with a constriction of varying width $w_c=600$
or
$w_c=600$
or $900$
µm, formed by a tapered section with an angle of
$900$
µm, formed by a tapered section with an angle of $45$
°. A pneumatically controlled Quake valve (Unger et al. Reference Unger, Chou, Thorsen, Scherer and Quake2000) is placed immediately after the constriction, retaining particles while allowing the interstitial fluid to pass when closed. Due to its small thickness relative to its width (
$45$
°. A pneumatically controlled Quake valve (Unger et al. Reference Unger, Chou, Thorsen, Scherer and Quake2000) is placed immediately after the constriction, retaining particles while allowing the interstitial fluid to pass when closed. Due to its small thickness relative to its width ( $H\ll w$
), the microfluidic channel exhibits a Hele-Shaw geometry. The velocity profile is thus parabolic in the
$H\ll w$
), the microfluidic channel exhibits a Hele-Shaw geometry. The velocity profile is thus parabolic in the $z$
-direction while being independent of the
$z$
-direction while being independent of the $x$
and
$x$
and $y$
positions, except very close to the sidewalls and in the tapered section.
$y$
positions, except very close to the sidewalls and in the tapered section.
The microfluidic device consists of three layers (bottom to top): a glass microscopy slide spin coated with PDMS, a thin PDMS slab containing the hopper channel and a thick PDMS slab containing the Quake valve. The two first layers are fabricated by spin coating a $200 - 300$
µm layer of PDMS (Sylgard 184, 19:1 base:cross-linker) onto a glass slide and a hopper channel mould (
$200 - 300$
µm layer of PDMS (Sylgard 184, 19:1 base:cross-linker) onto a glass slide and a hopper channel mould ( $92$
µm SU-8 layer on a silicon wafer), while the third layer is obtained by casting a Quake-valve mould (
$92$
µm SU-8 layer on a silicon wafer), while the third layer is obtained by casting a Quake-valve mould ( $\sim 50$
µm SU-8 layer on a silicon wafer) in
$\sim 50$
µm SU-8 layer on a silicon wafer) in $\sim$
5 mm of PDMS (Sylgard 184, 9:1). All three layers are then cured separately at 70 °C for 40 minutes, after which the Quake valve is bonded to the hopper channel, and the assembly is bonded to the spin-coated glass slide. Bonding is achieved by pressing the layers together and placing the assembly in an oven at 70 °C for 30 minutes (Kool, Reference Kool2023).
$\sim$
5 mm of PDMS (Sylgard 184, 9:1). All three layers are then cured separately at 70 °C for 40 minutes, after which the Quake valve is bonded to the hopper channel, and the assembly is bonded to the spin-coated glass slide. Bonding is achieved by pressing the layers together and placing the assembly in an oven at 70 °C for 30 minutes (Kool, Reference Kool2023).
The microfluidic hopper channel is observed using an inverted microscope (Zeiss Axio Observer A1), installed on an optical breadboard (Newport SG breadboard), passively levelled and isolated from vibrations by pneumatic feet (Newport CM-225). The microscope has a UV light (Osram HBO 103W/2), filtered using a band-pass filter at $\lambda = 365\pm 10$
nm (Chroma D365/10), and reflected into the channel using a reflector cube (Zeiss 424933). The filtered UV light is modulated precisely by an electronic shutter (Uniblitz V25,
$\lambda = 365\pm 10$
nm (Chroma D365/10), and reflected into the channel using a reflector cube (Zeiss 424933). The filtered UV light is modulated precisely by an electronic shutter (Uniblitz V25, $100$
Hz) coupled to an external signal generator (Agilent A33220A). The channel position is modified using a motorised stage (Märzhäuser Wetzlar Tango PCI-E), which can be operated manually, or digitally via a LabView program. Fluid flow in the microfluidic channel is controlled either by imposing a pressure gradient
$100$
Hz) coupled to an external signal generator (Agilent A33220A). The channel position is modified using a motorised stage (Märzhäuser Wetzlar Tango PCI-E), which can be operated manually, or digitally via a LabView program. Fluid flow in the microfluidic channel is controlled either by imposing a pressure gradient $\Delta P$
with a pressure controller (Fluigent Flow EZ), or by setting a flow rate
$\Delta P$
with a pressure controller (Fluigent Flow EZ), or by setting a flow rate $Q$
with a syringe pump (Nemesys, Cetoni). For pressure-driven experiments, the tubing length connecting the fluid reservoir to the channel is systematically measured and kept constant to maintain the hydraulic resistance consistent across experiments. Movies of the experiments are recorded at
$Q$
with a syringe pump (Nemesys, Cetoni). For pressure-driven experiments, the tubing length connecting the fluid reservoir to the channel is systematically measured and kept constant to maintain the hydraulic resistance consistent across experiments. Movies of the experiments are recorded at $5$
Hz using a digital CMOS camera (Hamamatsu Orca-Fusion C14440).
$5$
Hz using a digital CMOS camera (Hamamatsu Orca-Fusion C14440).
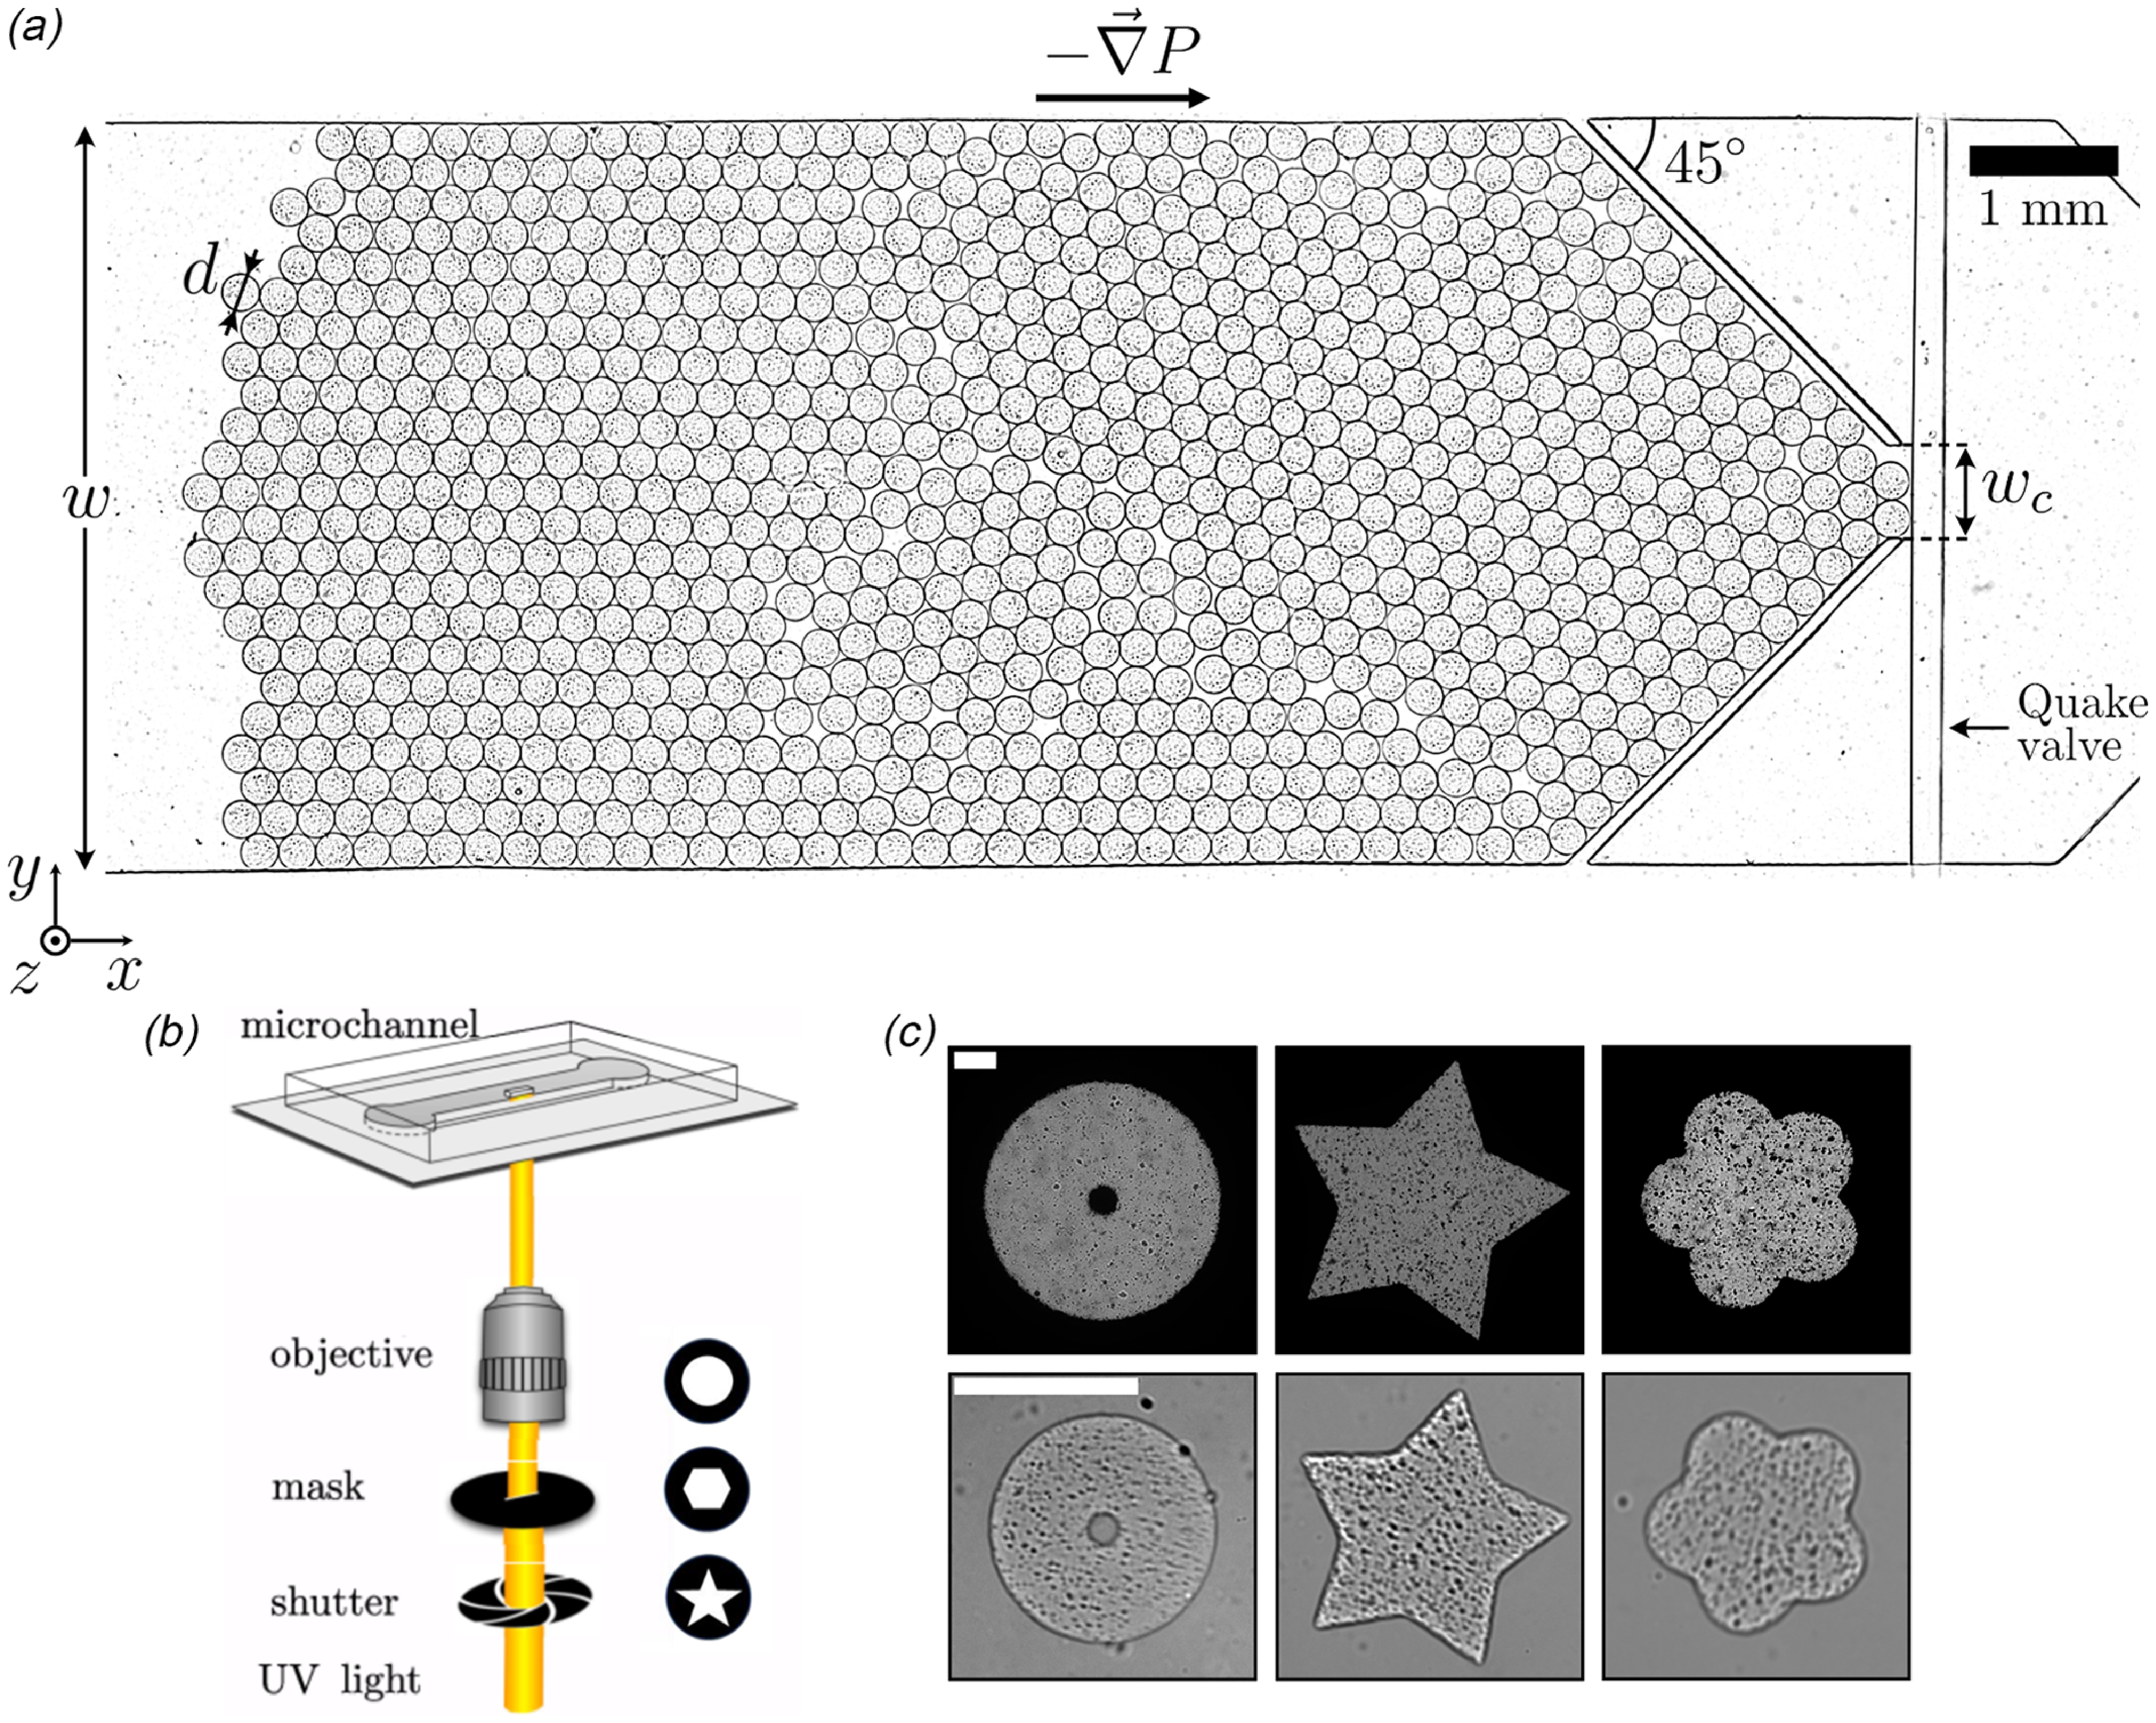
Figure 1. (a) Top view of the microfluidic hopper channel used in the experiments. The channel consists of a $24$
mm long straight section of fixed width
$24$
mm long straight section of fixed width $w=5$
mm, followed by a tapered section with an angle of 45°and a constriction width
$w=5$
mm, followed by a tapered section with an angle of 45°and a constriction width $w_c$
. Particles of diameter
$w_c$
. Particles of diameter $d$
are initially packed at the channel constriction using a Quake valve, before being discharged through the constriction. (b) Principle of particle fabrication. A UV curable polymer solution is filled into the microfluidic channel and illuminated through a mask, resulting in hydrogel-like particles being fabricated inside the channel. Image adapted from Cappello et al. (Reference Cappello, Bechert, Duprat, du Roure, Gallaire and Lindner2019). (c) Examples of masks and the corresponding cross-linked particles. Both scale bars are
$d$
are initially packed at the channel constriction using a Quake valve, before being discharged through the constriction. (b) Principle of particle fabrication. A UV curable polymer solution is filled into the microfluidic channel and illuminated through a mask, resulting in hydrogel-like particles being fabricated inside the channel. Image adapted from Cappello et al. (Reference Cappello, Bechert, Duprat, du Roure, Gallaire and Lindner2019). (c) Examples of masks and the corresponding cross-linked particles. Both scale bars are $200$
µm.
$200$
µm.
2.2. Particle fabrication
The particles used in our experiments are fabricated using an in situ photo-lithographic projection method (Cappello et al. Reference Cappello, Bechert, Duprat, du Roure, Gallaire and Lindner2019; Dendukuri et al. Reference Dendukuri, Gu, Pregibon, Hatton and Doyle2007), as described in Figure 1(b). The microfluidic channel is first filled with a UV-polymerisable solution, whose composition depends on the desired deformability of the particles (Duprat et al. Reference Duprat, Berthet, Wexler, du Roure and Lindner2014). In this paper, we limit ourselves to a mixture of $90$
% poly(ethylene glycol) diacrylate (PEGDA,
$90$
% poly(ethylene glycol) diacrylate (PEGDA, $M_N$
= 575) and
$M_N$
= 575) and $10$
% photo-initiator (Darocur 1173), which results in cross-linked particles with a Young’s modulus of
$10$
% photo-initiator (Darocur 1173), which results in cross-linked particles with a Young’s modulus of $\sim$
12 MPa (Cappello et al. Reference Cappello, Bechert, Duprat, du Roure, Gallaire and Lindner2019; Duprat et al. Reference Duprat, Berthet, Wexler, du Roure and Lindner2014), rendering deformations negligible under our experimental conditions. A small amount of surfactant (0.1 % v/v of Tween-80) is added to the polymer solution to mitigate adhesive interactions between particles. The solution is Newtonian of viscosity
$\sim$
12 MPa (Cappello et al. Reference Cappello, Bechert, Duprat, du Roure, Gallaire and Lindner2019; Duprat et al. Reference Duprat, Berthet, Wexler, du Roure and Lindner2014), rendering deformations negligible under our experimental conditions. A small amount of surfactant (0.1 % v/v of Tween-80) is added to the polymer solution to mitigate adhesive interactions between particles. The solution is Newtonian of viscosity $\eta =47$
mPa.s and density
$\eta =47$
mPa.s and density $\rho =1120$
kg.m
$\rho =1120$
kg.m $^{-3}$
.
$^{-3}$
.
Once the channel is filled with the UV-sensitive solution, fluid flow is stopped and the channel is locally exposed to UV light, resulting in the formation of a solid hydrogel-like particle. The cross-linked particle has the same density as the uncross-linked solution and is considered frictionless, since hydrogels have a notoriously low friction coefficient (typically $10^{-3}$
(Gong, Reference Gong2006)). Its shape and size are controlled by placing a plastic mask in the field-stop position of the microscope. Due to micrometric speckles on the mask, the particle exhibits textured top and bottom surfaces. This, however, does not influence the experiments, as these surfaces are never in contact with any other particle surface. Examples of masks of various shapes and the corresponding cross-linked particles are given in Figure 1(c). In this study, we only focus on disk-shaped particles with diameters
$10^{-3}$
(Gong, Reference Gong2006)). Its shape and size are controlled by placing a plastic mask in the field-stop position of the microscope. Due to micrometric speckles on the mask, the particle exhibits textured top and bottom surfaces. This, however, does not influence the experiments, as these surfaces are never in contact with any other particle surface. Examples of masks of various shapes and the corresponding cross-linked particles are given in Figure 1(c). In this study, we only focus on disk-shaped particles with diameters $d$
ranging from
$d$
ranging from $114$
to
$114$
to $378$
µm. Due to the presence of oxygen near the channel walls, the cross-linking reaction is inhibited over a layer of thickness
$378$
µm. Due to the presence of oxygen near the channel walls, the cross-linking reaction is inhibited over a layer of thickness $\delta$
near the top and bottom walls of the channel (Dendukuri et al. Reference Dendukuri, Panda, Haghgooie, Kim, Hatton and Doyle2008). This leads to particles with a thickness
$\delta$
near the top and bottom walls of the channel (Dendukuri et al. Reference Dendukuri, Panda, Haghgooie, Kim, Hatton and Doyle2008). This leads to particles with a thickness $h=H-2\delta$
, where
$h=H-2\delta$
, where $\delta$
was estimated to be
$\delta$
was estimated to be $21$
µm in our experiments, yielding
$21$
µm in our experiments, yielding $h=50$
µm. This thickness is sufficiently large to prevent overlapping and maintain a single layer of particles within the channel.
$h=50$
µm. This thickness is sufficiently large to prevent overlapping and maintain a single layer of particles within the channel.
The microfluidic channel is filled with particles by repeating the aforementioned UV cross-linking and moving the focal spot of the objective between successive UV pulses, enabling precise control over the microscopic particle configuration and initial packing fraction (see Supplementary Movie 1). Since this study focuses on dense packings, particles are fabricated in a hexagonal configuration to maximise their number within the channel. Note that particles must be separated by a few microns during cross-linking to avoid the fusion of closed structures, limiting the maximum packing that can be obtained. Once the fabrication is complete, particles are densely packed at the constriction of the hopper. This is achieved by closing the Quake valve while imposing a fluid flow, which results in particle accumulation at the orifice (see Supplementary Movie 2).
2.3. Hopper discharge experiment
After the particles are densely packed at the constriction, the Quake valve is opened while maintaining fluid flow, allowing the suspension to discharge through the channel orifice (see Supplementary Movie 3). If a clog forms, a brief reverse flow is applied to break the obstructing arch and restore particle flow (see Supplementary Movie 4). Each experiment concludes when the number of remaining particles is insufficient to fill the tapered section of the channel.
Once recorded, experiment movies are analysed to detect particles and reconstruct their trajectories. For each frame, particles are detected using a fully parallelised in-house convolutional algorithm, with a precision of $\sim 0.3$
µm. The particle positions are then linked over time using the open-source tracking algorithm trackpy (Allan et al. Reference Allan, Caswell, Keim, van der Wel and Verweij2024). Particle velocities are calculated using the interframe displacements and the timestamp in the metadata of the images. The number
$\sim 0.3$
µm. The particle positions are then linked over time using the open-source tracking algorithm trackpy (Allan et al. Reference Allan, Caswell, Keim, van der Wel and Verweij2024). Particle velocities are calculated using the interframe displacements and the timestamp in the metadata of the images. The number $N(t)$
of particles discharged over time is determined by counting the particles exiting the channel.
$N(t)$
of particles discharged over time is determined by counting the particles exiting the channel.
In addition to particle trajectories, some experiments require monitoring of the total flow rate $Q$
within the channel during particle discharge. This measurement is particularly useful for estimating the system’s hydraulic resistance
$Q$
within the channel during particle discharge. This measurement is particularly useful for estimating the system’s hydraulic resistance $R=\Delta P/Q$
in pressure-driven experiments. The use of a flow sensor is not possible here, as such a device would significantly increase the system’s resistance to flow. Instead, two alternative measurement methods are employed in this study.
$R=\Delta P/Q$
in pressure-driven experiments. The use of a flow sensor is not possible here, as such a device would significantly increase the system’s resistance to flow. Instead, two alternative measurement methods are employed in this study.
The first and most accurate method consists of measuring the fluid velocity in the channel using micro-particle image velocimetry (PIV). After particle fabrication, the microfluidic channel is filled with tracer particles and transferred to a micro-PIV set-up equipped with a pulsed Nd:YAG laser (Litron Lasers, Nano Series, $532$
nm). Fluid velocity is measured in a region far upstream of the orifice, where no particles are present. Due to the small depth of correlation in our micro-PIV set-up, velocity measurements are confined to a
$532$
nm). Fluid velocity is measured in a region far upstream of the orifice, where no particles are present. Due to the small depth of correlation in our micro-PIV set-up, velocity measurements are confined to a $z$
-plane of thickness
$z$
-plane of thickness $18.4$
µm, smaller than the channel thickness (Olsen and Adrian, Reference Olsen and Adrian2000). To calibrate the vertical position of the measurement plane within the channel, we first measure the fluid velocity at different
$18.4$
µm, smaller than the channel thickness (Olsen and Adrian, Reference Olsen and Adrian2000). To calibrate the vertical position of the measurement plane within the channel, we first measure the fluid velocity at different $z$
-positions during a steady flow and fit a parabolic velocity profile (Pimenta et al. Reference Pimenta, Toda-Peters, Shen, Alves and Haward2020). The flow rate during particle discharged is then calculated by integrating the measured fluid velocity over the channel cross-section, assuming a parabolic profile in the vertical direction and a uniform velocity along the channel width.
$z$
-positions during a steady flow and fit a parabolic velocity profile (Pimenta et al. Reference Pimenta, Toda-Peters, Shen, Alves and Haward2020). The flow rate during particle discharged is then calculated by integrating the measured fluid velocity over the channel cross-section, assuming a parabolic profile in the vertical direction and a uniform velocity along the channel width.
While the micro-PIV method enables precise measurements of $Q$
over time, its use requires switching set-ups and calibration of the vertical position of the measurement plane before each experiment. Additionally, this method does not allow for simultaneous observation of the tapered section during particle discharge. For these reasons, we also use another method, where
$Q$
over time, its use requires switching set-ups and calibration of the vertical position of the measurement plane before each experiment. Additionally, this method does not allow for simultaneous observation of the tapered section during particle discharge. For these reasons, we also use another method, where $Q$
is estimated by measuring the mass
$Q$
is estimated by measuring the mass $m$
exiting the channel over time. In this method, both the fluid and particles leaving the channel are directed to a precision balance (Denver Instrument TP-214,
$m$
exiting the channel over time. In this method, both the fluid and particles leaving the channel are directed to a precision balance (Denver Instrument TP-214, $0.1$
mg accuracy,
$0.1$
mg accuracy, $1$
Hz) via a tubing of diameter
$1$
Hz) via a tubing of diameter $3$
mm, sufficiently large to prevent clog formation. The end of the tubing is immersed in a pool of solution to avoid dripping. The total flow rate
$3$
mm, sufficiently large to prevent clog formation. The end of the tubing is immersed in a pool of solution to avoid dripping. The total flow rate $Q$
is directly deduced from mass measurements using
$Q$
is directly deduced from mass measurements using $Q=\frac {1}{\rho }\frac {\mathrm{d}m}{\mathrm{d}t}$
.
$Q=\frac {1}{\rho }\frac {\mathrm{d}m}{\mathrm{d}t}$
.
2.4. Driving force
A particle in the channel is subject to a pressure force due to the pressure gradient along the channel, a viscous drag force from the fluid flow around it and a viscous friction force in the gaps above and below the particle (Berthet et al. Reference Berthet, Fermigier and Lindner2013). For a disk-shaped particle of radius $r$
and height
$r$
and height $h$
in a Hele-Shaw flow, as depicted in Figure 2(a), the pressure force and viscous friction are given by
$h$
in a Hele-Shaw flow, as depicted in Figure 2(a), the pressure force and viscous friction are given by
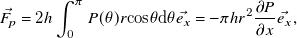 \begin{equation} \vec {F_p} = 2h\int _0^\pi P(\theta ) r \mathrm{cos} \theta \mathrm{d} \theta \vec {e_x} = -\pi h r^2 \frac {\partial P}{\partial x} \vec {e_x}, \end{equation}
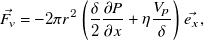 \begin{equation} \vec {F_v} = -2\pi r^2 \left (\frac {\delta }{2} \frac {\partial P}{\partial x} + \eta \frac {V_p}{\delta } \right ) \vec {e_x}, \end{equation}
where $\delta$
is the gap thickness,
$\delta$
is the gap thickness, $\partial P / \partial x$
is the pressure gradient along
$\partial P / \partial x$
is the pressure gradient along $x$
and
$x$
and $V_p$
is the particle velocity. The viscous drag of the fluid flowing around the disk can be neglected as the fluid and particle velocities are very close to each other in our experimental geometry, where
$V_p$
is the particle velocity. The viscous drag of the fluid flowing around the disk can be neglected as the fluid and particle velocities are very close to each other in our experimental geometry, where $2\delta \sim h$
. The particle velocity can thus be determined by balancing the pressure force with the viscous dissipation in the gaps, yielding
$2\delta \sim h$
. The particle velocity can thus be determined by balancing the pressure force with the viscous dissipation in the gaps, yielding
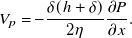 \begin{equation} V_p = -\frac {\delta (h+\delta )}{2\eta }\frac {\partial P}{\partial x}. \end{equation}
This equation shows that particle motion in our system is driven by the pressure gradient along the flow direction, mediated by a geometrical factor and the inverse of the viscosity.
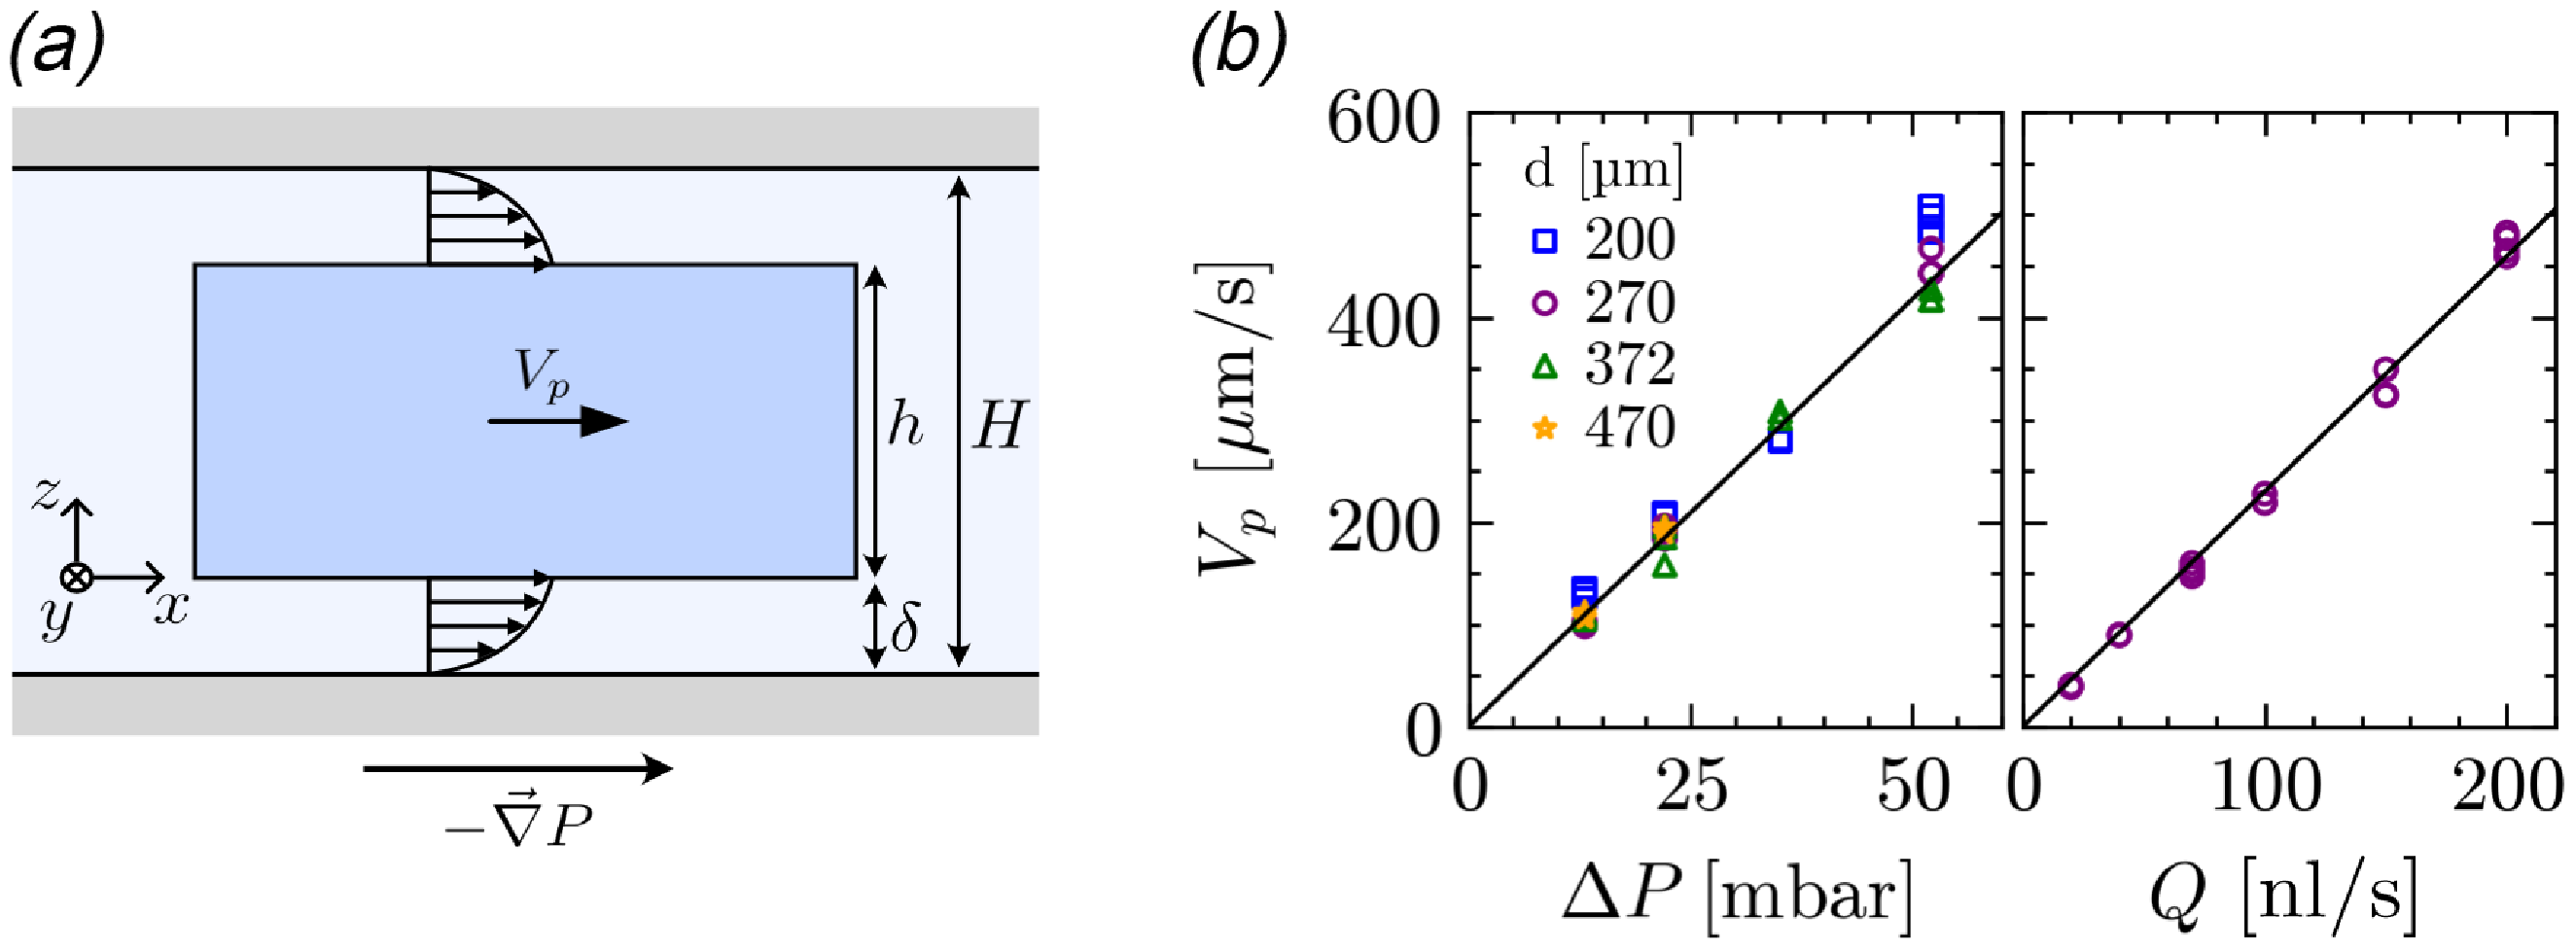
Figure 2. (a) Schematic side view of a particle with thickness $h$
inside a channel of height
$h$
inside a channel of height $H$
, subjected to a pressure gradient
$H$
, subjected to a pressure gradient $\vec \nabla P$
. The particle moves with velocity
$\vec \nabla P$
. The particle moves with velocity $V_p$
along the
$V_p$
along the $x$
direction, while the fluid flows through the gaps of thickness
$x$
direction, while the fluid flows through the gaps of thickness $\delta = (H - h)/2$
, following a Poiseuille–Couette profile. (b) Measurements of
$\delta = (H - h)/2$
, following a Poiseuille–Couette profile. (b) Measurements of $V_p$
in an empty channel for various particle diameters at different imposed pressure drops
$V_p$
in an empty channel for various particle diameters at different imposed pressure drops $\Delta P$
(left panel) and flow rates
$\Delta P$
(left panel) and flow rates $Q$
(right panel). The black lines correspond to Equation 4 without any adjusting parameter. In the pressure-imposed case,
$Q$
(right panel). The black lines correspond to Equation 4 without any adjusting parameter. In the pressure-imposed case, $Q$
is substituted by
$Q$
is substituted by $\Delta P/R_{0}$
, where
$\Delta P/R_{0}$
, where $R_{0}$
is the empty channel resistance, measured prior to experimentation using micro-PIV.
$R_{0}$
is the empty channel resistance, measured prior to experimentation using micro-PIV.
The pressure gradient along $x$
can be expressed as a function of the flow rate
$x$
can be expressed as a function of the flow rate $Q$
using the local hydraulic resistance
$Q$
using the local hydraulic resistance $R$
. In the simple case of a single particle in the straight section of the channel, the particle’s influence on the hydraulic resistance can be neglected, and
$R$
. In the simple case of a single particle in the straight section of the channel, the particle’s influence on the hydraulic resistance can be neglected, and $R$
can be approximated by the resistance of a slit channel with length
$R$
can be approximated by the resistance of a slit channel with length $L$
, height
$L$
, height $H$
and width
$H$
and width $w$
, expressed as
$w$
, expressed as $R = 12\eta L / (H^3w)$
. Substituting
$R = 12\eta L / (H^3w)$
. Substituting $\partial P/\partial x$
with
$\partial P/\partial x$
with $QR/L$
, Equation 3 gives
$QR/L$
, Equation 3 gives
 \begin{equation} V_p = \frac {6\delta (h+\delta )}{H^3} \frac {Q}{w}. \end{equation}
Equation 4 demonstrates that the velocity of a single particle in the channel is proportional to the flow rate $Q$
and scales inversely with the channel width
$Q$
and scales inversely with the channel width $w$
, with a prefactor that depends only on the channel and particle thickness. The validity of this proportionality is verified for varying particle diameters at different imposed flow rates and pressure drops, as shown in Figure 2(b). The black lines represent the predictions of Equation 4 for
$w$
, with a prefactor that depends only on the channel and particle thickness. The validity of this proportionality is verified for varying particle diameters at different imposed flow rates and pressure drops, as shown in Figure 2(b). The black lines represent the predictions of Equation 4 for $H=92$
µm,
$H=92$
µm, $\delta =21$
µm,
$\delta =21$
µm, $h=50$
µm and
$h=50$
µm and $w=5$
mm. In the pressure-imposed case,
$w=5$
mm. In the pressure-imposed case, $Q$
is replaced by
$Q$
is replaced by $\Delta P/R_{0}$
, where
$\Delta P/R_{0}$
, where $R_{0}=2.7 \times 10^{13}$
Pa.s.m
$R_{0}=2.7 \times 10^{13}$
Pa.s.m $^{-3}$
is the hydraulic resistance of the microfluidic system in the absence of particles, measured prior to experimentation using micro-PIV.
$^{-3}$
is the hydraulic resistance of the microfluidic system in the absence of particles, measured prior to experimentation using micro-PIV.
The driving mechanism in our system differs significantly from commonly studied granular hoppers, such as gravity- or conveyor-belt-driven hoppers. While particles in these systems are driven by a uniform force, the driving force in our microfluidic hopper is dependent on the fluid velocity, which scales inversely with channel width, causing particles to accelerate as they pass through the constriction. Another difference with other systems lies in the temporal variations of the driving force during particle discharge. In most granular hoppers, the driving force remains constant as the channel empties. However, in our microfluidic system, the driving force depends on the overall hydraulic resistance of the channel, which might be influenced by the presence of particles. This complex interplay between fluid flow and particles could potentially lead to a reduction in hydraulic resistance as the hopper empties, resulting in a progressive increase of the driving force during the discharge process. Since the evolution of the outflow rate during the particle discharge is non-trivial, we first studied the discharge of particles from our microfluidic hopper over time.
3. Particle discharge
3.1. Constant discharge rate and hydraulic resistance
We performed discharge experiments with varying particle diameters ( $170$
µm
$170$
µm $\leq d \leq$ $400$
µm), and two orifice widths (
$400$
µm), and two orifice widths ( $w_c = 600$
and
$w_c = 600$
and $900$
µm). In each experiment, we either imposed a flow rate,
$900$
µm). In each experiment, we either imposed a flow rate, $Q$
, or a pressure drop
$Q$
, or a pressure drop $\Delta P$
, and measured the number
$\Delta P$
, and measured the number $N(t)$
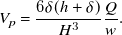
of particles discharged from the channel over time. Figure 3(a) presents typical discharge curves for different imposed flow rates and pressure drops at fixed size ratio
$N(t)$
of particles discharged from the channel over time. Figure 3(a) presents typical discharge curves for different imposed flow rates and pressure drops at fixed size ratio $w_c/d=3$
.
$w_c/d=3$
.
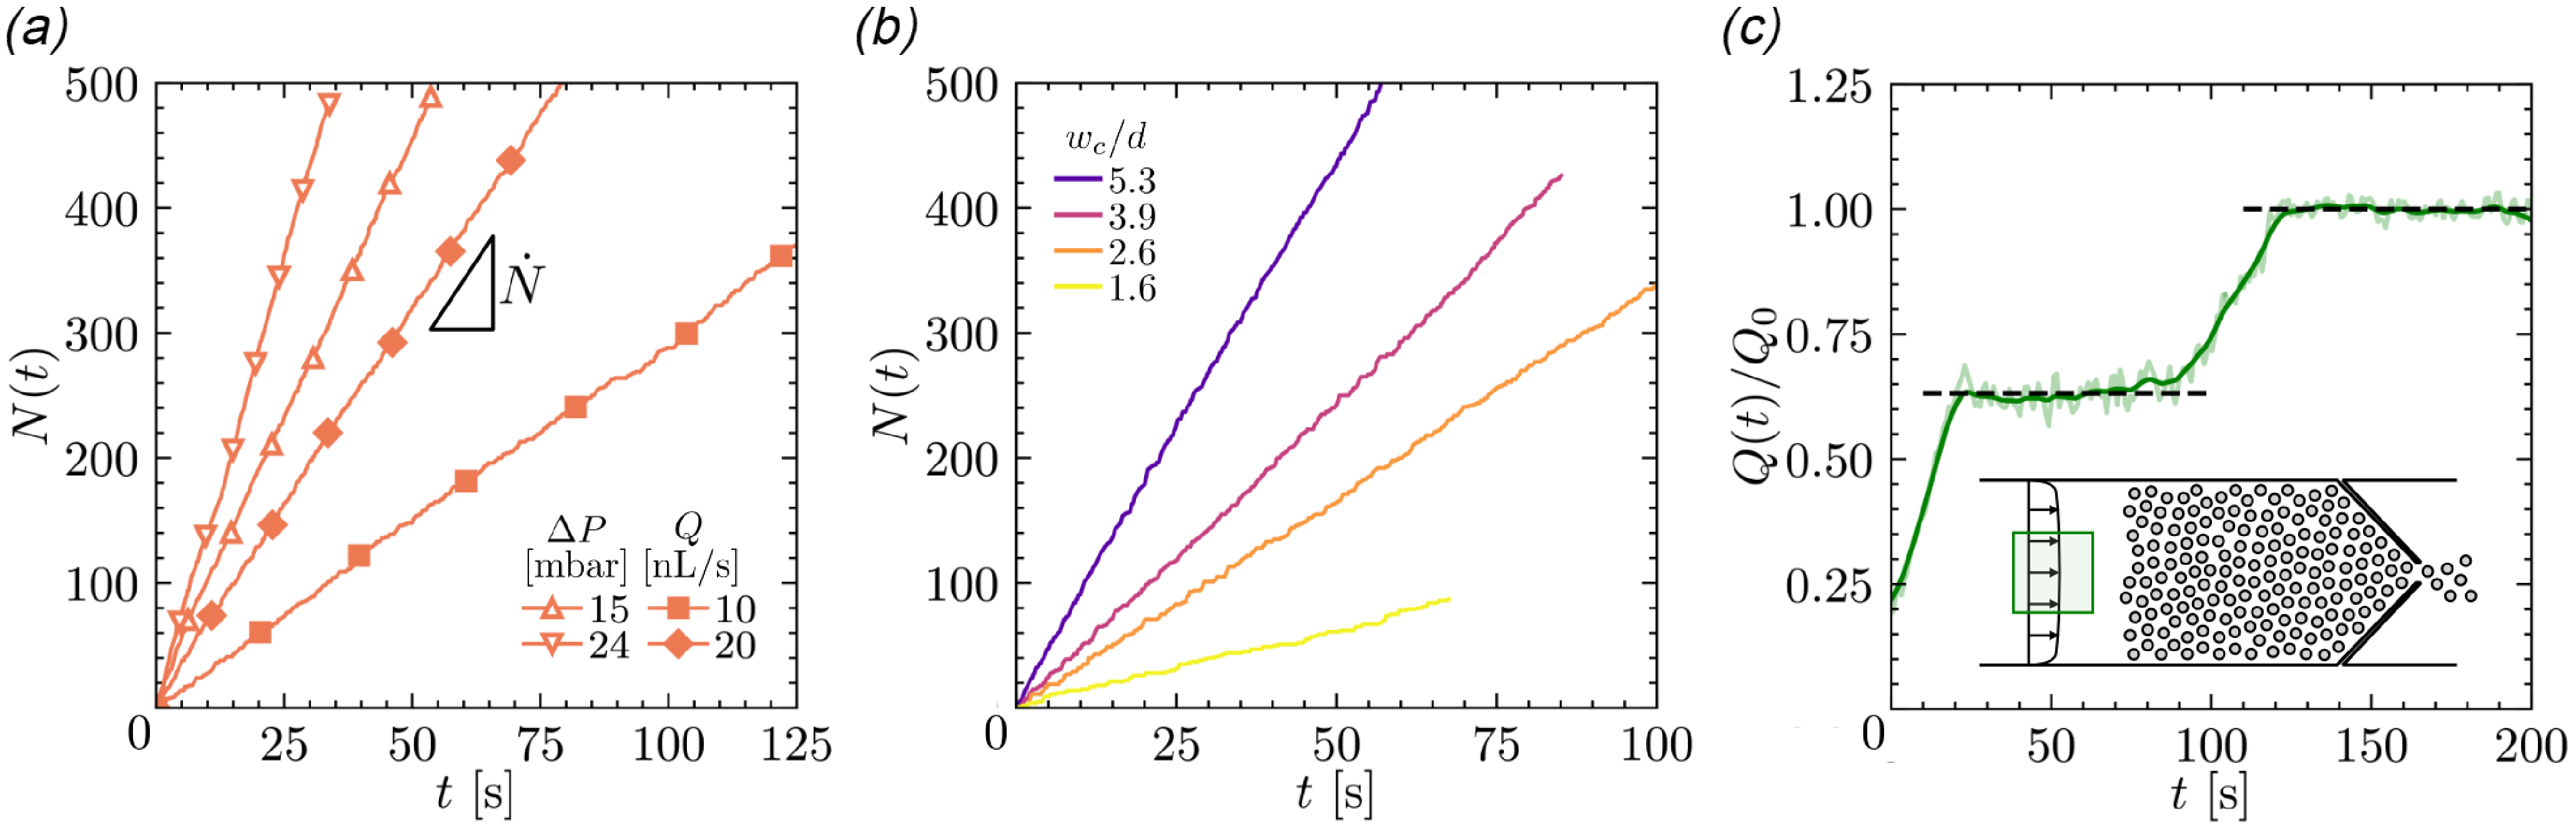
Figure 3. Discharge curves $N(t)$
for (a) different imposed flow rates
$N(t)$
for (a) different imposed flow rates $Q$
and pressure drops
$Q$
and pressure drops $\Delta P$
at fixed size ratio
$\Delta P$
at fixed size ratio $w_c/d=3$
, and (b) different orifice-to-particle size ratios
$w_c/d=3$
, and (b) different orifice-to-particle size ratios $w_c/d$
under a fixed pressure drop
$w_c/d$
under a fixed pressure drop $\Delta P=8$
mbar. All curves present a linear increase in the number of discharged particles
$\Delta P=8$
mbar. All curves present a linear increase in the number of discharged particles $N$
over time. Note that the symbols are used to distinguish the datasets; data were collected at a frequency of
$N$
over time. Note that the symbols are used to distinguish the datasets; data were collected at a frequency of $5$
Hz. Panel (c) presents micro-PIV measurements of the flow rate
$5$
Hz. Panel (c) presents micro-PIV measurements of the flow rate $Q(t)$
during a pressure-driven discharge with
$Q(t)$
during a pressure-driven discharge with $\Delta P=15$
mbar. The flow rate
$\Delta P=15$
mbar. The flow rate $Q(t)$
, deduced from fluid velocity measured in the region highlighted in green, is normalised by
$Q(t)$
, deduced from fluid velocity measured in the region highlighted in green, is normalised by $Q_0$
, its final value in an empty channel.
$Q_0$
, its final value in an empty channel.
For both driving methods, we observe that $N$
scales linearly with time, indicating a constant discharge rate
$N$
scales linearly with time, indicating a constant discharge rate $\dot N$
. This behaviour is expected under imposed flow rate, as the force exerted by the fluid on particles remains constant throughout the experiment. However, the constant discharge rate under imposed pressure is more surprising, as one would expect the hydraulic resistance
$\dot N$
. This behaviour is expected under imposed flow rate, as the force exerted by the fluid on particles remains constant throughout the experiment. However, the constant discharge rate under imposed pressure is more surprising, as one would expect the hydraulic resistance $R$
to decrease as the channel empties, leading to a progressive increase of the flow rate. This, in turn, should result in an increasing particle discharge rate, as also reported for gravity-driven submerged granular flows (Koivisto and Durian, Reference Koivisto and Durian2017; Wilson et al. Reference Wilson, Pfeifer, Meysingier and Durian2014).
$R$
to decrease as the channel empties, leading to a progressive increase of the flow rate. This, in turn, should result in an increasing particle discharge rate, as also reported for gravity-driven submerged granular flows (Koivisto and Durian, Reference Koivisto and Durian2017; Wilson et al. Reference Wilson, Pfeifer, Meysingier and Durian2014).
The constant discharge rate under imposed pressure conditions suggests that the hydraulic resistance $R$
of our experimental system remains unchanged throughout each experiment, despite the reduction in the number of particles within the channel. To verify this, we measured
$R$
of our experimental system remains unchanged throughout each experiment, despite the reduction in the number of particles within the channel. To verify this, we measured $Q(t)$
during a pressure-driven discharge experiment (
$Q(t)$
during a pressure-driven discharge experiment ( $\Delta P = 15$
mbar) using micro-PIV. In this configuration, particles are not observable, and their number within the channel remains unknown.
$\Delta P = 15$
mbar) using micro-PIV. In this configuration, particles are not observable, and their number within the channel remains unknown.
Figure 3(c) displays the temporal evolution of $Q(t)/Q_0$
throughout an experiment, with
$Q(t)/Q_0$
throughout an experiment, with $Q_0$
representing the final flow rate measured after full discharge. The valve is opened at
$Q_0$
representing the final flow rate measured after full discharge. The valve is opened at $t=0$
, and after a brief period (
$t=0$
, and after a brief period ( $\sim 20$
s) needed to initiate particle motion, the flow rate stabilises at approximately 60% of
$\sim 20$
s) needed to initiate particle motion, the flow rate stabilises at approximately 60% of $Q_0$
for approximately a minute, consistent with the typical duration of a discharge under these conditions (see Figure 3(a)). Eventually, the channel completely empties and the flow rate reaches
$Q_0$
for approximately a minute, consistent with the typical duration of a discharge under these conditions (see Figure 3(a)). Eventually, the channel completely empties and the flow rate reaches $Q_0$
. Since
$Q_0$
. Since $R = \Delta P/Q$
, this result confirms that the hydraulic resistance remains constant during most of the discharge process. The
$R = \Delta P/Q$
, this result confirms that the hydraulic resistance remains constant during most of the discharge process. The $\sim 40$
% decrease in
$\sim 40$
% decrease in $Q$
during particle discharge further indicates that
$Q$
during particle discharge further indicates that $R$
is not solely controlled by a predominantly high channel resistance, but is also governed by the presence of particles within the channel.
$R$
is not solely controlled by a predominantly high channel resistance, but is also governed by the presence of particles within the channel.
3.2. Hydraulic resistance controlled by particles at the orifice
While the previous experiments clearly demonstrate a constant outflow rate and hydraulic resistance during discharge, attributing this constant flow to the presence of particles is difficult, as we cannot observe particles at the orifice during micro-PIV measurements. To overcome this limitation, we conducted an additional experiment where we observed the flow of a dense particle packing through an empty constriction under imposed pressure conditions, while monitoring the mass of particles and fluid leaving the channel to measure $Q$
.
$Q$
.
Figure 4. (a) Temporal evolution of the discharged mass $m(t)$
and the constriction solid fraction
$m(t)$
and the constriction solid fraction $\phi (t)$
during the flow of a dense packing through an empty constriction. The grey vertical lines correspond to the snapshots of the channel shown in (b), labelled from A to F. Measurements of
$\phi (t)$
during the flow of a dense packing through an empty constriction. The grey vertical lines correspond to the snapshots of the channel shown in (b), labelled from A to F. Measurements of $\phi (t)$
are taken in the area outlined in white in the snapshots.
$\phi (t)$
are taken in the area outlined in white in the snapshots.
In this experiment, around $1000$
particles were first packed at the orifice, and then gently transported backward by a slight reverse flow, as to not disturb the packing. Once the packing was sufficiently distanced from the orifice (
$1000$
particles were first packed at the orifice, and then gently transported backward by a slight reverse flow, as to not disturb the packing. Once the packing was sufficiently distanced from the orifice ( $\sim 5$
mm), both fluid and particle flows were stopped by imposing zero pressure (
$\sim 5$
mm), both fluid and particle flows were stopped by imposing zero pressure ( $t\lt 0$
). At
$t\lt 0$
). At $t=0$
, a pressure drop of
$t=0$
, a pressure drop of $\Delta P = 8$
mbar was applied, driving the particles back towards the constriction. As the packing approached and passed through the tapered section, both the mass
$\Delta P = 8$
mbar was applied, driving the particles back towards the constriction. As the packing approached and passed through the tapered section, both the mass $m(t)$
exiting the channel and the solid fraction
$m(t)$
exiting the channel and the solid fraction $\phi (t)$
in the constriction were measured. Mass and solid fraction measurements are presented in Figure 4(a), while the corresponding snapshots of the channel, labelled from A to F, are shown in Figure 4(b). The region used to measure
$\phi (t)$
in the constriction were measured. Mass and solid fraction measurements are presented in Figure 4(a), while the corresponding snapshots of the channel, labelled from A to F, are shown in Figure 4(b). The region used to measure $\phi (t)$
in the constriction is highlighted in white on each snapshot.
$\phi (t)$
in the constriction is highlighted in white on each snapshot.
Three distinct phases can be identified, each with a constant flow rate, as indicated by the black dashed lines representing linear fits of $m(t)$
in Figure 4(a). During the first phase, the empty constriction (snapshot A) fills with particles as the dense packing enters the constriction (snapshot B), with a fitted flow rate of
$m(t)$
in Figure 4(a). During the first phase, the empty constriction (snapshot A) fills with particles as the dense packing enters the constriction (snapshot B), with a fitted flow rate of $Q_1\approx 27.0$
nl/s. Once the tapered section becomes completely filled with particles, the solid fraction
$Q_1\approx 27.0$
nl/s. Once the tapered section becomes completely filled with particles, the solid fraction $\phi$
reaches a maximum value of
$\phi$
reaches a maximum value of $\phi \approx 0.83$
(snapshots C and D). During this second phase,
$\phi \approx 0.83$
(snapshots C and D). During this second phase, $\phi$
remains constant, except around
$\phi$
remains constant, except around $t=350$
s, when a transient clog forms, slightly compacting the particles further. The second phase is characterised by a significantly reduced flow rate, with a fitted value of
$t=350$
s, when a transient clog forms, slightly compacting the particles further. The second phase is characterised by a significantly reduced flow rate, with a fitted value of $Q_2\approx 6.0$
nl/s
$Q_2\approx 6.0$
nl/s $\approx 0.2Q_1$
. Finally, the number of particles within the channel becomes insufficient to completely fill the constriction (snapshot E), and
$\approx 0.2Q_1$
. Finally, the number of particles within the channel becomes insufficient to completely fill the constriction (snapshot E), and $\phi$
decreases until nearly no particles remain in the channel (snapshot F). During this final phase, the flow rate rises back to
$\phi$
decreases until nearly no particles remain in the channel (snapshot F). During this final phase, the flow rate rises back to $Q_3\approx 27.6$
nl/s
$Q_3\approx 27.6$
nl/s $\approx 1.02Q_1$
.
$\approx 1.02Q_1$
.
These results indicate that the flow rate $Q$
and hydraulic resistance
$Q$
and hydraulic resistance $R$
during particle discharge are primarily controlled by the presence of densely packed particles within the tapered section, regardless of the total number of particles in the channel. This suggests that the global behaviour of the system is governed by local processes, with most of the energy dissipation arising from the dense packing being squeezed through the constriction. Energy dissipation may occur through particle rearrangements, particle–wall interactions, or by viscous dissipation due to large velocity fluctuations. Although the exact origin of this dissipation in the tapered section remains to be understood, the constant hydraulic resistance and the subsequent constant discharge rate allow for a comparison with other commonly studied hopper flows. In the next two sections, we will show that our experimental system recovers similar scaling laws for the outflow and clogging of hard monodisperse disks through a constriction as observed in other dry and suspension systems.
$R$
during particle discharge are primarily controlled by the presence of densely packed particles within the tapered section, regardless of the total number of particles in the channel. This suggests that the global behaviour of the system is governed by local processes, with most of the energy dissipation arising from the dense packing being squeezed through the constriction. Energy dissipation may occur through particle rearrangements, particle–wall interactions, or by viscous dissipation due to large velocity fluctuations. Although the exact origin of this dissipation in the tapered section remains to be understood, the constant hydraulic resistance and the subsequent constant discharge rate allow for a comparison with other commonly studied hopper flows. In the next two sections, we will show that our experimental system recovers similar scaling laws for the outflow and clogging of hard monodisperse disks through a constriction as observed in other dry and suspension systems.
4. Applications
4.1. Beverloo-like discharge
As discussed previously, the flow of particles through a bottleneck under gravity is usually described by the Beverloo law. In the two-dimensional (2-D) case, this law is commonly expressed as
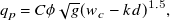 \begin{equation} q_p = C \phi \sqrt {g} (w_c - k d)^{1.5}, \end{equation}
where $q_p$
is the particle volumetric discharge rate,
$q_p$
is the particle volumetric discharge rate, $\phi$
the particle solid fraction and
$\phi$
the particle solid fraction and $g$
the acceleration due to gravity, while
$g$
the acceleration due to gravity, while $k$
and
$k$
and $C$
are two fitting parameters (Beverloo et al. Reference Beverloo, Leniger and van de Velde1961). The Beverloo law is based on the assumption that the discharge of particles through a constriction is limited by (i) an effective outlet size
$C$
are two fitting parameters (Beverloo et al. Reference Beverloo, Leniger and van de Velde1961). The Beverloo law is based on the assumption that the discharge of particles through a constriction is limited by (i) an effective outlet size $w_c-kd$
, which accounts for a no-flow zone along the orifice margins, and (ii) the exit velocity of particles within the orifice, which scales as
$w_c-kd$
, which accounts for a no-flow zone along the orifice margins, and (ii) the exit velocity of particles within the orifice, which scales as $\sqrt {g} \, (w_c-kd)^{0.5}$
under gravity. Although the Beverloo scaling efficiently describes particle discharge in a wide range of configurations, it remains semi-empirical. Subsequent studies have shown that the
$\sqrt {g} \, (w_c-kd)^{0.5}$
under gravity. Although the Beverloo scaling efficiently describes particle discharge in a wide range of configurations, it remains semi-empirical. Subsequent studies have shown that the $kd$
correction arises from density variations near the outlet, and that the particle discharge rate can be derived by integrating the velocity and density profiles along the orifice (Janda et al. Reference Janda, Zuriguel and Maza2012; Mankoc et al. Reference Mankoc, Janda, Arévalo, Pastor, Zuriguel, Garcimartín and Maza2007).
$kd$
correction arises from density variations near the outlet, and that the particle discharge rate can be derived by integrating the velocity and density profiles along the orifice (Janda et al. Reference Janda, Zuriguel and Maza2012; Mankoc et al. Reference Mankoc, Janda, Arévalo, Pastor, Zuriguel, Garcimartín and Maza2007).
In this section, we examine the particle discharge rate in our system and compare the obtained scalings with those observed in conventional systems. To this end, we performed both flow rate- and pressure-driven discharge experiments, varying the driving intensity, orifice width and particle diameter. In each experiment, we determined the discharge rate $\dot N$
by fitting the slope of the particle outflow over time,
$\dot N$
by fitting the slope of the particle outflow over time, $N(t)$
, and deduced the volumetric particle discharge rate
$N(t)$
, and deduced the volumetric particle discharge rate $q_p = \dot N \pi h d^2/4$
. Additionally, we measured the solid fraction
$q_p = \dot N \pi h d^2/4$
. Additionally, we measured the solid fraction $\phi$
and particle velocity
$\phi$
and particle velocity $V_{\mathrm{out}}$
at the channel outlet to identify the potential origins of variations in
$V_{\mathrm{out}}$
at the channel outlet to identify the potential origins of variations in $q_p$
between experiments. In our system, these quantities are related through
$q_p$
between experiments. In our system, these quantities are related through
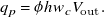 \begin{equation} q_p =\phi hw_cV_{\mathrm{out}}. \end{equation}
Figure 5(a) shows $\phi$
measurements for each experiment, under both imposed flow rate and pressure conditions. The solid fraction at the outlet appears to be solely controlled by the size ratio
$\phi$
measurements for each experiment, under both imposed flow rate and pressure conditions. The solid fraction at the outlet appears to be solely controlled by the size ratio $d/w_c$
, independent of the nature and intensity of the driving. The variations in
$d/w_c$
, independent of the nature and intensity of the driving. The variations in $\phi$
with
$\phi$
with $d/w_c$
can be described by the linear relationship
$d/w_c$
can be described by the linear relationship
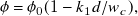 \begin{equation} \phi = \phi _0 (1-k_1 d/w_c), \end{equation}
with fitted values $\phi _0 = 0.83$
and
$\phi _0 = 0.83$
and $k_1=0.78$
, suggesting a simple geometric dilution in the tapered section. This dilution has a different origin than in gravity-driven systems, where density variations primarily result from the particles accelerating during their free fall through the orifice (Janda et al. Reference Janda, Zuriguel and Maza2012).
$k_1=0.78$
, suggesting a simple geometric dilution in the tapered section. This dilution has a different origin than in gravity-driven systems, where density variations primarily result from the particles accelerating during their free fall through the orifice (Janda et al. Reference Janda, Zuriguel and Maza2012).
The exit particle velocity $V_{\mathrm{out}}$
is expected to slightly deviate from the prediction of Equation 4, which was derived for a single particle in an empty channel. The velocity of particles in a freely flowing packing can be obtained by decomposing the system into three layers: a dense particle layer of thickness
$V_{\mathrm{out}}$
is expected to slightly deviate from the prediction of Equation 4, which was derived for a single particle in an empty channel. The velocity of particles in a freely flowing packing can be obtained by decomposing the system into three layers: a dense particle layer of thickness $h$
at the centre of the channel, where the particles and the interstitial fluid move at a velocity
$h$
at the centre of the channel, where the particles and the interstitial fluid move at a velocity $V_p$
, and two fluid layers of thickness
$V_p$
, and two fluid layers of thickness $\delta$
above and below the particle layer. The pressure gradient experienced by particles in the packing can be determined by expressing the total flow rate
$\delta$
above and below the particle layer. The pressure gradient experienced by particles in the packing can be determined by expressing the total flow rate $Q=q_c + q_g$
, where
$Q=q_c + q_g$
, where $q_c$
and
$q_c$
and $q_g$
are the flow rates in the central layer and the fluid gaps, respectively. The flow rate in the central layer is given by
$q_g$
are the flow rates in the central layer and the fluid gaps, respectively. The flow rate in the central layer is given by $q_c = hwV_p$
. The flow rate in the gaps is obtained by integrating a Couette–Poiseuille velocity profile with wall velocity
$q_c = hwV_p$
. The flow rate in the gaps is obtained by integrating a Couette–Poiseuille velocity profile with wall velocity $V_p$
in each gap, yielding
$V_p$
in each gap, yielding $q_g = w \delta V_p - (w \delta ^3 / 6\eta )\, \partial P / \partial x$
. Substituting
$q_g = w \delta V_p - (w \delta ^3 / 6\eta )\, \partial P / \partial x$
. Substituting $V_p$
from Equation 3, we obtain a relationship between pressure gradient and total flow rate, from which we deduce the theoretical particle velocity at the outlet
$V_p$
from Equation 3, we obtain a relationship between pressure gradient and total flow rate, from which we deduce the theoretical particle velocity at the outlet
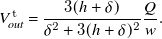 \begin{equation} V_{\textit{out}}^{\mathrm{t}} = \frac {3(h+\delta )}{\delta ^2 + 3(h+\delta )^2}\frac {Q}{w}. \end{equation}
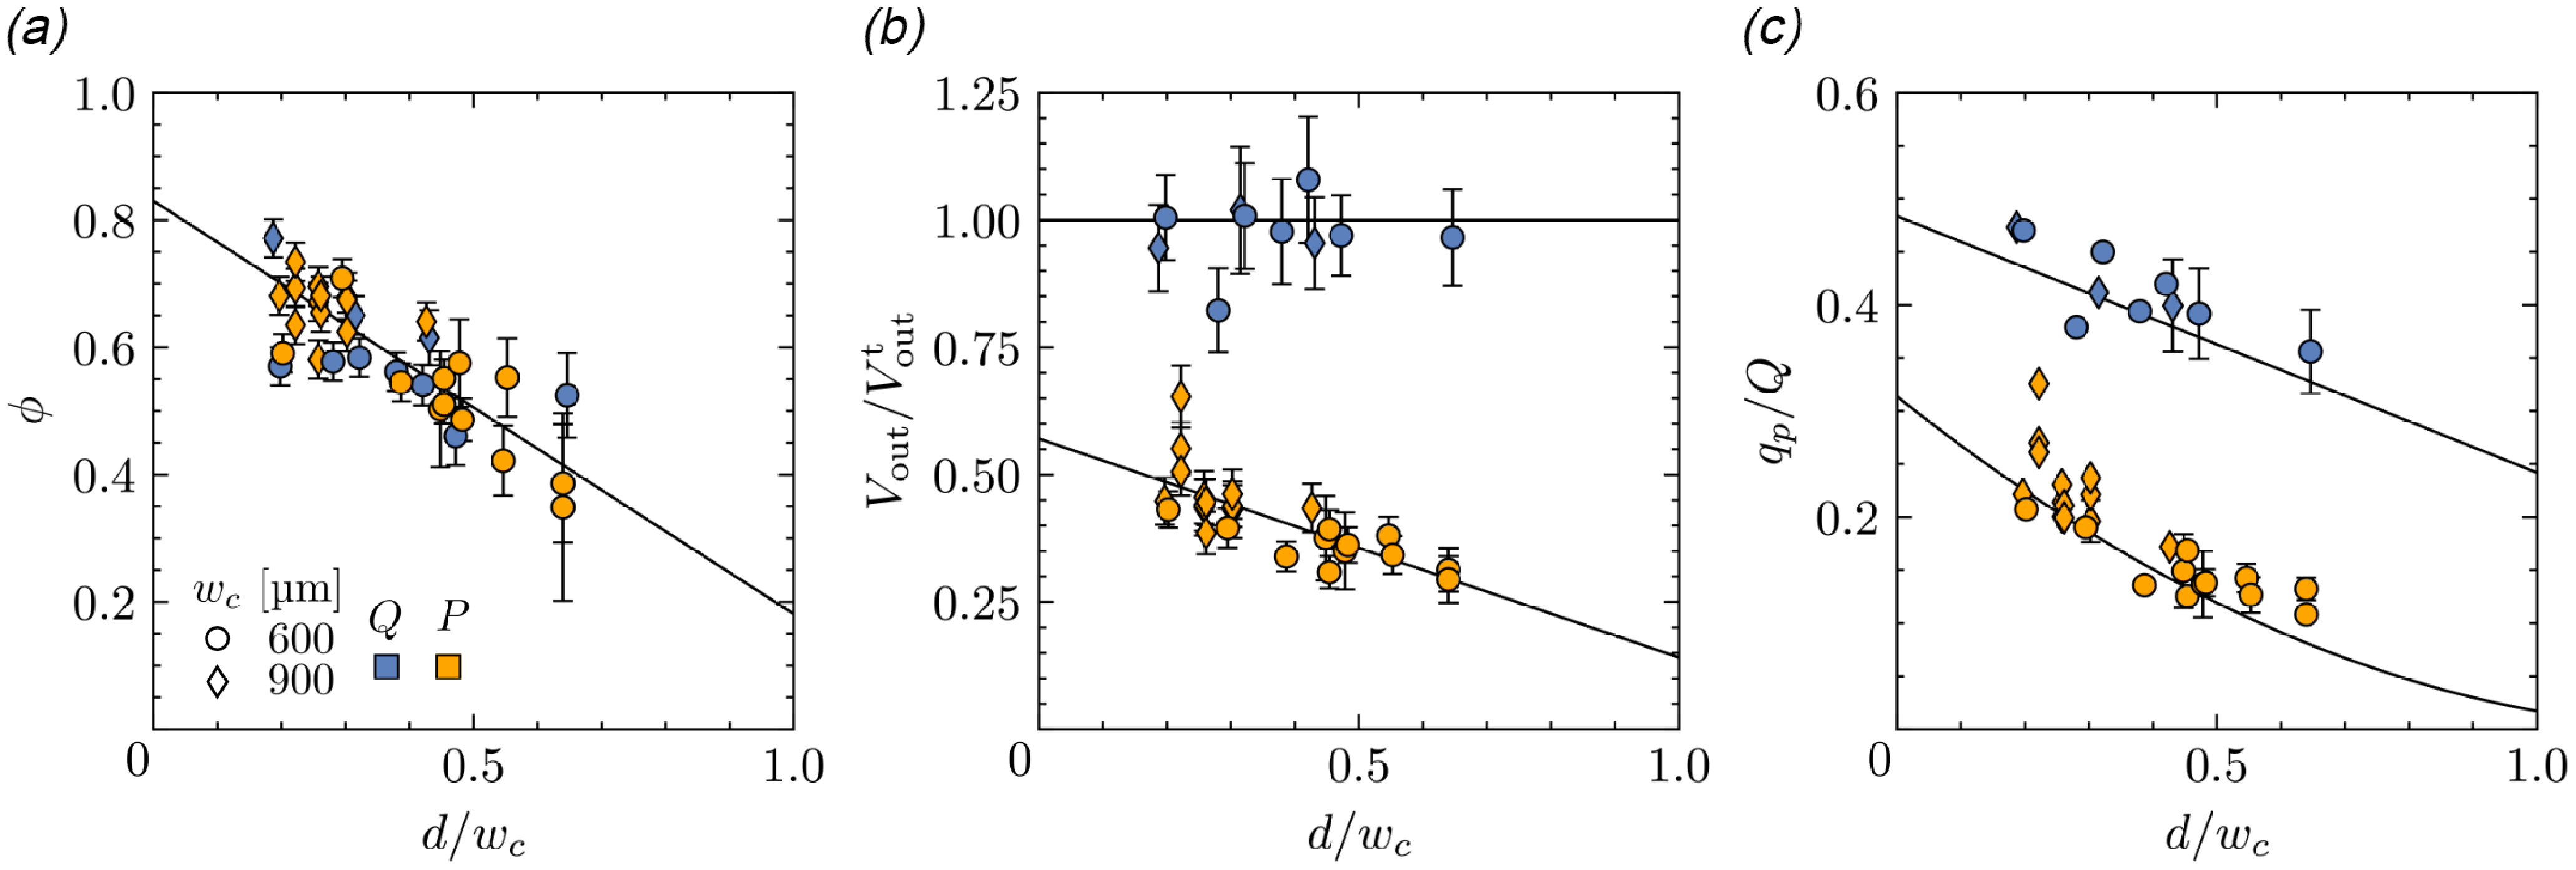
Figure 5. Experimental measurements under imposed flow rate (blue markers) or pressure drop (orange markers), shown as a function of the size ratio $d/w_c$
. (a) Particle solid fraction at the outlet
$d/w_c$
. (a) Particle solid fraction at the outlet $\phi$
, compared with the expression from Equation 7 (solid line). (b) Outlet velocity
$\phi$
, compared with the expression from Equation 7 (solid line). (b) Outlet velocity $V_{\mathrm{out}}$
, normalised by the theoretical prediction from Equation 8; solid lines correspond to
$V_{\mathrm{out}}$
, normalised by the theoretical prediction from Equation 8; solid lines correspond to $V_{\mathrm{out}} = V_{\mathrm{out}}^{\mathrm{t}}$
under imposed flow rate, and to the fit of Equation 9 under imposed pressure. (c) Particle discharge rate,
$V_{\mathrm{out}} = V_{\mathrm{out}}^{\mathrm{t}}$
under imposed flow rate, and to the fit of Equation 9 under imposed pressure. (c) Particle discharge rate, $q_p$
, normalised by the total flow rate
$q_p$
, normalised by the total flow rate $Q$
(flow-rate-driven case) or
$Q$
(flow-rate-driven case) or $Q_0 = \Delta P / R_0$
(pressure-driven case), and compared with Equations 10 and 11.
$Q_0 = \Delta P / R_0$
(pressure-driven case), and compared with Equations 10 and 11.
Figure 5(b) shows the ratio $V_{\mathrm{out}}/V_{\mathrm{out}}^{\mathrm{t}}$
between measured velocities and theoretical predictions from Equation 8, where
$V_{\mathrm{out}}/V_{\mathrm{out}}^{\mathrm{t}}$
between measured velocities and theoretical predictions from Equation 8, where $Q$
is replaced by
$Q$
is replaced by $Q_0 = \Delta P/R_{0}$
in the pressure-driven case. The results differ significantly depending on the driving mechanism. Under imposed flow rate,
$Q_0 = \Delta P/R_{0}$
in the pressure-driven case. The results differ significantly depending on the driving mechanism. Under imposed flow rate, $V_{\mathrm{out}}$
is independent of the particle diameter and is well described by Equation 8, with an adjusted gap thickness
$V_{\mathrm{out}}$
is independent of the particle diameter and is well described by Equation 8, with an adjusted gap thickness $\delta =18$
µm, fitted to account for slight misalignment of particles in the central layer. In contrast, the exit particle velocity under imposed pressure appears to vary with the size ratio
$\delta =18$
µm, fitted to account for slight misalignment of particles in the central layer. In contrast, the exit particle velocity under imposed pressure appears to vary with the size ratio $d/w_c$
, with measured values significantly lower than predicted.
$d/w_c$
, with measured values significantly lower than predicted.
Variations in $V_{\mathrm{out}}$
are attributed to the coupling between particle outflow and hydraulic resistance under imposed pressure, indicating an increasing energy dissipation with the size ratio
$V_{\mathrm{out}}$
are attributed to the coupling between particle outflow and hydraulic resistance under imposed pressure, indicating an increasing energy dissipation with the size ratio $d/w_c$
. Although the precise mechanisms underlying this dissipation remain unclear, its influence on the outlet velocity can be fitted by a linear relationship of the form
$d/w_c$
. Although the precise mechanisms underlying this dissipation remain unclear, its influence on the outlet velocity can be fitted by a linear relationship of the form
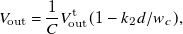 \begin{equation} V_{\mathrm{out}} = \frac {1}{C}V_{\mathrm{out}}^{\mathrm{t}} (1 - k_2 d/w_c), \end{equation}
where $C$
reflects the increase in hydraulic resistance due to particle presence in the channel, and
$C$
reflects the increase in hydraulic resistance due to particle presence in the channel, and $k_2$
accounts for additional influence of
$k_2$
accounts for additional influence of $d/w_c$
. The empirical fit given by Equation 9 is shown in Figure 5(b), with fitted values
$d/w_c$
. The empirical fit given by Equation 9 is shown in Figure 5(b), with fitted values $C=1.75$
and
$C=1.75$
and $k_2=0.75$
. We should emphasise that the actual dependence of
$k_2=0.75$
. We should emphasise that the actual dependence of $R$
and
$R$
and $V_{\mathrm{out}}$
on
$V_{\mathrm{out}}$
on $d/w_c$
is likely more complex than the linear form assumed here.
$d/w_c$
is likely more complex than the linear form assumed here.
Incorporating both the variations of $\phi$
and
$\phi$
and $V_{\mathrm{out}}$
in Equation 6, we obtain two different scalings for the particle discharge rate depending on the driving mechanism. Under imposed flow rate
$V_{\mathrm{out}}$
in Equation 6, we obtain two different scalings for the particle discharge rate depending on the driving mechanism. Under imposed flow rate $Q$
, particle dilution at the outlet leads to a Beverloo-like scaling
$Q$
, particle dilution at the outlet leads to a Beverloo-like scaling
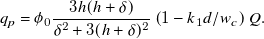 \begin{equation} q_p = \phi _0\frac {3h(h+\delta )}{\delta ^2 + 3(h+\delta )^2}\left ( 1 - k_1d/w_c\right )Q. \end{equation}
This scaling is similar to that obtained in conveyor belt systems, where the outlet velocity is also imposed, and variations of the particle outflow rate stem from changes in the solid fraction near the orifice (Aguirre et al. Reference Aguirre, Grande, Calvo, Pugnaloni and Géminard2010; De-Song et al. Reference De-Song, Xun-Sheng, Guang-Lei, Zheng-Quan, Xiao-Wei and Kun-Quan2003). Under an imposed pressure drop $\Delta P$
, variations of the system resistance add to the outlet dilution, resulting in a nonlinear dependence of the discharge rate on
$\Delta P$
, variations of the system resistance add to the outlet dilution, resulting in a nonlinear dependence of the discharge rate on $d/w_c$
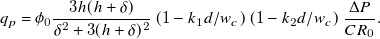 \begin{equation} q_p = \phi _0\frac {3h(h+\delta )}{\delta ^2 + 3(h+\delta )^2}\left ( 1 - k_1d/w_c\right )\left (1-k_2 d/w_c\right ) \frac {\Delta P}{CR_0}. \end{equation}
Predicted values of $q_p/Q$
under imposed flow rate and
$q_p/Q$
under imposed flow rate and $q_pR_0/\Delta P$
under imposed pressure are compared with experimental measurements for both driving mechanisms in Figure 5(c), showing satisfying agreement.
$q_pR_0/\Delta P$
under imposed pressure are compared with experimental measurements for both driving mechanisms in Figure 5(c), showing satisfying agreement.
4.2. Clogging
We now examine the clogging of particles in our experimental set-up. Clogging is usually characterised by the number of particles, $s$
, exiting the channel before clog formation, commonly referred to as the avalanche size. Both experimental (Marin and Souzy, Reference Marin and Souzy2025) and theoretical (Helbing et al. Reference Helbing, Johansson, Mathiesen, Jensen and Hansen2006) studies have widely demonstrated that the avalanche size distribution follows an exponential decay. This behaviour arises from the stochastic nature of clogging, where each particle exiting the channel has an equal probability
$s$
, exiting the channel before clog formation, commonly referred to as the avalanche size. Both experimental (Marin and Souzy, Reference Marin and Souzy2025) and theoretical (Helbing et al. Reference Helbing, Johansson, Mathiesen, Jensen and Hansen2006) studies have widely demonstrated that the avalanche size distribution follows an exponential decay. This behaviour arises from the stochastic nature of clogging, where each particle exiting the channel has an equal probability $p_{\rm clog}$
of forming a clog, resulting in a geometric distribution of the avalanche size probability
$p_{\rm clog}$
of forming a clog, resulting in a geometric distribution of the avalanche size probability
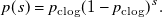 \begin{equation} p(s) = p_{\rm clog} (1-p_{\rm clog})^s. \end{equation}
The average avalanche size, $\langle s \rangle$
, which is related to the clogging probability by
$\langle s \rangle$
, which is related to the clogging probability by $\langle s \rangle = (1-p_{\rm clog})/p_{\rm clog}$
, strongly depends on the ratio of the orifice width
$\langle s \rangle = (1-p_{\rm clog})/p_{\rm clog}$
, strongly depends on the ratio of the orifice width $w_c$
to the particle diameter
$w_c$
to the particle diameter $d$
. In 2-D gravity-driven systems,
$d$
. In 2-D gravity-driven systems, $\langle s \rangle$
can be described by an exponential-square growth with
$\langle s \rangle$
can be described by an exponential-square growth with $w_c/d$
, expressed as
$w_c/d$
, expressed as
 \begin{equation} \langle s \rangle = A e^{B \left ( w_c/d\right ) ^{2}} - 1, \end{equation}
where $A$
and
$A$
and $B$
are two constants (Janda et al. Reference Janda, Zuriguel, Garcimartín, Pugnaloni and Maza2008; To, Reference To2005).
$B$
are two constants (Janda et al. Reference Janda, Zuriguel, Garcimartín, Pugnaloni and Maza2008; To, Reference To2005).
In this section, we verify that our microfluidic system recovers the same scaling laws for clogging as observed in other systems. To this end, we conducted discharge experiments using disk-shaped particles with diameters ranging from $268$
to
$268$
to $378$
µm. Particles were discharged through a constriction of width
$378$
µm. Particles were discharged through a constriction of width $w_c=600$
µm, resulting in orifice-to-particle size ratios
$w_c=600$
µm, resulting in orifice-to-particle size ratios $w_c/d$
between 1.59 and 2.24. The discharge experiments were pressure driven (
$w_c/d$
between 1.59 and 2.24. The discharge experiments were pressure driven ( $\Delta P = 8$
mbar) rather than flow rate driven, as pressure controllers have a faster response time than syringe pumps. We considered that the channel was clogged when an arch of particles formed at the constriction and persisted for more than 3 s, exceeding the maximum Stokes time near the outlet measured across all experiments (
$\Delta P = 8$
mbar) rather than flow rate driven, as pressure controllers have a faster response time than syringe pumps. We considered that the channel was clogged when an arch of particles formed at the constriction and persisted for more than 3 s, exceeding the maximum Stokes time near the outlet measured across all experiments ( $\tau = d/V_p\approx 2$
s). Since all clogging arches were broken after 3 s, the lifetime of clogs in our set-up was not investigated. However, the fraction of transient clogs in our system is expected to be reduced compared with previously studied systems (Souzy et al. Reference Souzy, Zuriguel and Marin2020; Souzy and Marin, Reference Souzy and Marin2022), due to the 2-D geometry and the presence of gaps above and below the particle layer.
$\tau = d/V_p\approx 2$
s). Since all clogging arches were broken after 3 s, the lifetime of clogs in our set-up was not investigated. However, the fraction of transient clogs in our system is expected to be reduced compared with previously studied systems (Souzy et al. Reference Souzy, Zuriguel and Marin2020; Souzy and Marin, Reference Souzy and Marin2022), due to the 2-D geometry and the presence of gaps above and below the particle layer.
Figure 6. (a) Histogram showing the number of events $N$
in which
$N$
in which $s$
particles escape the channel before clog formation, for a fixed size ratio
$s$
particles escape the channel before clog formation, for a fixed size ratio $w_c/d=1.59$
. The solid line represents an exponential distribution. (b) Probability distribution function of the normalised avalanche size
$w_c/d=1.59$
. The solid line represents an exponential distribution. (b) Probability distribution function of the normalised avalanche size $s/\langle s \rangle$
for all size ratios considered, fitted with an exponential law. (c) Plot of
$s/\langle s \rangle$
for all size ratios considered, fitted with an exponential law. (c) Plot of $ln ( \langle s \rangle + 1)$
as a function of
$ln ( \langle s \rangle + 1)$
as a function of $( w_c/d)^2$
. The solid line is a linear fit, and error bars are obtained using a bootstrapping method applied to each dataset. All experiments were performed under a fixed pressure drop
$( w_c/d)^2$
. The solid line is a linear fit, and error bars are obtained using a bootstrapping method applied to each dataset. All experiments were performed under a fixed pressure drop $\Delta P = 8$
mbar.
$\Delta P = 8$
mbar.
For each particle size considered, the avalanche size distribution $N(s)$
was determined by measuring
$N(s)$
was determined by measuring $s$
over a large number of clogs. Avalanches with fewer than four particles were excluded, as they may involve pre-existing clogging arches. Each distribution can be described by an exponential fit, as indicated by the black line in Figure 6(a) for
$s$
over a large number of clogs. Avalanches with fewer than four particles were excluded, as they may involve pre-existing clogging arches. Each distribution can be described by an exponential fit, as indicated by the black line in Figure 6(a) for $w_c/d=1.59$
. We verified that all distributions collapsed on the same exponential law when normalised by the average avalanche size (Figure 6(b)), consistent with prior studies. Additionally, we show in Figure 6(c) that the evolution of
$w_c/d=1.59$
. We verified that all distributions collapsed on the same exponential law when normalised by the average avalanche size (Figure 6(b)), consistent with prior studies. Additionally, we show in Figure 6(c) that the evolution of $\langle s \rangle$
with
$\langle s \rangle$
with $w_c/d$
in our experimental set-up is consistent with the scaling of Equation 13, with
$w_c/d$
in our experimental set-up is consistent with the scaling of Equation 13, with $\ln {\left (\langle s \rangle + 1 \right )}$
increasing linearly with
$\ln {\left (\langle s \rangle + 1 \right )}$
increasing linearly with $\left ( w_c / d\right )^2$
across the range of orifice-to-particle size ratios considered. Note that
$\left ( w_c / d\right )^2$
across the range of orifice-to-particle size ratios considered. Note that $\langle s \rangle$
is calculated by dividing the total number of discharged particles by the total number of clogs detected for a given particle size. This method is more accurate than averaging
$\langle s \rangle$
is calculated by dividing the total number of discharged particles by the total number of clogs detected for a given particle size. This method is more accurate than averaging $s$
over all clogging events, as the latter approach excludes large avalanches that do not result in a clog.
$s$
over all clogging events, as the latter approach excludes large avalanches that do not result in a clog.
4.3. Perspectives
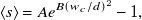
In this paper, we focused exclusively on the flow of hard, monodisperse disk-shaped particles to characterise our experimental system and compare it with other well-established systems. However, the versatility of our experimental set-up makes it an excellent model system for exploring more complex scenarios. In the following paragraphs, we outline perspectives for future works on hopper flow, and more broadly, in any 2-D flow configuration.
The shape of particles can be easily controlled in our experimental set-up by changing the design of the UV mask used during particle fabrication. This method provides a fast and effective way of varying particle shape, opening new perspectives for studying the flow dynamics of non-circular grains. The fine and rapid control over particle shape enables systematic studies of shape properties through gradual changes, such as by precisely adjusting the aspect ratio of elongated particles, as seen in Figure 7(a). Since there is no flow during the fabrication process, particles with different shapes can also be combined by first printing a batch of particles, then changing the UV mask and printing another batch in the remaining spaces. This method can be applied to fabricate circular particles with finely controlled polydispersity, or even mixtures of particles with different shapes, as illustrated in Figure 7(b) for a disk–fibre mixture.
In addition to particle shape, our experimental set-up provides a relatively precise way to modulate particle deformability, either by changing the composition of the cross-linking solution (Duprat et al. Reference Duprat, Berthet, Wexler, du Roure and Lindner2014), or by fabricating thin, slender structures that can deform under flow (Cappello et al. Reference Cappello, Bechert, Duprat, du Roure, Gallaire and Lindner2019). More complex situations combining particles of different deformability can also be achieved, as illustrated in Figure 7(c), where hard disks are embedded within flexible rings (see Supplementary Movie 5). Although all the examples provided involve dense packings, dilute configurations can also be achieved with our experimental system, as the in situ fabrication method provides precise control over the spatial distribution of particles before flow.
Figure 7. Examples of discharge experiments with (a) elongated grains, (b) a mixture of disks and rigid fibres and (c) disks embedded within flexible rings (see Supplementary Movie 5).
5. Conclusion
In this paper, we presented a 2-D microfluidic set-up designed to investigate the flow and clogging of particles in confined geometries. This innovative set-up relies on an in situ particle fabrication method, which enables easy and precise control over the particle shape, deformability and volume fraction. Experiments were conducted in a microfluidic hopper channel, where a Quake valve positioned immediately after the constriction was used to concentrate particles up to the maximum packing fraction. Our study focused on the flow of a dense packing of hard, monodisperse, disk-shaped particles through a bottleneck under both imposed flow rate and pressure conditions.
We have shown that, despite fundamental differences between our microfluidic system and typical dry granular systems, particles discharge at a constant rate under both imposed flow rate and pressure conditions in our experimental set-up. This constant particle outflow rate arises from the fact that the hydraulic resistance is constant during the entire discharge, and dominated by the presence of densely packed particles within the tapered section of the hopper. We also demonstrated by measuring the particle discharge rate for varying driving intensities, particle diameters and constriction widths that the outflow of particles in our system depends on the flow driving mechanism. While the discharge follows a Beverloo-like scaling under imposed flow rate due to particle dilution at the orifice, it exhibits a nonlinear dependence on the particle-to-outlet size ratio under imposed pressure, resulting from both outlet dilution and a coupling between particle outflow and channel resistance. Finally, we showed that the statistics of clog formation in our experimental system follow the same stochastic laws as reported in other systems.
The good agreement between our experimental results and other commonly studied systems proves its utility in studying the discharge and clogging of particulate suspensions in various 2-D configurations. The versatility of our microfluidic system allows for future investigation of the role of particle shape, size distribution and deformability in the outflow and clogging of suspended particles through a bottleneck.
Supplementary movies
The supplementary movies for this article can be found at https://doi.org/10.1017/flo.2025.10019.
Acknowledgements
This work benefited from the technical contribution of the joint service unit CNRS UAR 3750. The authors thank the engineers of this unit for their advice during the development of the experiments.
Data availability
The data that support the plots within this paper and other findings of this study are available from the corresponding author upon request.
Funding statement
L.K. and A.L. acknowledge funding from the European Union’s Horizon 2020 Research and Innovation Program CALIPER under the Marie Skłodowska-Curie grant agreement number 812638. J.T. acknowledges funding from ENS de Lyon through a CDSN grant. We thank Institut Pierre-Gilles de Gennes (Investissements d'avenir ANR-10-EQPX-34) and acknowledge IdEx (ANR-18-IDEX-0001).
Competing interests
The authors declare no competing interests.


 Open access