Hostname: page-component-745bb68f8f-f46jp Total loading time: 0 Render date: 2025-01-27T21:53:50.718Z Has data issue: false hasContentIssue false

Time scale and ice accumulation during the last 125,000 years is indicated by Greenland O18 curve

Published online by Cambridge University Press:  01 May 2009

W. Dansgaard
Affiliation:
Geophysical Isotope Laboratory, University of Copenhagen, Haraldsgade 6, DK-2200 Copenhagen, Denmark
S. J. Johnsen
Affiliation:
Geophysical Isotope Laboratory, University of Copenhagen, Haraldsgade 6, DK-2200 Copenhagen, Denmark
H. B. Clausen
Affiliation:
Geophysical Isotope Laboratory, University of Copenhagen, Haraldsgade 6, DK-2200 Copenhagen, Denmark
C. C. Langway
Affiliation:
Geophysical Isotope Laboratory, University of Copenhagen, Haraldsgade 6, DK-2200 Copenhagen, Denmark
Rights & Permissions [Opens in a new window]

Abstract

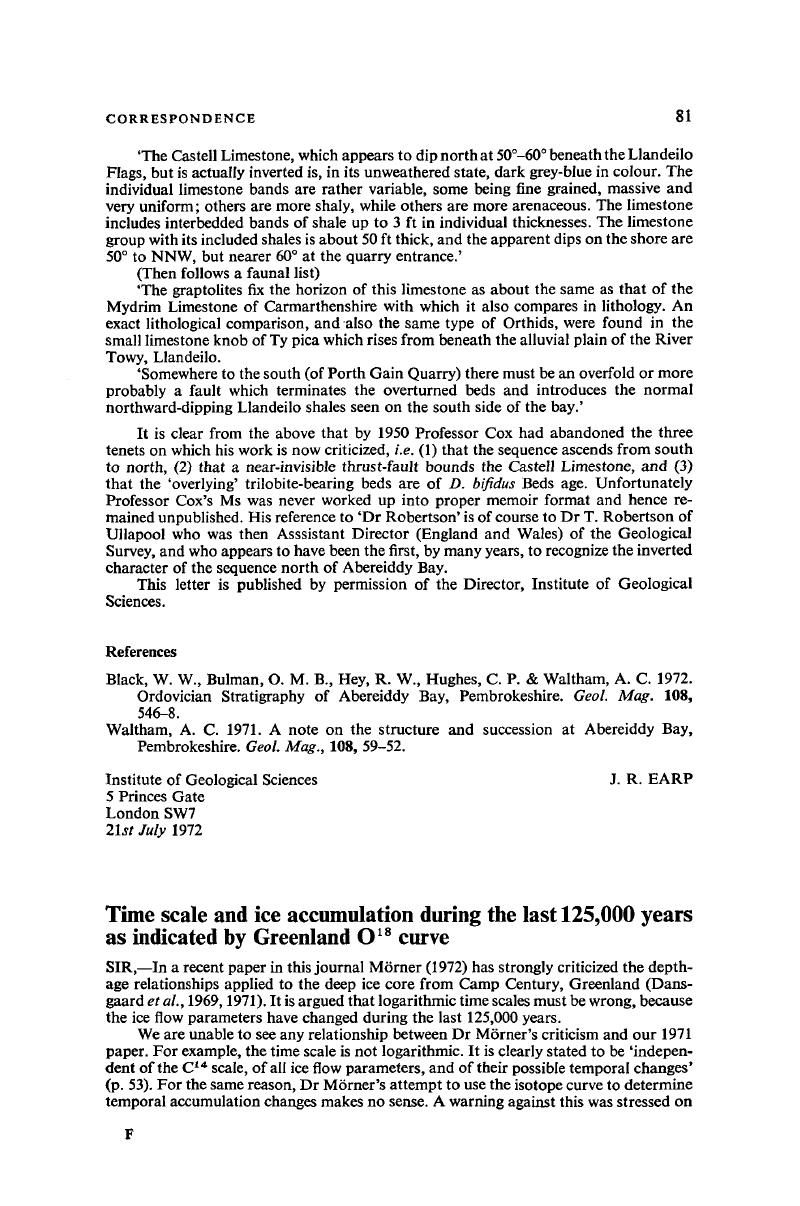
Image of the first page of this content. For PDF version, please use the ‘Save PDF’ preceeding this image.'
Type
Correspondence
Copyright
Copyright © Cambridge University Press 1973

References

Dansgaard, W., Johnsen, S. J. Møller, J., and Langway, C. C. 1969. One thousand centuries of climatic record from Camp Century on the Greenland Ice Sheet. Science 166, 377–81.CrossRefGoogle ScholarPubMed
Dansgaard, W., Johnsen, S. J., Clausen, H. B., & Langway, C. C. 1971. Climatic record revealed by the Camp Century ice core. In Turekian, K. K. (Ed.): Late Cenozoic Glacial Ages (volume dedicated to R. F. Flint). Yale Univ. Press.Google Scholar
Mörner, N.-A. 1972. Time scale and ice accumulation during the last 125,000 years as indicated by the Greenland O18 curve. Geol. Mag. 109 (1). 1724.CrossRefGoogle Scholar