INTRODUCTION
The Asian Vegetable Research and Development Center (AVRDC), renamed in 2008 as AVRDC – The World Vegetable Center, has a global mandate for the improvement of tropical and sub-tropical vegetable production systems to combat malnutrition and poverty in the developing world. The Center's research, development and capacity building efforts are projected to make positive contributions to the Millennium Development Goals in the period 2011–25 (AVRDC 2010; Keatinge et al. Reference Keatinge, Yang, Hughes, Easdown and Holmer2011a; Hughes & Keatinge Reference Hughes, Keatinge, Nath, Chaikiattyos, Holmer and Linwattana2012). These efforts involve germplasm conservation and enhancement, plant breeding for abiotic and biotic stress tolerance, yield and increased nutrient content, pest and disease management studies, nutritional and post harvest research efforts and horticultural system improvements along the complete vegetable value chain, from seed conservation to human consumption. Climate uncertainty during the next 15 years and beyond, and the need for vegetable production to adapt, will have a substantial influence on this range of research subjects. The present paper seeks to provide guidance for vegetable scientists regarding the change in air temperature expected across the globe, and the potential implications of such change for vegetables.
Advice to plant breeders and associated disciplines needs to be, if possible, more crop- (Zheng et al. Reference Zheng, Chen and Han2009), site- or region-specific (Peng et al. 2004; Kesava Rao & Wani Reference Kesava Rao and Wani2011) and simple enough to be incorporated as meaningful targets across a diversity of breeding and vegetable production programmes. The Intergovernmental Panel on Climate Change's (IPCC) comprehensive dissertation offered by Folland et al. (Reference Folland, Karl, Christy, Clarke, Gruza, Jouzel, Mann, Oerlemans, Salinger, Wang, Houghton, Ding, Griggs, Noguer, van der Linden, Dai, Maskell and Johnson2001) is highly complex; in summary, it suggests a generic global warming of c. 0·6 °C/100 years since the late 19th century, and looking forward to the 22nd century. However, simpler and more practical guidance is also needed for a shorter time-scale to plan breeding or germplasm improvement programmes and to set targets for crop production and crop management scientists. The specific time threshold considered in the present paper already incorporates the period up to 2025, which is approximately the time required for a new vegetable variety, if first planned in 2011, to be released, commercialized and then adopted and grown by farmers. Predictions for the time period between 2025 and 2050 will be useful for scientists involved with pre-breeding research and other colleagues concerned with food and nutritional security. Such scenarios are reported by Lobell et al. (Reference Lobell, Burke, Tebaldi, MastrandRea, Falcon and Naylor2008), who suggest the likely impacts of climate change up to 2030 and note which regions around the world will be the most vulnerable; Thornton et al. (Reference Thornton, Jones, Ericksen and Challinor2011) present similar projections for sub-Saharan Africa. Breeders and pre-breeders commonly plan with a medium- to long-term perspective in mind. For example, AVRDC breeders have already made a 40-year investment, from the Center's inception up to the present day, in seeking increased heat tolerance in tomatoes grown in the tropics. The research has been successful in the medium term, and has continued to make important progress over the last 5 years (Fletcher Reference Fletcher1993; de la Peña & Hughes Reference de la Peña and Hughes2007; Fufa et al. Reference Fufa, Hanson, Dagnoko and Dhaliwal2011).
To make sound recommendations that are applicable to agriculture, the present paper adopts a simple approach of predicting future air temperatures based on measured, not modelled, long-term results. In contrast to mostly urban studies, such as that of Viola et al. (Reference Viola, Paiva and Savi2010), the data for the present paper are obtained largely from agricultural research institutes or other similar rural or campus-based organizations. It is assumed that these sites are largely free of potential sources of development-derived warming, such as ‘heat island effects’ derived from urban or airport development (Camilloni & Barros Reference Camilloni and Barros1997; Alkolibi Reference Alkolibi2002). Although such sources of temperature variation may be perceived rather than real (Parker Reference Parker2006), the conclusions of Mohsin & Gough (Reference Mohsin and Gough2010) from the Toronto metropolitan area imply that this bias to temperature records from urban environments may still continue to be a potent issue that needs to be considered in site selection of meteorological data.
The present paper assesses the most conservative air temperature data parameter that is easily available from most meteorological records – the annual average air temperature derived from the annual average maximum and minimum air temperatures. This parameter is often used as a simple metric for climate change; Challinor et al. (Reference Challinor, Wheeler, Hemming and Upadhyaya2009) indicated that partial adaptation to climate change among existing germplasm, e.g. for groundnut (Arachis hypogaea), is possible. Likewise, it is already possible to detect falling yields in some vegetables, such as cool season vegetable species grown in Ontario (McKeown et al. Reference McKeown, Warland, McDonald and Hutchinson2004, Reference McKeown, Warland and McDonald2006), as a result of average temperature increases and higher frequency of hot days during the growing season. In contrast, Lobell et al. (Reference Lobell, Cahill and Field2007) imply that direct warming effects on horticultural crops in California (which constitutes half of all domestic production in the USA) have been relatively slight and that plant diseases and pests, pollination and dormancy factors, rather than extra heat, may be much more important variables in determining vegetable yields. Ceccarelli et al. (Reference Ceccarelli, Grando, Maatougui, Michael, Slash, Haghparast, Rahmanian, Taheri, Al-Yassin, Benbelkacem, Labdi, Mimoun and Nachit2010) indicate that in cereals, photoperiod-temperature responses are highly heritable and thus air temperature is assumed to be a vital measure in establishing breeding programme targets for many crops. Other disciplines, such as crop physiology and agronomy, should contribute to helping to adapt production systems to meet changing crop and environmental needs.
Ignoring seasonal variation might be seen as a weakness of the present paper. Lower minimum temperatures may mask the effect of higher maximum temperatures and vice versa, but describing such considerations implies a factorial increase in complexity that the paper seeks to avoid in its attempt to provide simple, easy to adopt advice to vegetable breeders and their colleagues. In practical terms, temperature-induced seasonality is less of an issue for vegetable production in the tropics and sub-tropics, which are the ecozones most germane to AVRDC's mandate.
Vegetables are high-value crops with global importance for the alleviation of poverty and malnutrition and for the attainment and maintenance of good health in humans (Keatinge et al. Reference Keatinge, Yang, Hughes, Easdown and Holmer2011a). Efforts to provide genetic adjustment to warming and other abiotic stresses in vegetables have been summarized by de la Peña et al. (Reference de la Peña, Ebert, Gniffke, Hanson, Symonds, Yadav, Redden, Hatfield, Lotze-Campen and Hall2011) and more specifically for solanaceous vegetables by Hanson et al. (Reference Hanson, Gniffke, Shieh, Tan, Wu, Lu, Tseng, Wang and Hsiao2011): both papers state that the adaptation of vegetable crops to climate uncertainty is quite possible using modern agricultural science, but that knowledge of crop–climate interactions remains fragmentary (Vadez et al. Reference Vadez, Kholova, Choudhary, Zindy, Terrier, Krishnamurthy, Kumar, Turner, Yadav, Redden, Hatfield, Lotze-Campen and Hall2011). The present paper contributes to the pool of knowledge and recommendations to better quantify the challenges facing vegetable breeders and associated scientists.
MATERIALS AND METHODS
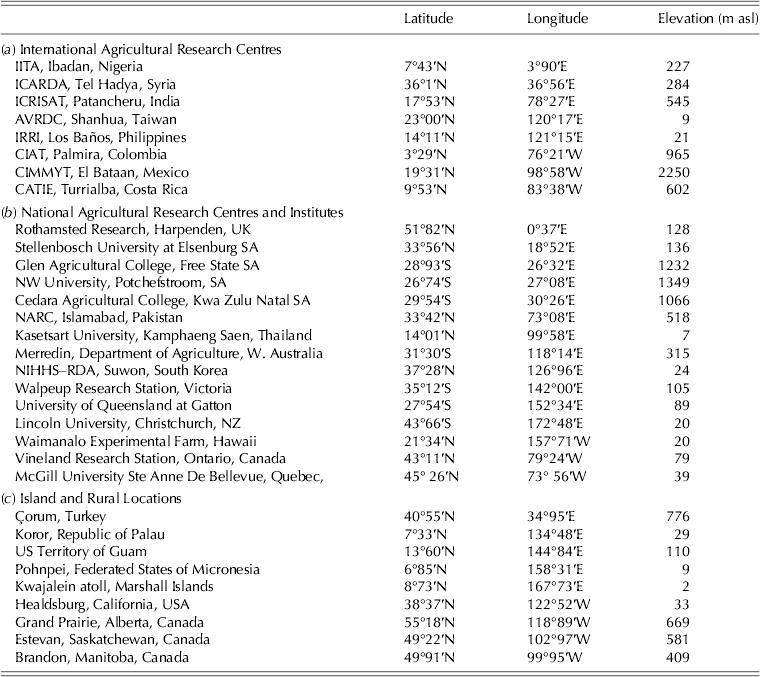
Long runs of annual average maximum and minimum air temperature were collected from a range of different locations worldwide (Table 1). The annual average air temperature at each location was computed as the mean of these two values. The stations selected had continuous high-quality data runs (1975–2011) that could be attributable to at least one of three categories of site: (a) international agricultural research centres; (b) national agricultural research centres, institutes and universities; and (c) island and essentially rural locations. All three categories represent data collection sites largely free of urban development influences.
Table 1. Location and elevation of meteorological stations

Sites other than international agricultural research centres were selected mostly because of the long runs of high-quality data available at these locations (usually >50 years) and for their geographic dispersion worldwide in areas of agricultural potential. Sites such as Rothamsted Research (formerly Rothamsted Experimental Station), Harpenden, UK and Lincoln University, Christchurch, New Zealand maintain extensive records that already have been discussed in the literature related to agricultural activities (Chmielewski & Potts Reference Chmielewski and Potts2005; Larsen Reference Larsen2005). Most sites from South Africa, Australia and Canada were selected for their length of unbroken data and geographic dispersion. Island sites in the Pacific were included to extend the geographic coverage of the present study into an area of the globe not previously covered, and also because Oceania is a key priority area for present and future research and development efforts due to the severity of malnutrition in many such locations (AVRDC 2010).
No sites were deliberately excluded from the analysis, regardless of whether they showed the expected increase or decrease in temperature trends.
Annual mean temperatures were computed based on monthly averages per year. In the rare cases where some months had missing data, the monthly averages of the same months from the preceding 5 years were used to fill in the gaps (Environment Canada 2012). Data quality was assumed to be adequate for the purposes of the paper either by institutional reputation through the intermediary supplier (listed at the end of the paper) or through the personal knowledge of the first author, who was responsible for the original collection of daily data at some of the selected sites during portions of the data run involved (ICARDA Tal Hadya (1980–5), IITA Ibadan (1999–2002), ICRISAT Patancheru (2002–8) and AVRDC Shanhua (2008–11)).
The period 1975–2011 was chosen as the reference time series, since many of the meteorological data recording stations at the international agricultural research centres had been established by that time (Category A sites) (Table 1). National agricultural research centres and institutes (Category B sites) were selected to meet this criterion with one exception. The NARC Islamabad was established only in 1979 and therefore data before that date (from 1950) derives from the Pakistan Meteorological Service station in Islamabad. From 1950 to 1979 this was a location that for the purposes of the present paper could be deemed to be essentially rural; much of Islamabad, a modern, planned capital city, had not been developed extensively during the period in question. Moreover, the station in Islamabad is close to the location where the NARC was established and the elevation is similar. The grafting of the two data sets should not create any major errors in the subsequent analysis. For a few other sites that were selected because of their specific interest to breeders at international agricultural research centres, the data run was slightly shorter than 1975–2011; an example is ICARDA Tel Hadya, where the meteorological station was set up only in 1979. The nearest meteorological stations to Tel Hadya with long-term records are Saraqueb (rainfall records only) and Aleppo, which is 35 km distant. However, the Aleppo data set has proven previously to be a reliable estimator for another meteorological variable, rainfall (Dennett et al. Reference Dennett, Rodgers and Keatinge1983); therefore the data for Aleppo were used to fill the missing years 1975–78 for the Tel Hadya record. Comparison of the subsequent regression equations 1979–2011 and 1975–2011 were almost identical (data not presented) and the infilling was therefore deemed to be legitimate. A similar procedure was adopted for CIAT Palmira using the years 1976–78 from ICA Palmira, a nearby station; the regression equations were sufficiently similar to adopt the slightly longer data run for effective consistency with other locations. Details of other time series are shown in Table 1.
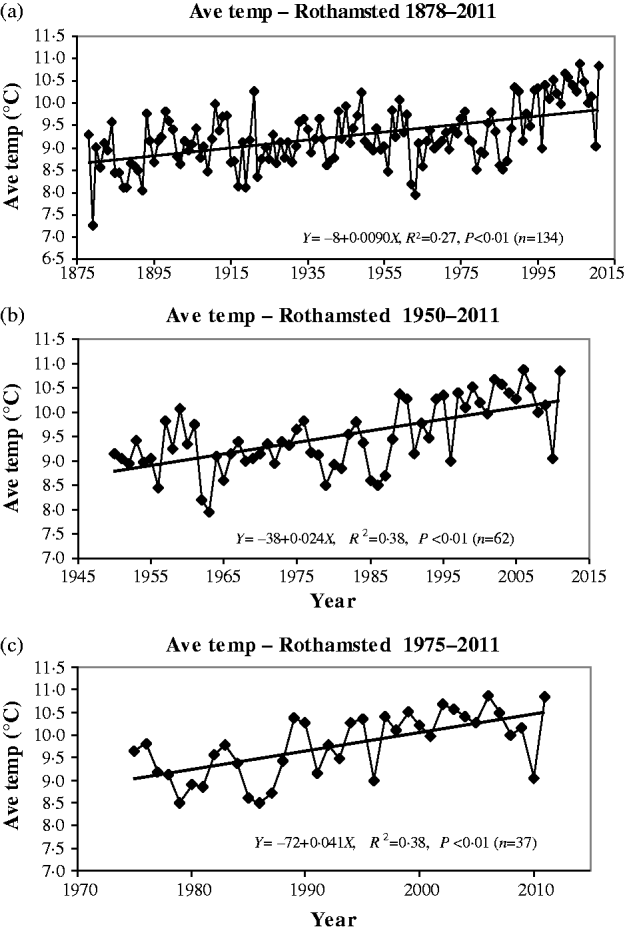
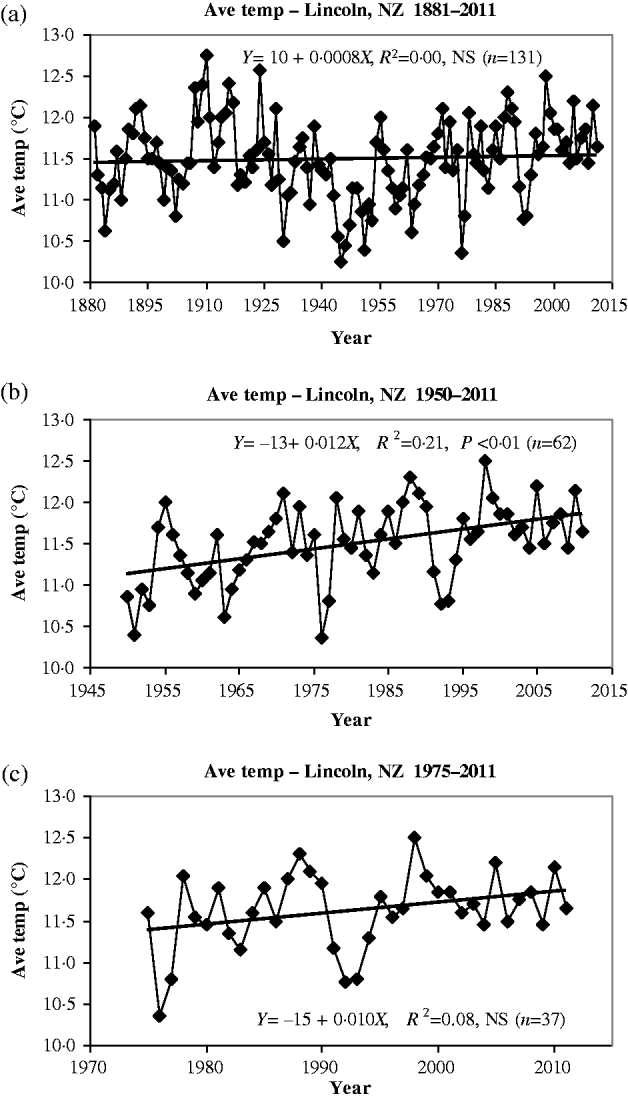
The selection of the reference time series 1975–2011, rather than anything much longer or shorter, is a decision of some importance in the present study. This is evident in the comparison of results with very long runs (Figs 1 and 2). It seems that substantive recent change could have occurred in the later 20th century. For example, Mohsin & Gough (Reference Mohsin and Gough2010) suggest that though the warming trend in Toronto has been detectable from the end of the 19th century, there has been an increasing linear trend in warming since c. 1970. McKeown et al. (Reference McKeown, Warland and McDonald2006) affirm that there has been a warming trend in Ontario since 1980, which followed a moderate, more benign period for crop growth from 1955 to 1975 (Lobell & Asner Reference Lobell and Asner2003) that was more beneficial for the production of Brassicaceae and related cool-season vegetable species (Warland et al. Reference Warland, McKeown and McDonald2006). A similar warming trend is reported for Western Cape Province (mid-1960s to 2000) in South Africa by Midgley et al. (Reference Midgley, Chapman, Hewitson, Johnston, De Wit, Ziervogel, Mukheibir, Van Niekerk, Tadross, Van Wilgen, Kgope, Morant, Theron, Scholes and Forsyth2005). Such conclusions regarding a change in global temperatures are supported by the IPCC 2001 report (Folland et al. Reference Folland, Karl, Christy, Clarke, Gruza, Jouzel, Mann, Oerlemans, Salinger, Wang, Houghton, Ding, Griggs, Noguer, van der Linden, Dai, Maskell and Johnson2001) and the IPCC 2007 report (Parry et al. Reference Parry, Canziani, Palutikof, Van Der Linden and Hanson2007), which indicate that the 1990s are likely to have been the warmest decade of the millennium and that rapid warming occurred since 1976.

Fig. 1. Average annual air temperature values (°C) at Rothamsted Research for the periods (a) 1878–2011, (b) 1950–2011 and (c) 1975–2011.

Fig. 2. Average annual air temperature values (°C) at Lincoln University for the periods (a) 1881–2011, (b) 1950–2011 and (c) 1975–2011. NS = not significant.
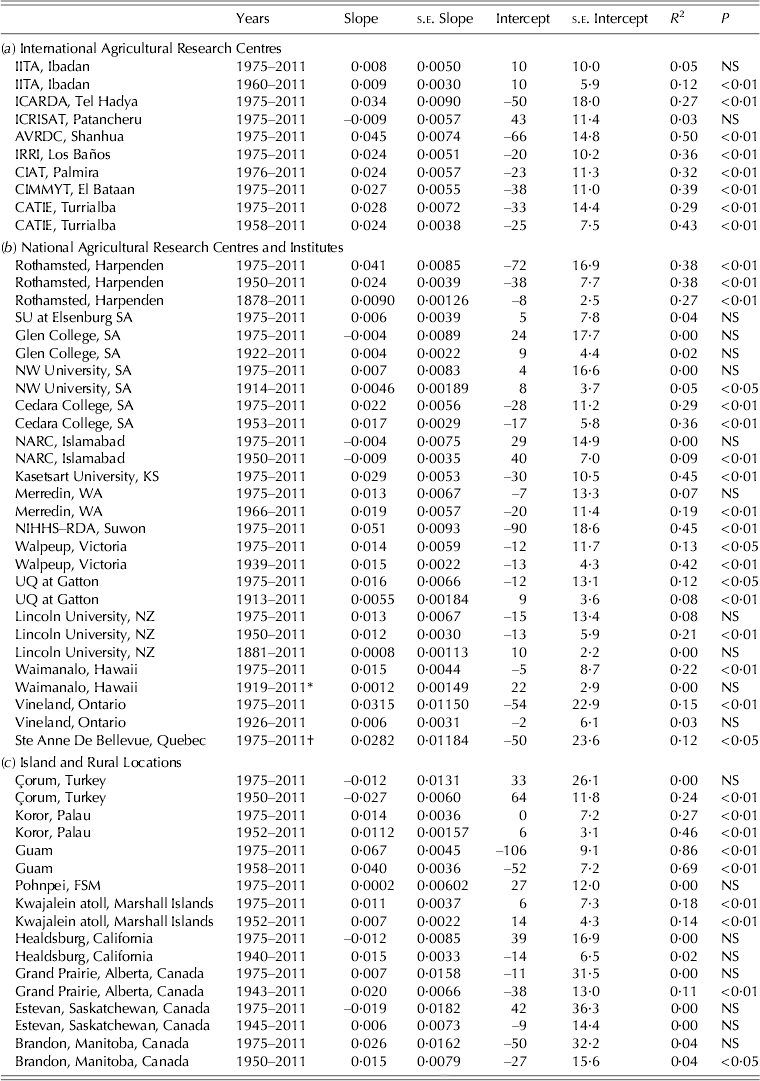
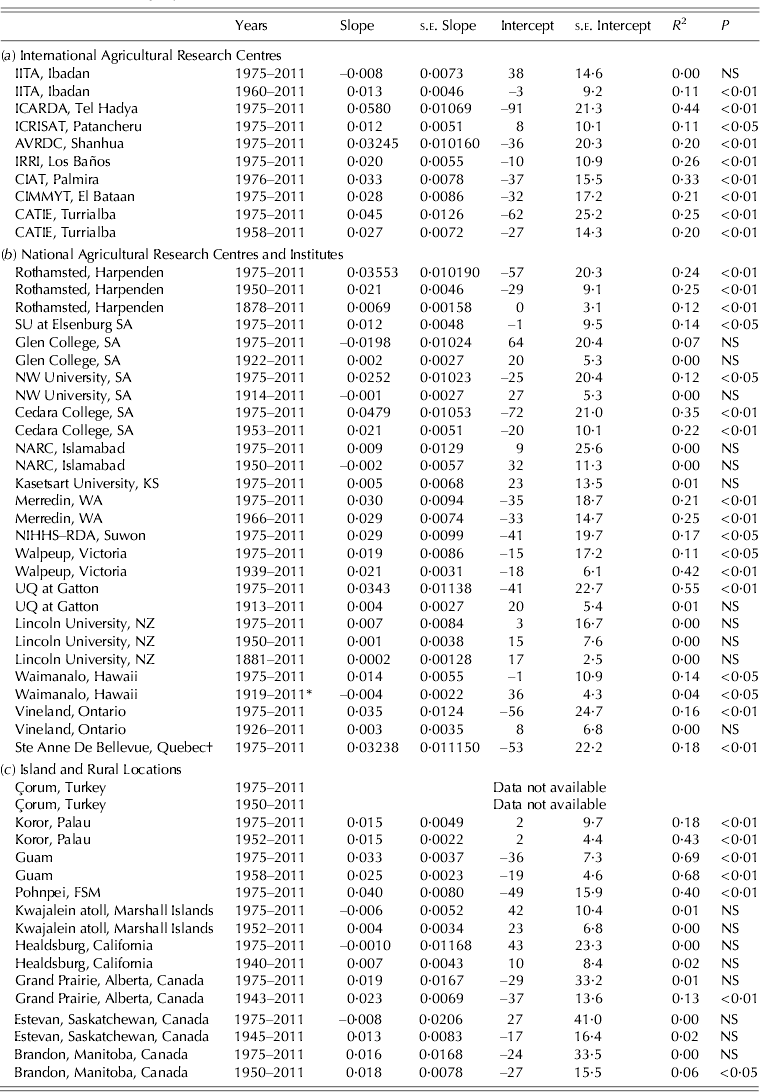
All data sets were subjected to regression analysis using a linear model (Statistical Analysis System (SAS) 2011). Trend analyses for each location, whether for the standard time series or for longer periods, are shown in Tables 2–4. The significance of the regression coefficients were tested using Student's t test at the P < 0·05 and P < 0·01 probability levels. For the few instances of stations with many years of data and subsequent R 2 values that are low but significant, it should be noted that the projection of future temperatures for 2025 and beyond may be somewhat doubtful.
Table 2. Location and trend analysis of average annual air temperature (°C) over the reference period (1975–2011) and longer periods where data were available

* Years 1951–68 missing.
† Years 1992–93 missing.
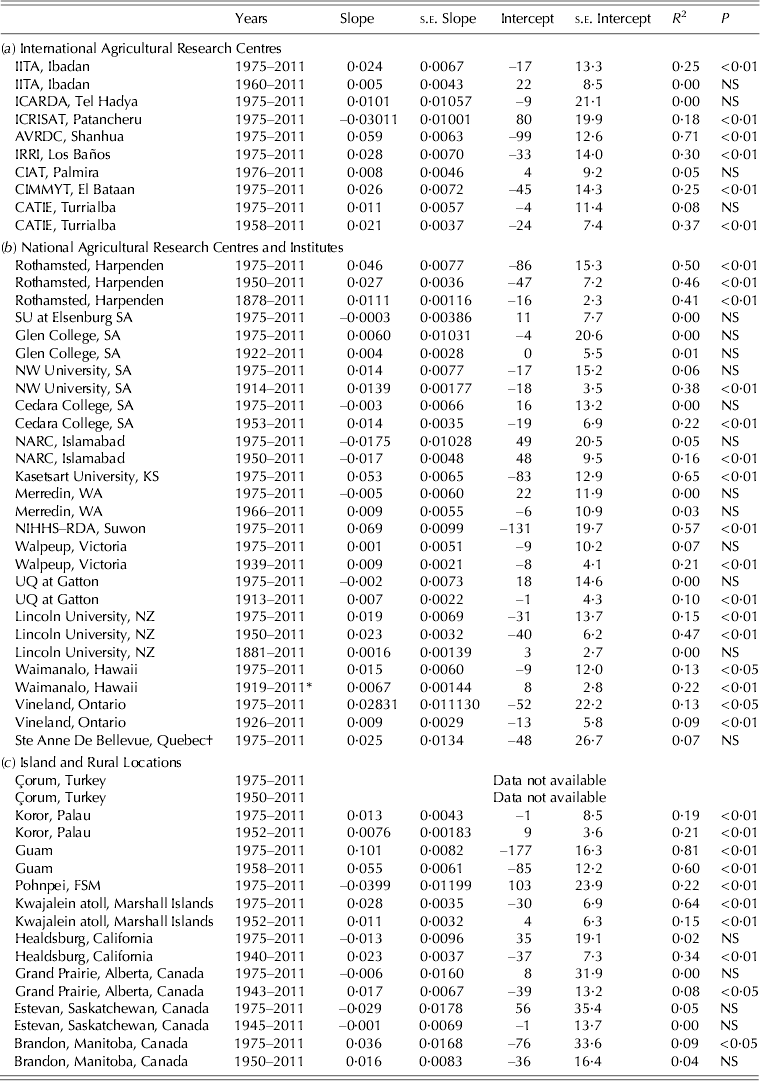
Table 3. Location and trend analysis of maximum annual air temperature (°C) over the reference period (1975–2011) and longer periods where data were available

* Years 1951–68 missing.
† Years 1992–93 missing.
Table 4. Location and trend analysis of minimum annual air temperature (°C) over the reference period (1975–2011) and longer periods where data were available

* Years 1951–68 missing.
† Years 1992–93 missing.
RESULTS
The data presented in Table 2 for the change in average air temperatures over the period 1975–2011 suggest large variability between stations at the international agricultural research centres (category A sites) with some slope values highly significant (P < 0·01), such as at AVRDC (Shanhua, Taiwan) and the International Rice Research Institute (IRRI) (Los Baños, Philippines: 1·0 °C increase in 37 years), and others being either intermediate (CATIE, Turrialba, Costa Rica; ICARDA, Tel Hadya, Syria) or no change in temperature being evident (1975–2011) (IITA, Ibadan, Nigeria; ICRISAT, Patancheru, Andhra Pradesh, India). This variability is noticeable at the category B locations with Lincoln University (Christchurch, New Zealand) and NARC (Islamabad, Pakistan) showing no difference in the rates of increase or decrease in average temperature and other locations such as Kasetsart University (Kamphaeng Saen, Thailand) and the South Korean Rural Development Administration (RDA, Suwon, South Korea) being significant (P < 0·01). The greatest variability is shown within the category C stations where locations in central Anatolia (Çorum) and California (Healdsburg) show no significant difference in average air temperature over the years 1975–2011, yet the island of Guam shows a steep and significant (P < 0·01) increase in average temperature.
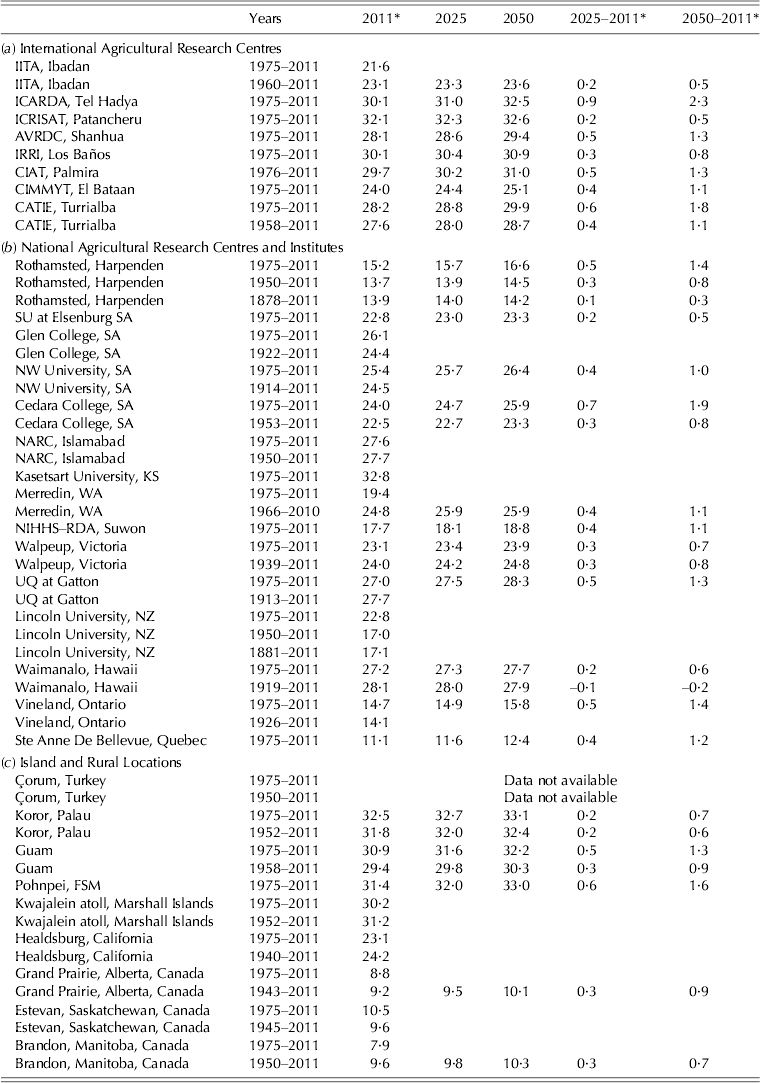
If sites with longer data runs are considered, then a similar mixed result is seen. For example, at Rothamsted Research (Fig. 1) the rate of increase in temperature is high (0·04 °C per year) for the standard data period; if the data run is extended to 1950–2011, it is reduced (0·02 °C per year). If the full series of years from 1878–2011 is considered the increase in temperature becomes very small, though still significant (P < 0·01). At Lincoln University (Fig. 2) from 1881 to 2011, no change in average air temperature is indicated but in the medium run 1950–2011 a slight warming is shown (P < 0·01) and in the shorter run (1975–2011) again no change is seen. At most sites across Canada and South Africa only small, if any, changes seem to have occurred between 1975 and 2011. For Merredin (Western Australia) recent warming has been either very slight or not significant but the longer data run shows significant warming (P < 0·01). At the University of Queensland, Gatton, the longer data run (from 1913) and the shorter period (from 1975) shows largely the same change in projecting a slight warming trend. In contrast, at Çorum (Turkey), the slope is negative and significant (P < 0·01) for the longer run of data from 1950, and at Islamabad a similar result is apparent. The changes in maximum and minimum annual air temperatures over the period 1975–2011 are presented in Tables 3 and 4, respectively. The current projected average air temperature at each location and those projected temperatures and changes in temperature for the years 2025 and 2050 are presented in Table 5. These projections are based on the simple assumption that the current trends using the standard data period (1975–2011) or for comparison with longer periods where data were available will be maintained over the next 15–40 years. Such an assumption may be questionable in the face of alternative scenarios offered by longer runs of data. However, if a substantive flex point in the air temperature v. the date curve was reached in the late 20th century (Folland et al. Reference Folland, Karl, Christy, Clarke, Gruza, Jouzel, Mann, Oerlemans, Salinger, Wang, Houghton, Ding, Griggs, Noguer, van der Linden, Dai, Maskell and Johnson2001; Lobell & Asner Reference Lobell and Asner2003; Midgley et al. Reference Midgley, Chapman, Hewitson, Johnston, De Wit, Ziervogel, Mukheibir, Van Niekerk, Tadross, Van Wilgen, Kgope, Morant, Theron, Scholes and Forsyth2005; McKeown et al. Reference McKeown, Warland and McDonald2006; Parry et al. Reference Parry, Canziani, Palutikof, Van Der Linden and Hanson2007; Mohsin & Gough Reference Mohsin and Gough2010) then it would perhaps be prudent to use the projections of the shorter run to be better prepared for the more extreme changes in temperature that could occur in the future.
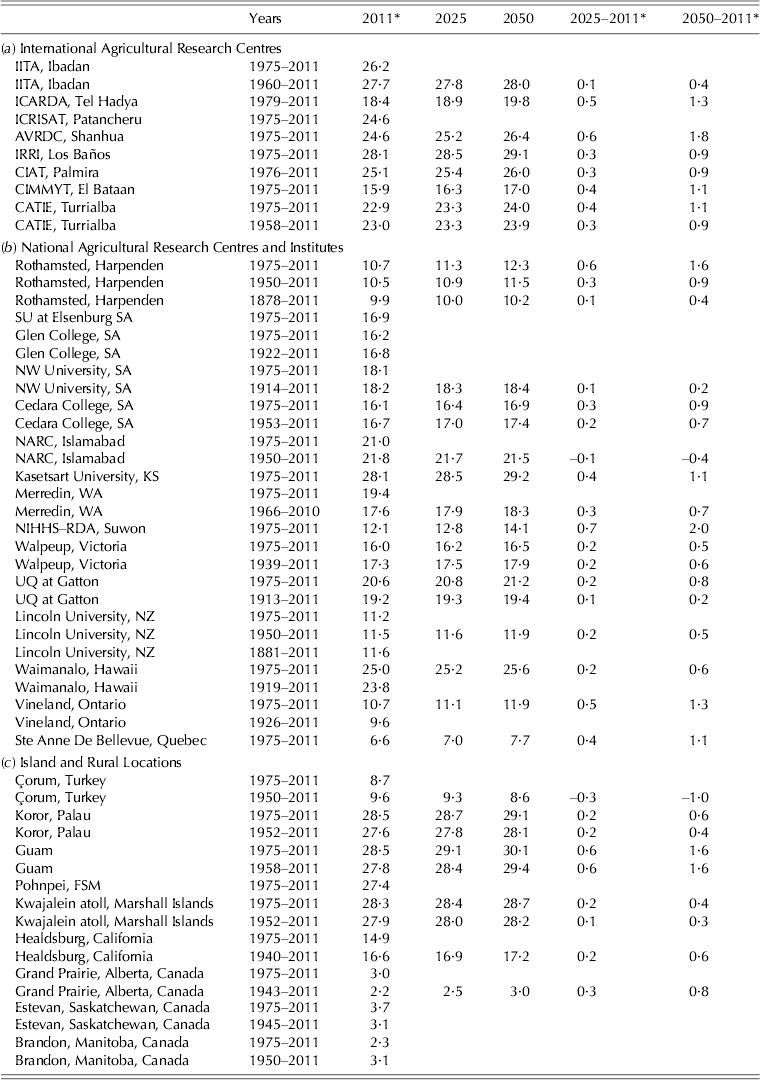
Table 5. Location and trend analysis of average annual air temperature (°C) projected for 2011, 2025 and 2050 from the equations presented in Table 2

* Value projected from the equation in Table 2.
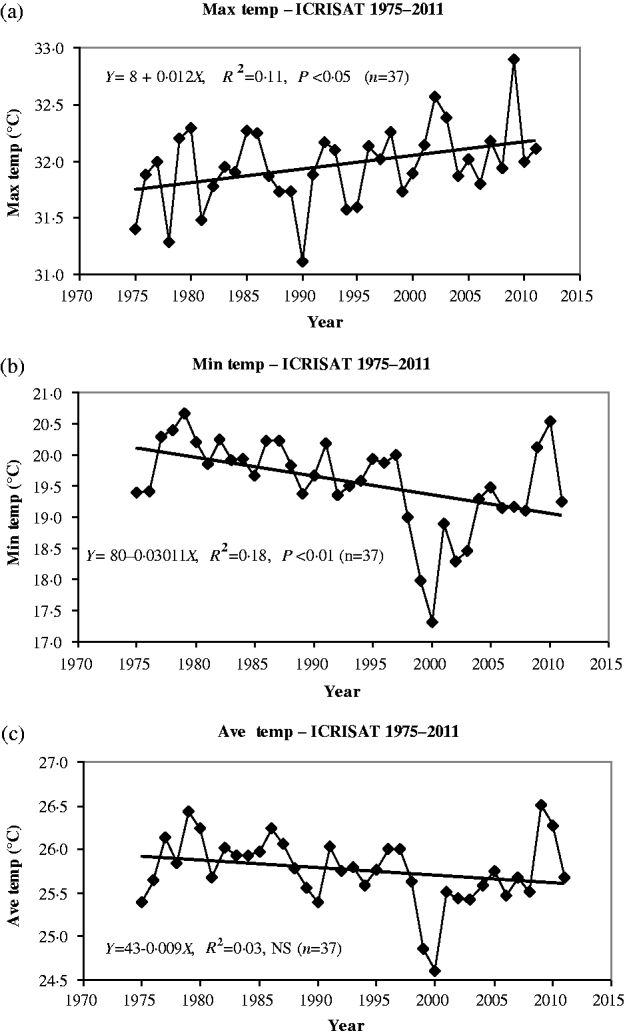
At most of the Category A international agricultural research centre sites, with the exception of IITA Ibadan and ICRISAT Patancheru (Fig. 3), where no increase is projected, the findings are otherwise reasonably consistent with centres showing increases of c. 0·4–0·6 °C by 2025 and increases of between 1·1 and 1·8 °C by 2050, with AVRDC, Shanhua having the highest projected increase in this category but still somewhat less than for RDA, Suwon and for Guam in categories B and C, which increase at the rate of severity postulated for sub-Saharan Africa by Thornton et al. (Reference Thornton, Jones, Ericksen and Challinor2011) of c. 4 °C/100 years. This is a finding with major implications for vegetable research at the international agricultural research centres.

Fig. 3. Annual air temperatures at ICRISAT, Patancheru, 1975–2011. (a) Maximum, (b) minimum and (c) average. NS = not significant.
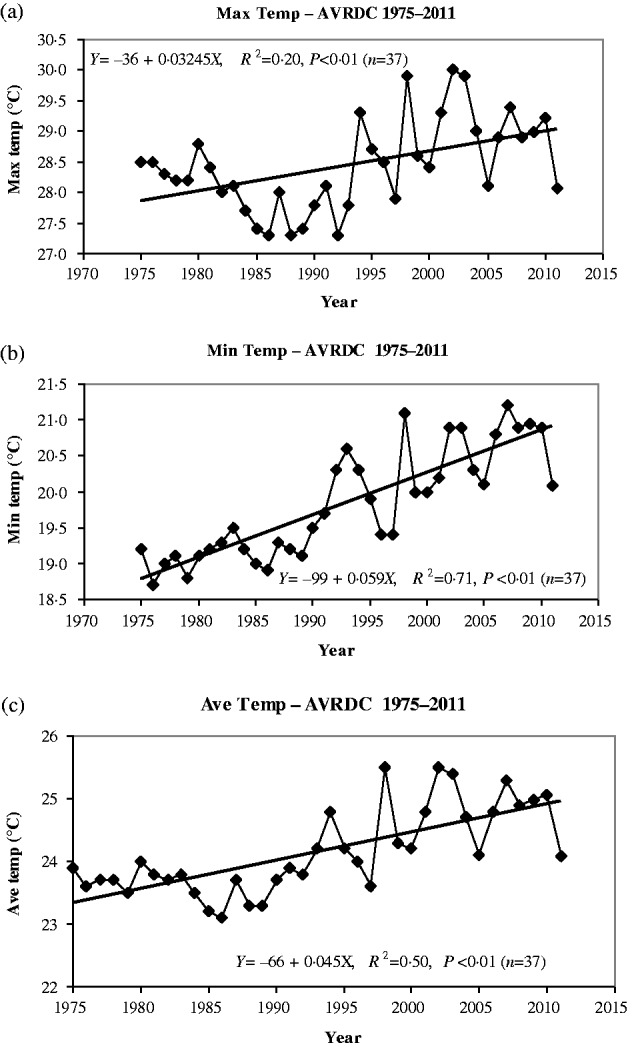
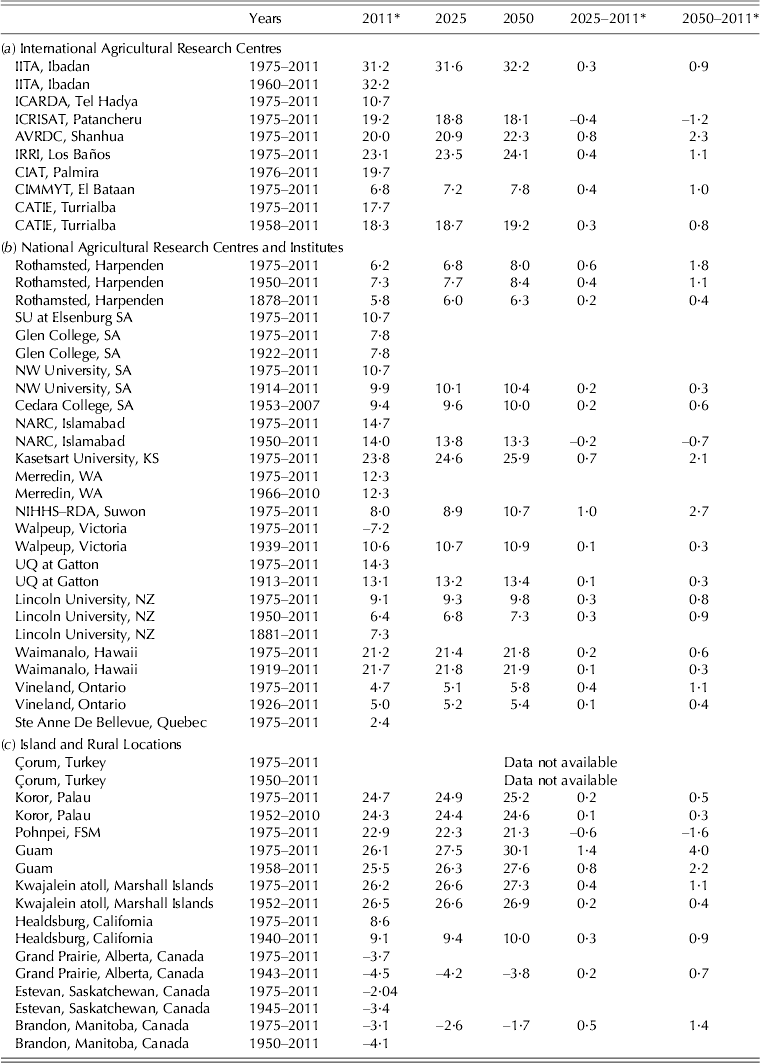
A further source of variation in air temperature that is of great importance to plants is the difference between annual average maximum and minimum temperatures – the diurnal temperature range (DTR). The trends of both average maximum and minimum temperatures in the selected standard data run period and for longer periods where data are available for comparative purposes vary between sites (Tables 3 and 4). Sites such as AVRDC show consistent significant (P < 0·01) increases in both maximum and minimum temperatures (Fig. 4), and similar results are shown at IRRI, Los Baños (shown earlier by Peng et al. Reference Peng, Huang, Sheehy, Laza, Visperas, Zhong, Centeno, Khush and Cassman2004) and at RDA, Suwon. Rothamsted Research shows such trends across all three data runs from 1878 (Tables 3 and 4). However, at IITA Ibadan and Kasetsart University, Kamphaeng Saen there is a significant increase in minimum temperatures (P < 0·01) but not in maximum temperatures. In contrast, the site at ICRISAT, Patancheru shows a slight positive increase in maximum temperatures (P < 0·05) while also having a significantly (P < 0·01) negative trend in minimum temperatures; the resulting average temperature (Table 2) shows no significant change except an increasing DTR (Tables 3 and 4). Several of the Canadian and South African stations (Table 4) show no significant change in minimum temperatures in their shorter or longer runs including Estevan, Saskatchewan, Brandon, Manitoba, Elsenburg, Western Cape Province and Potchefstroom, North West Province. Such a trend is also seen at Merredin, Western Australia. Tables 5–7 show the current projected annual average, maximum and minimum air temperatures at each location and the predicted temperatures for the years 2025 and 2050. Where the trends are not significant, temperatures remain as in 2011. Maximum temperatures change very much in line with the results presented for average temperatures, with an increase of 0·3–0·4 °C by 2025 being reasonably common when assessed over the reference time period (Table 6). Over the longer time periods reported at Rothamsted Research this falls from 0·5 °C (1975–2011) to 0·1 °C (1878–2011). The projected increase for ICARDA, Tel Hadya for 2050 is particularly high at 2·3 °C and likewise at CATIE, Turrialba at 1·8 °C (Table 6).

Fig. 4. Annual air temperatures at AVRDC, 1975–2011. (a) Maximum, (b) minimum and (c) average.
Table 6. Location and trend analysis of average annual maximum air temperature (°C) projected for 2012, 2025 and 2050 from the equations presented in Table 3

* Value projected from the equation in Table 3.
Minimum temperature projected changes are presented in Table 7. Increases in eastern Asia are generally large for 2025 (0·4–1·0 °C for RDA, Suwon; AVRDC, Shanhua; Kasetsart University, Kamphaeng Saen; and IRRI, Los Baños) and likewise for 2050 (1·1–2·7 °C) with AVRDC, Shanhua and RDA, Suwon close to the maximum increase recorded (Table 7). In contrast, ICRISAT Patancheru's data projects a fall in minimum temperature in 2050 of 1·2 °C.
DISCUSSION
The IPCC reports of 2001 and 2007 concerning air temperature (Folland et al. Reference Folland, Karl, Christy, Clarke, Gruza, Jouzel, Mann, Oerlemans, Salinger, Wang, Houghton, Ding, Griggs, Noguer, van der Linden, Dai, Maskell and Johnson2001; Parry et al. Reference Parry, Canziani, Palutikof, Van Der Linden and Hanson2007) clearly indicate that climate change is characterized by uncertainty at a local level and this is further reflected in the results presented in the present paper. Nevertheless, at the majority of sites (not in the USA) there is a predominant trend of increasing temperatures, with night temperature increasing more rapidly than day temperature. This finding agrees with Vincent et al. (Reference Vincent, Peterson, Barros, Marino, Rusticucci, Carrasco, Ramirez, Alves, Ambrizzi, Berlato, Grimm, Marengo, Molion, Moncunill, Rebello, Anunciacao, Quintana, Santos, Baez, Coronel, Garcia, Trebejo, Bidegain, Haylock and Karoly2005) reporting for 68 locations in South America for 1960–2000, Quintana-Gomez (Reference Quintana-Gomez1999) for multiple stations in Venezuela and Colombia, Chen et al. (Reference Chen, Wang, Yu and Zhang2010) for several sites in the North China plain (1961–2003) and for IRRI Los Baños as reported by Peng et al. (Reference Peng, Huang, Sheehy, Laza, Visperas, Zhong, Centeno, Khush and Cassman2004). At IRRI this increase is associated with potentially lower rice yields. For a minority of sites, including ICRISAT Patancheru, Lincoln University Christchurch and several locations in both eastern and western Canada, no average temperature change is projected between 2011 and 2050. There are some sites, such as Çorum in Central Anatolia, reporting global cooling (1950–2011) or no change for the 1975–2011 period. Yet in order to face such variable trends, de la Peña et al. (Reference de la Peña, Ebert, Gniffke, Hanson, Symonds, Yadav, Redden, Hatfield, Lotze-Campen and Hall2011) argue that stress-tolerant germplasm still offers a sustainable and cost-effective approach to combating environmental variability. Investment in plant breeding to overcome abiotic stresses results in lines that can be deployed globally which can be released as lines adapted to specific stresses and utilized in developing varieties targeted to specific geographical regions. While small incremental temperature changes may have little effect on crop productivity, once thresholds are reached such as for pollen viability, the benefits of stress-tolerant germplasm will become apparent.
Site specificity clearly remains a key challenge to vegetable scientists and this is compounded by the difficulties of elucidating strong regional trends. For example, AVRDC Shanhua, where tomatoes (Solanum spp.) and peppers (Capsicum spp.) are being bred for global use, is likely to experience rather faster warming than most other locations in the present study, with average temperatures in 2011 set to increase by 0·6–25·2 °C in 2025 and by 1·8–26·4 °C in 2050. Similar warming trends are evident at Kasetsart University, Kamphaeng Saen, Thailand where AVRDC conducts research for East and Southeast Asia, including its Curcubitaceae breeding programme. AVRDC also has a substantial regional presence in South Asia, including the Center's legume breeding programme based at ICRISAT, Patancheru; but the data indicate that little change will occur there. The present and potential activities of AVRDC in providing simple advice to scientists now present a formidable challenge: the Center has scientists based in more than 15 locations worldwide and a global network of partners for which it exercises a global mandate for tropical and sub-tropical vegetable improvement.
Further conclusions of a strategic nature may be drawn using AVRDC as an example. It was established in central Taiwan (adjacent to the Tropic of Cancer) in part due to the availability of a range of contrasting environmental conditions, both seasonal and geographical, that would allow both tropical and temperate vegetables to be grown conveniently at, or near, a single site (Fletcher Reference Fletcher1993). If rapid warming is to occur in the next 40 years the advantage of this multipurpose site could be compromised by making it more distinctly tropical. This would prompt an acceleration of AVRDC's policy of decentralization to better match environmental conditions to precise breeding needs. This policy is presently being implemented; the Center's mungbean (Vigna radiata) breeding programme was recently transferred from its headquarters in Taiwan to its regional office in South Asia (Hyderabad, India) to take advantage of the more semi-arid tropical and sub-tropical environment associated with the globally important mungbean growing areas of the Indo-Gangetic Plain and central India. Likewise the AVRDC onion (Allium spp.) breeding programme has been transferred to West Africa (Bamako, Mali) because increasing onion seed is easier in the dry conditions of the Sahel compared with the wetter and more unpredictable environmental conditions experienced in Taiwan.
Increasing maximum and minimum temperatures at several East Asian and Oceania locations such as RDA Suwon, Kasetsart University Kamphaeng Saen, IRRI Los Baños, Guam and AVRDC since the mid-1970s suggests that much more effort now needs to be placed on abiotic stress tolerance research. This exemplifies AVRDC's long-held position of making a substantial investment in research to address abiotic constraints to vegetable production, including the introgression of heat, drought and salt tolerance genes from wild tomato species (Solanum pimpinellifolium, Solanum chilense, Solanum peruvianum and Solanum habrochites) into cultivated types (Solanum lycopersicum) for the industrial and fresh markets. The research clearly will need to be accelerated in this decade with the International Center for Biosaline Agriculture (ICBA) and ICRISAT (Vadez et al. Reference Vadez, Kholova, Choudhary, Zindy, Terrier, Krishnamurthy, Kumar, Turner, Yadav, Redden, Hatfield, Lotze-Campen and Hall2011) as partners if it is to keep pace with the changing climate. In addition, crop management technologies must advance and be adapted to meet the growing challenges of abiotic stress. Better targeted water use technologies such as drip irrigation will be required, along with the use of protected agriculture and grafting to overcome the effects of short-term flooding. Variety testing in numerous locations will help to ensure the robustness of current genetic improvement activities and assure adaptation or tolerance to a wider range of environments, pests and diseases. Successful adaptation to higher temperatures has been shown previously with Chinese cabbage (Brassica rapa spp.), which was introduced to the lowland tropics (de la Peña & Hughes Reference de la Peña and Hughes2007). Breeding efforts at AVRDC must continue to stress the need for high nutrient content in vegetables, as modern varieties often show a decline in such characteristics (Davis et al. Reference Davis, Epp and Riordan2004). Increased air temperature may also threaten to reduce vitamin and mineral contents in vegetables (McKeown et al. Reference McKeown, Warland and McDonald2006).
It should not be assumed that shorter and shorter duration genetic material will be required to avoid the hot and dry periods typical of semi-arid areas. Cooper et al. (Reference Cooper, Rao, Singh, Dimes, Traore, Rao, Dixit and Twomlow2009), including authors representative of a range of different ICRISAT locations globally (including Patancheru), and Vadez et al. (Reference Vadez, Kholova, Choudhary, Zindy, Terrier, Krishnamurthy, Kumar, Turner, Yadav, Redden, Hatfield, Lotze-Campen and Hall2011) have argued that increasing temperatures will reduce the number of days required to bring crops to maturity. Therefore, it will be necessary to plant germplasm that under existing climatic conditions is thought to mature too late, because it is expected that medium-duration types, due to environmental circumstances, will become short-duration types. The results shown in Table 2 (with full detail presented in Fig. 3) suggest that for ICRISAT Patancheru no change in average temperature is predicted as a result of an increase in maximum temperature being cancelled out by a decrease in minimum temperature. This location is the main global focus for breeding of pulses and coarse grain cereals of the semi-arid tropics. The former class includes chickpea (Cicer arietinum) and pigeon pea (Cajanus cajan), both of which serve important ‘secondary’ green pea vegetable markets in Asia, the Middle East and the Caribbean (Vaughan & Geissler Reference Vaughan and Geissler2009). It would therefore seem to be a tactical error at this time to substantially change the maturity period of currently successful parental material at this specific location.
Another option, always available to the vegetable production community in response to increasing temperatures, is to switch from a crop with less heat tolerance to one that is already adapted to higher temperatures. This is very obvious in the case of dual purpose pulses used as green peas and grain where crops such as mung bean and vegetable soybean (Glycine max), which are naturally adapted to higher temperature growing conditions, could easily act as substitutes for other legumes such as Pisum, Lens and Cicer spp. where photo-thermal conditions permit (Keatinge et al. Reference Keatinge, Easdown, Yang, Chadha and Shanmugasundaram2011b). The role of associated disciplines in ensuring the crop is adapted effectively into the new environment and that all the concerns along the value chain are addressed becomes critical.
Biotic stressors must be considered seriously as they also respond to changing temperatures (Boland et al. Reference Boland, Melzer, Hopkin, Higgens and Nassuth2004). In the case of solanaceous crops, the rate of change in viral races and their insect vectors will require much research investment. Evidence from Tsai et al. (Reference Tsai, Shih, Kenyon, Green and Jan2011) indicate that over the last 10 years in Taiwan, the dominant tomato leaf curl Taiwan virus, which is spread by whiteflies (Bemisia tabaci), has been rapidly superseded by tomato yellow leaf curl Thailand virus as the dominant begomovirus infecting tomatoes in the country. This is critical for plant breeding efforts today, as the Ty-2 resistance gene (Ji et al. Reference Ji, Scott, Hanson, Graham, Maxwell and Czosnek2007) appears to have been rendered ineffective in Taiwan. This is a significant finding, as tomato yellow leaf curl virus is one of the major constraints to tomato production worldwide. Tomato yellow leaf curl Thailand virus has been observed to infect other solanaceous species such as peppers (de la Peña et al. Reference de la Peña, Ebert, Gniffke, Hanson, Symonds, Yadav, Redden, Hatfield, Lotze-Campen and Hall2011). Whether the change in begomovirus strain dominance is specifically related to climate change in Taiwan is a matter of speculation at present. Yet such a rapid rate of change in viral strain dominance is of great concern, as it is understood that warm and dry conditions favour rapid multiplication in whiteflies, which are then increasingly adapted to their changing environment (Hanson et al. Reference Hanson, Gniffke, Shieh, Tan, Wu, Lu, Tseng, Wang and Hsiao2011).
Many other insect pests are associated with virus transmission, such as aphids (Aphis spp.), leafhoppers (Cicadellidae spp.) and thrips (Frankliniella, Scirtothrips and Thrips spp.) (McKeown et al. Reference McKeown, Warland and McDonald2006).
Satar et al. (Reference Satar, Kersting and Uygun2005) have reported increased reproduction rate in these types of species with higher temperatures. Changing seasonal weather patterns would also affect insect incidence and consequently virus disease epidemiology; in many cases the vectors migrate with changing weather conditions. Very high temperatures may harm the insect pests that attack vegetables, but also be detrimental to crop pollinators and natural enemies. Increased temperatures may increase reproduction rates; above a certain threshold the pollinators may not thrive and diseases affecting pollinators may be exacerbated. For example, Mironidis & Savopoulou-Soultani (Reference Mironidis and Savopoulou-Soultani2010) describe damage to pod borers (Helicoverpa armigera) due to high temperature heat-shock treatments. However, these benefits may not be realized often, as such high temperatures may also be very damaging to many vegetables, and would precipitate flower drop, pollen infertility and fruit abortion (Hanson et al. Reference Hanson, Gniffke, Shieh, Tan, Wu, Lu, Tseng, Wang and Hsiao2011).
In the case of Capsicum spp., current global efforts to improve the heat tolerance of sweet peppers by breeding through crossing with related chilli species will need to be increased.
Many sweet peppers barely survive the environmental conditions experienced in summer in the tropics and traits in germplasm linked to heat tolerance such as better pollen viability, greater root mass and vegetative biomass will need to be further exploited. It is a priority objective for adapting to climate change in the tropics (Hanson et al. Reference Hanson, Gniffke, Shieh, Tan, Wu, Lu, Tseng, Wang and Hsiao2011).
These are globally important vegetables with a ready market worldwide and suitable for production by smallholder farmers, the principal target group of many of the international agricultural research centres (AVRDC 2010).
Warmer temperatures may cause changes in the epidemiology, population composition and virulence of bacterial and fungal diseases. One of the key pathogens of peppers has already adapted, as Sheu et al. (Reference Sheu, Chen and Wang2009) have reported, resulting in the recent emergence of a new, more virulent A2 mating type of late blight (Phytophthora capsici), which has a higher optimum growth temperature than the A1 type. In addition, new highly aggressive strains of anthracnose (Colletotrichum spp.) are emerging in locations such as Thailand and Korea (Than et al. Reference Than, Jeewon, Hyde, Pongsupasamit, Mongkolporn and Taylor2008; Park et al. Reference Park, Kim, Park and Yoon2009), which are also countries in which the sites in Table 5 are showing the highest increases in average temperatures.
Such rapid projected temperature increases in Thailand are therefore of significance for AVRDC and its partners’ breeding programmes in pumpkin (Cucurbita spp.) and bitter gourd (Momordica charantia). Most of the Cucurbitaceae appear to be adapted to abiotic stresses including heat tolerance. Both pumpkin and bitter gourd have good vitamin and mineral contents and can be better used in the current struggle against malnutrition worldwide (Keatinge et al. Reference Keatinge, Yang, Hughes, Easdown and Holmer2011a; Hughes & Keatinge Reference Hughes, Keatinge, Nath, Chaikiattyos, Holmer and Linwattana2012). The extensive germplasm available in the AVRDC genebank is only just beginning to be exploited. Opportunities for further genetic enhancement and the option of selecting scientifically specific species adapted to these environments is a possibility for these crops in a warming world. However, issues negatively associated with increasing temperature such as a relatively greater proportion of maleness in flowers, fungal infections and greater insect pressure exposing crops to viruses are likely challenges that will have to be addressed.
Keatinge et al. (Reference Keatinge, Waliyar, Jamnadass, Moustafa, Andrade, Drechsel, Hughes, Kardirvel and Luther2010) have presented the case that the world seriously under-invests in crops other than the main staples and this threatens global nutritional security. This under-investment may imply serious risks worldwide in the face of continuing climate uncertainty. The conventional vegetable crops that have been discussed at length in the present paper are good alternatives that can reduce this risk substantially (Hughes Reference Hughes2009).
Vegetables are obvious candidates for further investment to avoid the risks associated with a lack of systems biodiversity (Lin et al. Reference Lin, Hsiao and Kuo2009). Chadha et al. (Reference Chadha, Guo and Gowda2007) and the contributors to the First International Conference on Indigenous Vegetables and Legumes aptly demonstrate that there are literally hundreds, if not thousands, of indigenous vegetable species of proven palatability to humans that could be exploited for use in changing environments. African indigenous vegetables, for instance, are capable of responding quickly to first efforts at crop improvement through plant breeding and already have ready markets in African cities (Afari-Sefa et al. Reference Afari-Sefa, Tenkouano, Ojiewo, Keatinge and Hughes2012). The ability to choose useful vegetable species from this great cornucopia of biodiversity is a major advantage for any farmer confronted with a changed or uncertain environment, as long as suitable quality seed can be made available. The AVRDC genebank alone now possesses more than 430 species of vegetables (de la Peña et al. Reference de la Peña, Ebert, Gniffke, Hanson, Symonds, Yadav, Redden, Hatfield, Lotze-Campen and Hall2011) with at least some of these capable of growing in every niche agricultural environment currently known to man.
The present paper has shown different temperature conditions can be expected in the near future that will probably vary between locations. Seemingly greater rates of increase in temperature in East Asia are of concern. Nevertheless, vegetable scientists should still remain optimistic that good production options will continue to be made available to farmers in 2025 and in 2050. This outlook assumes that governments, major donors and the private sector are willing to make the necessary investment in research and development to explore the biodiversity of vegetable crops. Much of the current research effort in vegetable horticulture is being conducted in the seriously underfunded public sector. There must be a concerted effort to invest appropriately in this aspect of agriculture to circumvent severe consequences to the world's growing population.
AVRDC would like to thank its generous and loyal donors for long-term budgetary support that contributed to this work, including the Governments of the Republic of China, the United Kingdom, Australia, the USA, and the Federal Republic of Germany, the Asia and Pacific Seed Association, and many others.
The authors would like to sincerely thank the following people and institutions for allowing access to their meteorological data for research purposes:
Australian sites – Dr M. Unkovich (University of Adelaide) for site selection and the Australian Meteorological Service for data provision.
Canadian sites – Dr S. Blade and Ms V. Chavez (Alberta Innovates – western Canada) and Professor C. Madramootoo (McGill University – eastern Canada) for site selection and the Meteorological Service of Environment Canada for access to their meteorological records database.
Costa Rica site – Dr J. Beer, CATIE (Tropical Agricultural Research and Higher Education Center), Turrialba, Costa Rica.
International Center for Agricultural Research in the Dry Areas (ICARDA) – Dr M. van Ginkel, Mr M. Salem and M. P Hayek (Meteorological Services, ICARDA, Syria).
International Crops Research Institute for the Semi-Arid Tropics (ICRISAT) – Dr P.Q. Craufurd (Agro-ecosystems, ICRISAT) and Dr. A.V.R. Kesava Rao (Meteorological Services ICRISAT, India).
International Institute for Tropical Agriculture (IITA) – Dr S. Hauser and Meteorological Services staff at IITA Ibadan.
International Center for Tropical Agriculture (CIAT) – Dr A. Palau (Central Services, CIAT, Colombia).
IRRI – Dr G. Centeno (Environmental Sciences Division, IRRI, Philippines).
International Wheat and Maize Improvement Center (CIMMYT), El Batan, Mexico – Dr K. Sonder (GIS Unit).
New Zealand site – Dr K. Pollock (Lincoln University) and the NIWA for access to the New Zealand National Climate database.
Pacific Island sites – Dr C. O'Connor (University of Hawaii) and Dr E. Skilling (Director Meteorology, Pohnpei, FSM.
Pakistani sites – Dr Asghar Ali and the Meteorological Services Department, National Agricultural Research Center, Islamabad and access to the historical database of the Meteorological Service of the Government of Pakistan.
South African sites – Dr G. Gugu Zuma-Netshiukhwi and Dr G. de Nysschen (Agriculture Research Council, South Africa) for site selection and for provision of data.
South Korean site – Dr M.-C. Cho (National Institute of Horticultural and Herbal Sciences (NIHHS), Korean RDA, Suwon, S. Korea).
Thailand site – Professor Sombat Chinawong (Vice-President, Kasetsart University, Thailand).
Turkish site – Professor Dr A.S. Anli (Agricultural Engineering Department, the University of Ankara and the Turkish Meteorological Service).
United Kingdom site – Dr M. Glendining, e-RA Curator, Rothamsted Research, Harpenden, UK.


