Introduction
The records of the global average temperature for the past 100 years show an upward trend, according to both instrumental and satellite records (IPCC, 2014; NOAA, 2016; UAH, 2017). The scientific literature on the impact of global warming begins nearly three decades ago and some of the most profound scientific advances have been made in the field of agricultural impacts (Adams et al., Reference Adams, Rosenzweig, Peart, Ritchie, McCarl, Glyer, Curry, Jones, Boote and Allen1990; Mendelsohn et al., Reference Mendelsohn, Nordhaus and Shaw1994; Rosenzweig and Parry, Reference Rosenzweig and Parry1994; Deschenes and Greenstone, Reference Deschênes and Greenstone2007; Schlenker and Roberts, Reference Schlenker and Roberts2009; Seo, Reference Seo2010b, Reference Seo2016a, Reference Seo2016d). The question most asked in the field has been how harmful global warming will be on agricultural production and farm households in low-latitude developing countries (Seo and Mendelsohn, Reference Seo and Mendelsohn2008a, Reference Seo and Mendelsohn2008b).
The literature has long concluded that the impact of global warming on agriculture in low-latitude developing countries will be severe (Reilly et al., Reference Reilly, Baethgen, Chege, van de Geijn, Erda, Iglesias, Kenny, Patterson, Rogasik, Rötter, Rosenzweig, Sombroek, Westbrook, Watson, Zinyowera, Moss and Dokken1996; Easterling et al., Reference Easterling, Aggarwal, Batima, Brander, Erda, Howden, Kirilenko, Morton, Soussana, Schmidhuber and Tubiello2007). It has been predicted that farmers in tropical, under-developed countries may suffer twice the damage predicted for farmers in mid-latitude, developed countries (Reilly et al., Reference Reilly, Baethgen, Chege, van de Geijn, Erda, Iglesias, Kenny, Patterson, Rogasik, Rötter, Rosenzweig, Sombroek, Westbrook, Watson, Zinyowera, Moss and Dokken1996; Auffhammer et al., Reference Auffhammer, Ramanathan and Vincent2006; Aggarwal and Mall, Reference Aggarwal and Mall2002; Parry et al., Reference Parry, Rosenzweig, Iglesias, Livermore and Fischer2004; Mendelsohn et al., Reference Mendelsohn, Dinar and Williams2006; Welch et al., Reference Welch, Vincent, Auffhammer, Moya, Dobermann and Dawe2010; Lobell et al., Reference Lobell, Schlenker and Costa-Roberts2011). The main reasons for such predictions were two-fold: first, the low-latitude poor countries are located in already climate adverse zones and second, these countries lack the adaptive capacity that developed countries in temperate climate zones possess.
Notwithstanding the dominant literature, behavioural economic studies of sub-Saharan African agriculture as well as Latin American agriculture have gradually revealed during the past decade that farmers in these low-latitude continents adopt a large array of farming practices and strategies, taking into account the changes in the climate regime. In Sub-Saharan Africa, a shift to heat-tolerant livestock species such as sheep and goats has occurred in response to a hotter climate regime (Seo and Mendelsohn, Reference Seo and Mendelsohn2008b). In arid climate zones, government-supported irrigation schemes as well as private irrigation schemes have made crop agriculture competitive even in these zones (Kurukulasuriya et al., Reference Kurukulasuriya, Kala and Mendelsohn2011; Seo, Reference Seo2011). A shift in planting and harvesting dates of various crops in response to changes at the start of the Indian monsoon season has been observed (Kala, Reference Kala2015). Farmers are found to have switched from a specialized cropping system to a mixed system of crops and livestock in order to cope with hotter temperatures, for example, by adding cattle, goats, or sheep to crop agriculture (Seo, Reference Seo2010a, Reference Seo2010b; Zhang et al., Reference Zhang, Hagerman and McCarl2013). An increase in climate risk in the form of higher variability of annual rainfall in sub-Saharan Africa forces farmers to adopt an integrated crop-livestock system, as does an increase in the diurnal temperature range (Seo, Reference Seo2012b). In a hot and humid climate regime, farmers in low-latitude countries have adapted by relying on forest products through a crop-forest or a crop-livestock-forest enterprise (Seo, Reference Seo2010c, Reference Seo2012a, Reference Seo2014).
Owing to the limited adaptation behaviour accounted for in the climate change impact models on agriculture, the literature has long predicted severe damage to agriculture in low-latitude developing countries (Rosenzweig and Parry, Reference Rosenzweig and Parry1994; Butt et al., Reference Butt, McCarl, Angerer, Dyke and Stuth2005; Welch et al., Reference Welch, Vincent, Auffhammer, Moya, Dobermann and Dawe2010; Lobell et al., Reference Lobell, Schlenker and Costa-Roberts2011). However, if a full range of adaptation portfolios were to be taken into account in the impact models, the impact of future climate change on agriculture even in these most vulnerable regions would turn out to be quite modest (Seo, Reference Seo2015, Reference Seo2016a, Reference Seo2016b).
Of all the regional climate regimes on Earth, a monsoonal climate is one of the most daunting climate regimes, if not the most, as far as farmers' adaptation behaviours are concerned. It is characterized by a drastic shift from a heavy downpour of rain in the monsoon season to a dry season with almost no rainfall (Chung and Ramanathan, Reference Chung and Ramanathan2006; Meehl and Hu, Reference Meehl and Hu2006; Bollasina et al., Reference Bollasina, Ming and Ramaswamy2011; Turner and Annamalai, Reference Turner and Annamalai2012). A recent study of Indian agriculture shows that the ratio of monsoon season precipitation over non-monsoon season precipitation is as large as 50 in some States, but still Indian farmers have found ways to adapt to the severe monsoonal climate regime by increasing the number of goats owned or adjusting planting dates of crops (Kala, Reference Kala2015; Seo, Reference Seo2016c).
The current paper examines agricultural data in Thailand, another country with a regional monsoon climate and with probably the best agricultural data available from monsoon regions, in order to answer the following two critical questions in the climate change literature. The first is whether farmers can adapt to a regional monsoon climate in order to minimize the damage from climate change. The second question is whether agriculture in the low-latitude country has fully adapted to changes in the climate system because of a rapid rate of technological developments, therefore future climatic changes will inflict no significant damage.
The agricultural data were obtained from the Food and Agriculture Organization (FAO), which documented agricultural production and value data from the 1950s onwards based on official statistics from Thailand, from which the current paper utilizes the data from 1960 to 2015 (FAO, 2017). Using historical changes in rice yield, the impact of technological changes on rice yield was estimated in the first stage, controlling climate variables, soils and geography, and social variables. In the second stage, the impacts of the monsoon climate regime on six types of farm animal, i.e. goats, chickens, cattle, sheep, pigs and buffaloes, are separated after controlling the impact of technological changes. For analysis, climate data were obtained from the Climate Research Unit at the University of East Anglia, which is made available at the World Bank Climate Change Knowledge Portal (Harris et al., Reference Harris, Jones, Osborn and Lister2014; World Bank, 2017a). Other socio-economic data, including rural population and political regime changes, were also obtained from the World Bank.
A theory of the impact of climate change on agriculture and a two-stage time series estimation method of the impact of climate change with an instrumental variable of technological progress is explained. The data and their sources and empirical results are presented subsequently, each of which addresses the above-stated questions on agricultural climate change adaptations.
Materials and methods
A farmer is faced with yearly fluctuations of weather as well as changes in climate ‘norms’, in addition to non-climate, non-weather variables (Reilly et al., Reference Reilly, Baethgen, Chege, van de Geijn, Erda, Iglesias, Kenny, Patterson, Rogasik, Rötter, Rosenzweig, Sombroek, Westbrook, Watson, Zinyowera, Moss and Dokken1996; Seo, Reference Seo2013). Climate ‘norms’ are expressed in the climate change literature as a ‘temperature normal’ and a ‘precipitation normal’ (UNFCCC, 1992; Le Treut et al., Reference Le Treut, Somerville, Cubasch, Ding, Mauritzen, Mokssit, Peterson, Prather, Solomon, Qin, Manning, Chen, Marquis, Averyt, Tignor and Miller2007), defined as a 30-year average of annual mean temperature or precipitation, most often for the period from 1961 to 1990. In the monsoonal climate zones, climate normals should reflect the regional climate regime, i.e. a monsoon climate (Chung and Ramanathan, Reference Chung and Ramanathan2006; Meehl and Hu, Reference Meehl and Hu2006; Bollasina et al., Reference Bollasina, Ming and Ramaswamy2011; Seo, Reference Seo2016c).
A regional monsoon climate is characterized by the monsoon precipitation ratio (MPR), defined as the ratio between monsoon season rainfall and dry season rainfall (Seo, Reference Seo2016c). The monsoon precipitation ratio normal is defined as the 30-year average of the ratio between monsoon season precipitation (PREC m) and non-monsoon season precipitation (PREC nm – from this point on, a normal variable is denoted by superscript O) (Seo, Reference Seo2016c):
where m denotes a monsoon season, nm a non-monsoon season, t a year and k an index.
Rice is the most important agricultural product in Thailand, which is the world's leading rice exporter (World Bank, 2009). In a major departure from other yield studies (Deschenes and Greenstone, Reference Deschênes and Greenstone2007; Schlenker and Roberts, Reference Schlenker and Roberts2009; Lobell et al., Reference Lobell, Schlenker and Costa-Roberts2011; Kala, Reference Kala2015), in order to separate the impact of a change in climate normals from the impact of a change in yearly weather, annual rice yield (y, in kg/ha) is averaged for the long-term, i.e., 30 years, to construct a rice yield normal:
The change in rice yield normal can be attributed to technological developments, after excluding the effects of changes in a monsoonal climate regime, changes in social variables such as population changes (POP) and political regimes (POL), and changes in soils and geography. With these variables as explanatory variables, TE a temperature normal, and s a season, the following Autoregressive Regression (AR(1)) was run to separate the impact of technological changes on rice yield (Johnston and DiNardo, Reference Johnston and DiNardo1997; Wooldridge, Reference Wooldridge2010):

where ε t is the error term, assumed to be white noise. Note that soils and geography are time-invariant variables across the time period considered, therefore controlled exogenously (Soil Survey Staff, 1999; Driessen et al., Reference Driessen, Deckers and Nachtergaele2001; Deschenes and Greenstone, Reference Deschênes and Greenstone2007). Excluding the parameter estimates on monsoonal climate changes and social changes, the technological development indicator (ỹ) is estimated using solely the AR(1) parameter estimate on rice yield, $\hat{\alpha}$![]() :
:
The technological change indicator in Eqn (4) is broadly defined. That is, it can be interpreted to capture both endogenous and exogenous (of agriculture) technological changes. It captures improved farming technologies, inputs and practices, research and education, advances in health sciences and public health (Nordhaus, Reference Nordhaus, Grübler, Nakicenovic and Nordhaus2002; Evenson and Gollin, Reference Evenson and Gollin2003). Therefore, this indicator also captures a host of changes in farming practices as an adaptation to climate change.
In the second stage, a climate response function is estimated for each of the six types of live animals, after controlling changes in the technological development indicator; put differently, an instrumental variable for agricultural technological changes. The following are the second-stage climate response functions with a technological change indicator for, in order, goats, chickens, cattle, pigs, sheep and buffaloes, respectively:


where gg, cc, bb, ss, pp and ff are a 30-year average of the annual number of goats, chickens, cattle, sheep, pigs and buffalos respectively; φ is the white-noise error term in each equation. Other terms are defined as before.
In the second-stage regressions of Eqns (5a) to (5f), a major departure from the climate and agriculture literature is control of the technological indicator, which captures the impact of technological advancements during the past 65 years. This methodology separates the impact of technological changes from rice yield changes after controlling the monsoon climate, social changes, political changes, and soils and geography. The existing literature does not explicitly capture the impact of technological changes (Deschenes and Greenstone, Reference Deschênes and Greenstone2007; Seo and Mendelsohn, Reference Seo and Mendelsohn2008a; Schlenker and Roberts, Reference Schlenker and Roberts2009; Welch et al., Reference Welch, Vincent, Auffhammer, Moya, Dobermann and Dawe2010; Lobell et al., Reference Lobell, Schlenker and Costa-Roberts2011; Massetti and Mendelsohn, Reference Massetti and Mendelsohn2011).
A second major departure is that these regressions identify the impact of changes in a monsoonal climate regime by the construction of the monsoon precipitation ratio normal. With exceptions of the recent studies on Indian agriculture (Kala, Reference Kala2015; Seo, Reference Seo2016c): past economic literature has not examined the characteristics and the impact of the monsoonal climate regime on agriculture.
The data for the current study were obtained from international data platforms: Climate data from the World Bank and agriculture data from the Food and Agriculture Organization (FAO) of the United Nations. Both data sets are long-term time series data. Climate data span more than a century from 1900 to 2015 and agriculture data span from the 1950s to 2015.
The climate data are from the World Bank Climate Change Knowledge Portal, from which monthly temperature and monthly precipitation since the year 1900 are obtained for Thailand (World Bank, 2017a). The World Bank data were provided by the Climate Research Unit at the University of East Anglia (Harris et al., Reference Harris, Jones, Osborn and Lister2014).
The agriculture data are from FAOSTAT (FAO, 2017). The FAOSTAT data are compiled by the FAO based on official data submitted by the Thailand government. Some agricultural data are provided from 1950 and all agricultural data examined in the current paper are available from 1960.
The current study examines the historical rice yield (kg produced per hectare of land) from 1960. Rice yield in Thailand and other South Asian countries has also received much attention from climate researchers (Auffhammer et al., Reference Auffhammer, Ramanathan and Vincent2006; Aggarwal and Mall, Reference Aggarwal and Mall2002; Welch et al., Reference Welch, Vincent, Auffhammer, Moya, Dobermann and Dawe2010).
Livestock management is an important sub-sector of agriculture for farmers in adapting to climatic change in Sub-Saharan Africa and Latin America (Seo and Mendelsohn, Reference Seo and Mendelsohn2008b; Seo, Reference Seo2010a, Reference Seo2010b, Reference Seo2012b; Zhang et al., Reference Zhang, Hagerman and McCarl2013). The numbers of live animals held by Thai farmers annually for the time period from 1960 to 2015 were examined using the six major types of animal farmed in the country, i.e. goats, chickens, cattle, sheep, pigs and buffaloes.
Social and political data were obtained from the World Bank Development Indicators, which relies on rural population changes and major political regime changes as social control variables (World Bank, 2017b). For a political change indicator, the present author created a dummy variable for the Thai Rak Thai (TRT) Party's coming into power in 2001 and winning all elections since then (Koutsoukis, Reference Koutsoukis2017).
Results
Is there evidence of climate change?
Taking observations of changes in climate normals in Thailand over the past 116 years since 1900 as a starting point, Fig. 1 shows the monsoon season temperature normal over the time period, with the temperature normal defined as a 30-year average and the monsoon season defined as falling in July, August, September and October. Other seasons in Thailand are a cold season and a summer season.
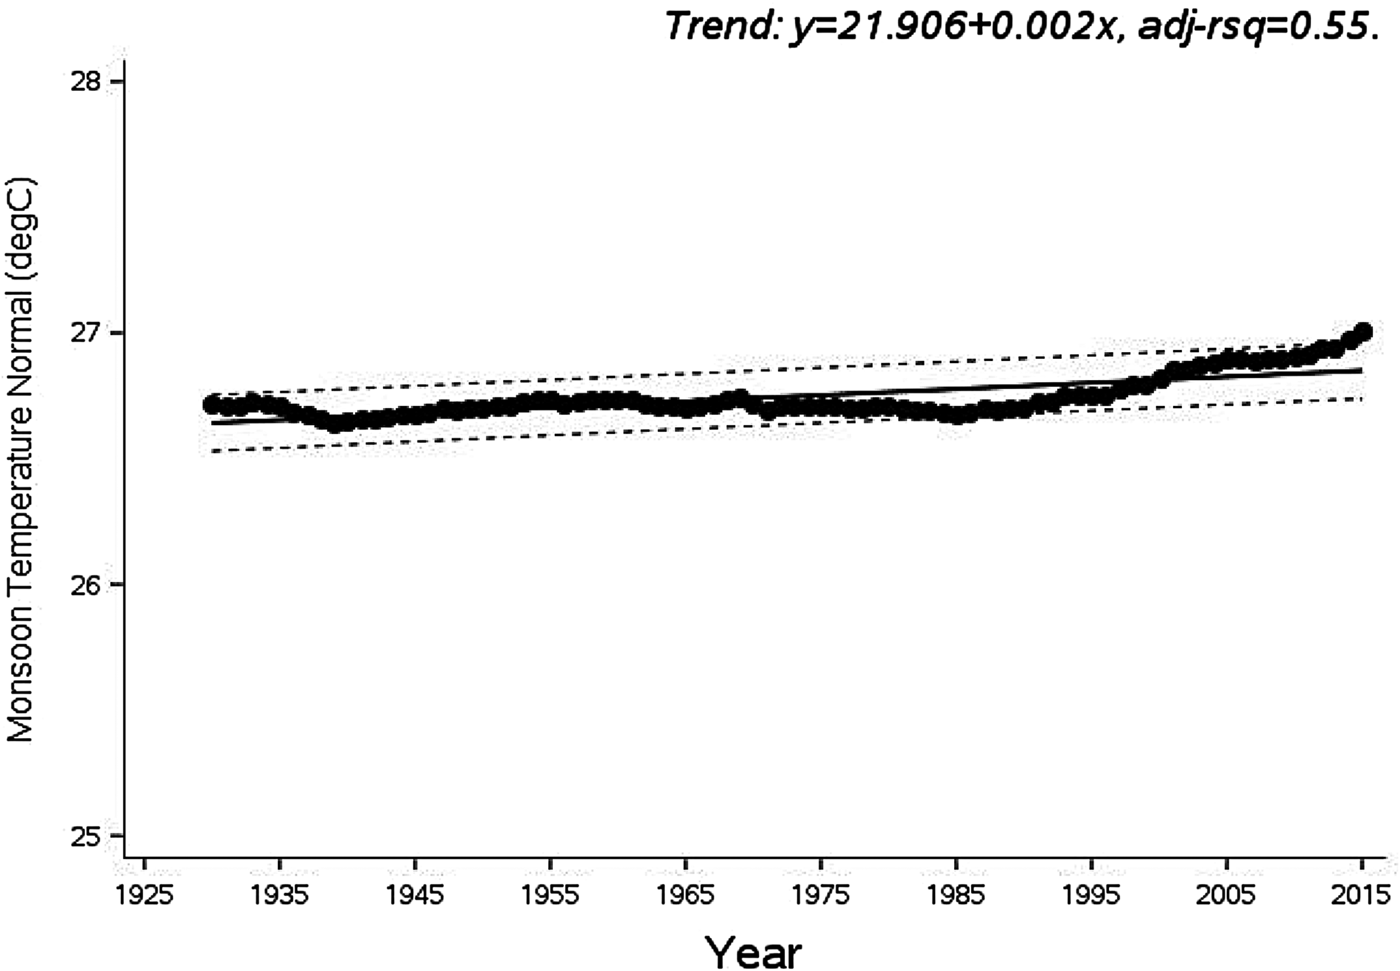
Fig. 1. Changes in monsoon temperature normal.
There was a slight rise in the linear trend line (Fig. 1). The monsoon season temperature normal has increased by 0.3 °C over the study time period. The linear change lies within the 95% prediction limits marked (Fig. 1) and therefore the change is not statistically significant.
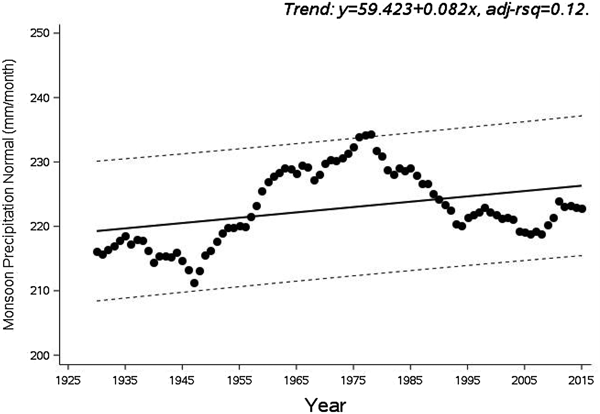
Changes in the monsoon season precipitation normal since 1900 do not show a linear trend, but rather a cyclical pattern with an upswing followed by a downswing (Fig. 2). A linear trend line was fitted, but a 95% prediction limits show that the changes fall within the limits, meaning there was no statistical significance in the cyclical pattern.

Fig. 2. Changes in monsoon precipitation normal.
A key question, therefore, is: has there been no climate change at all in Thailand? Answering yes would be a hasty conclusion that is drawn mistakenly from reliance upon traditional measures of climate change, that is, precipitation normal and temperature normal. However, the monsoon climate system that prevails in South Asia is a different kind of climate system (Chung and Ramanathan, Reference Chung and Ramanathan2006; Kitoh et al., Reference Kitoh, Endo, Krishna Kumar, Cavalcanti, Goswami and Zhou2013; Seo, Reference Seo2016c), characterized as mentioned previously by the monsoon precipitation ratio. The monsoon precipitation ratio normal (MPRN) for Thailand has increased since 1900 from about 6.7 to about 7.7 (Fig. 3) and the 95% prediction limits show that the increase was highly significant (P < 0.05).

Fig. 3. Changes in monsoon precipitation ratio normal.
How to quantify technological changes?
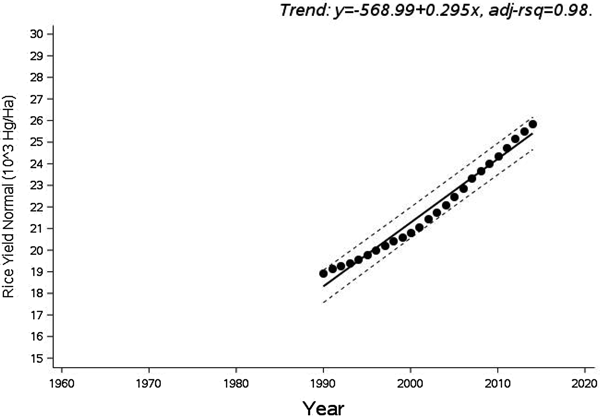
Using rice yield data since the 1960s, the increase in rice yield normal since 1990 in Thailand increased almost linearly from 1800 kg/ha to 2600 kg/ha (Fig. 4), with the trend line showing a remarkable increase (World Bank, 2009). Note that the rice yield normal per ha shown is substantially lower than the highest rice yield in major rice-producing countries because the rice yield normal (Fig. 4) is the average of the preceding 30 years (World Bank, 2008).

Fig. 4. Changes in rice yield normal.
Did the changes in the monsoon precipitation ratio normal in the region wreak havoc on Thailand agriculture? Fig. 4 indicates that the answer is most likely no. The rice yield has increased rapidly over the time period. The rice yield normal, defined as a 30-year average, has increased from about 1800 kg/ha in 1990 to about 2600 kg/ha in 2015. The trend line shows that the rice yield normal has increased by 29.5 kg/ha/year (Fig. 4).
Technological developments such as variety improvement and modification (Fig. 4), which, as noted by the widely read World Bank reports, have improved rice productivity dramatically in Thailand and elsewhere in the world, have dominated over other factors such as climatic change (World Bank, 2008, 2009; Seo, Reference Seo2014). Technological changes have been occurring both exogenously and endogenously through, for example, Green Revolution investments in agriculture or perhaps climate policies (Nordhaus, Reference Nordhaus, Grübler, Nakicenovic and Nordhaus2002; Evenson and Gollin, Reference Evenson and Gollin2003; Gillingham et al., Reference Gillingham, Newell and Pizer2008). How can the impact of technological changes be separated from the impact of climatic factors and from the trend in the rice yield normal depicted in Fig. 4?
An Autoregressive model (AR1) of rice yield normal (kg produced per ha) with a lagged rice yield normal, monsoon climate variables and social change variables. Note that time-invariant factors such as soils and geography are left out of the set of explanatory variables (Table 1) (Deschenes and Greenstone, Reference Deschênes and Greenstone2007).
Table 1. Autoregressive regression model of rice yield (hg/ha)

None of the seasonal temperature normals for the monsoon season, the summer season and the cold season are significant (Table 1), but the monsoon precipitation ratio normal (MPRN) is significant (P < 0.05) in explaining the change in rice yield normal. Interestingly, an increase in MPRN by one unit leads to 23.4 kg/ha increase in rice yield normal, possibly due to various adaptation measures including the moving of planting dates and early forecasts of a monsoon season (Kala, Reference Kala2015).
Of the social variables, the rural population was not significant. The dummy variable for the Thai Rak Thai (TRT) Party, translated as Thai Loves Thai Party in English, which has taken power since 2001, is significant and positive. The TRT Party has had several reincarnations since it first took power in 2001, via democratic elections through to the Pheu Thai Party, which held power until the end of 2016. This variable is intended to capture the impact of the political change in Thailand. Throughout the entire time period of the agricultural data, used in this study, i.e. from 1960 onwards, the country was ruled by King Bhumibol Adulyadej, who reigned from 1946 to 2016.
The lagged rice yield normal variable is positive and significant (P < 0.05). A one-unit increase in lagged rice yield normal leads to a 0.98 unit increase in rice yield normal of the study period. This estimate captures the impact of technological changes, i.e. excluding the impacts of climate variables, soils/geographic variables, and social variables, the rest is attributed to the impact of technological changes. According to this estimate, 0.98 of the growth in rice yield normal is attributable to technological changes.
Have Thai farmers fully adapted to climate changes through technological developments?
In the second stage of the model, six technological-change controlled regressions were run (Table 2) for the six types of live animal owned by farmers, i.e. goats, chickens, cattle, sheep, pigs and buffaloes.
Table 2. Second stage regressions of the number of live animals with technological progress

The technological-change (TC) instrumental variable was constructed from the estimated parameters in Table 1. Specifically, it was calculated as the rice yield normal from the estimates in Table 1, excluding the impacts of climate, soils/geography and social variables. The constructed TC instrumental variable is entered in each regression in Table 2, along with other climate and social variables for each of the six regressions.
Across the six regressions, the dependent variable is the number of the corresponding live animals owned by Thai farmers averaged over the 30-year time period studied. The same climate and social variables used in Table 1 are entered in Table 2 without changes.
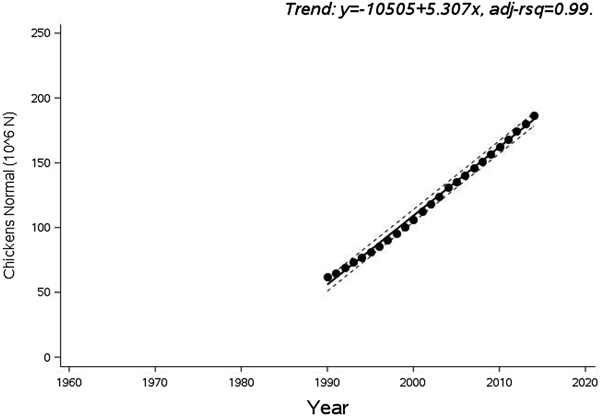
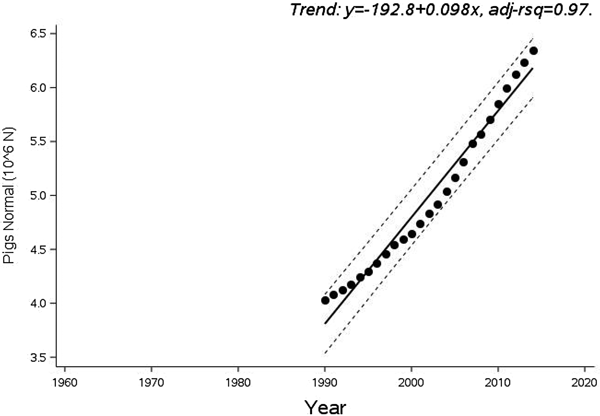
Prior to examining the regression results, changes in the normal numbers of each type of live animal should be noted (Figs 5–10). For goats, chickens and pigs, a steep linear increase in the normal number was seen during the time period of the current study. For cattle and sheep, a steep but fluctuating increase was seen. However, the normal number of buffaloes has declined steeply over the study period.

Fig. 5. Changes in the number of goats normal.

Fig. 6. Changes in the number of chickens normal.

Fig. 7. Changes in the number of cattle normal.

Fig. 8. Changes in the number of pigs normal.

Fig. 9. Changes in the number of sheep normal.
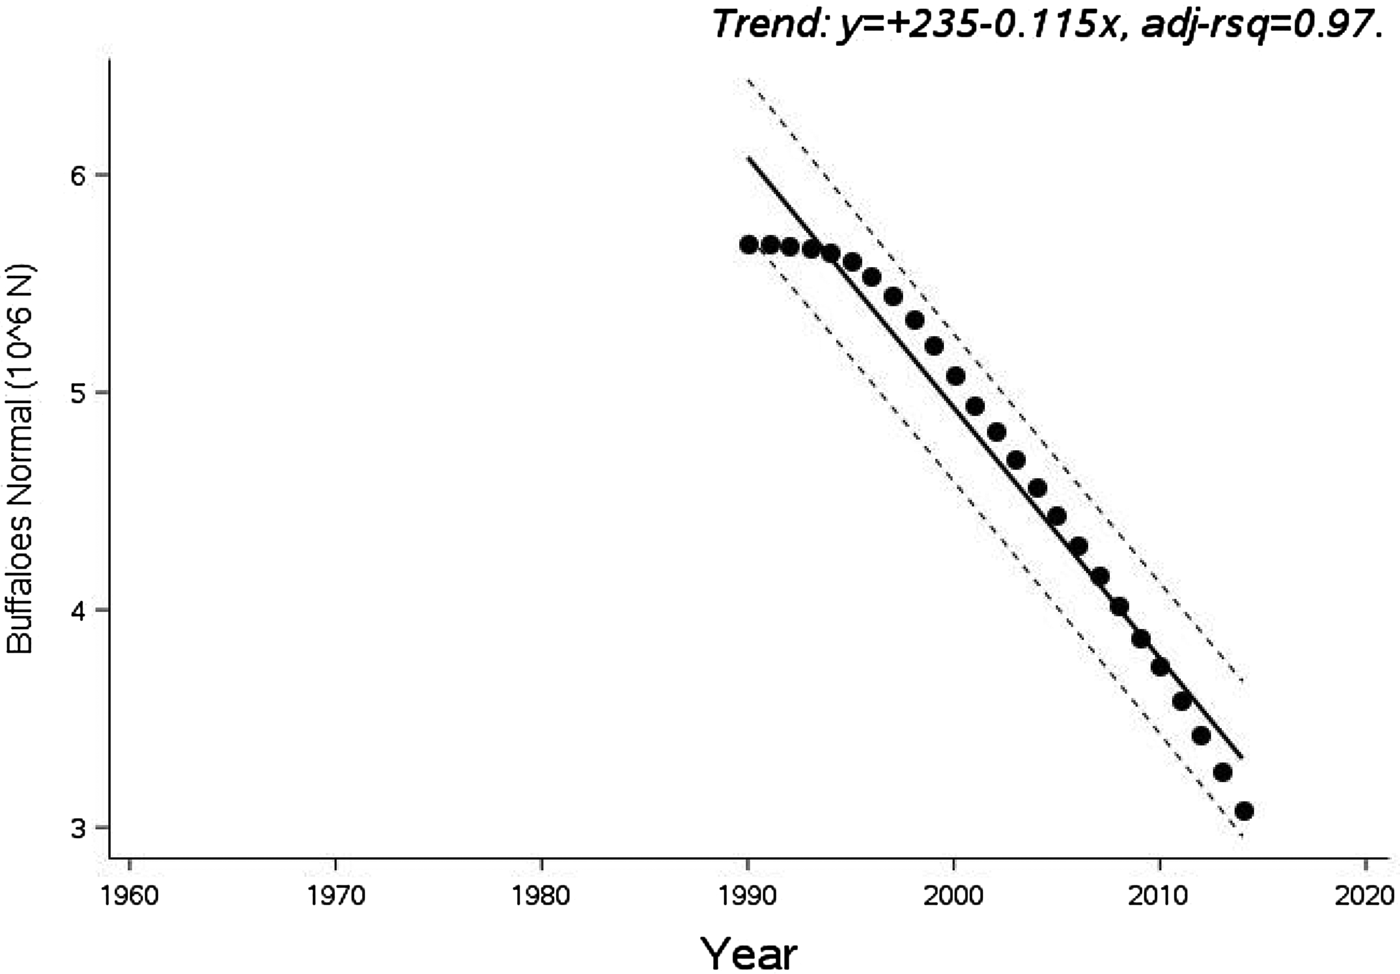
Fig. 10. Changes in the number of buffaloes normal.
These figures therefore show steep increases in the numbers of animals owned by Thai farmers over the past 60 years or so, except for buffaloes. The increases may be ascribed largely to improvements in various technological options and vaccines that have become available over time for livestock management, as well as in management practices including breed and species choices (Hahn, Reference Hahn1981; Mader and Davis, Reference Mader and Davis2004; Hahn et al., Reference Hahn, Gaughan, Mader, Eigenberg and DeShazer2009; Hoffmann, Reference Hoffmann2010; Fox et al., Reference Fox, Marion, Davidson, White and Hutchings2012; Zhang et al., Reference Zhang, Hagerman and McCarl2013).
In the case of buffaloes, it is suspected that the number of buffaloes declined because Thai people do not value them as a spiritual object of worship as Indian people do, according to Hindu tradition. The data show that Thai people have increasingly preferred other animals to buffaloes.
Across the six regressions (Table 2), the technological change (TC) instrumental variable is highly significant (P < 0.05). A one-unit increase in the TC variable, that is, a 1 kg increase in rice yield, results in a 310 unit increase in goats, an 110 unit increase in chickens, a 1680 unit increase in cattle, a 10 unit increase in sheep, a 3570 unit increase in pigs and a 3310 unit decrease in buffaloes.
These results indicate a very strong impact of the technological change on the increases of the farm animals during this time period, except for buffaloes. In the case of buffaloes, it can be interpreted that technological changes have caused economic growth, which in turn have made people value animals with higher economic value more than animals kept for spiritual reasons.
Has climate change played any role in changes in the numbers of live animals owned by Thai farmers? Across the six regressions, the monsoon precipitation ratio normal (MPRN) is not statistically significant in any of the six regressions. This result means that technological progress has dominated over effects of monsoon precipitation changes for the time period considered.
Almost none of the temperature normals were significant in explaining the numbers of animals, with the following exceptions. Excluding buffaloes, the monsoon temperature normal is significant (P < 0.05) and positive in the number of chickens. A 1 °C increase in monsoon temperature normal is associated with a 101 million increase in the number of chickens. Note that over the past 116 years, the monsoon season temperature normal has increased only by 0.3 °C.
For buffaloes, the monsoon season temperature normal is associated with a decrease of about 3 00 000 in the number of buffaloes, while the summer season temperature normal is associated with an increase of about 1 40 000.
Of the social variables, the Thai Rak Thai Party's coming into power helped to decrease the numbers of animals owned, specifically goats and cattle. This is probably the result of extensive support by the TRT Party for rice farmers, who are the main support bases of the Party (World Bank, 2009; Umeda, Reference Umeda2013).
An increase in rural population contributed to a decrease in the number of goats but increases in the numbers of chickens and cattle. These results may be attributed to the fact that rearing chickens or cattle is more labour-intensive than rearing goats. There are several reasons for this: for instance, goats are more resilient to various climate factors such as heat stress, heavy rainfall and monsoon rainfall variability (Seo and Mendelsohn, Reference Seo and Mendelsohn2008b; Seo, Reference Seo2016c). Further, people do not hold goats in as high esteem as cattle, to which spiritual values are often attached, especially in South Asian countries.
Discussion
The current paper tackles one of the most critical policy questions on climate change and global warming: will farmers fully adapt to future climatic changes because of a faster rate of technological developments? An examination of Thai agricultural data since 1960 shows increases in key agricultural production and ownership indicators, which overwhelm any increase in temperature normals or the monsoon precipitation ratio normal.
The data were analysed by a set of two-stage time series regressions. In the first stage, the magnitude of the impact of technological changes on Thai agriculture was estimated using historical changes in the rice yield normal data. The first stage regression showed that technological progress explains most of the changes in rice yield over the past 65 years. However, the monsoon precipitation ratio normal is also a significant factor.
In the second-stage regressions, the number of each species of farm animal owned by Thai farmers was estimated with the technological-change instrumental variable, climate variables, social variables and soil/geography variables. The second-stage regressions of the six animal species – goats, chickens, cattle, sheep, pigs and buffaloes – show that technological progress is a dominant cause of changes in the numbers of these animals. The monsoon precipitation ratio normal was not significant in any of the second-stage regressions.
These results show that Thai farmers have adapted successfully to changes in the climate over the past 65 years. By reaping the benefits of unprecedented technological advances which have been occurring both endogenously and exogenously of the agricultural sector, Thai farmers have been able to adapt fully to changes in the regional monsoon climate over the time period of the current study (Evenson and Gollin, Reference Evenson and Gollin2003; Nordhaus, Reference Nordhaus, Grübler, Nakicenovic and Nordhaus2002).
Will Thai farmers be able to adapt similarly to future climate change as well? Past climate changes were small in Thailand, the most significant of which was the rise in monsoon precipitation ratio normal from about 6.5 to about 8. A further rise in this ratio or an increase in extreme weather-related events may or may not be realized due to future climate changes (Ueda et al., Reference Ueda, Iwai, Kuwako and Hori2006; Bollasina et al., Reference Bollasina, Ming and Ramaswamy2011; May, Reference May2011; IPCC, 2014; NRC, 2013; NASEM et al., 2016). Even if a significant rise in this monsoon ratio materializes, the results of the current paper indicate strongly that Thai farmers will be able to adapt to most of those changes as long as the rate of technological change and the rate of climate change fundamentally do not break away from the present rates, which is a different conclusion from a number of other studies that predict severe damage from future extreme climate events on agriculture in low-latitude developing countries (Rosenzweig et al., Reference Rosenzweig, Iglesias, Yang, Epstein and Chivian2001; Aggarwal and Mall, Reference Aggarwal and Mall2002; Schlenker and Roberts, Reference Schlenker and Roberts2009). This conclusion is inevitable because the rate of technological development is far outpacing the rate of climate change at the present time.
This is an important empirical finding in the literature of climate change. It shows for the first time that farmers will be able to adapt fully to climatic changes, owing to rapid technological progress. This is consistent with findings from other continents such as Latin America, where adapting sensibly makes the impacts of future climatic changes very modest (Seo, Reference Seo2016a, Reference Seo2016b). It should be noted that the technological progress in the current paper is inclusive of numerous changes in farming behaviours and practices that have been associated with technological developments and advances in agricultural science and information.
From the policy angle of climate change discussions, the current paper adds further evidence to the trend in the climate policy circle in which adaptation has increasingly gained prominence in climate research and policy dialogues. The results in the current paper could provide critical inputs in negotiations of global climate financing such as the Green Climate Fund (GCF, 2011; UNFCCC, 2011, 2015; Seo, Reference Seo2015, Reference Seo2017).
Acknowledgement
I would like to thank the editor Dr. Bilsborrow and the referees who provided thoughtful comments.
Author ORCIDs
S. N. Seo, 0000-0002-2719-8315
Financial support
This research received no specific grant from any funding agency, commercial or not-for-profit sectors.
Conflict of interest
None.
Ethical standards
Not applicable.


