

1. Introduction
DNA databases make it easier for investigators to find and prosecute the perpetrator of a crime. If criminals weigh the expected benefits from a successful crime with the risks of being caught and punished, a collection of their DNA sample also deters future crime by increasing the likelihood of being caught and punished. DNA databases generally mandate sample collection based on the nature of the underlying offense. When DNA collection is part of a plea agreement, however, the sample is voluntarily submitted. Defendant uptake may signal a lower likelihood to reoffend and so improve outcomes upon release while avoiding the public costs of punishment. Prosecutors also have wider discretion on who they offer DNA submission and collect samples that would not otherwise have been submitted to state or federal governments. More, a locally sourced DNA database receives results from crime scene evidence faster than state or federal databases. This study conducts a benefit–cost analysis (BCA) of operating a local DNA database in addition to a state database by comparing operational costs with estimated foregone costs of future crimes. This study not only informs administrators on the merit of a local DNA database, it also examines a mechanism to deter future crimes while avoiding the costs of diversion, probation, and incarceration.
While there has yet to be a BCA of a DNA database, past literature have examined their effect on crime. Briody (Reference Briody2006) compares outcomes between defendants who entered a DNA sample upon conviction and defendants who did not in Queensland, Australia. While the author did not observe differences in reoffense or sentence length, entry correlated with the defendants’ propensity to plead guilty. Doleac (Reference Doleac2017), on the other hand, finds a significant deterrence effect of the U.S. Federal DNA database on crime and suggests that DNA databases are more cost-effective than traditional law enforcement. Anker, Doleac, and Landersø (Reference Anker, Doleac and Landersø.2021) similarly report that an expansion in the cases for which DNA was collected in Denmark decreased recidivism in the following year by up to 42%. These inconsistent results may be due to the correlative methods or small sample size in the first study, which contrasts with the causal estimates and larger samples of the latter two studies. Although smaller in magnitude, our estimate of the deterrence effect coheres with the more rigorous estimates.Footnote 1
Our research extends these studies in a couple of ways. First, both papers employ an instrumental variables approach, which can only estimate the effect of DNA collection for a subset of the population of interest. The matching estimator we employ here is only limited by the availability of a suitable match in the control group. Our individual-level analysis is also considerably more robust, due to a much larger sample size than that of both Doleac (Reference Doleac2017) and Anker et al. (Reference Anker, Doleac and Landersø.2021), while also containing observed DNA database entry information that was not obtained in Doleac (Reference Doleac2017). Recall, too, that the aforementioned features of the local DNA database studied here are distinct from the databases examined in past research.
The first DNA database in the United States was implemented in Colorado in 1988. This tool expanded nationwide soon after with the DNA Identification Act of 1994, which funded federal DNA laboratories and authorized the compiling of a DNA database. The federal government also assisted in the creation of state-level DNA databases. By 1999, every state had complied with the National DNA Index System and created a database within the Combined DNA Index System (CODIS) structure. California began collecting DNA in 1994. Voters in the state expanded the cases in which DNA was collected and used by passing Proposition 69, “DNA Fingerprint, Unsolved Crime, and Innocence Protection Act,” in November, 2004. These databases differ in the crimes for which a defendant must provide a DNA sample. Individuals charged with federal offenses, including terrorism, violent crimes, or sexual offenses, have DNA collected by the federal government, though this sample is removed if the suspect is not charged or convicted, or their conviction is overturned. In California, someone arrested on suspicion of a felony or convicted of a felony has their sample entered into the state database (i.e., CODIS) where it may remain indefinitely.
The Orange County, California Board of Supervisors, approved the allocation of local funds to create the Orange County (OC) DNA database in 2007.Footnote 2 Entry into this DNA database is voluntary. Defendants who face misdemeanor charges either enter the database voluntarily in lieu of a conviction or as part of a plea agreement. Samples are submitted to a private company, an accredited DNA laboratory, for testing. Advantages of this local database are the wider span of crimes for which collection occurs and a quicker turn-around time for prosecutors to receive results, particularly when using a Rapid DNA instrument. The Orange County District Attorney’s Office (OCDA) can run a DNA analysis on a sample and compare it to their DNA database with results in less than 2 hours, whereas state and federal databases can take weeks, if not months.Footnote 3 Roth (Reference Roth2019) studied the OC DNA database through field interviews and public records. Two of her main criticisms, tested here, are that (i) there are diminishing returns to the database wherein the costs exceed the benefits and that (ii) public safety is compromised due to a backlog of samples in need of testing, which delay convictions.
Our main question is whether the benefits of a local DNA database outweigh the costs. Since state and federal databases are already a resource for local district attorney offices, the results from past studies may not apply in the present case. More importantly, there may be no unique deterrence effect from local DNA collection. On the other hand, if such a database is cost effective, it may be a viable option for prosecutors to divert cases, reach plea agreements that reduce punishments, deter future offenses, and resolve future offenses more quickly. We estimate benefits and costs with case-defendant data published by the OCDA coupled with office-provided records of entrants into the DNA database and reasons for entry. After summarizing these data in the following section, we describe our methods for estimating the benefits and costs. Results are then presented. Over the last 10 years, we find that an additional dollar spent on the operational expenses of the DNA database results in a $1.71 reduction in the estimated cost of crime. We conclude by discussing the implications of the results, limits to our study, and suggestions for future research.
2. Data and methods
A retrospective BCA will be conducted from 2006 to 2022 that allows the costs and benefits to vary over time. Costs are provided by the OCDA and described below. Benefits are estimated as foregone costs – namely, reduced reoffenses due to solving or deterring crime – and so our methods exclude the intangible benefits of reduced crimes, victim’s knowledge about a criminal is apprehended and punished, and enhanced public safety. These limitations are a common problem with estimating the benefits of criminal justice policy and practice, and so not unique to this study. Despite these limits, the estimated benefits are likely a lower bound since the administrative costs are well-defined. That is, except for the costs of starting and running the local database, there are no costs associated with the prosecutors use of DNA collection in lieu of dismissal or as part of a plea agreement, nor obvious non-monetized costs to the community. After describing the costs, we summarize the calculation used to estimate benefits.
According to office records, the local DNA database had net aggregate costs of nearly $40 million and has a current annual operating budget of $3 million. Administrative records of costs include salaries, employee benefits, supplies, and services expenditures for fiscal years 2006–2022.Footnote 4 Costs figures are adjusted for inflation and presented in 2022 dollars.Footnote 5 To account for the fixed costs of the office, we reduced supply and service costs by 10% and labor costs by 50%.Footnote 6
Figure 1 shows how total costs of the OC DNA program evolved. Before the program began (fiscal year 2006), there were no supply expenses and expenditures were approximately $800,000. Supplies and personal spending increase through 2010 with total yearly spending plateauing around $2 million. In 2014, net spending increased again until attaining the peak cost of the program in 2017 at $3.4 million. Costs decreased slightly after 2018 till reaching roughly $2.75 million in fiscal year 2022. The net aggregate costs of operating the DNA program during the entire period totaled $39,838,208.10. Revenues obtained by DNA processing fees, DNA collections, and Proposition 69 funds offset some of these costs as well.Footnote 7 This revenue totals $14,447,009. Below, costs are reduced by annual revenues.

Figure 1. Costs by year. Note: Figure shows the costs for salaries, supplies, and both added together (total) by fiscal year. Salary data is offset by revenues generated in each year. The beginning of the fiscal year is on the x-axis. Data come from the OC District Attorney’s Office.
The efficiency of the DNA database depends less on net costs than on cost per match between a DNA sample taken at a crime scene and an individual DNA profile in the database – a “hit” or investigative lead. Hits are credited to OC DNA for one of the four reasons: (1) the OC DNA hit was unique or did not also hit in CODIS within 10 days of the OC DNA hit; (2) the DNA hit in CODIS but was in the database because of a specimen that was collected by the OCDA as a result of PC 296(a)(5)Footnote 8; (3) the hit results from OCDA’s Rapid program; and (4) the hit was from outside the county but credited to OC DNA by the California Department of Justice since the sample was collected by OCDA per PC 296(a)(5).
The number of hits has changed over time. Figure 2 shows annual hits from 2010 to 2023 by the four types of OC DNA hits defined above.Footnote 9 The earlier years (2007–2009) are excluded since searches were not conducted as the database held few samples. In the last 13 years, the OC DNA database grew significantly, which led to more hits. On average, the OC DNA program produced 211 hits per year since 2015. Among them, 87 are PC 296(a)(5) collections, 30 are Rapid hits, 70 were not identified in CODIS, and 24 came from out of county. The highest number of hits occurred in 2019 (255).
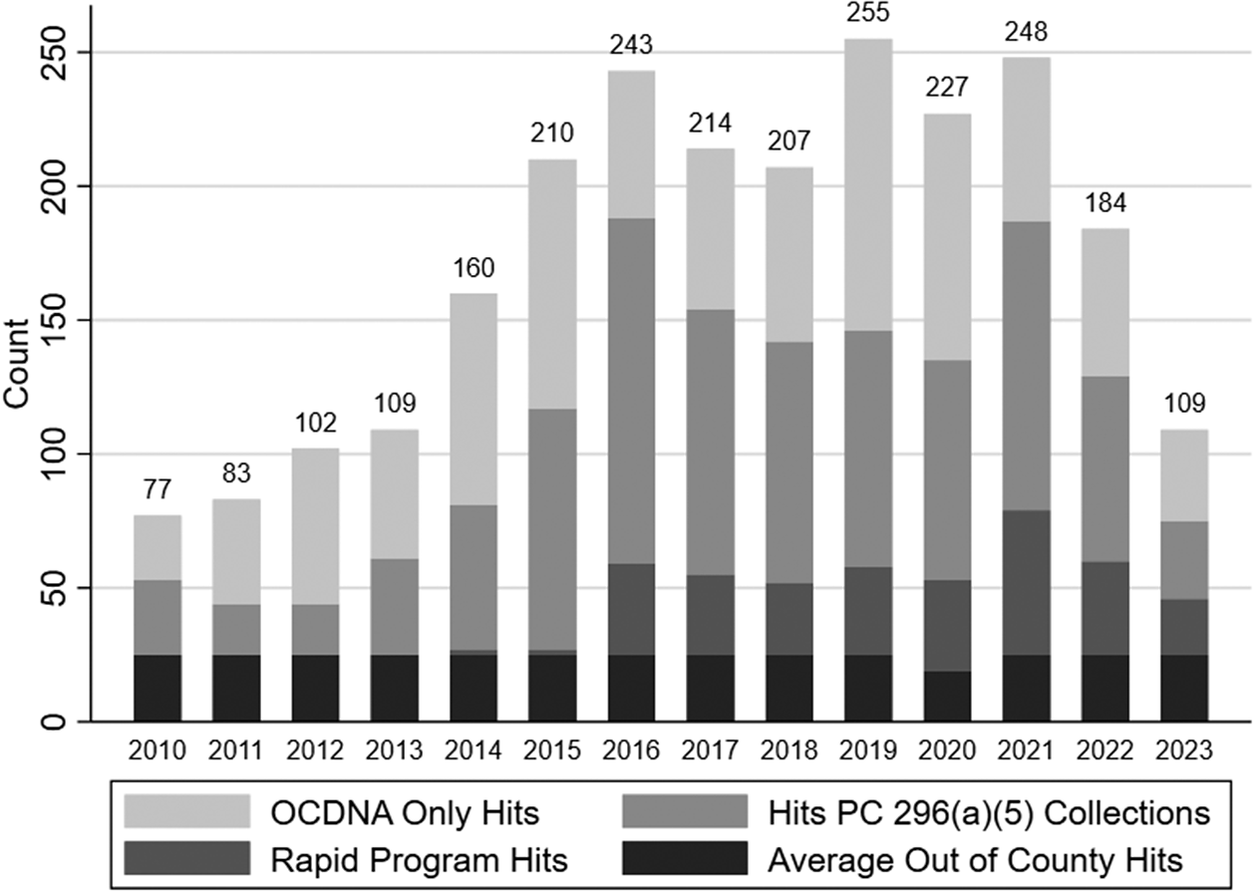
Figure 2. OCDNA hits per year. Note: Figure provides annual counts of the number of hits attributable to the OCDNA program for the four types of hits: (1) the OC DNA hit was unique and did not also hit in CODIS within 10 days of the OC DNA hit; (2) the DNA hit in CODIS but was in the database because of a specimen collected by the OCDA as a result of PC 296(a)(5); (3) the hit results from OCDA’s Rapid program; (4) the hit was from outside the county but credited to OC DNA by the California Department of Justice since the sample was collected by OCDA per PC 296(a)(5). Data come from the OC District Attorney’s Office.
Given the number of hits per year, we now calculate the net costs per hit. While program costs have increased (see Figure 1), so as the number of hits (Figure 2). Figure 3 shows the cost for one hit by dividing the total net spending for each year by the number of hits that year. For example, there were 77 hits in 2010 with a net spending of $2.47 million. As a result, the cost per hit was $32,102. Since the slope of hits was higher than the slope of costs, the spending per hit dropped 67% from 2010 to 2016 ($10,667 per hit in 2016). Between 2017 and 2022, the average per-hit cost was $13,815.
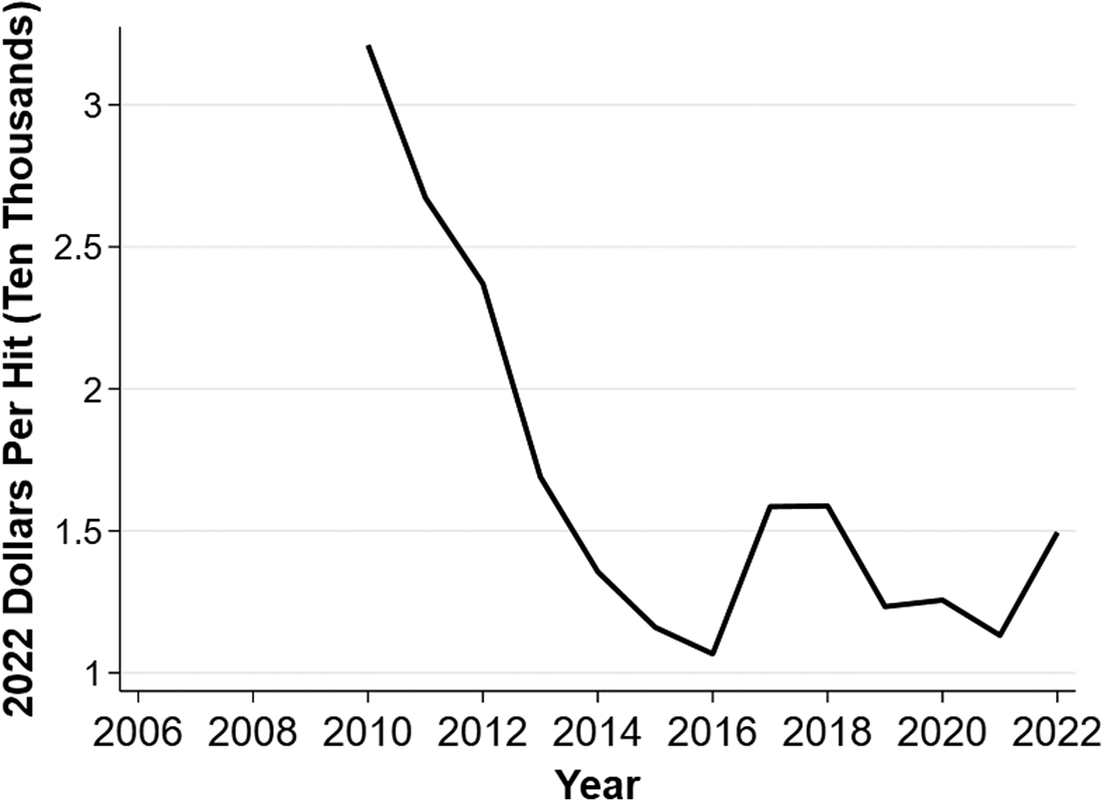
Figure 3. Net costs per hit. Note: Figure shows the net spending per hit in each fiscal year. The beginning of the fiscal year is on the x-axis. Spending per hit is on the y-axis, is adjusted for inflation, and expressed in 2022 dollars. Spending includes salaries and supplies. Data come from the OC District Attorney’s Office.
The administrative data provided by OCDA as well as their data on prosecution have important limitations. Cases involving a DNA hit and the resulting case disposition are observed; however, the data cannot show the potential resolution if not for the local DNA database. This limit obscures which types of cases more often lead to a hit and their case length. These factors are benefits, not costs, and so the results of this analysis are a lower bound.
Having described how costs are calculated, we turn to benefits. The impact of the OC DNA program is quantified by the reduction in reoffenses by crime type and by the cost savings associated with the reduction in reoffenses. The estimates produced in this report use the RAND Cost of Crime Calculator and cost of crime estimates from Miller, Cohen, Swedler, Ali, and Hendrie (Reference Miller, Cohen, Swedler, Ali and Hendrie2021) as a supplement for crime categories not covered in the RAND Cost of Crime Calculator. These studies estimate the cost of crime via both direct costs of victimization (e.g., costs of health care, property damages) and criminality (e.g., the judicial process and incarceration), as well as more indirect costs such as losses in productivity and quality of life. While the literature relied on to estimate forgone costs attempts to account for some intangible costs (e.g., lost productivity of victims), some of the most important benefits of solving a crime are excluded: that is, the psychological benefits to the victim and impacted community and an increase in public safety.
The reduction in reoffenses is estimated in two steps. First, the total reduction in future offenses in OC is estimated by crediting each hit with a 13.64% reduction in reoffenses. For the estimate of this deterrence effect, see Appendix A. The 2,428 hits credited to OCDNA results in 331.18 fewer future reoffenses. Next, the types of crimes avoided are assumed to follow the distribution of the “top” chargesFootnote 10 filed in OC since 2013.Footnote 11 , Footnote 12
An illustrative example of the reduction in future offenses is found by examining burglaries. From the 2,428 hits credited to the OCDNA program, 331.18 future offenses will be avoided, since these hits may have never occurred if the criminal justice system in OC solely relied on the CODIS database. Of felony “top” chargesFootnote 13 filed in OC since 2013, 11.09% (15,042/135,662) were burglaries. This implies a reduction of 36.7 burglaries. This process is repeated across all crime types. Table 1 provides the estimated reduction in recidivism that resulted from hits in the OCDNA database by crime type. The largest reductions in reoffenses are attributable to drug offenses (82), burglary (37), aggravated assault (35), and motor vehicle theft (34).Footnote 14
Table 1. Summary of deterrence and savings calculations by crime
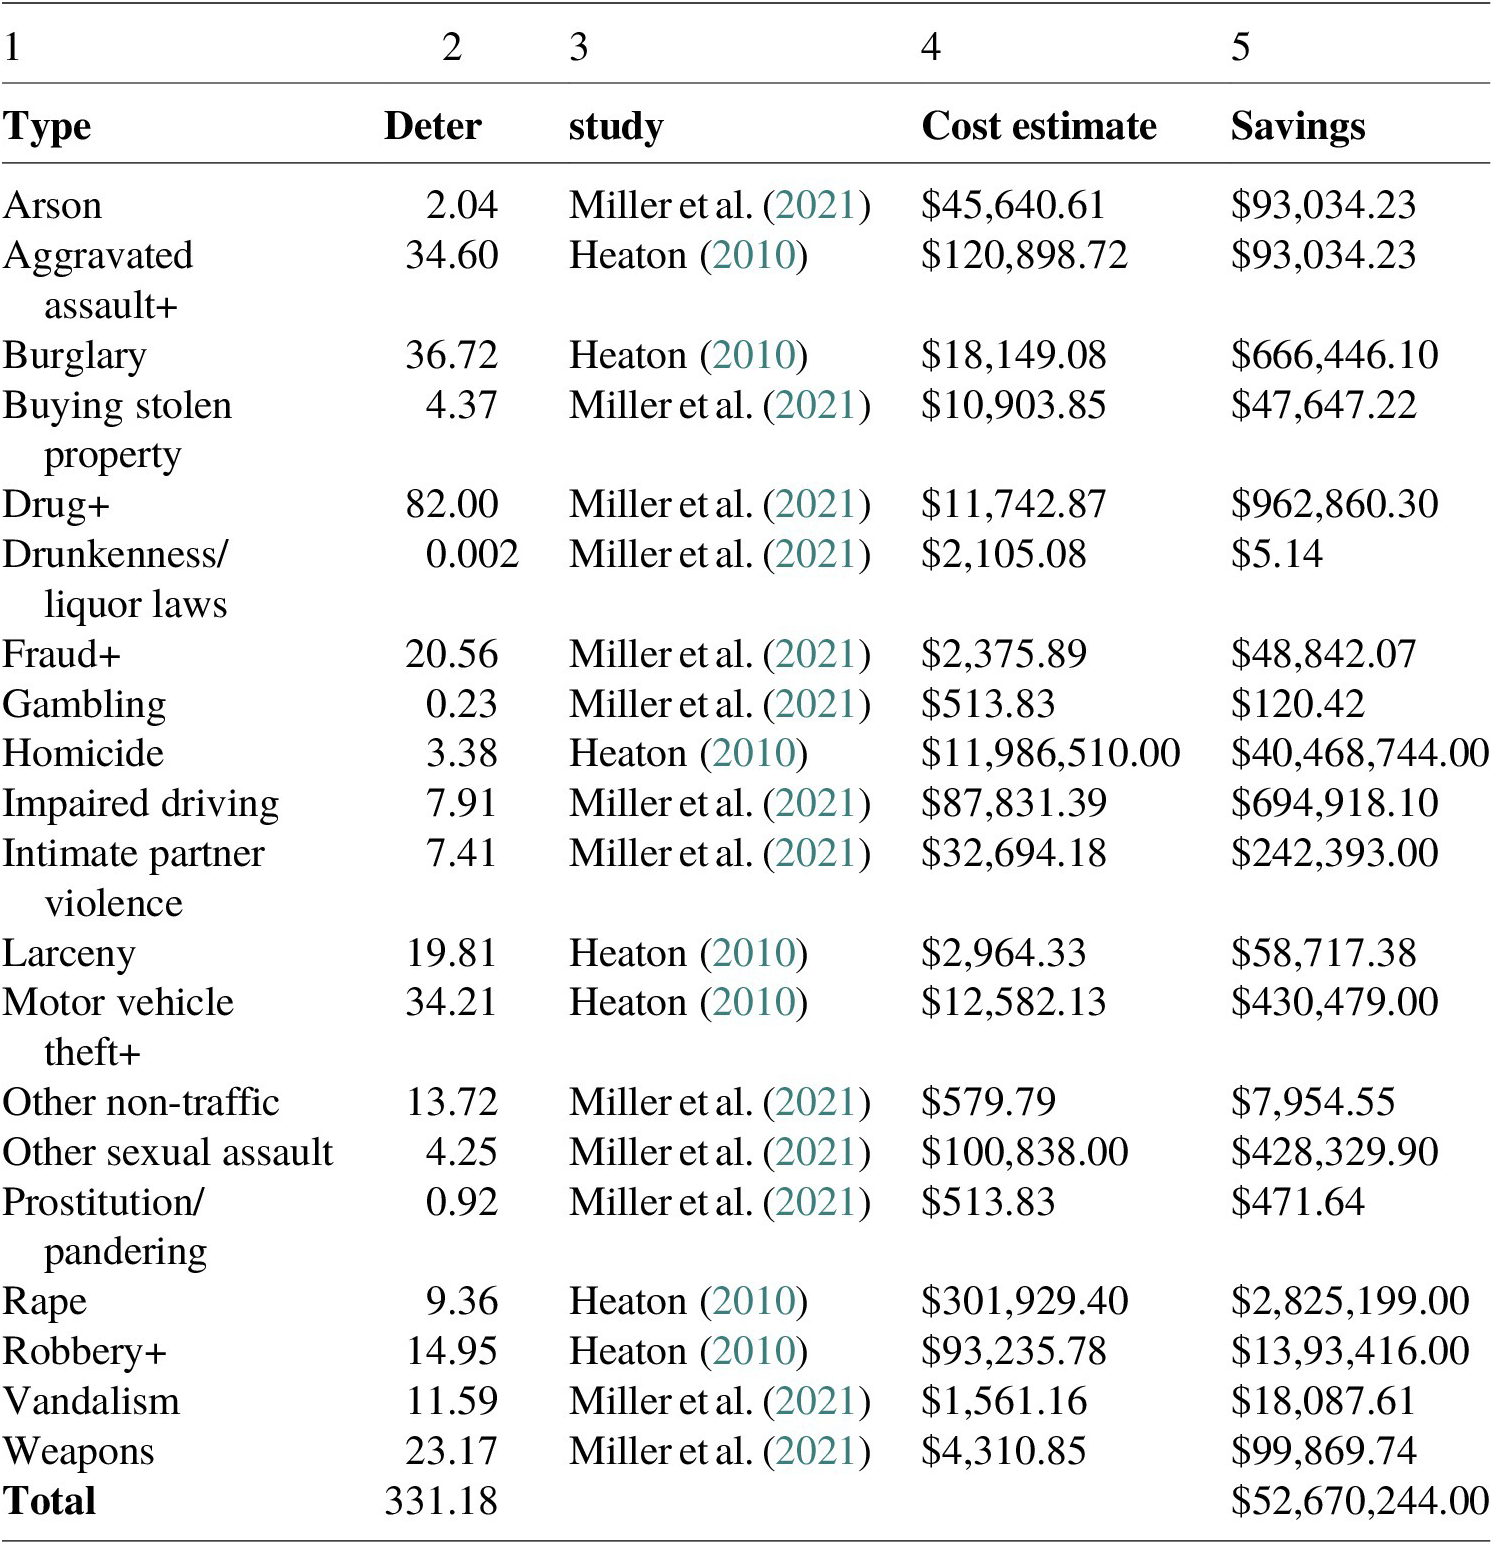
Note: Calculations for how hits from the OCDNA database affect deterrence by crime type. Column 2 shows reductions in reoffenses. Column 3 displays which study the cost estimates are derived from. Column 4 displays cost of crime estimates in 2022 dollars to facilitate comparisons to the cost data. Column 5 shows estimated savings from reduced crime. See Table A1 in Appendix A for mapping of Orange County crime categories to the crime categories in Heaton (Reference Heaton2010) and Miller et al. (Reference Miller, Cohen, Swedler, Ali and Hendrie2021).
The second measure used for calculating the effect of the OCDNA database on community safety is the cost savings that resulted from fewer re-offenses. Using the RAND Cost of Crime Calculator (Heaton, Reference Heaton2010) and Miller et al. (Reference Miller, Cohen, Swedler, Ali and Hendrie2021) as a supplement for crimes not included in Heaton (Reference Heaton2010), a cost is associated with each crime type and displayed in column 4 of Table 1. Column 2 shows the deterred crimes, column 3 the study used for the estimated cost per crime of a given type, then the cost estimate, and the fifth column shows the savings resulting for the crimes deterred and cost per crime. Overall, the OC DNA database yields an aggregate cost reduction of $52,670,244.
3. Results
Given the evolving costs and benefits, results are shown over time. The dynamic element comes from comparing the yearly net cost per hit with the deterred crimes. Despite the number of entrants and even decreasing operational costs, fewer hits raise the net cost of the database. More hits reduce costs. One concern, then, is whether the database results in enough hits to regularly clear costs; however, the deterred crimes from entry into the database also lessen costs. We find that benefits clear costs in 2012, exactly 5 years after the OCDA received approval to begin the DNA database. The benefits remain strongly positive thereafter.
Figure 4a shows the monetary benefits associated with less recidivism minus the net costs (total supplies and salary minus revenue). To calculate the annual monetary benefits, the number of hits (Figure 2) is used to weight the estimated savings from Table 1 to different years. For example, there were 77/2,319 (3.32%) hits in 2010.Footnote 15 The subsequent benefits due to deterred reoffenses are $1,748,861 in 2010, which are then subtracted by the net costs of $2.47 million. Thus, the OC DNA program produced $722,979 in net losses in 2010.

Figure 4. Comparison of benefits to costs. Note: Figures show the yearly net costs of OC DNA compared to the yearly benefits of OC DNA. In all figures, the estimated benefits are allocated across years by the fraction of the total hits produced that occurred in that year. See Sections 3 and 4 for details on how the benefits are calculated and Table 1 for a summary of the benefit estimates. For costs, salaries of all employee types and the costs of supplies are included. For (a), the line shows the benefits (in terms of reduced future crime) minus the net costs (in terms of supplies and salaries less revenues) for each year. For (b), the line shows the benefits divided by the net costs for each year. Data come from the OC District Attorney’s Office.
The Return on Investment (ROI) turns positive after 2012. By 2016, the benefits exceed the costs by $2,926,959. There is a dip in benefits in 2017, when spending peaked (see Figure 1), yet the program yielded net benefits of $1,468,433. Since 2018, benefits exceeded costs by $2,301,193, on average.
The aforementioned results are reported as a ratio of benefits to net costs in Figure 4b. When the program was first credited with hits in 2010, the benefits in terms of reduced crime were 71% of the costs: that is, an additional dollar spent on the OC DNA program in 2010 would has reduced future crime costs by 71 cents. The ratio rises to 1.52 in 2022 and averages 1.51 over the entire period. Since 2013, benefits have cleared or exceeded net costs. Considering only 2013 to 2022, the benefit–cost ratio averaged 1.71, which means that each dollar spent on the DNA program yields $1.71 in benefits.
To test the robustness of the above results, we perform the following sensitivity analysis: we alter the estimates from Miller et al. (Reference Miller, Cohen, Swedler, Ali and Hendrie2021) and Heaton (Reference Heaton2010) of the cost of crime by 10% and 20% and see how the estimated benefit–cost ratio fluctuates. Given the acknowledged limits with these estimates of the cost of crime, these adjustments show a plausible bound around what we argued above is a conservative estimate. Figure 5 presents these results. The positive ratio persists after the third year of the OC DNA program despite reductions of $5.27 million (10%) and $10.53 million (20%).

Figure 5. Comparison of benefits to costs. Note: Figures show the yearly net costs of OCDNA compared to the yearly benefits of OCDNA for 10% and 20% reductions and increases in the estimated costs of crime. In both figures, the estimated benefits are allocated across years by the fraction of the total hits produced that occurred in that year. See Section 2 for details on how the benefits are calculated and Table 1 for a summary of the benefit estimates. For costs, salaries of all employee types and the costs of supplies are included. For (a), the line shows the benefits (in terms of reduced future crime) minus the net costs (in terms of supplies and salaries less revenues) for each year. For (b), the line shows the benefits divided by the net costs for each year. Data come from the OC District Attorney’s Office.
4. Discussion
The total savings attributed to the OC DNA program is about $52.7 million over the life of the program. These cost reductions from reoffenses likely increase in recent years as the database produces more hits. Relative to the lifetime costs of operating the program, the average benefit–cost ratio is roughly 1.51. This is well higher than the common threshold of determining the financial feasibility of a project, which is 1. As mentioned in Section 2, moreover, this ratio is a conservative estimate given other intangible benefits that are excluded. In this final section, we consider the consequences of these findings, their limitations, and recommendations for future research.
Results suggest that counties relevantly similar to OC would benefit from operating a local DNA database in addition to a state database as a cost-effective strategy for resolving and deterring crime. Various factors may influence such a database’s success or failure. Entry into the OC DNA database is voluntary and is often negotiated as part of a plea agreement. Defendants who elect to enter the database may relevantly differ from defendants who refuse or those for whom entry is not offered. The impact of a local database may differ depending on the conditions for entry. These conditions may also influence the deterrence effect of entry. Since benefits are defined here as the foregone costs of reoffenses, differences in the likelihood of defendants who enter to reoffend may dramatically influence the cost–benefit calculation.
This study has limits with how benefits and costs are calculated. If these limits are addressed, the results may change. The costs of operating the OC DNA program exclude the legal or political costs: a database may make a DA Office more susceptible to lawsuit or lessen the electability of a DA. But there are potential benefits along the same lines that are excluded. DA Offices may benefit from increased access to DNA evidence when prosecuting crimes besides the quicker resolution of cases. For example, certain charges may be pursued that otherwise would have lacked sufficient evidence. When running for office, a DA may benefit politically from forming a DNA database. We also exclude the psychological benefits to victims of solving crimes and the similar benefits to a community when public safety improves.
There are a few directions for future research. Cost estimates gain precision if researchers worked with an in-house budget analyst to specify prosecution, law enforcement, and court costs. These costs could then be used to estimate the average cost of a case per day, which would contribute to an analysis of the benefits of resolving cases more quickly. If cases that resulted in entry into the DNA database were linked with data on which later cases resulted in a hit, researchers could also examine how plea agreements and sentences impact future criminal behavior. Better estimates of the DNA database’s deterrence effect could also be obtained from causal estimates, which specify the effect of the database by addressing selection bias.
DA Offices form part of the critical criminal justice infrastructure to ensure public safety by maintaining rule of law. Our results cohere with findings from other research that DNA databases are useful tools in reducing criminal behavior. The OC DNA database has produced a total of 6,911 hits over 14 years of the program’s existence, 2,428 of which were unique and credited exclusively to the OC DNA database. Although we are unable to determine the causal relationship between hits and arrests, charges filed, or convictions, we calculated best estimates for the value add of the database and compared these benefits to operational costs. Over the last 10 years, a dollar spent on operating the DNA database has yielded $1.71 in reduced costs from criminal reoffenses. This result justifies the continued use of the database and promotes its adoption in other jurisdictions.
A. Appendix A: Estimating the Deterrence Effect
The central benefit used in this analysis is the foregone costs of fewer future offenses. This section shows that entry into the DNA database has a deterrence effect. We estimate this effect by comparing similarly-situated defendants who are and are not entered into the database. Comparing outcomes of defendants who enter the database to those who do not presents an unlikely estimate since only lower severity offenses are eligible for entry. Defendants who commit worse offenses may be incarcerated for longer, differ in their propensity to reoffend as well as their type of reoffense, and likely differ in other unobservable ways. These differences suggest a more sophisticated technique is required to estimate the deterrence effect of OC DNA program.
Nearest neighbor matching (NNM) identifies observably similar defendants to those who entered the DNA database. Each defendant that entered the DNA database is paired with the most similar defendant who did not enter the database, where similarity is defined as a weighted average of select covariates: gender, year of offense, crime typeFootnote 16, whether the case is a felony, and whether the defendant had a prior felony or misdemeanor arrest within the last 2 years prior to the case. The estimated counterfactual outcome of entered case defendants is the average outcomes of similar case defendants. The estimated deterrence effect is the average difference between the outcome of those entered into the DNA database and their imputed counterfactual.Footnote 17
While this method better identifies a comparison group rather than comparing averages between those who enter the DNA database and those who do not, a causal interpretation is dubious. For the NNM estimate to receive a causal interpretation, we must assume that the only relevant difference between our treated outcome and potential outcome is that the former entered the database and the latter did not. The variables matched on account for all other relevant differences that may influence the outcome. However, many factors contribute to an individual’s decision to commit a crime. Unobserved in our analysis are socioeconomic status, social networks, mental and behavioral health, and substance abuse history. As a result, a seemingly comparable defendant may differ in their propensity to reoffend from their matched counterpart. To mitigate this worry, we match entered case-defendants with the average of five most similar defendants. But this choice cannot resolve selection bias: namely, that defendants opt in to the program. The factors leading a prosecutor to offer entry and prompting a defendant to accept or deny entails a selection effect that undermines a causal interpretation.
OCDA publishes case-defendant data with an identifier for the defendant’s demographics and sex, assigned prosecutor, the filed charges, whether the case was plead down, disposition, and the formal sentence. These data are supplemented with information on which defendants entered the DNA database, when they were entered, and the reason for their entry. Rejected cases are dropped, as are personal identifiers marked 0 or missing, defendants that do not contribute a DNA sample with a 3-year or longer prison sentence are excluded, too, as well as treated defendants before treatment and their reappearances after treatment.Footnote 18 The resulting dataset has 929,454 case defendants from 2000 through June 2022. There are 669,803 unique defendants. Of these defendants, 190,512 were entered into the DNA database.Footnote 19 Figure A1 shows the number of entries into the DNA database by month. While the office received DNA samples beginning in 2007, entries increased by 711% from 2007 to 2009. There is a steady decline thereafter until 2015, when entries slightly increase until 2017 before declining again. In early 2020, entries stopped entirely but then began to increase again subsequently.

Figure A1. Entries into DNA database. Note: Figure presents the sum total of entries into DNA database by month. Data come from the OC District Attorney’s Office. While the office began receiving DNA samples in 2007, entries sharply increased in 2009.
On observable characteristics, defendants who enter the DNA database differ from those who do not. Figure A2 shows the composition of each group in terms of gender, case severity, and criminal history. Cases that result in entry are more often misdemeanors and are often the defendant’s first crime. Figure A3 shows the crime types across groups.Footnote 20 Differences across crime types are slight, which is likely due to differences between defendants who enter the DNA with a full dismissal and those who enter upon conviction.

Figure A2. Enter versus no enter: Defendant characteristics. Note: Figure presents the proportion of case-defendants by case characteristics who entered the DNA database (dark gray) and those who did not (light gray) by gender and criminal history. For example, 71.8% of case defendants entered into the DNA database are male, while 28.2% are female. Data come from the OC District Attorney’s Office.

Figure A3. Enter versus no enter: Case characteristics. Note: Figure presents the proportion of case-defendants by case characteristics who entered the DNA database (dark gray) and those who did not enter (light gray) by crime type. For example, 5.2% of case defendants who enter the DNA database committed an assault. Data come from the OC District Attorney’s Office.
Figures A4 and A5 compare defendants who enter with a full dismissal and those who enter upon conviction. These separate ways that defendants enter the DNA database distort interpretations given from direct comparisons of average outcomes as well as estimates of the deterrence effect that aggregate over these differences. Propensities to reoffend likely differ between defendants whose case is dismissed and those for whom entry is part of a plea agreement. More, defendants who enter the database with a conviction likely serve a sentence and so are either incapacitated or serving probation. The former makes them less likely to reoffend, while the latter makes detection of a reoffense more likely. Note the discrepancies of crime type in Figure A5. These differences suggest different prosecutorial strategies across crime types: that is, prosecutors seem more likely to offer DNA entry as a condition of dismissal for narcotics crimes but offer it as part of a plea agreement in DUI cases.

Figure A4. Enter: Full dismissal versus enter: Conviction – Defendant characteristics. Note: Figure presents the proportion of case-defendants by case characteristics who entered the DNA database with a full dismissal (dark gray) and those who entered upon conviction (light gray) by gender and criminal history. For example, 70.6% of case defendants entered into the DNA database with a full dismissal are male, while 29.4% are female. Data come from the OC District Attorney’s Office.

Figure A5. Enter: Full dismissal versus enter: Conviction – Case characteristics. Note: Figure presents the proportion of case-defendants by case characteristics who entered the DNA database with a full dismissal (dark gray) and those who entered upon conviction (light gray) by crime type. For example, 4% of case-defendants who enter the DNA database with a full dismissal committed an assault. Data come from the OC District Attorney’s Office.
Compare the above figures with the composition of defendants who never enter the DNA database after matching. Figures A6 and A7 show that, after matching, the covariates that are likely to influence recidivism balance, which supports using this matched sample to estimate the counterfactual outcome of defendants who entered the database. The only persisting discrepancy is that the matched defendants who did not enter the database more often have a prior misdemeanor. If this lengthier criminal history correlates with a greater likelihood to reoffend, the results overstate the DNA database’s deterrence effect because the matched defendants are more likely to reoffend than the defendants who entered irrespective of the database. The distribution of crime types are nearly identical.

Figure A6. Enter: Full dismissal matched sample composition: Defendant characteristics. Note: Figure presents the proportion of case defendants by case characteristics who entered the DNA database with a full dismissal (dark gray) and those who entered upon conviction (light gray) by gender and criminal history. For example, 70.6% of case defendants who enter the DNA database with a full dismissal are male. Here, their characteristics are reported after matching defendants who enter with a full dismissal with similar defendants who enter upon conviction. Five nearest neighbors are used. Data come from the OC District Attorney’s Office.

Figure A7. Enter: Full dismissal matched sample composition: Case characteristics. Note: Figure presents the proportion of case-defendants by case characteristics who entered the DNA database with a full dismissal (dark gray) and those who entered upon conviction (light gray) by crime type. For example, 3.6% of case-defendants who enter the DNA database with a full dismissal committed an assault. Here, their characteristics are reported after matching defendants who enter with a full dismissal with similar defendants who enter upon conviction. Five nearest neighbors are used. Data come from the OC District Attorney’s Office.
After matching, estimates show a significant reduction of future reoffenses for those who enter the DNA database. Three matching exercises were performed. First, defendants who first enter the DNA database are matched to defendants who never enter the database. But this comparison aggregates over the different channels of entry into the database: namely, with a dismissal or upon conviction. We then match defendants who entered with a dismissal to defendants who never entered and were convicted. Significant reductions in reoffense are observed across outcomes. Our last set of results compare defendants who enter the database upon a conviction with defendants who do not enter but are convicted. Although more likely to reoffend relative to defendants who enter with a dismissal, convicted entrants remain less likely to reoffend than their convicted counterparts who ever enter. Nine outcomes are considered: reoffense in 1, 3, and 5 years, than those windows separated into reoffense severity (i.e., felony or misdemeanor).
Tables A2 and A3 present results comparing defendants who enter with those who do not. The estimated deterrence is more pronounced in the first year after the original offense. Defendants are 7.5 percentage points less likely to reoffend in the first year, a 66.9% reduction. The difference remains pronounced within the 3 year window (15% less likely to reoffend) yet becomes slighter at the 5-year mark (1.7% less). This pattern holds when the time windows are distinguished by case severity, except that felony reoffenses still significantly reduce within 5 years (an 18% reduction).
Table A1. Mapping of OC crime categories to study category
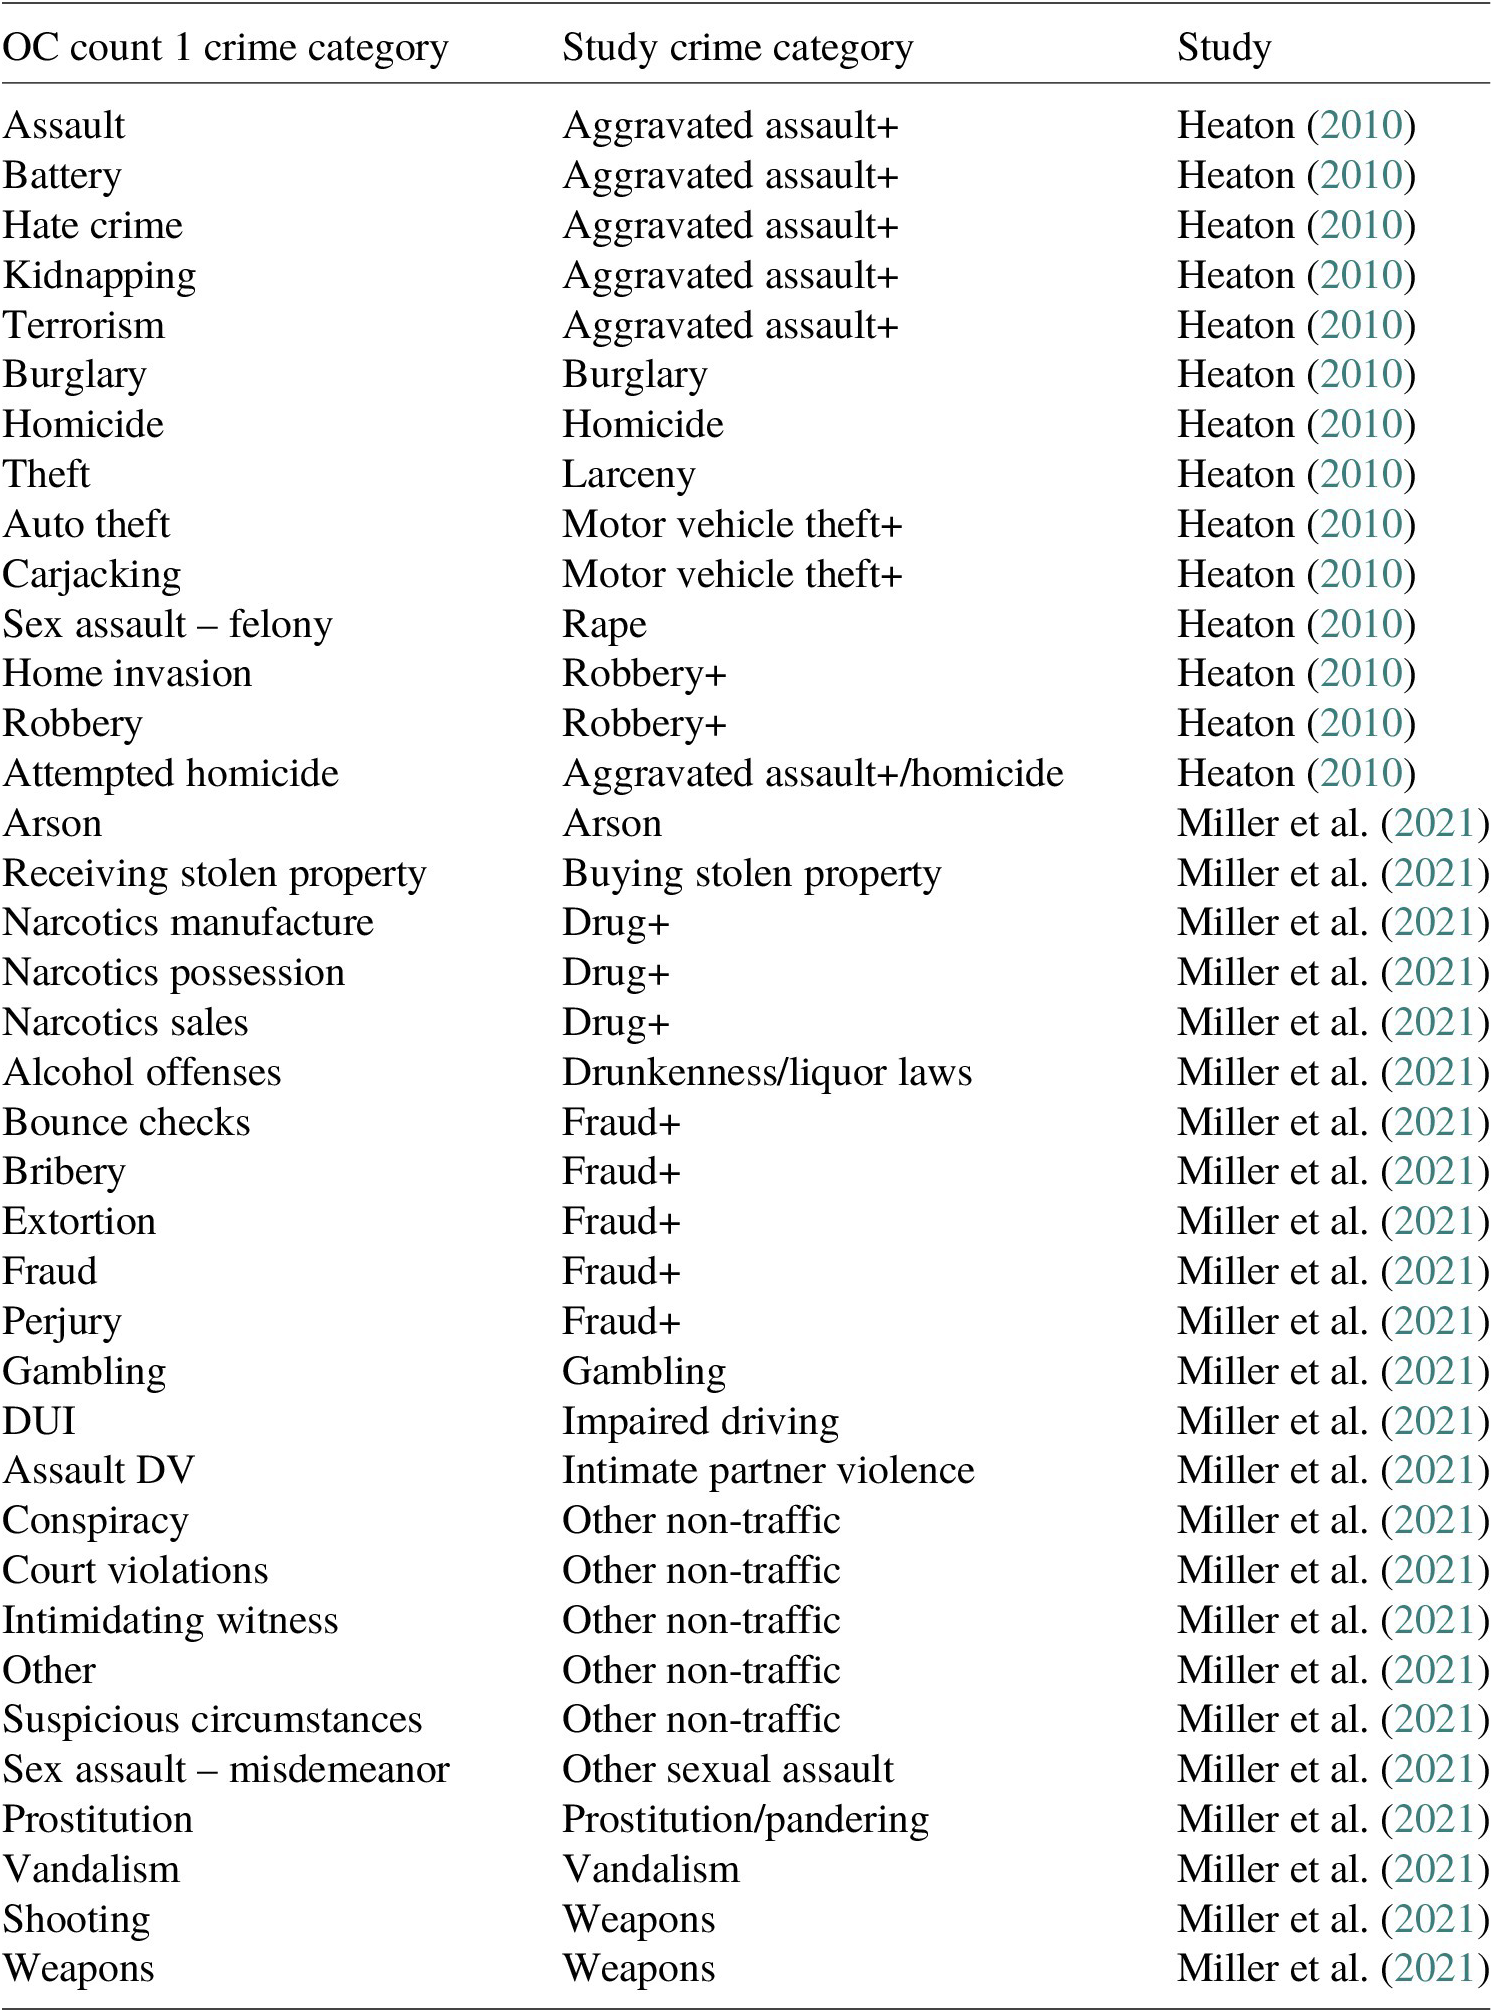
Table A2. NNM estimate for recidivism on DNA database entry: Entry to no entry
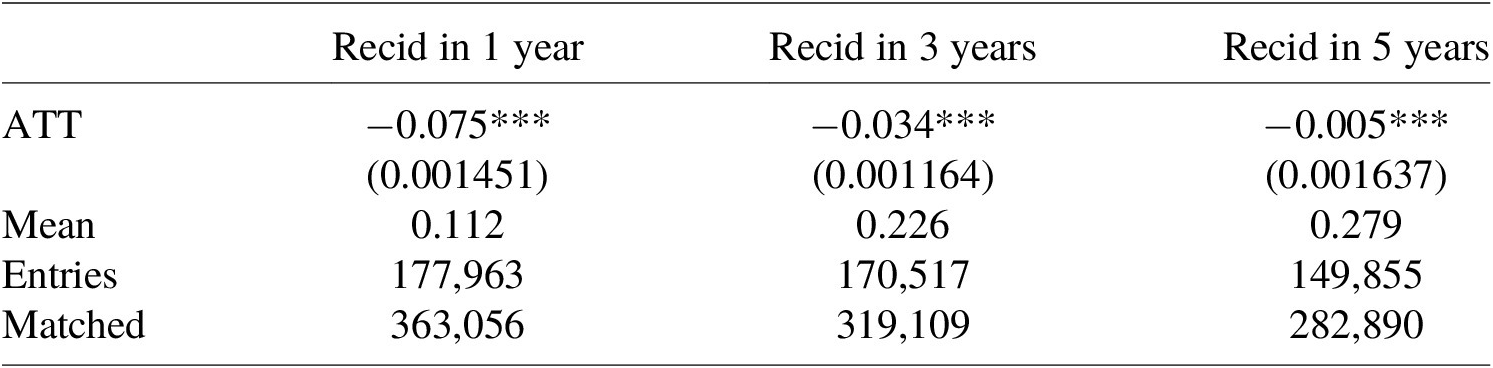
Note: Results are from nearest neighbor matching. Defendants are matched by gender, year of offense, crime type, case severity, and whether the defendant had a felony or misdemeanor offense or conviction during the 2 years prior to the case. Data come from the Orange County DA Office. Standard errors reported in parentheses.
*p<0.05, **p<0.01, ***p<0.001.
Table A3. NNM estimate for recidivism on DNA database entry by charge severity: Entry to no entry
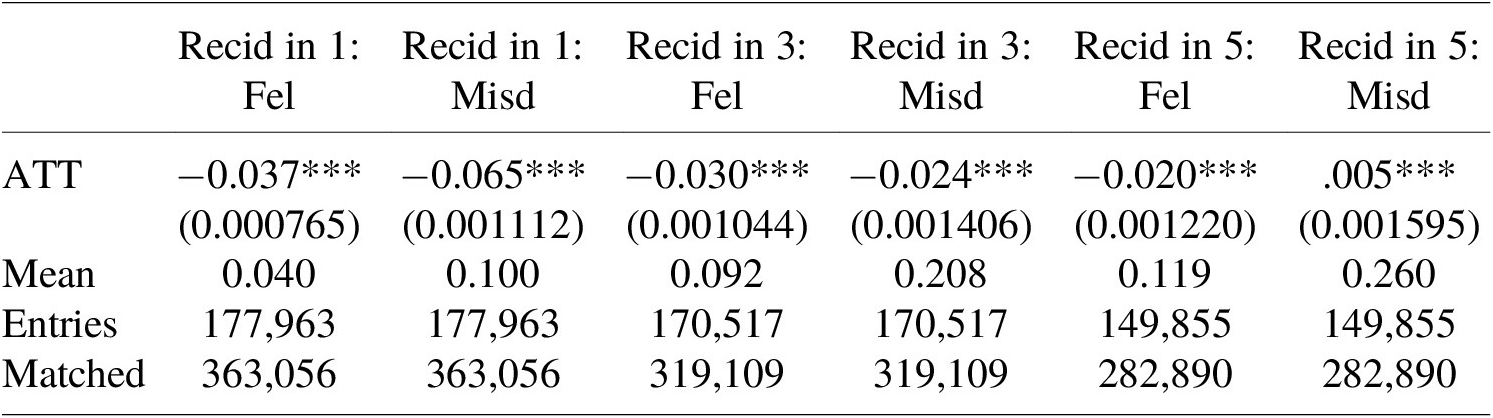
Note: Results are from nearest neighbor matching. Defendants are matched by gender, year of offense, crime type, case severity, and whether the defendant had a felony or misdemeanor offense or conviction during the 2 years prior to the case. Data come from the Orange County DA Office. Standard errors reported in parentheses.
*p<0.05, **p<0.01, ***p<0.001.
The likelihood of future reoffense significantly differs among defendants who enter with a dismissal and those who never enter and are convicted. Table A4 shows reductions at over 100%, 57%, and 34% reductions at the 1-, 3-, and 5-year marks, respectively. These results persist when the outcomes distinguish between felonies and misdemeanors (Table A6). Again, comparing defendants who enter upon conviction to those who are convicted but do not enter (Tables 7 & 8), results are highly significant and show reductions across outcomes. These results suggest that even though defendants who enter upon conviction may be more likely to reoffend than those who enter with a dismissal, defendants in aggregate are deterred from reoffending when entered into the local database. These estimates also stress that the 13.7% deterrence effect assumed in the main analysis is conservative.
Table A4. NNM estimate for recidivism on DNA database entry: Entry with dismissal to no entry and conviction

Note: Results are from nearest neighbor matching. Defendants are matched by gender, year of offense, crime type, case severity, and whether the defendant had a felony or misdemeanor offense or conviction during the 2 years prior to the case. Data come from the Orange County DA Office. Standard errors reported in parentheses.
*p<0.05, **p<0.01, ***p<0.001.
Table 6. NNM estimate for recidivism on DNA database entry by charge severity: Entry with dismissal to no entry and conviction

Note: Results are from nearest neighbor matching. Defendants are matched by gender, year of offense, crime type, case severity, and whether the defendant had a felony or misdemeanor offense or conviction during the 2 years prior to the case. Data come from the Orange County DA Office. Standard errors reported in parentheses.
*p<0.05, **p<0.01, ***p<0.001.
Table 7. NNM estimate for recidivism on DNA database entry: Entry upon conviction to no entry with conviction

Note: Results are from nearest neighbor matching. Defendants are matched by gender, year of offense, crime type, case severity, and whether the defendant had a felony or misdemeanor offense or conviction during the 2 years prior to the case. Data come from the Orange County DA Office. Standard errors reported in parentheses.
*p<0.05, **p<0.01, ***p<0.001.
Table 8. NNM estimate for recidivism on DNA database entry by charge severity: Entry upon conviction to no entry with conviction

Note: Results are from nearest neighbor matching. Defendants are matched by gender, year of offense, crime type, case severity, and whether the defendant had a felony or misdemeanor offense or conviction during the 2 years prior to the case. Data come from the Orange County DA Office. Standard errors reported in parentheses.
*p<0.05, **p<0.01, ***p<0.001.


 Open access