


Introduction
The first part of this review will describe the background to the molecular systems of water, their interactions with dissolved substances and the exploitation of this information in NIR milk analysis.
The role of the water molecular system in the determination of the conformational structure of biomolecules in bovine milk
The beginning of the scientific research conducted on the molecular structure of water can be traced back to the second half of the 18th century to the English chemist Henry Cavendish, who discovered the chemical formula of water from the reaction between two parts of hydrogen and one part of oxygen (Cavendish, Reference Cavendish1766). Since then, several studies have deepened this fundamental chemical compound's chemical, physical and biological properties. Water is a small, electrically neutral molecule with a polar identity resulting from the greater electronegativity of the oxygen atom capable of attracting the electronic cloud around the molecule with a greater force than the individual proton charges of the two hydrogen atoms. The polarity of this covalent bond creates a partial positive charge on the hydrogen atom and a partial negative charge on the oxygen atom, resulting in a dipole moment of the water molecule. Such a polar bond also enables water molecules to form hydrogen bonds with each other, causing them to attract one another, with the positive end of one molecule meeting the negative end of another (Latimer and Rodebush, Reference Latimer and Rodebush1920). Thanks to this interaction, neighbouring water molecules can assemble to create dimers, trimers, tetramers and other molecular conformations in a three-dimensional network of weak-intensity bonds that can break and reform quickly and continuously in a dynamic equilibrium, influenced by the chemical content and by physical conditions of the system (Chaplin, Reference Chaplin2019).
Solvation is the interaction of a solvent with dissolved molecules that influences their properties and stability. As a solvent, the water molecular system behaves in a very flexible manner. Its elasticity reflects the structural complexity of the solutes, forming a solvation shell characterised by the assembly of three different states of water molecules: (i) the strongly bound ones, when the interaction occurs with polar groups or with ionic residues on the molecular surfaces; (ii) the weakly bound ones, resulting from the formation of electrostatic bonds with weaker polar groups; (iii) the free water molecules, not directly involved in the solvation of the solute (Laage et al., Reference Laage, Elsaesser and Hynes2017). The hydrogen bonds have a fundamental role in the correct folding and stabilisation of the tertiary and quaternary structures of the macromolecules, determining their nature and, consequently, their biological function uniquely.
In the case of interaction with proteins, the structural nature of the three-dimensional network of water involved in their hydration results from many factors, including the chemical composition of the amino acid surface constituting any polypeptide (Haider et al., Reference Haider, Wickstrom, Ramsey, Gilson and Kurtzman2016). The stability of intermolecular interactions between water and proteins mainly involves acid, basic and hydrophilic side chain amino acids. By contrast, amino acids with hydrophobic side chains (alanine, proline, methionine, tyrosine and tryptophan) cause the destabilisation of the interaction between water and protein biomolecules, which creates favourable conditions for protein to consolidate their chemical bonding with other biomolecules or ligands (Schauperl et al., Reference Schauperl, Podewitz, Waldner and Liedl2016; Chaplin, Reference Chaplin2019; Rego et al., Reference Rego, Xi and Patel2019).
Concerning interactions with lipids, the features of their surface result from the abundance of hydrophobic groups alternated with few hydrophilic groups accepting hydrogen bonds. Such a heterogeneous chemical character strongly influences the orientation of the water molecules in the solvation shell. Consequently, the interaction of water with phospholipids or triglycerides shows a substantial spatial heterogeneity in the first layer of the solvation shell (Laage et al., Reference Laage, Elsaesser and Hynes2017). Specifically, water can form hydrogen bonds with the hydrophilic polar head of the phospholipid component (up to a maximum of 28 water molecules directly involved for the single biomolecule: Hishida and Tanaka, Reference Hishida and Tanaka2011), or it can establish an intermolecular bond with the oxygen ester in triacylglycerols (Groot et al., Reference Groot, Velikov and Huib2016).
The molecular properties of water affect the structure and dynamics of carbohydrates (Almond, Reference Almond2005). In lactose, hydroxyl oxygens and hydroxyl hydrogens attract water more than other atoms constituting the ring (Imberti et al., Reference Imberti, McLain, Rhys, Bruni and Ricci2019). Sugar hydration involves multiple layers of water molecules and, in particular, the hydration shell around α-glucose and β-glucose has fifteen water molecules distributed over three sites (Song et al., Reference Song, Chen, Suo and Guo2020).
Water is an essential component of bovine milk (87%). It is responsible for the formation of a molecular network of interactions with the remaining 13% of dry matter present in solution or suspension in the liquid, which is made up of fats (2.5–6%), proteins (2.9–5%), lactose (3.6–5.5%), minerals (0.6–0.9%) and traces of other substances (Bylund, Reference Bylund1995; Mansson, Reference Månsson2008). In milk, fat is present in suspended globules ranging in size from 10−2 to 10−3 mm. A thin membrane with a variable composition of phospholipids, lipoproteins, glycolipids, trace elements and bound water molecules of the solvation shell of the lipid droplet covers them. Casein and whey proteins represent the milk protein component. Casein consists of four different sub-forms, namely αs1, αs2, β and k-casein, arranged in colloidal suspension micelles ranging from 50 to 500 nm and made up of smaller sub-micelles, connected by calcium phosphate bridges. This conformational model results from an orderly arrangement of the α and β-caseins at the centre of the micelle. At the same time, the k-caseins are oriented with the hydrophilic C-terminal end on the most superficial portion to promote the establishment of hydrogen bonds with the water molecules of the solution (Bylund, Reference Bylund1995). Whey proteins represent the water-soluble protein fraction of milk. They include α-lactalbumin, β-lactoglobulin and, to a lesser extent, immunoglobulin, serum albumin and bioactive peptides. β-lactoglobulin has a homodimer conformation consisting of two globular structures linked by non-covalent bonds, whilst α-lactalbumin is a metalloprotein with a binding site for the Ca2+ ion located near the junction ring of the two subdomains composing the protein (Pizzichini et al., Reference Pizzichini, Spadoni, Russo, Tasselli, Aiello, Ballista, Caponio, Magarò, Monterossi, Pisani, Frangelia, Pizzichini, Martino and Amata2006).
Using near-infrared spectroscopy in dairy production
Vibrational spectroscopy in the near-infrared region (NIR) is a highly sensitive, low-cost, non-destructive analytical technique. It allows rapid and reliable generation of objective data, an advantage compared to the more traditional laboratory methods that necessitate an initial sample preparation with chemical reagents, an operation requiring experienced and qualified personnel (Loudiyi et al., Reference Loudiyi, Temiz, Sahar and Ahmad2020). The basis of the technique rests on the principle that every compound possesses a unique absorption spectrum that distinguishes it from others. Light interacts with matter, which absorbs part of the incident radiations at specific wavelengths. This energy transfer promotes the transition of molecules to higher energetic vibrational levels. When the incident light has the same fundamental frequency as a bond, electrons catch part of it, causing the bond atoms to vibrate faster. As the electrons move closer or farther from the atom's nucleus, energy in the form of light is emitted or absorbed. The magnitude of energy that matter emits or absorbs across a range of wavelengths is its spectral emission or absorption pattern. Consequently, studying the spectral pattern enables the acquisition of qualitative information regarding specific functional groups within a sample (Molteni, Reference Molteni2013). Each type of molecule absorbs in a specific wavelength range, and the same is true for the different water species in solution. Water molecules absorb radiation over the entire range of the electromagnetic spectrum, with intramolecular vibrational transitions occurring in the infrared region. Due to the interaction between electromagnetic radiation and aqueous matter, the absorption of discrete values of NIR energy results in molecular vibrations in the water molecule (Fig. 1) occurring between the hydrogen and oxygen atoms involved in the covalent bond. These oscillations of interatomic distances can manifest as symmetrical (v1), asymmetrical (v3), or bending (v2) stretching modes, with the latter requiring less energy to occur compared to the former two (De Haseth, Reference De Haseth2022).
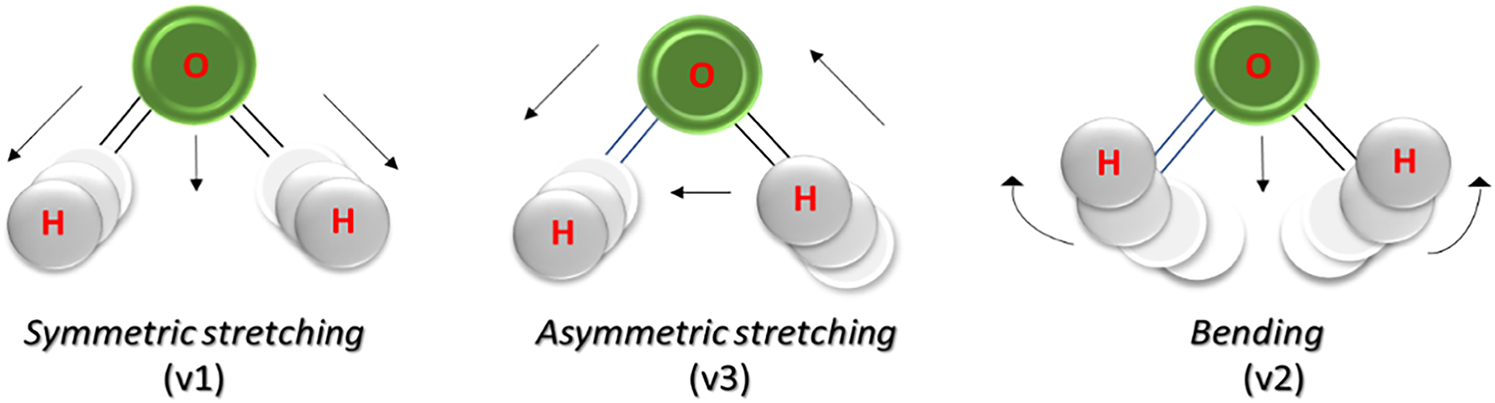
Figure 1. Vibrational modalities of the water molecule hit by near-infrared radiation (from Holtrop et al., Reference Holtrop, Huisman, Stomp, Biersteker, Aertz, Grebert, Partensky, Garczarek and Van der Woerd2021).
The electromagnetic spectrum of pure water in the near-infrared region, between 750 and 2500 nm, shows four main absorption peaks (Fig. 2). The first peak (970 nm) results from the second overtone (a harmonic with a frequency higher than the fundamental frequency) of the –OH bond's symmetrical and asymmetrical stretching bands (av1 + bv3; a + b = 3; 3ν1,3). The second peak (at 1190 nm) combines the first overtone of the symmetrical and asymmetrical stretching band of the –OH bond and the bending band of the –OH bond (2ν1,3 + ν2). At 1450 nm, the spectrum of water shows a large peak composed of many overlapping bands, attributable to the first overtone of the symmetrical and asymmetrical stretching band of the –OH bond (2ν1,3). Finally, the most intense peak appears at 1940 nm: it results from the combination of the stretching and bending bands of the –OH bond (2ν1,3 + ν2) (Luck, Reference Luck1973). Such dominant absorption bands of water pose a significant problem when NIR analysis focuses on aqueous solutions like milk. They hide the weaker ones belonging to analytes dissolved in solution at low concentrations, complicating their detection. For this reason, in former NIR studies, measurements considered absorption bands far from such wavelength regions or were performed on dried samples (Núnez-Sanchez et al., Reference Núñez-Sánchez, Martínez-Marín, Polvillo, Fernández-Cabanás, Carrizosa, Urrutia and Serradilla2016). However, such procedures restricted the potential of NIR measurement technology for the daily management of dairy farming (Muncan et al., Reference Muncan, Kovacs, Pollner, Ikuta, Ohtani, Terada and Tsenkova2021b). Nowadays, there is wide use of NIR spectroscopy in dairy. Specifically, it offers the possibility of real-time monitoring of milk's qualitative/quantitative characteristics throughout the entire production chain to obtain a product with quality, safety and sustainability standards matching the regulatory requirements and consumer needs (Evangelista et al., Reference Evangelista, Basiricò and Bernabucci2021). In more detail, NIR spectroscopy can be utilised as a monitoring tool throughout the production line to characterise milk's chemical and physical parameters (Laporte and Paquin, Reference Laporte and Paquin1999; Holroyd, Reference Holroyd2013), as a guarantee of food safety and for the identification of adulterations (Liu et al., Reference Liu, Lv, He and Xu2011; Cattaneo and Holroyd, Reference Cattaneo and Holroyd2013; Kamboj et al., Reference Kamboj, Kaushal, Mishra and Munjal2020; Deshpande et al., Reference Deshpande, Deshpande and Dhande2021) or, directly in the milking parlour, to obtain real-time and non-invasive information on the health or reproductive status of each cow (Kawasaki et al., Reference Kawasaki, Kawamura, Tsukaharaa, Moritab, Komiyab and Natsugac2008; Maltz et al., Reference Maltz, Antler, Halachmi and Schmilovitch2009; Diaz-Olivares et al., Reference Diaz-Olivares, Adriaens, Stevens, Saeys and Aernouts2020; Iweka et al., Reference Iweka, Kawamura, Mitani, Kawaguchi and Koseki2020a, Reference Iweka, Kawamura, Mitani and Koseki2020b). Rapidly detecting changes in milk composition allows the early identification of diseases in the animal, with timely health treatment and subsequent improvement of animal welfare and a reduction of productive and economic losses for the farmer (eg the early detection of the increase of the somatic cell counts that is the primary marker of mastitis disease: Tsenkova et al., Reference Tsenkova, Atanassova and Toyoda2001a, Reference Tsenkova, Atanassova, Ozaki, Toyoda and Itoh2001b, Reference Tsenkova, Atanassova, Kawano and Toyoda2001c).
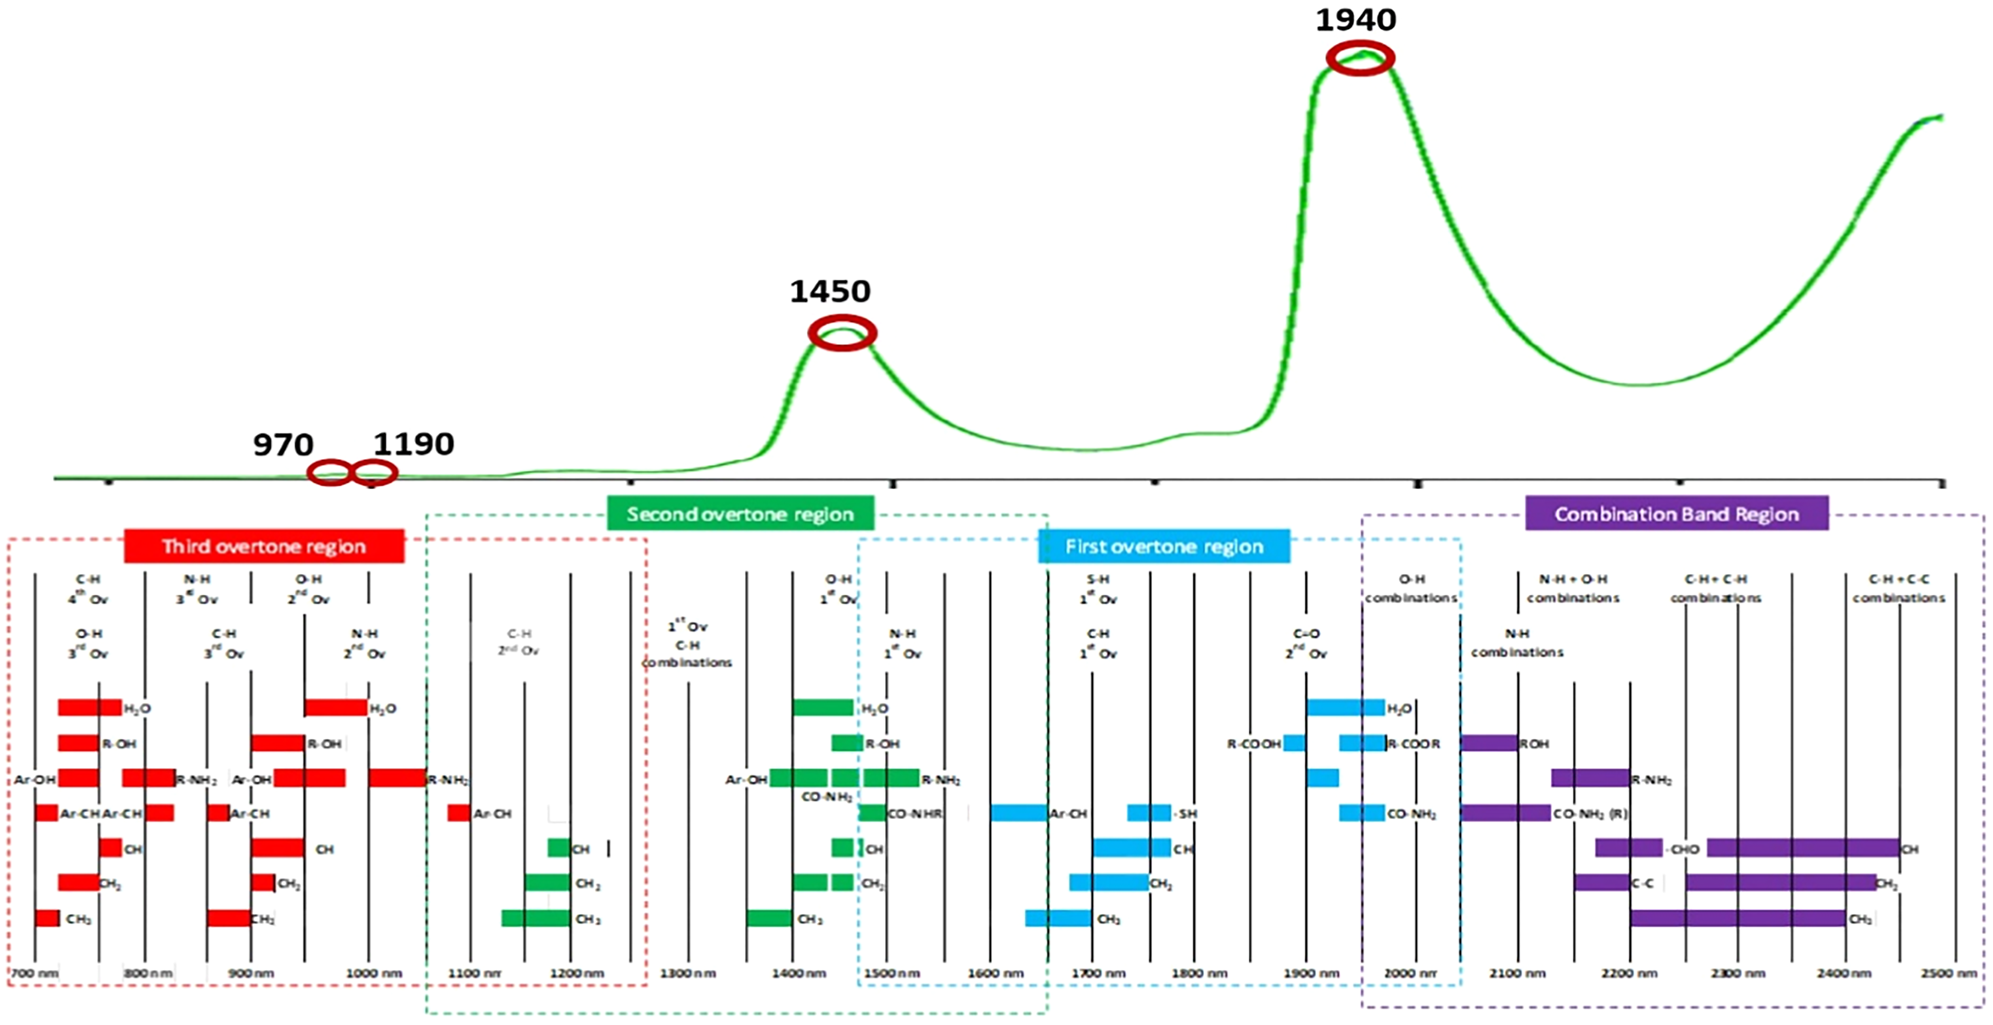
Figure 2. Schematic representation of the position of the overtones and the absorption bands in the near-infrared region (from Eldin, Reference Eldin and Akyar2011), with a focus on the electromagnetic spectrum of pure water (Muncan and Tsenkova, Reference Muncan and Tsenkova2019). The main absorption peaks at 970, 1190, 1450, and 1940 nm have been highlighted.
Aquaphotomics: water–light interaction for characterisation of a system
As the name suggests, aquaphotomics is an ‘omics’ science, a molecular discipline aimed at representing and systematically interpreting matter complexity. It exploits the interaction between water and light radiation. However, unlike the other ‘omics’, aquaphotomics proposes an integrative approach instead of emphasising the single constituent element: it considers water a multidimensional biomarker capable of reflecting the overall effect of all the system's components. The system can be studied rapidly, non-invasively and non-destructively, with the possibility of real-time monitoring of the rearrangement of the chemical and structural composition of water resulting from any perturbation affecting it. The dynamism of such bonds makes it possible to explore any system using water as a possible descriptor. This approach can, therefore, be exploited to obtain indirect qualitative-quantitative information about the solutes present in the solution, in contrast with the conventional techniques, which focus on the direct measurement of the single analytes (Muncan and Tsenkova, Reference Muncan and Tsenkova2019).
When near-infrared radiation hits water molecules, the energy released is converted into vibrational energy through oscillations of interatomic distances and bonding angles. Any variation in the concentration of analytes results in a change in the vibration mode of the water molecules that can be monitored along the spectrum (Muncan et al., Reference Munćan, Mileusnić, Šakota Rosić, Vasić-Milovanović and Matija2016). The spectral pattern of water changes reflects accurately and sensitively the transformations at the molecular level that characterise the different species of water constituting the three-dimensional network of hydrogen bonds. Instead of tracing the individual solutes, it is possible to observe the cumulative effect on the spectral model of absorption of NIR radiation, which becomes a distinctive and identifying marker for each sample (Kovacs et al., Reference Kovacs, Muncan, Veleva, Oshima, Shigeoka and Tsenkova2022). Therefore, the aqueous matrix cannot be seen as an inert solvent as it constitutes the scaffolding of the entire system, with an interdependent connection with the rest of the constituent components of the system. For this reason, the objective of this new ‘omics’ science is to describe (in the future) the state of any system exclusively in terms of the structure of the water molecular system (Van De Kraats et al., Reference Van de Kraats, Munćan and Tsenkova2019).
Water absorbance bands in the near-infrared region of the electromagnetic spectrum
Most aquaphotomics studies on system characterisation have focused on the electromagnetic spectrum wavelength range between 1300 and 1600 nm, corresponding to the first overtone of water OH stretching vibrations (Tsenkova et al., Reference Tsenkova, Muncan, Pollner and Kovacs2018). In this region of the NIR spectrum, from the experimental point of view, the adopted methodological approach involves executing a multivariate analysis of the spectral variations acquired in an aqueous system to find and identify the water absorption bands activated following a specific equilibrium perturbation.
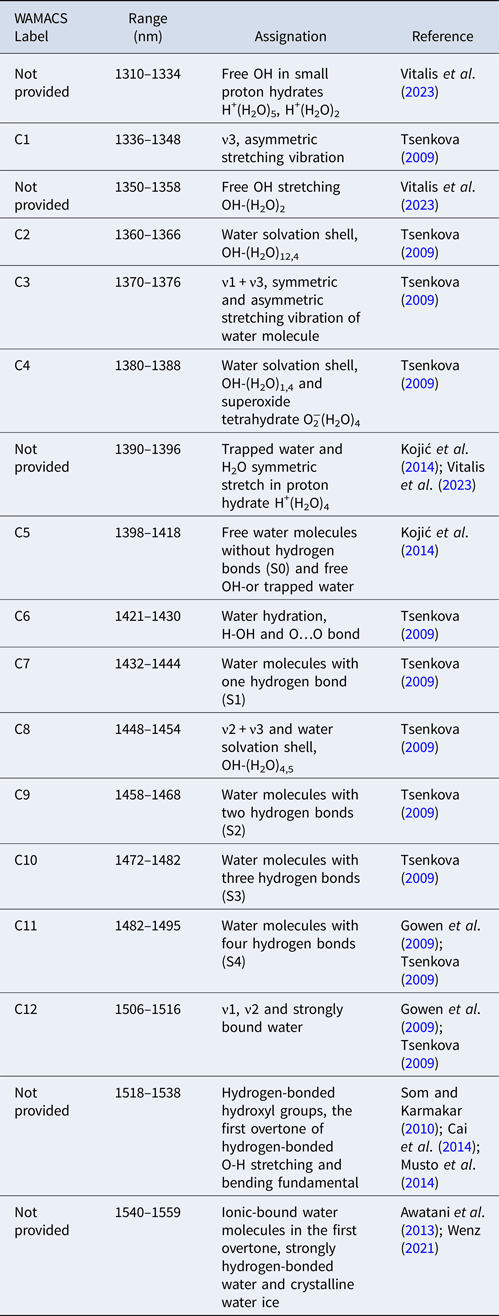
An activated water absorbance band (WAB) is a spectral band in which the variation in light absorption is higher in response to a given perturbation. Combining multiple WABs produces a characteristic spectral pattern of water absorbances (WASP), reflecting the conditions of the entire aqueous molecular system (Tsenkova et al., Reference Tsenkova, Kovacs and Kubota2015). In the spectroscopic models experimentally analysed, aquaphotomics research verified the existence of typical water absorption bands repeatedly activated with different intensity combinations depending on the type of perturbation and the system studied: the WAMACS (water matrix coordinates). These absorption coordinates are wavelength intervals in which the activated water bands are most likely to be found (Tsenkova, Reference Tsenkova2009). Each WAMACS corresponds to a specific molecular conformation of water, which can help to describe each frequency absorbed in terms of water structure (Weber et al., Reference Weber, Kelley, Nielsen, Ayotte and Johnson2000; Robertson et al., Reference Robertson, Diken, Price, Shin and Johnson2003). All of these molecular conformations have distinctive spectral properties that aid in comprehending phenomena across various fields of application. In the first overtone region of the water spectrum, 12 WAMACS have been identified, providing insights into the structural organisation of water (Tsenkova et al., Reference Tsenkova, Muncan, Pollner and Kovacs2018), although recent studies point out the existence of several more (Muncan et al., Reference Muncan, Tamura, Nakamura, Takigawa, Tsunokake and Tsenkova2022a, Reference Muncan, Anantawittayanon, Furuta, Kaneko and Tsenkova2022b; Vitalis et al., Reference Vitalis, Muncan, Anantawittayanon, Kovacs and Tsenkova2023). These WAMACS are summarised in Table 1.
Table 1. Coordinates of the molecular matrix of water with their spectroscopic and structural characterisation
Multivariate spectral analysis and chemometric models are the primary tools for uncovering hidden information within the raw spectral data. The chemometric analysis combines mathematical and statistical tools to help identify the variables with a high contribution within the spectral pattern of water (ie those absorption bands that are constantly repeated during aquaphotomics analysis and can be considered active). Aquagrams are the graphical representation of this water spectral pattern. They are radar graphs reporting the normalised absorbance within the WAMACS, providing a quick and complete comparison of different systems or conditions of the same system regarding changes in the aqueous matrix (Muncan et al., Reference Munćan, Matija, Simić-Krstić, Nijemčević and Djuro2014). The right part of the graph represents free water molecules, weakly bound to hydrogen or even water, involved in the hydration of solutes. In contrast, the area on the left of the graph corresponds to the water species most strongly bound to hydrogen and able to establish a more significant number of electrostatic intermolecular interactions with neighbouring molecules (Tsenkova et al., Reference Tsenkova, Kovacs and Kubota2015; Muncan et al., Reference Muncan, Matovic, Nikolic, Askovic and Tsenkova2020).
Aquaphotomics aims to construct a database containing all the water absorption bands that are linked to the respective molecular conformations. This database, called the Aquaphotome, represents an alphabet of interactions between water and light that can be used to describe the functionality of a system and provide a more thorough understanding of the phenomena (Tsenkova, Reference Tsenkova2008a). Aquaphotomics improves NIR spectroscopy by addressing the limitations of dominant water absorption bands. It uses the spectral characteristics of water as a biomarker to reflect the state, behaviour and functionality of the entire analysed matrix (Robertson et al., Reference Robertson, Diken, Price, Shin and Johnson2003; Van De Kraats et al., Reference Van de Kraats, Munćan and Tsenkova2019). Essentially, aquaphotomics harnesses the spectral features of water as a comprehensive biomarker, capable of offering valuable insights into the properties of the investigated system (Tsenkova, Reference Tsenkova2005). The remainder of this review describes the potential of this technique, the achieved results, and their possible applications in animal health and dairy production.
Review procedure
The literature search of the most relevant articles for this scientific review was conducted until June 2023 using the Scopus database (Elsevier) and Google Scholar. The keyword used to search for relevant documents was ‘aquaphotomics’, which the document's title, abstract, or keywords had to include. No restrictions were placed on the type of documents, topic or year of publication to identify relevant articles. This approach revealed a continuously increasing number of publications from 2006 to the present (Muncan and Tsenkova, Reference Muncan and Tsenkova2023). In the Scopus database from 2009 to 2018, relatively few articles were published on aquaphotomics, suggesting limited research in this field. However, since 2019, the number of published articles has increased significantly, and in the first four months of 2023 alone, 6 new articles on this topic were indexed in Scopus, indicating a growing interest among researchers (Supplementary Fig. S1). Online Supplementary Table S2 reports a topic-organised bibliography, these topics being elaborated in the following sections of the review and evaluating, for each, a potential application in the dairy sector as described by Fig. 3. After a brief overview of the technology and the main results that emerged from its application to experimental research activity, the remainder of the review focuses on the possibility of exploiting aquaphotomics as a non-invasive and real-time monitoring tool to point out the changes in the composition of milk in ruminants associated with the development of a subclinical form of some diseases (eg metabolic diseases). Aquaphotomics represents an opportunity for ethical and sustainable animal production that falls within the objectives of precision animal farming with high production standards.
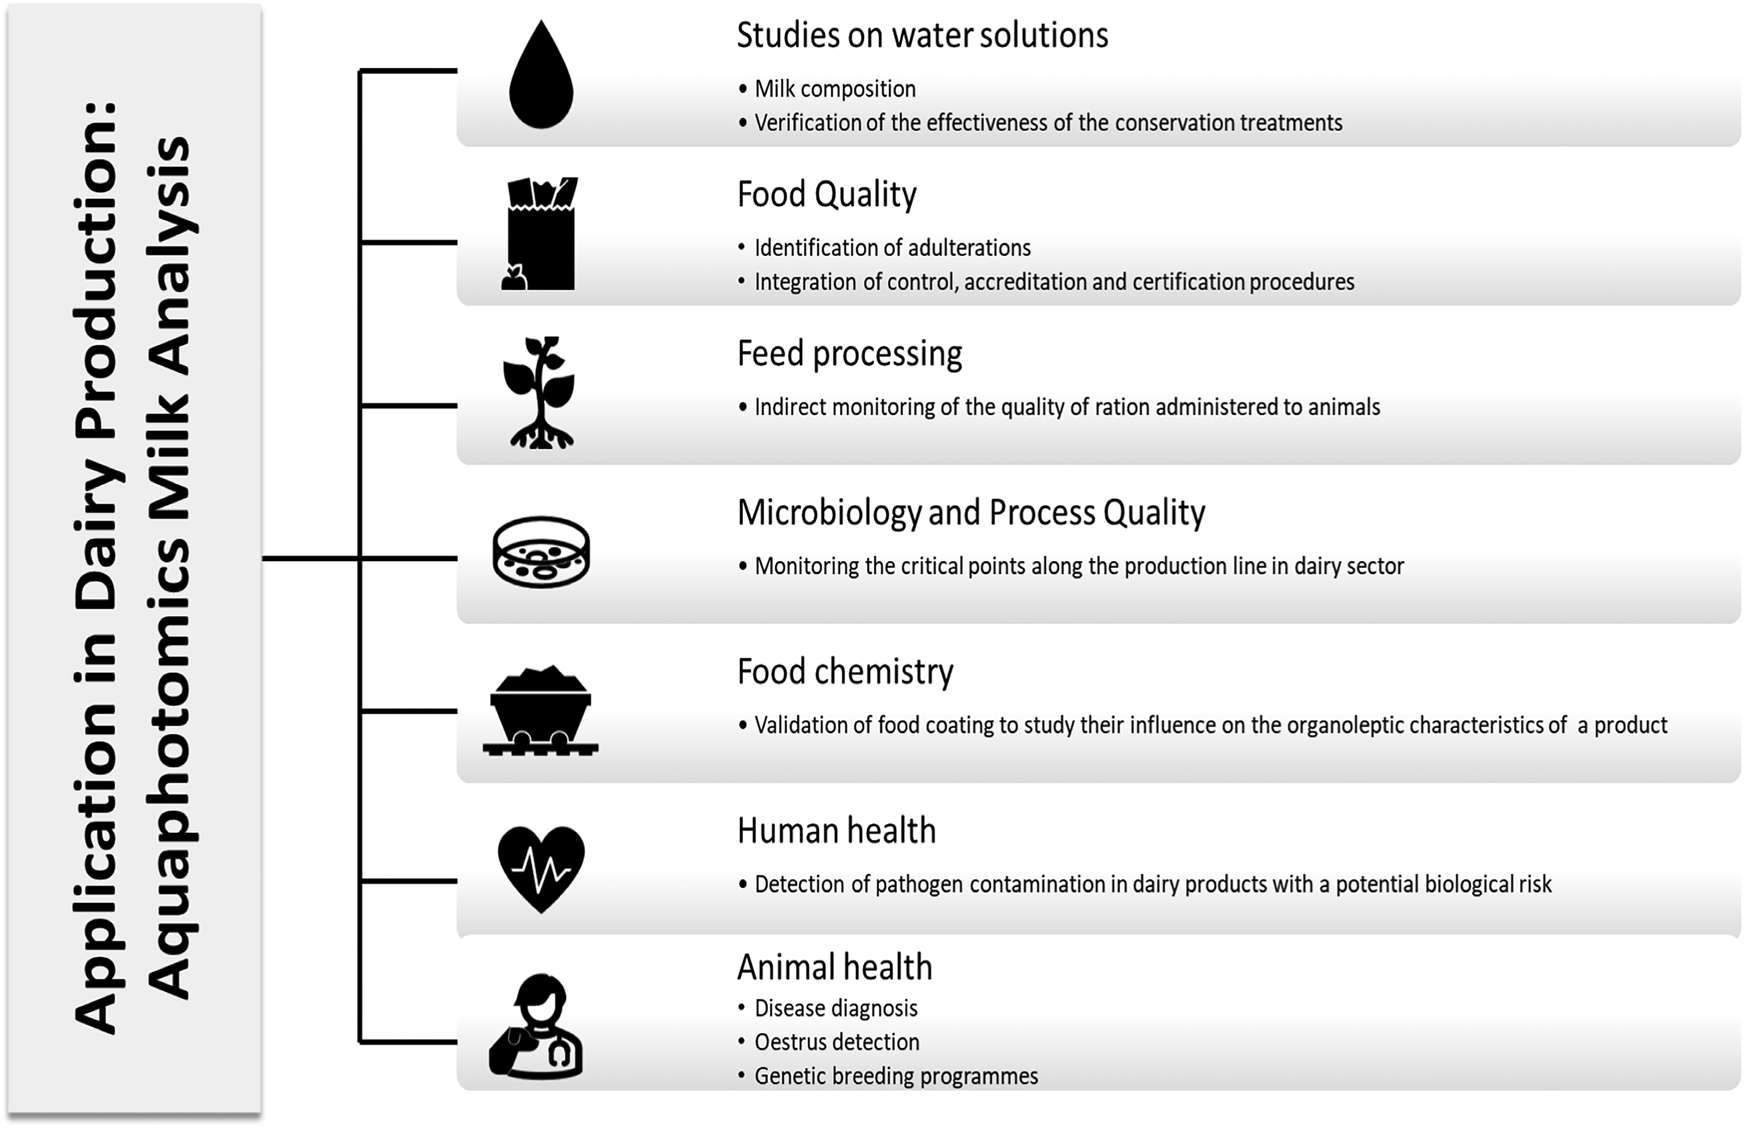
Figure 3. Structural organisation of the review according to paragraph 3.1.
Application field and results obtained
Aquaphotomics has impacted a wide range of sectors, from fundamental molecular research to practical utilisation in the agri-food, medical, microbiological and industrial sectors. This continuous evolution promises to open new horizons of scientific knowledge (Kovacs et al., Reference Kovacs, Muncan, Veleva, Oshima, Shigeoka and Tsenkova2022). Water reflects any occurring molecular change and provides valuable information about the dynamics of the interactions occurring under the effect of any system perturbation through the three-dimensional network of water involved in the hydration of the molecules in the solution (Han et al., Reference Han, Sun, Wang, Su, Cai and Shao2022). Aquaphotomics has revolutionised water's role, transforming it from a passive component to a fundamental pillar of any system that reflects molecular changes. Water's ability to form hydrogen bonds and influence the structure of macromolecules is essential to any solution (Tsenkova, Reference Tsenkova2009, Reference Tsenkova2010; Tsenkova et al., Reference Tsenkova, Kovacs and Kubota2015; Cattaneo et al., Reference Cattaneo, Bazar, Gowen, Greppi, Mura and Tsenkova2015a; Van De Kraats et al., Reference Van de Kraats, Munćan and Tsenkova2019) opening new perspectives for dairy research.
Applications in veterinary medicine
The studies conducted using aquaphotomics as an examination method have revealed that water can act as a biomarker for the diagnosis of mastitis in dairy cattle. Mastitis significantly alters the ionic concentration and chemical composition of many biomolecules. This bio-perturbation affects the molecular structure of the water in milk samples, resulting in differences in the spectral patterns of absorption between healthy individuals and individuals with mammary gland inflammation (Tsenkova, Reference Tsenkova2007a, Reference Tsenkova2008a; Tsenkova and Muncan, Reference Tsenkova and Muncan2021). The technology allows for the continuous and in vivo observation of an animal's health status, and serves as an early warning system for abnormal physiological states, identifying deviations from individual markers in the animal's biological fluid spectra and prompting timely treatment (Muncan et al., Reference Muncan, Miyazaki, Kuroki, Ikuta and Tsenkova2023). Santos-Rivera et al. (Reference Santos-Rivera, Woolums, Thoresen, Blair, Jefferson, Meyer and Vance2021), Santos-Rivera et al. (Reference Santos-Rivera, Woolums, Thoresen, Meyer and Vance2022a), and Santos-Rivera et al. (Reference Santos-Rivera, Woolums, Thoresen, Meyer and Vance2022b) have used aquaphotomics to rapidly identify the biochemical changes occurring in the early stages of bovine respiratory diseases from different aetiological agents to ensure timely intervention before the symptoms worsen. These studies considered exhaled breath, nasal secretions and blood (online Supplementary Fig. S2). Santos-Rivera (Reference Santos-Rivera2022) pointed out the existence of a biological spectral signature associated with a specific pathogen profile.
Aquaphotomics technology is a highly versatile tool effectively utilised in animal reproduction research. Counsell et al. (Reference Counsell, Durfey, Feugang, Willard, Ryan and Vance2017) demonstrated the efficacy of this technology by using it to assess the health of swine offspring from in vitro fertilisation of young sows with nanopurified semen. Furthermore, aquaphotomics offers a quick and cost-effective alternative to traditional methods of analysing animal hormone levels during the oestrus cycle, which typically require chemical reagents and the expertise of trained personnel (Kinoshita et al., Reference Kinoshita, Miyazaki, Morita, Vassileva, Tang, Li, Ishikawa, Kusunoki and Tsenkova2012, Reference Kinoshita, Kuze, Kobayashi, Miyakawa, Narita, Inoue-Murayama, Idani and Tsenkova2015; Takemura et al., Reference Takemura, Bázár, Ikuta, Yamaguchi, Ishikawa, Furukawa, Kubota, Kovács and Tsenkova2015; Agcanas et al., Reference Agcanas, Counsell, Shappell, Bowers, Ryan, Willard and Vance2017; Vance et al., Reference Vance, Counsell, Agcanas, Shappell, Bowers, Willard and Ryan2017). Aquaphotomics technology has other potential benefits in animal breeding practices. Firstly, it can detect both organic and functional changes related to developing pathological conditions or resuming the oestrous cycle. Secondly, it can be applied to genetic breeding programs aimed at reducing the environmental impact of cattle farming. Studies have explored the possibility of phenotyping milk composition traits for more profitable and sustainable animal production with less impact on animal health and the environment by combining infrared spectroscopy with genomic and molecular data sources (Bresolin and Dórea, Reference Bresolin and Dórea2020; Tiplady et al., Reference Tiplady, Lopdell, Littlejohn and Garrick2020). In a similar vein, Bittante and Cipolat-Gotet (Reference Bittante and Cipolat-Gotet2018) and Vanlierde et al. (Reference Vanlierde, Soyeurt, Gengler, Colinet, Froidmont, Kreuzer, Grandl, Bell, Lund, Olijhoek, Eugène, Martin, Kuhla and Dehareng2018) used mid- and near-infrared milk spectral data to predict the daily methane production in cows, pointing out the potential of breeding based on such an approach.
Applications in plant biology and agronomy
Ensuring the nutritional quality of the ration distributed to animals is crucial to promote their health. One way to achieve this is by monitoring the quality of plants used for feed production, especially when they are components of a total mixed ration. As feed quality directly impacts the quality of the milk produced, it is essential to monitor it promptly to support precision farming management of the herd. Properly managing dairy cow rationing influences the animal's individual production regarding product quality and quantity (Caccamo et al., Reference Caccamo, Veerkamp, Licitra, Petriglieri, La Terra, Pozzebon and Ferguson2012). Knowing the compositional characteristics of milk enables helpful information on the quality of the ration administered to the animal which nowadays undergoes increased levels of automation (Bahri et al., Reference Bahri, Nawar, Selmi, Amraoui, Rouissi and Mouazen2019; Romano et al., Reference Romano, Brambilla, Cutini, Giovinazzo, Lazzari, Calcante, Tangorra, Rossi, Motta, Bisaglia and Bragaglio2023). Aquaphotomics can assist farmers in real-time optimisation of the chemical and physical composition of the total mixed ration administered, thus improving the farm's productivity. Aquaphotomics also has great potential in regard to crop production. It can detect the early onset of plant diseases, even while they are still in the latent stage (Jinendra et al., Reference Jinendra, Tamaki, Kuroki, Vassileva, Yoshida and Tsenkova2010; Zahir et al., Reference Zahir, Omar, Jamlos, Azmi and Muncan2022). Additionally, it can assess the effectiveness of genetic improvement actions by detecting specific active substances in plant tissues (Cattaneo et al., Reference Cattaneo, Cortellino and Barzaghi2015b).
Human medicine
Significant advances have been made in the diagnostic sector of human medicine, similar to those conducted in animal medicine. NIR spectroscopy, coupled with aquaphotomics analysis, can be complementary for rapid, in vivo and continuous monitoring of critical physiological parameters to reduce disease incidence or mortality rate (online Supplementary Fig. S3: Chatani et al., Reference Chatani, Tsuchisaka, Masuda and Tsenkova2014; Cui et al., Reference Cui, Yu, Cai and Shao2019b; Li et al., Reference Li, Guo, Li, Yang, Guang, Huang, Chen, Wang and Hu2020). This method can also help in identifying zoonotic agents that husbandry staff in direct contact with animals may be exposed to, including tuberculosis, brucellosis, listeriosis and leptospirosis. According to Veleva-Doneva et al. (Reference Veleva-Doneva, Georgieva, Atanassova and Tsenkova2010), when combined with multivariate classification methods, NIR spectroscopy is an excellent tool for quickly detecting bacterial contamination in bovine milk. Proactively detecting these pathogens in milk is a preventive and protective measure, mitigating the potential biological risks associated with farming and animal management activities. The resulting early diagnosis enables more targeted use of antibiotics on farms, resulting in the containment of antibiotic resistance in animal production and humans.
Studies on water solutions in dairy
Aquaphotomics is used in the dairy industry to evaluate the compositional, nutritional and economic value of milk and its by-products. This method involves monitoring milk as an aqueous solution, which helps analyse milk's components (fats, proteins, lactose). These components can affect water's behaviour, which has been demonstrated through studies conducted on solutions analysed with various analytes at different concentrations (Tsenkova, Reference Tsenkova2007b; Kovacs et al., Reference Kovacs, Bázár, Oshima, Shigeoka, Tanaka, Furukawa, Nagai, Osawa, Itakura and Tsenkova2015; Cui et al., Reference Cui, Cai and Shao2016; Dong et al., Reference Dong, Yu, Li, Nie, Zhang and Zang2019a, Reference Dong, Yu, Li, Nie, Li and Zang2019b; Zhang et al., Reference Zhang, Liang, Li, Tian, Wei, Zhao, Wang, Dong and Zang2023a, Reference Zhang, Tan, Wang, Zhao, Wei, Sun, Gao, Zhong, Dong and Zang2023b). Analysing the spectral pattern of water in the visible (Bozhynov et al., Reference Bozhynov, Soucek, Barta, Urbanova, Bekkozhayeva, Rojas, Valenzuela and Rojas2019, Reference Bozhynov, Mashchenko, Urbanova and Kovacs2020, Reference Bozhynov, Kovacs, Cisar and Urban2021) or near-infrared region can help track the origin of a perturbation and provide valuable information about any element present in a solution, such as salvianolic acid, methanol, heavy metals, sugars and proteins (Tsenkova, Reference Tsenkova2008b; Vero et al., Reference Vero, Tornielli and Cattaneo2010; Meilina et al., Reference Meilina, Putra and Tsenkova2011; Bazar et al., Reference Bázár, Kovács, Tanaka and Tsenkova2014, Reference Bázár, Kovacs, Tanaka, Furukawa, Nagai, Osawa, Itakura, Sugiyama and Tsenkova2015; Putra et al., Reference Putra, Faridah, Inokuma and Santo2016, Reference Putra, Vassileva, Santo and Tsenkova2017; Cui et al., Reference Cui, Liu, Yu, Cai and Shao2017; Li et al., Reference Li, Li, Quan, Dong, Liu, Sun and Zang2019; Muncan and Tsenkova, Reference Muncan and Tsenkova2019; Dong et al., Reference Dong, Chen, Pan and Qu2022). Combining multivariate spectral analysis with chemometric models also enables the understanding of the dynamics of the system (Kojić et al., Reference Kojić, Tsenkova and Yasui2017; Tsenkova et al., Reference Tsenkova, Muncan, Pollner and Kovacs2018; Cui, Reference Cui2022; Roger et al., Reference Roger, Mallet and Marini2022; Ye et al., Reference Ye, Zhong, Fang, Gao, Du, Chen, Yuan and Pan2022; Ma et al., Reference Ma, Li, Zang, Lin, Zhao, Wei, Dong and Zhang2023).
Fat is the most variable component of milk as numerous factors (season, feeding, breed, stage of lactation and individual animal traits) affect its composition, which results in variations in cheese and butter consistencies and, therefore, in the price of the commodity (Coppa et al., Reference Coppa, Verdier-Metz, Ferlay, Pradel, Didienne, Farruggia, Montel and Martin2011; Borreani et al., Reference Borreani, Coppa, Revello-Chion, Comino, Giaccone, Ferlay and Tabacco2013). Similarly, milk proteins, particularly casein, play a crucial role in determining its suitability for cheesemaking (Sturaro et al., Reference Sturaro, De Marchi, Zorzi and Cassandro2015). The real-time analysis of lactose is also crucial for the dairy industry, as it helps ensure that specific dairy products are suitable for lactose-intolerant people. Online Supplementary Fig. S4 provides a practical example of aquagrams resulting from different concentrations of lactose solutions in water.
Besides serving as a potential monitoring tool for milk composition, aquaphotomics has significant potential in assessing milk quality and its derivatives following heating or other raw material treatments, which may impact the organoleptic and sensory characteristics of the products. This approach can detect any potential quality impairment resulting from oxidative phenomena, making it a valuable tool for verifying the effectiveness of conservation treatments, as monitoring the changes occurring at the water absorbance bands increases understanding of the system's dynamics (Kaur et al., Reference Kaur, Künnemeyer and McGlone2017; Cui et al., Reference Cui, Zhang, Cai and Shao2018, Reference Cui, Sun, Cai, Shao and Wan2019a; Stoilov et al., Reference Stoilov, Muncan, Tsuchimoto, Teruyaki, Shigeoka and Tsenkova2022).
Microbiology and process quality
Aquaphotomics helps optimise dairy processing by identifying critical points that need modulation (Nath et al., Reference Nath, Csighy, Eren, Nugraha, Pásztorné-Huszár, Tóth, Takács, Szerdahelyi, Kiskó, Kovács, Koris and Vatai2021). Specifically, each phase of industrial manufacturing processes significantly impacts the quality of the finished product. Therefore, production efficiency monitoring methods are necessary along the cheese production line or during the fermentation processes of the lactic acid contained in milk to obtain yoghurt and other derivatives (Muncan et al., Reference Muncan, Tei and Tsenkova2021a) with subsequent prompt implementation of targeted corrective actions to address any critical issues arising. In microbiology, the NIR absorbance pattern of water offers a distinctive spectral fingerprint of cultured cells, primarily due to the synthesis of various extracellular metabolites (Nakakimura et al., Reference Nakakimura, Vassileva, Stoyanchev, Nakai, Osawa, Kawano and Tsenkova2012). Aquaphotomics also classifies bacterial strains with precision (Remagni et al., Reference Remagni, Morita, Koshiba, Cattaneo and Tsenkova2013) and allows for selective strain choice based on stability, resistance, or probiotic properties (Slavchev et al., Reference Slavchev, Kovacs, Koshiba, Nagai, Bázár, Krastanov, Kubota and Tsenkova2015, Reference Slavchev, Kovacs, Koshiba, Bazar, Pollner, Krastanov and Tsenkova2017; Kovacs et al., Reference Kovacs, Slavchev, Bazar, Pollner and Tsenkova2019).
Food quality
Aquaphotomics integrates conventional technologies for food quality and hygiene control (Veleva-Doneva, Reference Veleva-Doneva2017; Veleva-Doneva et al., Reference Veleva-Doneva, Atanassova and Zhelyazkov2017). It predicts chemical composition (Williams, Reference Williams2009) and quantifies fundamental components, like dietary fatty acids in milk (Muncan et al., Reference Muncan, Kovacs, Pollner, Ikuta, Ohtani, Terada and Tsenkova2021b), for nutritional purposes. NIR spectroscopy has many uses, including: (i) studying the organoleptic properties of food by detecting the changes in the structure of the water molecular system that affect the sensory characteristics (Vanoli et al., Reference Vanoli, Lovati, Grassi, Buccheri, Zanella, Cattaneo and Rizzolo2018; Rajkumar et al., Reference Rajkumar, Künnemeyer, Kaur, Longdell and McGlone2022); (ii) detecting biological alterations resulting from mechanical damage to a product (Gowen et al., Reference Gowen, Tsenkova, Esquerre, Downey and O'Donnell2009; Esquerre et al., Reference Esquerre, Gowen, O'Donnell and Downey2009); (iii) determining the food safety (Su et al., Reference Su, Yang, Tan, Li, Tu, Zhu, Wang, Wang, Hu, Mo, Zhao and Huang2022) and (iv) performing automated and real-time monitoring of industrial transformation processes (Muncan et al., Reference Munćan, Matija, Simić-Krstić, Nijemčević and Djuro2014; Kato et al., Reference Kato, Munćan, Tsenkova, Kojić, Yasui, Fan and Han2021; Muncan et al., Reference Muncan, Tei and Tsenkova2021a).
The various treatments adopted to preserve the safety or shelf life of food can affect the water absorbance spectral pattern (Barzaghi et al., Reference Barzaghi, Cremonesi, Passolungo and Cattaneo2014; Atanassova, Reference Atanassova2015; Sannia et al., Reference Sannia, Serva, Balzan, Segato, Novelli and Fasolato2019; Brambilla et al., Reference Brambilla, Buccheri, Grassi, Stellari, Pazzaglia, Romano and Cattaneo2020; Cattaneo et al., Reference Cattaneo, Cutini, Cammerata, Stellari, Marinoni, Bisaglia and Brambilla2021, Reference Cattaneo, Marinoni, Cammerata, Stellari, Brambilla and Romano2022; Nagy et al., Reference Nagy, Felfoldi, Bruckner, Mohacsi-Farkas, Bodor, Kertesz, Nemeth and Zsom-Muha2021; Bodor et al., Reference Bodor, Benedek, Aouadi, Zsom-Muha and Kovacs2022; Malegori et al., Reference Malegori, Muncan, Mustorgi, Tsenkova and Oliveri2022; Kaur et al., Reference Kaur, Wang, Künnemeyer and McGlone2022; Marinoni et al., Reference Marinoni, Buccheri, Bianchi and Cattaneo2022a, Reference Marinoni, Bianchi and Cattaneo2022b; Muncan et al., Reference Muncan, Anantawittayanon, Furuta, Kaneko and Tsenkova2022b; Vitalis et al., Reference Vitalis, Muncan, Anantawittayanon, Kovacs and Tsenkova2023). Additionally, there have been specific applications of aquaphotomics that focus on the quick and non-destructive assessment of food adulteration (Bazar et al., Reference Bázár, Romvári, Szabó, Somogyi, Éles and Tsenkova2016; Vitalis et al., Reference Vitalis, Bodor, Zaukuu, Bazar and Kovacs2019; Zaukuu et al., Reference Zaukuu, Soós, Bodor, Felföldi, Magyar and Kovacs2019; Kamboj et al., Reference Kamboj, Kaushal, Mishra and Munjal2020; Yang et al., Reference Yang, Guang, Xu, Zhu, Chen and Huang2020; Aouadi et al., Reference Aouadi, Vitalis, Bodor, Zaukuu, Kertesz and Kovacs2022; Raypah et al., Reference Raypah, Omar, Muncan, Zulkurnain and Abdul Najib2022; Atanassova et al., Reference Atanassova, Yorgov, Veleva, Stoyanchev and Zlatev2023). Aquaphotomics can be an effective strategy for detecting food adulteration as it targets the milk molecular changes resulting from adding foreign substances to dairy products, protecting consumers against the sometimes highly harmful consequences of illegal practices (Liu et al., Reference Liu, Todd, Zhang, Shi and Liu2012; Obladen, Reference Obladen2014). Milk adulteration is a serious food safety risk due to the high variability of adulterating substances and dilution with water (Nagraik et al., Reference Nagraik, Sharma, Kumar, Chawla and Kumar2021; Mafra et al., Reference Mafra, Honrado and Amaral2022).
Materials and nanomaterials
The materials and nanomaterials sectors are equally essential for the dairy industry. The performance of packaging and food stability properties during shelf-life depends on the choice of food coating material (Cattaneo et al., Reference Cattaneo, Vanoli, Grassi, Rizzolo and Barzaghi2016; Barzaghi et al., Reference Barzaghi, Cremonesi and Cattaneo2017; Vanoli et al., Reference Vanoli, Grassi, Lovati, Barzaghi, Cattaneo and Rizzolo2019). The spectral pattern of water absorption (Supplementary Fig. S5) can help evaluate the effect of food coating material on these properties. For example, milk packaging allows the product to be isolated from the external environment, creating a barrier against microorganisms and against air, humidity, and light to extend the product's shelf life. However, there may be issues with the migration of contaminants in the coating material towards the food, which can pose risks to human health (Wu et al., Reference Wu, Hu, Wang, Cheng, Wang and Zhu2010). Aquaphotomics can be applied in the dairy sector to design and validate food coating materials and study their impact on the organoleptic characteristics of milk.
General discussion
Rapid population growth linked to qualitative and quantitative changes in food demand is putting a severe strain on the entire primary sector, now facing the considerable challenge of producing more using fewer resources (CEMA, 2018). In this context, the dairy sector has undergone a profound intensification of the production model in recent years, with a worldwide production of cow's milk reaching more than 740 million tons in 2021, with a constant but progressive increase over time, as can be observed in the online Supplementary Table S1 (CLAL, 2023). Intensification of milk production has been made possible thanks to the enormous scientific advances obtained in the field of genetics, as well as to the progressive digitalisation of the cattle sector through the adoption of cutting-edge technological solutions in the field of nutrition, milking, or reproductive management of animals, with an almost complete transition from grazing systems to housing. This constant search for increasingly efficient production conditions has led to selecting high-yielding livestock with higher individual production, allowing farms to increase their economic stability and competitiveness in the market (Medeiros et al., Reference Medeiros, Fernandez-Novo, Astiz and Simões2022). However, intensive farming has also led to negative consequences, with problems related to the production model's economic, social, and environmental sustainability and an increased occurrence of metabolic disorders (Zachut et al., Reference Zachut, Šperanda, de Almeida, Gabai, Mobasheri and Hernández-Castellano2020). These pathological conditions (ketosis, ruminal acidosis, hypocalcaemia, hepatic steatosis, abomasal displacement) result from difficulty in maintaining homeostasis as a consequence of imposing metabolic demands on the animal, especially during the transition period and the negative energy balance that occurs post partum. If left untreated, these disorders may lead to other clinical diseases in dairy cattle (Fantini, Reference Fantini2016). Unsustainable management also has a significant impact on the perception of the consumer, who is increasingly attentive to the ethics of animal production (Raboisson et al., Reference Raboisson, Barbier and Maigné2016). For this reason, managing livestock health is a critical issue for both the farmer and the consumer.
The early diagnosis of disease improves the sustainability of dairy production (Lovarelli et al., Reference Lovarelli, Bacenetti and Guarino2020). The opportunity to achieve this strategic objective results from using technologies related to precision livestock farming, particularly by implementing modern bio-sensing approaches in the bovine production chain. These innovative sensor technologies in veterinary diagnostics collect, combine, process, and interpret farmed animals' physiological and health parameters to generate helpful information for the breeder, thus ensuring sustainable and ethically acceptable livestock management (Rutten et al., Reference Rutten, Velthuis, Steeneveld and Hogeveen2013; Berckmans, Reference Berckmans2017). Therefore, the main objective of these technologies is the automatic and continuous monitoring of individual animals, generating reliable data that can prevent the onset of metabolic disorders in the farm and optimising the production process (Caja et al., Reference Caja, Castro-Costra and Knight2016). Neethirajan et al. (Reference Neethirajan, Tuteja, Huang and Kelton2017) provide an overview of emerging technological advances in monitoring the health status of farm animals, categorising the sensors currently available according to the type of biomarker analysed. An example is given by the sensors installed in line for real-time analysis of the composition of the milk produced, such as AfiLabTM (S.A.E. Afikim, Afikim, Israel) (Leitner et al., Reference Leitner, Merin, Lemberskiy-Kuzin, Bezman and Katz2011), or Herd NavigatorTM (DeLaval, Tumba, Sweden) (Mazeris, Reference Mazeris2010), which find application directly in the milking parlour to provide an individual indication on the productive and metabolic performance of the cow. The benefits of such technological solutions are innumerable: milk sampling has the great advantage of not being invasive for the animal; furthermore, these diagnostic tools are precise and sensitive to the parameters analysed, promising, compared to laboratory analyses, a reduction in the costs necessary for the purchase of reagents and for the transport of samples, as well as the time necessary to carry out the analyses (Giannuzzi et al., Reference Giannuzzi, Pegolo, Ruggeri, Trevisi and Cecchinato2022). However, such approaches focusing on individual milk components interpret the system according to a fragmentary logic that does not consider the molecular relationships underlying any biological system's structural and functional organisation.
In this regard, aquaphotomics represents a sustainable approach for monitoring production variables related to the early onset of metabolic disorders in intensive farms. Onset of disease significantly alters the molecular structure of the water contained in milk or any other biological fluid matrix in response to subtle biochemical changes that accompany the initial stages of the onset of an infection. An animal's physiological and health status can, therefore, be determined using the spectral pattern of water as a biomarker, a discovery of enormous scientific importance compared to the measurement of the individual analytes used for diagnosing pathology. If taken individually, these components often don't discriminate between healthy and diseased systems, especially in the subclinical phase (Muncan and Tsenkova, Reference Muncan and Tsenkova2019). The knowledge gained from this discipline offers the potential to develop portable or milking parlour-installed diagnostic tools to characterise the milk properties of each individual cow in real-time. The resulting daily monitoring enables farmers to noninvasively and immediately control the health status of their animals. This makes it possible to automatically identify the animals that require more assistance and specialised care (Caja et al., Reference Caja, Castro-Costra and Knight2016; Muncan et al., Reference Muncan, Kovacs, Pollner, Ikuta, Ohtani, Terada and Tsenkova2021b). Furthermore, this alarm system could help the farmer undertake the targeted interventions to correct and optimise the chemical and physical composition of the ration. Such a ration improvement reduces the stress factors, prevents the disease onset in the clinical form, reduces the economic expenses associated with the treatment, and avoids yield drops in milk production (Caja et al., Reference Caja, Castro-Costra and Knight2016; Wisnieski et al., Reference Wisnieski, Norby, Pierce, Becker, Gandy and Sordillo2019). Implementing such systems would enhance the efficiency of animal breeding, ensuring that it meets the current and future market demands for food supply while safeguarding the welfare of farmed animals in compliance with regulatory standards and consumer interests.
In conclusion, aquaphotomics is a promising method that can be implemented throughout the milk supply chain to guarantee adherence to the highest quality standards for the production animal and the final product (Lovarelli et al., Reference Lovarelli, Bacenetti and Guarino2020). By applying this approach on the farm, during production and on the finished product, we can ensure that the end product complies with strict quality, safety, and sustainability guidelines. This approach represents an essential instrument of protection and guarantee in the dairy industry, ensuring that the final product is of the highest quality and meets the needs of both producers and consumers.
Supplementary material
The supplementary material for this article can be found at https://doi.org/10.1017/S0022029924000608
Acknowledgements
The authors acknowledge the Lombardy Region, which funded the AUTOFEED project (Lombardy Region Official Journal No. 24–04/07/2019), and the Italian Ministry of Agriculture, Food Sovereignty and Forests (MASAF), which funded the work as part of the ‘AGRIDIGIT’ project, ‘AGROFILIERE’ sub-project (Decree n. 36503 of 20/12/2018). The research is carried out within the PhD in Engineering for energy and environment – Biosystems and environment at the University of Tuscia.


 Open access