INTRODUCTION
In the past decade, a burgeoning body of research has used experimental approaches to shed new light on how responsive public officials are to constituents. Specifically, over 50 audit experiments on elite responsiveness have been conducted since Butler and Broockman’s (Reference Butler and Broockman2011) initial study of constituent communication.Footnote 1 But the fact that any single study provides limited information has become especially poignant given recent publicized concerns about publication bias and minimal replication in scientific research (Collaboration, 2015; Singal, Reference Singal2015). Given the explosion of work in this area and the novelty of methods being used, a systematic assessment of these studies is needed not only to take stock of what we have learned so far about democratic responsiveness, but also to inform the design of future studies taking on this question. Meta-analysis is one technique that can overcome the limitations of standard null hypothesis significance testing (Gill, Reference Gill1999), as well as provide a comprehensive framework for understanding a heavily studied or burgeoning topic of research (Humphrey, Reference Humphrey2011).
In this article, I conduct the first meta-analysis of all published and unpublished experiments that use political elites as subjects and where responsiveness to constituent communication is the outcome of interest. I estimate the overall rate at which government officials respond to constituent communication, as well as how this effect varies across different experimental designs. I am particularly concerned with uncovering whether the constituent’s race, level of office being studied, and content of the message condition how political elites respond to constituent communication. These factors have been central to analyses of elite responsiveness.
Levels of responsiveness vary by study. Although Butler and Broockman (Reference Butler and Broockman2011) found that officials were 5.1% more likely to respond to white constituents over black constituents, Einstein and Glick (Reference Einstein and Glick2017) found they were 3.2% more likely to respond to blacks. When it comes to Latino/a constituents, we are even more unsure of the effect of racial or ethnic discrimination on responsiveness. Mendez (Reference Mendez2014), for example, finds that state legislators respond to Latino constituents at a rate of 29.8%, while Mendez and Grose (Reference Mendez and Grose2014) find that same response rate to be as high as 40.3%.
What explains the differences between findings? It is possible that methodological choices are responsible for the different levels of responsiveness. For example, Butler and Broockman (Reference Butler and Broockman2011) email state legislators, while Einstein and Glick (Reference Einstein and Glick2017) focus on lower-level public officials. Even compared to other studies with similar, lower-level officials, responsiveness levels vary (e.g. Butler and Crabtree, Reference Butler and Crabtree2016; White et al., Reference White, Nathan and Faller2015). What is the effect of the level of office, or perhaps being elected versus non-elected, on elite responsiveness? Additionally, Butler and Broockman (Reference Butler and Broockman2011) waited 30 days for responses, White et al. (Reference White, Nathan and Faller2015) waited 62 days, and Mendez and Grose (Reference Mendez and Grose2014) waited 14 days. Meanwhile, other studies waited as long as 10 months (Butler et al., Reference Butler, Karpowitz and Pope2012). Can differences in response rates be attributed to different response cut-off times?
The questions outlined above highlight why a meta-analytic review of the literature is important. Responsiveness is a multi-faceted conception that manifests in elite communication with constituents in various ways. Because much of the research in this area is relatively recent and pioneering in its own right, considerable diversity exists among the findings. I consider the methods used and design elements of each experiment to synthesize these findings and explain variations in elite responsiveness to constituent communication.
METHOD
For a study to be included in this analysis, it had to be a fully randomized controlled trial and use political elites as subjects and responsiveness to constituent communication as the outcome variable.Footnote 2 I searched for every published and unpublished study that might fall within this area. I used a wide variety of search tactics to be as comprehensive as possible, including searching library/journal databases, conference proceedings, pre-registration databases, and sending out calls to personal contacts and email listserves.Footnote 3
This search resulted in a final dataset of 28 published and 13 unpublished experiments that could be located as of February 23, 2016, for a total of 41 experiments from 19 different papers and 1 book.Footnote 4 Table 1 includes the full list of papers from which the experiments were collected. The papers were published or written between 2011 and 2016 with the earliest experiment conducted in 2007 (Grose et al., Reference Grose, Malhotra and Van Houweling2015), highlighting the recent and rapid emergence of these kind of experiments in the discipline. Thirty-three studies focused on the U.S., 3 on China, 3 on Germany, 1 on South Africa, and 1 on the European Union.
Table 1 Papers/Books Included in Meta-Analysis, Listed Alphabetically by Last Name
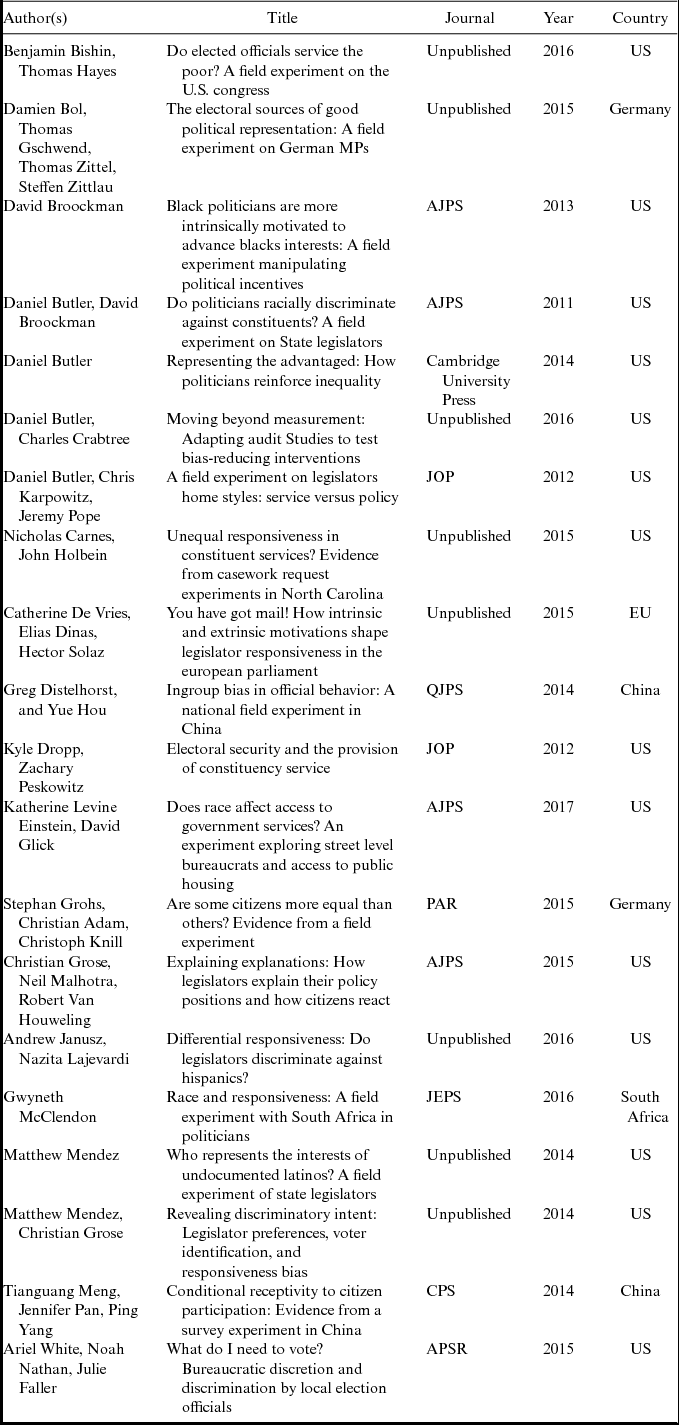
Note. AJPS=American Journal of Political Science, JOP=Journal of Politics, CPS=Comparative Political Studies, QJPS=Quarterly Journal of Political Science, APSR=American Political Science Review, JEPS=Journal of Experimental Political Science, PAR=Public Administration Review.
Each separate experiment, even if appearing in the same article, is included as its own case in the meta-analysis. For example, if requests sent to Congress members and state legislators are estimated separately in the same paper, I include both as separate observations. This is standard practice in meta-analyses, but to ensure the results are not conditioned by the articles they appear in, I also analyze the studies without “double-counting” experiments from the same article in the SI.
The results from each study are coded and transformed into a common metric so I can examine the consistency and magnitude of findings across all studies. To calculate the main effect of constituent communication on elite responsiveness, I record the proportion of constituent requests that received a response and, if available, meaningful response.Footnote 5 After the proportion of responses are coded or calculated, they are aggregated to produce a summary estimate of the overall effect of constituent communication on elite responsiveness. Since the studies vary widely in sample size, the findings are weighted using the inverse variance of each study and between-studies τ2, standard in random-effects models for meta-analysis.Footnote 6
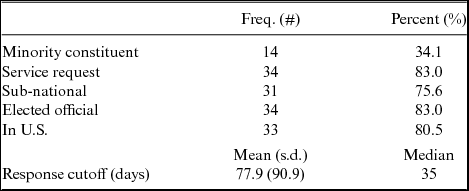
Finally, since the overall response rate is not generally the estimand of interest in this literature, the studies are tested for moderator effects, or variables that might influence the outcome of an experiment. I examine whether (1) the length of time researchers waited for a response in days, (2) the sender was a minority or not, (3) the request focused on constituency service or a policy issue, (4) the level of government (national or sub-national), (5) the elite is elected or not, and (6) the experiment was conducted in the U.S. or not, explains the variation in response rates across experiments. See Table 2 for summary statistics on these variables. The SI includes more details on how each of these variables was coded.
Table 2 Descriptive Statistics of Moderator Variables
The types of moderators I can include are limited to those that are central to the design of the experiments. In other words, I am only able to incorporate factors that are consistently reported by the studies (i.e. the type of elite subject) or are part of the experimental designs themselves (i.e. the race of the constituent sender). Some additional design manipulations that exist in the literature, such as whether the constituent and public official share the same race or political party, have not yet been included in enough experiments to be meta-analyzed, but I do qualitatively take those into account when interpreting the results.
RESULTS
How Responsive are Political Elites Overall?
To answer how responsive political elites are to constituent requests, I fit a random-effects model using the metafor package in R (Viechtbauer, Reference Viechtbauer2010) to compute a weighted mean of the effect sizes. For more details on random-effects models and additional robustness checks of the weighting technique used, see the SI.
Figure 1 is a forest plot that displays the results from each study. The columns on the left indicate whether the study is published and in what country the experiment took place. The last column indicates the observed response rate with 95% confidence intervals. In the middle, the observed effects are displayed by square boxes that are sized proportional to the precision of the estimates. At the bottom, the combined effect is represented by a diamond with the outer edges drawn to the confidence interval limits.
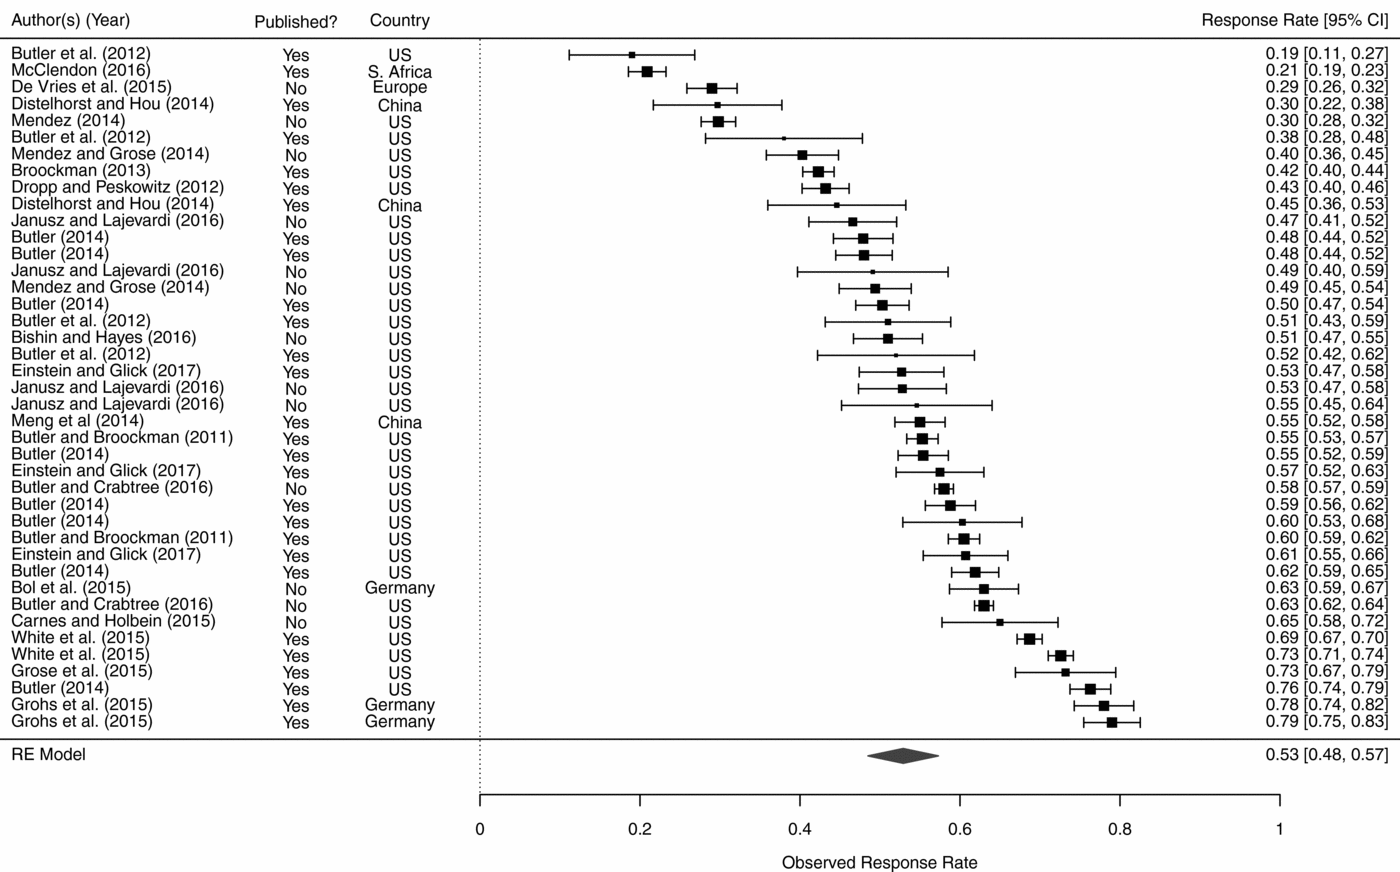
Figure 1 Forest Plot of All Studies on Elite Responsiveness.
The average observed effect of the treatment is 0.529. That is, political elites respond to constituent communication 53% of the time. The main effect for only published studies is 0.542 and for unpublished studies is 0.50. Neither of these are statistically distinguishable than the combined effect for all studies, but see the SI for additional tests for publication bias. The response rates range from 0.19 to 0.79. The lowest response rate occurred in an experiment by Butler et al. (Reference Butler, Karpowitz and Pope2012) conducted on U.S. state legislators. The two highest response rates were in Grohs et al. (Reference Grohs, Adam and Knill2015) in Germany.
Some studies additionally measure the quality of the response received, i.e. whether it is “friendly” or “helpful.” Specifically, 19 out of the 41 experiments measured the quality of responsiveness. Using this alternative outcome variable in a random-effects model, the main effect of constituent communication on receiving a “good” response from a public official is 0.453, a difference of 8 points from receiving any response (0.53).Footnote 7
Why Responsiveness Varies
Although the response rate from this set of studies was consistent across different robustness checks, it does not explain what causes some studies to find higher response rates than others. And of course, estimating the overall rate of response from public officials to constituent communication is not the main aim of these studies, but rather to examine if officials are more responsive to some constituents than others. Toward this end, I estimate a mixed-effects model, which is simply a random-effects model with covariates that may account for differences across studies. The first column in Table 3 presents the results from a model with these variables included.Footnote 8
Table 3 Meta-Regression Analysis Estimating the Effect of Moderators on Elite Responsiveness
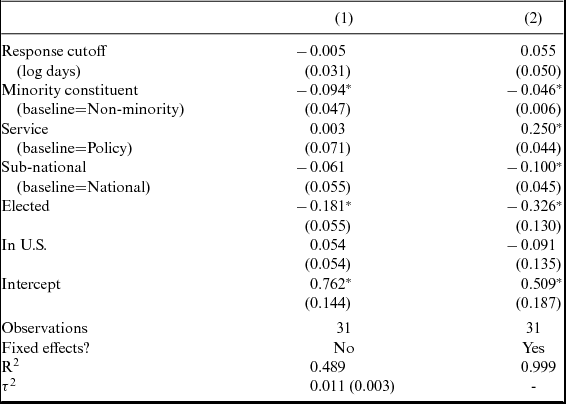
Note. *p < 0.05. Standard errors in parentheses. τ2 represents the amount of heterogeneity among the true effects that is not already accounted for by the moderators. τ2 estimator: Restricted maximum-likelihood estimation. Response cutoff is not reported for 10 of the studies. See the SI for a model without this variable to preserve the full N.
The first thing to note is that design-oriented variables that are typically thought to affect how likely researchers will observe a high response rate do not seem to have statistically significant effects. For example, studies with a later response cutoff do not necessarily record higher responsiveness. That is, waiting longer for responses does necessarily yield a higher number of responses. Additionally, although policy related communications are largely avoided by many researchers in lieu of service requests, possibly due to their dampening effect on responsiveness originally found in Butler et al. (Reference Butler, Karpowitz and Pope2012), no such statistically significant effect between service and policy communication is discernible here. The assumption that service requests are much more likely to receive a response is often built into these experiments at the design stage. Butler et al. (Reference Butler, Karpowitz and Pope2012) propose multiple theories for why elected officials should be less likely to respond to policy-oriented messages—offending the constituent if they disagree on issues, for example—and the benefits of service requests—such as defending local interests and cultivating an image of helpfulness. Yet, service communication is not necessarily prioritized by public officials over policy communication when estimating responsiveness across all studies. Not only is the coefficient not statistically significant for this variable, but the estimated difference is substantively very small.
As for variables that do have a statistically significant effect, minority constituents are almost 10 percentage points less likely to receive a response than non-minority constituents (p < 0.05). This is consistent with many individual studies that have shown requests from racial and ethnic minorities are given less attention overall, and particularly when the recipient official does not share their race (Broockman, Reference Broockman2013; Butler and Broockman, Reference Butler and Broockman2011; Distelhorst and Hou, Reference Distelhorst and Hou2014). It is possible, however, that these results would vary based on the specific racial or ethnic group of the sender. Latinos, for example, do not turn out to vote at as high of a rate as African Americans in the United States, so there may be less electoral incentive for political elites to respond to communication from Latinos. Although I use the minority/non-minority dichotomy because of the limited number of studies that focus on racial/ethnic biases in response rates, when I do include separate indicators for Blacks and Latinos in the U.S., Latinos are 14.2 percentage points less likely to receive a response than white constituents, compared to a 7.3 percentage point deficit for Blacks.
Moreover, elected political elites significantly decrease the observed response rate by 18% (p < 0.05) as opposed to non-elected elites, such as bureaucratic officials. It is possible that elected officials are more bombarded with constituent emails on a daily basis and are therefore unable to answer every request. Some scholars have also found that elected officials are more likely to respond to constituents in their own representational jurisdiction (e.g. Broockman, Reference Broockman2013), and that they tailor their responses to suit the constituent’s policy preferences (Grose et al., Reference Grose, Malhotra and Van Houweling2015). Public officials who are not directly elected theoretically do not have to make the same considerations.
Of course, given the relatively small number of studies in this analysis, it may be difficult to estimate these moderator effects with high levels of precision. Thus, just because a moderator is not statistically significant in the model does not mean that it does not matter for affecting response rates. The second column in Table 3 reports the same analysis but with fixed effects included for each study, since some of these variables—such as response cutoff, service/policy, elected/not elected, national/sub-national— are typically not randomized within the same study; that is, the variation occurs across studies. Generally speaking, the results are mostly consistent in this model. The coefficients for service requests and sub-national public officials are now statistically significant, although in the same direction as in the first model. Service requests are more likely to receive a response, whereas requests to sub-national officials yield lower response rates. The coefficient for minority constituent is about half the size as it is in the first model, but it remains statistically significant. Finally, the fixed effects model produces a coefficient for the elected official variable that is larger than in the first model. Overall, although the magnitude of some of the effects estimated in the first model differ when using study-level fixed effects, these differences generally do not substantially alter the overall patterns uncovered in model 1.Footnote 9
Strategic Considerations or Personal Bias?
The analysis above uncovered that elite responsiveness is not equal across all conditions. Yet the mechanisms behind these inequalities are not as clear. For example, contextual factors, such as district competitiveness, could affect how often legislators respond to constituent communication. Since it is rare for any two studies to measure these contextual variables in the same way (if they are accounted for at all), I am unable to meta-analyze their effects on response rates. However, a qualitative overview of these theoretically-relevant, contextual variables can shed light on the meaning of the average effects in the analysis above.
Although it is difficult to causally identify the impact of contextual factors on responsiveness since they are not randomly assigned, some scholars have examined whether treatment effects vary across contexts. In studies that examine the effect of race and ethnicity on responsiveness, the main theoretical question of interest is whether strategic, electoral considerations cause officials to be less responsive to minorities, rather than personal, intrinsic bias. For example, several studies have examined whether legislators have a heightened electoral incentive to respond to minorities when they comprise a larger share of the district’s population. Although this is measured in different ways across the four studies that account for this factor (proportion of African Americans or Latinos in the district, “high”-minority populations versus “low”-minority populations, etc.), three of the four studies did not find a statistically significant relationship between levels of minorities in the population and responsiveness (Einstein and Glick, Reference Einstein and Glick2017; Mendez and Grose, Reference Mendez and Grose2014; Janusz and Lajevardi, Reference Janusz and Lajevardi2016). White et al. (Reference White, Nathan and Faller2015) did uncover a mild difference but with one important caveat: Although local election officials were more biased against Latinos in low-Latino localities, this was highly correlated with Voting Rights Act (VRA) coverage. Since high-Latino localities are also covered by the VRA, it is unclear whether the lack of VRA coverage or lower electoral incentive to respond to Latinos is driving the effect.
Among the two studies that empirically considered the effects of VRA coverage (Butler, Reference Butler2014; White et al., Reference White, Nathan and Faller2015), the results are mixed. White et al. (Reference White, Nathan and Faller2015) find that bias against Latinos is 7.5% points lower in places covered by the VRA. Yet Butler (Reference Butler2014) find that legislators from states covered under the VRA exhibited the same level of bias as legislators in states not covered under the VRA. It is therefore unclear whether anti-discrimination laws are effective at reducing bias in responsiveness to minorities.
It is also possible that legislators are more likely to respond to all constituents, minorities or not, if they are up for re-election or the district is particularly competitive. Yet none of the studies testing for this possibility found that this was the case (Butler and Broockman, Reference Butler and Broockman2011; Butler, Reference Butler2014; Janusz and Lajevardi, Reference Janusz and Lajevardi2016; Mendez and Grose, Reference Mendez and Grose2014).
Finally, a few studies examined whether responsiveness correlate with total population size (Janusz and Lajevardi, Reference Janusz and Lajevardi2016; Mendez and Grose, Reference Mendez and Grose2014; White et al., Reference White, Nathan and Faller2015). None of these studies found a statistically significant relationship between the total population in a legislator’s district and the extent to which that legislator discriminated against non-whites.
The one factor that did seem to have a consistent effect on mediating racial biases is not a contextual characteristic about the localities, but a personal characteristic of the public official. Specifically, whether an official was the same race as the constituent influenced their propensity to respond in multiple studies (Broockman, Reference Broockman2013; Butler, Reference Butler2014; Butler and Broockman, Reference Butler and Broockman2011; Mendez, Reference Mendez2014). This minority ingroup/outgroup effect goes above and beyond electoral incentives. Although all legislators are more likely to respond to fellow partisans, bias against racial outgroups remains among both white and minority legislators (Butler, Reference Butler2014). Broockman (Reference Broockman2013), for example, found that African American legislators were much more likely than other legislators to respond to African Americans even when they purportedly lived outside their district. This finding suggests that African American legislators are more “intrinsically motivated” to respond to constituents of the same race, regardless of the electoral incentive to do so. Increasing the electoral incentive for white legislators to respond to minorities also does not close the gap in their response rates to whites versus minorities. As Butler (Reference Butler2014) concludes, “while there is evidence that strategic considerations regarding voters’ perceived partisanship might partially motivate the observed patterns of discrimination, there remain significant levels of discrimination that cannot be explained by strategic responses alone” (108).
DISCUSSION
This analysis provides a number of qualifications to many prominent individual findings in the literature. For example, the difference between service requests and policy requests was not statistically significant and the magnitude of the coefficient was quite small. This is notable considering the vast majority of studies use service, instead of policy, as the focus of the communication, reflecting the widespread assumption that service requests are more likely to receive a response (a result originally found in Butler et al. (Reference Butler, Karpowitz and Pope2012)).
Moreover, although individual studies provide a range of different estimates for the effect of race on response rates, this meta-analysis finds a substantively large and statistically significant 10 percentage point decrease in responsiveness to racial and ethnic minority constituents. When I analyzed Latino and African American constituents separately, Latinos were significantly less likely than whites to receive a response from government officials compared to African Americans. This is a more precise estimate that offers clarification to the relatively large body of research on this topic.
To be sure, there are a multitude of other factors that could affect responsiveness that have not yet been studied via this experimental approach. For example, elected officials might be much more likely to respond when there are electoral incentives to do so. A qualitative review of this literature suggested that while contextual variables such as anti-discrimination laws and strategic considerations may help to close the deficit in responsiveness to racial and ethnic minorities, there remain personal, intrinsic biases that remain unaccounted for. These findings not only provide an overall sense of how responsive officials are to constituent requests, but also help to organize, frame, and understand the literature on elite responsiveness.
SUPPLEMENTARY MATERIALS
To view supplementary material for this article, please visit https://doi.org/10.1017/XPS.2017.14.
