Hostname: page-component-cd9895bd7-gxg78 Total loading time: 0 Render date: 2024-12-26T20:22:20.713Z Has data issue: false hasContentIssue false

How to Survey About Electoral Turnout? Additional Evidence

Published online by Cambridge University Press:  10 April 2018

Alexandre Morin-Chassé*
Affiliation:
University of Montreal e-mail: alexandre.morin.chasse@umontreal.ca
Rights & Permissions [Opens in a new window]

Extract

Post-election surveys measure voter turnout in a variety of ways. The Canadian Election Study (CES) simply asks respondents whether or not they voted. However, existing research shows that some abstainers report having voted when they in fact did not (Granberg and Holmberg, 1991; Selb and Munzert, 2013). If this misreporting is correlated with other traits, analysis based on the data can be biased. One possible solution to reduce the incentive to overreport is to reframe the turnout question.

Type
Short Report
Copyright
Copyright © The Experimental Research Section of the American Political Science Association 2018 

Post-election surveys measure voter turnout in a variety of ways. The Canadian Election Study (CES) simply asks respondents whether or not they voted. However, existing research shows that some abstainers report having voted when they in fact did not (Granberg and Holmberg, Reference Granberg and Holmberg1991; Selb and Munzert, Reference Selb and Munzert2013). If this misreporting is correlated with other traits, analysis based on the data can be biased. One possible solution to reduce the incentive to overreport is to reframe the turnout question.

The British Election Study presents respondents with a short preamble (SP) before asking them if they voted or not. Such SPs state that some people abstain at elections, and that they do so for a variety of reasons. No published study has ever tested if including a SP impacts on reported behavior. The CES fielded an experiment in its online survey following the 2015 federal election to answer this very question.

The survey was conducted by the firm Survey Sampling International (SSI). Small monetary incentives were used to encourage participation. Unfortunately, SSI's recruitment methods make it impossible to compute a response rate.Footnote 1 7,557 Rs participated in the pre-election telephone survey, and 4,408 also completed the online post-election survey (attrition rate : 41.7%). A random half of Rs was exposed to a SP before being asked whether or not they voted (see Table 1). The SP mentions: “some people are not able to vote because they are sick or busy, or for some other reason. Others do not want to vote.” Experimental groups are balanced on observable characteristics. Non-response items are recoded as missing data (≈2%).

Table 1 Experimental Conditions in the Short Preamble Experiment

Table 2 presents the results. Subgroup analyses show that the SP reduces reported turnout among people with disabilities (−5.8 percentage points). However, this effect is largely diluted when all Rs are combined. In the whole sample, reported turnout is 87.9% in the control group, against 87.0% in the treatment group. This difference is not statistically significant.Footnote 2

Table 2 Results for the Short Preamble Experiment

The American National Election Studies measure voter turnout using a different approach: they combine a SP with face-saving response items (FSRIs). FSRIs allow respondents to report that they abstained while simultaneously justifying why they did not vote (Duff et al., Reference Duff, Hanmer, Park and White2007; Belli et al., Reference Belli, Moore and VanHoewyk2006).

In a recent publication, Morin-Chassé et al. (Reference Morin-Chassé, Bol, Stephenson and St-Vincent2017) present the results of 19 experiments testing the efficacy of replacing yes or no options with FSRIs (see Table 3). In Figure 1, Case IDs 1 to 5 present five additional experiments fielded as part of the same project.Footnote 3 The lines below report the same results as those published before by Morin-Chassé et al. Finally, the two bottom lines present cumulative effect estimates. The first is the average effect size of (−7.27 pp); the second is based on the combination of all individual survey responses (−6.82 pp).

Table 3 Experimental Conditions in the Face-Saving Response Items Experiment
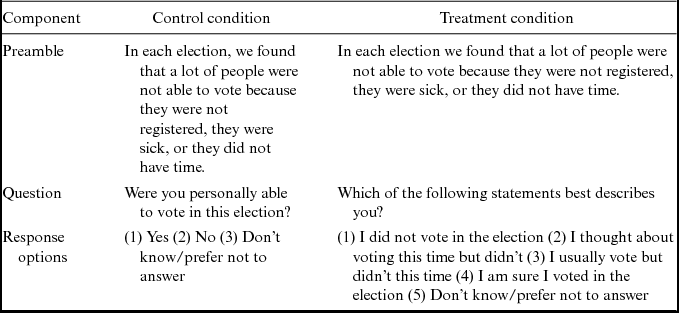
Figure 1 Using Face-Saving Response Items to Reduce Vote Overrepporting: Effects Measured in the 24 Survey Experiments Fielded as Part of the Making Electoral Democracy Works Project (95% CI).

Overall, the findings reported in this Short Report suggest that combining a SP with FSRIs is a valuable approach to reduce vote overreporting. The main limitation of these experiments is the impossibility to validate self-report data with official voting records.

SUPPLEMENTARY MATERIALS

The appendix is available online as supplementary material at https://doi.org/10.1017/XPS.2018.1

Footnotes

The data, code, and any additional materials required to replicate all analyses in this article are available at the Journal of Experimental Political Science Dataverse within the Harvard Dataverse Network, at: doi:10.7910/DVN/RHPOYR. Thanks to Semra Sevi, Alexandre Blanchet, Eric Lachapelle, Damien Bol, Laura Stephenson, and anonymous referees for comments and suggestions.

1 See appendix and Breton et al. (Reference Breton, Cutler, Lachance and Mierke-Zatwarnicki2017) for explanations.

2 Actual turnout for this election: 68.3%. Additional information in appendix.

3 Additional information in appendix.

References

REFERENCES

Belli, Robert F., Moore, Sean E., and VanHoewyk, John. 2006. “An Experimental Comparison of Question Forms Used to Reduce Vote Overreporting.” Electoral Studies 25 (4): 751–9.Google Scholar
Breton, Charles, Cutler, Fred, Lachance, Sarah, and Mierke-Zatwarnicki, Alex. 2017. “Telephone Versus Online Survey Modes for Election Studies: Comparing Canadian Public Opinion and Vote Choice in the 2015 Federal Election.” Canadian Journal of Political Science 50 (4): 1005–36.Google Scholar
Duff, Brian, Hanmer, Michael J., Park, Won-Ho, and White, Ismail K.. 2007. “Good Excuses: Understanding who Votes with an Improved Turnout Question.” Public Opinion Quarterly 71 (1): 6790.Google Scholar
Fournier, Patrick, Cutler, Fred, Soroka, Stuart, and Stolle, Dietlind. 2015. “The 2015 Canadian Election Study [dataset].” (http://ces-eec.arts.ubc.ca/english-section/surveys/).Google Scholar
Granberg, Donald and Holmberg, Soren. 1991. “Self-Reported Turnout and Voter Validation.” American Journal of Political Science 35 (2): 448–59.Google Scholar
Morin-Chassé, Alexandre. 2017. “Replication Data for: How to Survey About Electoral Turnout? Additional Evidence.” Harvard Dataverse. V1. doi:10.7910/DVN/RHPOYR.Google Scholar
Morin-Chassé, Alexandre, Bol, Damien, Stephenson, Laura B., and St-Vincent, Simon Labbé. 2017. “How to Survey About Electoral Turnout? The Efficacy of the Face-Saving Response Items in 19 Different Contexts.” Political Science Research and Methods 5 (3): 575–84.Google Scholar
Selb, Peter and Munzert, Simon. 2013. “Voter Overrepresentation, Vote Misreporting, and Turnout Bias in Postelection Surveys.” Electoral Studies 32 (1): 186–96.Google Scholar
Figure 0

Table 1 Experimental Conditions in the Short Preamble Experiment

Figure 1

Table 2 Results for the Short Preamble Experiment

Figure 2

Table 3 Experimental Conditions in the Face-Saving Response Items Experiment
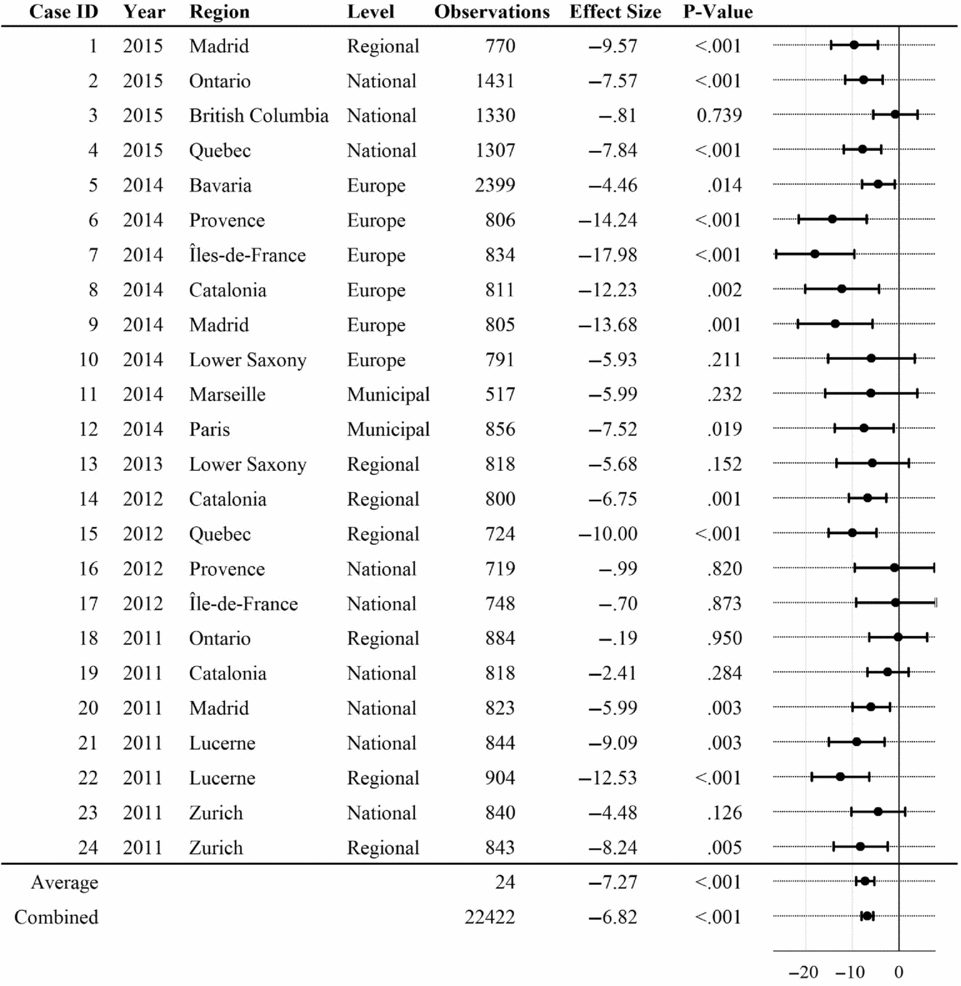
Figure 3

Figure 1 Using Face-Saving Response Items to Reduce Vote Overrepporting: Effects Measured in the 24 Survey Experiments Fielded as Part of the Making Electoral Democracy Works Project (95% CI).

Supplementary material: Link

Morin-Chassé Dataset

Link
Supplementary material: PDF

Morin-Chassé supplementary material

Appendix

Download Morin-Chassé supplementary material(PDF)
PDF 2.5 MB