No CrossRef data available.
Article contents
Money Market Development and the Demand for Money: Some Preliminary Evidence
Published online by Cambridge University Press: 19 October 2009
Extract
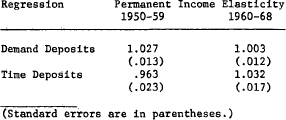
George Kaufman and Cynthia Latta in “The Demand for Money: Preliminary Evidence from Industrial Countries,” have presented econometric evidence that the money-demand function may shift with the development of financial markets. The thesis depends on the heightened cross-elasticities and lowered wealth-elasticities (or income-elasticities) that are supposed to attend the development of new near-money forms. Their evidence is based on a summary of statistics from money-demand equations for developed and less-developed countries.
- Type
- Communications
- Information
- Journal of Financial and Quantitative Analysis , Volume 6 , Issue 4 , September 1971 , pp. 1155 - 1157
- Copyright
- Copyright © School of Business Administration, University of Washington 1971
References
1 Journal of Financial and Quantitative Analysis, I (September 1966), pp. 75–89.
2 The Federal Reserve is currently collecting data for money holdings by sector. The most recent survey data published were for January 1960.
3 The National Banking Review, IV (March 1967), pp. 317–336.Google Scholar
4 Without data for money holdings by sector, the service charge variable is very difficult to interpret. Until recently, implicit service charges (the revenue per dollar of demand deposits a bank obtains from investment in assets; explicit service charges are any direct levies a bank may access on a deposit cutomer) characterized only large (mainly business) demand deposit accounts, whereas, explicit payment of service charges characterized the pricing of small (mainly individually-held) accounts. The results of the same model in which the service charge variable is suppressed, as it is in this note, is reported in my article, “A Cross-Section Study of the Demand for Money by Ownership Category,” Staff Memorandum, Federal Reserve Bank of Chicago (April 1966).
5 The “Chow statistic” is calculated as ![]() where
where
SSEN = sum of squares of residuals, 1950–68,
SSE1 = sum of squares of residuals, 1950–59,
SSE2 = sum of squares of residuals, 1960–68,
n = number of observations, and
k = numbers of parameters in model.
(See Chow, Gregory C., “Tests of Equality Between Sets of Coefficients in Two Linear Regressions,” Econometrica, XXVII (1960), pp. 591–605Google Scholar, and Kane, Edward J., Economic Statistics and Econometrics (New York: Harper and Row), pp. 341–342.Google Scholar
6 


