1. Introduction
The combined effect of an adverse pressure gradient (APG) and viscosity can cause flow separation. Flow separation can cause significant changes in flow properties and interfere with the force prediction of objects in engineering practice (Mani & Dorgan Reference Mani and Dorgan2023). Studying APG turbulent boundary layers (TBLs) can elucidate the behaviour of TBLs before flow separation.
The first step in studying APG TBLs is to describe the strength of the APG using pressure gradient parameters. The Clauser pressure gradient parameter (Clauser Reference Clauser1954) is the classic measure and is defined as
Here, $\delta ^{*}$ is the displacement thickness and $P_{e}$ is the boundary layer edge pressure; $u_{\tau } =\sqrt {\tau _{w}/\rho }$, where $\tau _{w}$ is the shear stress at the wall and $\rho$ is the density; $\beta$ can also be considered the ratio of the time scale of the TBL outer region to the time scale of the potential flow outside the TBL (Maciel, Rossignol & Lemay Reference Maciel, Rossignol and Lemay2006; Romero et al. Reference Romero, Zimmerman, Philip, White and Klewicki2022b). Alternatively, it can be considered as the ratio of the excess pressure force exerted on the TBL to the wall shear stress, which can be obtained from the right-hand side of the momentum equation after the Kármán momentum integration (Devenport & Lowe Reference Devenport and Lowe2022). Here $\beta$ approaches infinity as flow separation approaches. Different states of the TBL can be described by defining different pressure gradient parameters. Maciel et al. (Reference Maciel, Wei, Gungor and Simens2018) suggested that suitable pressure gradient parameters could be constructed by selecting velocity and length scales based on the properties of the TBL outer region and then using a set of consistent non-dimensional parameters to describe the APG TBL. Therefore, the choice of appropriate scales is important for turbulence research.
According to classic theory, the TBL can be divided into inner and outer regions (Tennekes & Lumley Reference Tennekes and Lumley1972). The inner region is dominated by the viscous term. The velocity scale is $u_{\tau }$ and the length scale is $\nu /u_{\tau }$. The outer region is dominated by the inertial term. The velocity scale is the TBL edge velocity $U_{e}$ and the boundary layer thickness $\delta$ is a length scale. Turbulent motions range in size from the width of the boundary layer thickness $\delta$ to much smaller scales, which become increasingly smaller relative to the boundary layer thickness $\delta$ with increasing Reynolds number (Pope Reference Pope2000). As the flow approaches separation, the wall friction gradually decreases until reaching zero, and $u_{\tau }$ approaches zero as well. Numerous related studies have found that $u_{\tau }$ no longer serves as a suitable scale for velocity in the APG TBL (Gungor et al. Reference Gungor, Maciel, Simens and Soria2016; Maciel et al. Reference Maciel, Wei, Gungor and Simens2018; Gungor, Maciel & Gungor Reference Gungor, Maciel and Gungor2022; Romero et al. Reference Romero, Zimmerman, Philip, White and Klewicki2022b). Therefore, it becomes imperative to identify new scales that are suitable for APG conditions.
The difficulty in scaling APG TBLs arises from the fact that most APG TBLs exist in non-equilibrium states, and the profiles of physical quantities developed in the streamwise direction are dissimilar. Castillo & George (Reference Castillo and George2001) considered TBLs to be in an equilibrium state when the pressure gradient parameter $\varLambda =({\delta }/{\rho U_{e}^{2}\mathrm {d}\delta /\mathrm {d} x})({\mathrm {d}P_{e}}/{\mathrm {d}\kern0.7pt x})$ remains constant, and most experiments tend to exhibit this state. They proposed utilizing $U_{e}$ to scale the velocity defect and $U_{e}^{2}({\mathrm {d} \delta }/{\mathrm {d}\kern0.7pt x})$ to scale the Reynolds shear stress in the outer region of the TBL through similarity analysis. However, Maciel et al. (Reference Maciel, Rossignol and Lemay2006) disagreed with the aforementioned viewpoint and proposed a generalized criterion for flow equilibrium. Bobke et al. (Reference Bobke, Vinuesa, Örlü and Schlatter2017) examined the differences in TBLs under various APG development processes. They discovered that even with the same pressure gradient parameter and Reynolds number, the mean velocity profile and Reynolds stress differed due to the distinct development of upstream flow. A comprehensive review by Devenport & Lowe (Reference Devenport and Lowe2022) provided an in-depth assessment of the characteristics of equilibrium and non-equilibrium TBLs. Flow equilibrium is a concept similar to flow self-similarity, and flow self-similarity can be seen as a sufficient condition for flow equilibrium. If suitable scaling can be identified such that the flow variables exhibit self-similarity under this scaling set, then the flow will attain an equilibrium state (Maciel et al. Reference Maciel, Rossignol and Lemay2006). However, achieving complete self-similarity in general APG TBLs is challenging unless carefully designed experimental or numerical simulation conditions are met. Additionally, the scaling of Reynolds shear stress poses greater difficulties compared with the mean velocity in the majority of similarity analysis studies.
Buschmann & Gad-el Hak (Reference Buschmann and Gad-el Hak2006) conducted a comprehensive review of advancements in the scaling of wall-bounded flows at that time. They concluded that Zagarola–Smits (ZS) scaling $U_{zs}=U_{e}\delta ^{*}/\delta$ showed promise. The ZS scaling originated from the scaling research performed by Zagarola & Smits (Reference Zagarola and Smits1997) on pipe flow. By extending it to TBLs and through theoretical analysis and numerous experiments, it was determined that the ZS scaling could also yield good consistency in APG TBLs (Castillo & George Reference Castillo and George2001; Castillo & Walker Reference Castillo and Walker2002; Aubertine & Eaton Reference Aubertine and Eaton2005; Maciel et al. Reference Maciel, Rossignol and Lemay2006; Lögdberg, Angele & Alfredsson Reference Lögdberg, Angele and Alfredsson2008). Panton (Reference Panton2005) analysed the ZS scaling in terms of composite expansions and proposed that its gauge function exhibits higher-order effects, reducing the Reynolds number dependence of the velocity defect. Maciel et al. (Reference Maciel, Rossignol and Lemay2006) argued that in the context of asymptotic TBL behaviour, the ZS scaling is equivalent to $u_{\tau }$ rather than $U_{e}$ as ${Re \to \infty}$. Monkewitz, Chauhan & Nagib (Reference Monkewitz, Chauhan and Nagib2008) showed that $U_{zs}/u_{\tau }$ approaches a constant at $Re_{\delta ^{*} } >10 ^{4}$. Wei & Maciel (Reference Wei and Maciel2018) examined the success of the ZS scaling specifically under zero pressure gradient (ZPG) conditions and attributed it to the balanced leading terms in the mean continuity equation. Maciel et al. (Reference Maciel, Wei, Gungor and Simens2018) further suggested that for APG TBLs, the evolution of the three force ratios in the flow can be accurately characterized when the outer region velocity scale is selected as $U_{zs}$. One of the force ratios is the pressure gradient parameter
In recent years, researchers have explored alternative methods to construct scaling frameworks for APG TBLs. Romero et al. (Reference Romero, Zimmerman, Philip and Klewicki2022a) introduced a mixed scaling approach, while Schatzman & Thomas (Reference Schatzman and Thomas2017) proposed an embedded shear layer scaling method utilizing defects. The inflection point position of the mean velocity profile in this method corresponds to both the peak position of the Reynolds shear stress $-\langle uv\rangle$ and the outer peak position of the Reynolds normal stress $\langle uu\rangle$, illustrating the similarity between the outer region of APG TBLs and free shear flows (Gungor et al. Reference Gungor, Maciel, Simens and Soria2016; Kitsios et al. Reference Kitsios, Sekimoto, Atkinson, Sillero, Borrell, Gungor, Jiménez and Soria2017; Gungor et al. Reference Gungor, Maciel and Gungor2022). More recently, Wei & Knopp (Reference Wei and Knopp2023) employed a similar scaling form but made changes to the velocity and length scales throughout the scaling process.
To derive consistent scaling for non-equilibrium APG TBLs, it is necessary to carefully consider the changes in APG TBLs relative to ZPG conditions. These changes primarily manifest in the outer region of TBLs (Gungor et al. Reference Gungor, Maciel and Gungor2022). As the velocity defect $U_{e}-U$ increases under intense APG conditions, a half-power-law region is found to exist above the logarithmic region in the mean velocity profile (Townsend Reference Townsend1961). Furthermore, the peak of the Reynolds shear stress $-\langle uv\rangle$ shifted outwards, along with the appearance of an outer peak in the Reynolds normal stress $\langle uu\rangle$. The $\langle uu\rangle$ component has garnered significant attention in the field of turbulence research due to its substantial contribution to turbulent kinetic energy and its role as an energy source for redistribution processes. The discovery of the presence of the outer peak in the $\langle uu\rangle$ profile, which indicates the existence of very-large-scale motions in the outer region of TBLs at high Reynolds numbers, is considered a major breakthrough in understanding turbulence structures and interactions. However, the distinction and relationship between the outer peak of $\langle uu\rangle$ induced by the APG and the high-Reynolds-number effect remains an apparent issue (Bobke et al. Reference Bobke, Vinuesa, Örlü and Schlatter2017). Vila et al. (Reference Vila, Vinuesa, Discetti, Ianiro, Schlatter and Örlü2020) demonstrated that the APG and Reynolds number exhibit a more intricate overlapping effect on the outer peak of $\langle uu\rangle$.
This study uses the above changes in TBLs to derive consistent outer scaling for velocity defect and each component of Reynolds stress over a wide range of APGs. To achieve this, we extended the ZS scaling, taking into account the response distance of TBLs to non-equilibrium conditions. The proposed consistent scaling is then applied to the velocity defect and each Reynolds stress component, resulting in successful data collapses during extensive verification. The pressure gradient parameter $\beta$ of the used databases has a range of two orders of magnitude. Section 2 describes the databases used in this study. Section 3 presents and analyses a set of consistent scaling suitable for a wide range of APGs. Section 4 discusses the impact of APGs on TBLs from momentum and energy perspectives. Section 5 provides a conclusion based on the scaling study and analysis of the properties of APG TBLs.
2. Databases
This study focuses on incompressible flow. To verify the results, we utilized ten typical APG TBL databases consisting of both experimental and numerical simulation data. These databases cover a wide range of pressure gradients. The experimental data include three sets on a horizontally placed axisymmetric cylindrical surface (Dengel & Fernholz Reference Dengel and Fernholz1990). They showed similar distributions of pressure gradient parameters. The distinguishing factor was the variation in flow friction coefficients near separation. For the computation of pressure gradient-induced separation and reattachment in a flat-plate TBL using direct numerical simulation (DNS), a common practice introduced by Coleman et al. (Reference Coleman, Rumsey and Spalart2018) is employed. The flow characteristics resembled a two-dimensional separation bubble, and separation and reattachment were induced by velocity transpiration (suction and blowing) along the top boundary. Coleman (Reference Coleman2021) showed that when the velocity transpiration at the top wall was solely suction, it did not generate a favourable pressure gradient. All the aforementioned databases demonstrated the separation of the TBL under continuous influences of the APG and viscosity, with variations in the pressure gradient parameter $\beta$ spanning up to two orders of magnitude. They are non-equilibrium databases. We also utilized five near-equilibrium databases to verify the results. They were well-resolved large-eddy simulations (LES) conducted by Bobke et al. (Reference Bobke, Vinuesa, Örlü and Schlatter2017). The pressure gradient was imposed through the free-stream velocity $U_{top}(x)=C ( x-x_0 ) ^{m}$, where $C$ is a constant, $x_0$ is a virtual origin and $m$ is the power-law exponent. As shown in table 1, b1 represents $x_0=110$ and $m=-0.14$, b2 represents $x_0=110$ and $m=-0.18$, m13 represents $x_0=60$ and $m=-0.13$, m16 represents $x_0=60$ and $m=-0.16$, m18 represents $x_0=60$ and $m=-0.18$. Here $Re_{\theta }$ is the momentum thickness Reynolds number and $H$ is the shape factor; $H$ also serves as a pressure gradient parameter, reflecting the degree of TBL distortion due to the accumulated effects of the APG (Coleman et al. Reference Coleman, Rumsey and Spalart2018).
The specific definition of near equilibrium and non-equilibrium is an interesting topic. Here, we consider the flow to be near equilibrium if the distribution of $U_{top}(x)$ follows the power-law definition (Mellor & Gibson Reference Mellor and Gibson1966; Townsend Reference Townsend1976). If a near-equilibrium flow has a constant $\beta$, it is independent of the flow history. It allows pressure gradient and Reynolds number effects to be separated and a characterization of the Reynolds number effects in a given pressure gradient configuration. However, the pressure gradient parameter $\beta$ of the non-equilibrium databases spans two orders of magnitude.
To generate pressure gradients over a flat no-slip surface, Coleman et al. (Reference Coleman, Rumsey and Spalart2018) and Coleman (Reference Coleman2021) used a transpiration profile $V_{top}(x)$ (suction and blowing) acting through a virtual parallel plane offset by a fixed distance $Y$ from the no-slip surface. This distance $Y$ is used to make the length scales of the flow non-dimensional. Here $U_\infty$ is the free-stream velocity of the ZPG TBL in DNS2018 and DNS2021. Figure 1 shows the development of flow physical quantities affected by the non-equilibrium APG effects in the streamwise direction. As shown in figure 1(a), it is evident that the TBL edge velocity $U_{e}/U_\infty$ steadily decreases, while the boundary layer thickness $\delta /Y$, displacement thickness $\delta ^{*}/Y$ and momentum thickness $\theta /Y$ continue increasing. The shape factor $H$ maintains a finite value until flow separation. The long dash line shows that flow separation occurs at approximately $x/Y=-1.43$, where the flow is continuously influenced by the APG. Determining the edge of APG TBLs is challenging. Integration of the spanwise vorticity in the normal direction is used to define the generalized velocity in DNS2018 and DNS2021. The boundary layer thickness is defined as the height at which 99.5 % of the generalized edge velocity is reached (Coleman et al. Reference Coleman, Rumsey and Spalart2018). The combined effect of the continuous accumulation of APG induces distortions in the mean velocity profile of the TBL. As shown in figure 1(b), the development of the pressure gradients in the streamwise direction is compared. Here $x_{min}$ is the $x$ coordinate of the first point in the database; $\delta _{av}$ is the average boundary layer thickness from the first to the last point in the database (Maciel et al. Reference Maciel, Wei, Gungor and Simens2018). The non-equilibrium databases with different deceleration rates are used to verify the results. Figures 1(c) and 1(d) show the pressure gradient parameters derived from different length and velocity scales. The $\beta$ continues to increase due to the decrease in $u_{\tau }$, while the $\beta _{zs}$ reflects the changes in the pressure gradient well. In the proximity of flow separation, the APG does not reach a local maximum but rather remains relatively small (Alving & Fernholz Reference Alving and Fernholz1996), and this gentle pressure gradient persists until flow reattachment. This observation suggests a tendency for the flow to be in equilibrium prior to separation (Castillo, Wang & George Reference Castillo, Wang and George2004; Dróżdż & Elsner Reference Dróżdż and Elsner2017).
Figure 2 shows the development of the flow physical quantities in the streamwise direction. The $U_e/U_\infty$ steadily decreases, while the $\delta /\delta _\infty ^*$, $\delta ^*/\delta _\infty ^*$ and $\theta /\delta _\infty ^*$ continue increasing. The ${\mathrm {d} \delta }/{\mathrm {d}\kern0.7pt x}$ and $H$ from all the five databases remains almost constant, which is characteristic of a near-equilibrium flow. The $\beta$ remains constant over a considerable streamwise distance in b1 and b2. It is observed that the development of the $\beta _{zs}$ from all the five databases is very similar. The research positions correspond to those of Bobke et al. (Reference Bobke, Vinuesa, Örlü and Schlatter2017). Here $U_\infty$ is the free-stream velocity at the inlet and $\delta _\infty ^*$ is the displacement thickness of the laminar inflow. The TBL edge and the boundary layer thickness are determined by means of Vinuesa et al. (Reference Vinuesa, Bobke, Örlü and Schlatter2016).
3. Results
In non-equilibrium flows the outer region of the TBL is influenced by the upstream history effect (Knopp et al. Reference Knopp, Reuther, Novara, Schanz, Schülein, Schröder and Kähler2021). Due to the complex interaction between the APG and inertial forces, the outer region of the TBL exhibits an increasing velocity defect and an outwards shift of the peak Reynolds stress (Devenport & Lowe Reference Devenport and Lowe2022). Consequently, it becomes imperative to identify suitable quantities to characterize the non-equilibrium effects of the TBL and develop suitable scaling for a wide range of APG conditions. In near-equilibrium flow the pressure gradient parameter remains almost constant in the streamwise direction. With the constant values of $\beta$, it is possible to separate the pressure gradient from the Reynolds number effects and consider it as a certain state that can be investigated over a wide range of Reynolds numbers (Bobke et al. Reference Bobke, Vinuesa, Örlü and Schlatter2017; Pozuelo et al. Reference Pozuelo, Li, Schlatter and Vinuesa2022). In the first four subsections we present a set of consistent scaling for the outer region of the TBL. The pressure gradient parameter $\beta$ exhibits a range spanning two orders of magnitude. In the final subsection, the scaling is applied to the near-equilibrium flow. The scaled physical quantities encompass the velocity defect and each component of the Reynolds stress.
3.1. Velocity defect
The ZS scaling has been recognized as a potentially suitable scaling for a wide range of flow types (Wei & Maciel Reference Wei and Maciel2018). It is defined as
When the ZS scaling is employed as the velocity defect scaling and integrated, the area enclosed by the $x$ axis is equal to one:
This integral operation effectively averages the rapidly changing velocity distribution within the TBL. The ZS scaling presents the opportunity to derive the boundary layer thickness $\delta$ as the characteristic length scale for the outer region. Maciel et al. (Reference Maciel, Wei, Gungor and Simens2018) discussed the significance of this set of scales for APG TBLs.
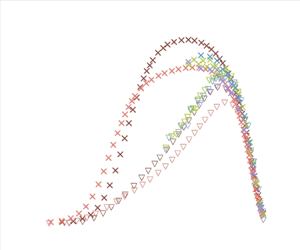
Even in APG TBLs, the ZS scaling still demonstrates potential when compared with scales such as $U_{e}$ or $u_{\tau }$. One interpretation is that the outer region of the TBL exhibits properties similar to those of free shear flow when the velocity defect gradually increases with the APG (Gungor et al. Reference Gungor, Maciel, Simens and Soria2014). Notably, the scaling for free shear flow follows the form of $U_{m}$, which is reminiscent of the original formulation of the ZS scaling proposed by Zagarola & Smits (Reference Zagarola and Smits1997) in their study of pipe flow. The blue symbols in figure 3 show the results of applying the ZS scaling to the velocity defect data. This reveals that when dealing with APG TBLs exhibiting strong non-equilibrium characteristics, ZS scaling requires further refinements. A more reasonable scaling should begin by considering the physical nature of the flow and incorporating a suitable pressure gradient parameter to refine the ZS scaling.
In the context of non-equilibrium flows, the adjusted distance of the boundary layer can be estimated using $\delta ^{*} ({\mathrm {d} P_{e} }/{\mathrm {d}\kern0.7pt x})$. This quantity compares the excess pressure exerted on the boundary layer fluid with the pressure faced by the potential flow it replaces. Dividing it into the momentum defect per unit area $\rho \theta U_{e}$, we obtain the time scale for pressure gradient adjustment (Devenport & Lowe Reference Devenport and Lowe2022). Multiplying this by $U_{e}$ converts it into a length scale:
Comparing the boundary layer thickness with this scale, we can determine the ratio of the normal diffusion of the TBL to the degree of convection in the streamwise direction influenced by the non-equilibrium effect:
This correction term should not affect the properties of the ZS scaling itself at an infinite Reynolds number. Since the ZS scaling represents an averaging process across the normal direction of the flow and is the leading term according to the asymptotic behaviour of the TBL, the correction should be a higher-order quantity compared with the ZS scaling itself at infinite Reynolds numbers. Maciel et al. (Reference Maciel, Rossignol and Lemay2006) introduced various flow scales of the classic turbulence theory. The length scale of the outer region of the TBL is denoted as
while the length scale of the potential flow outside the TBL is assumed to be
The ratio between these two scales approaches zero as $Re \to \infty$. Therefore, it is proven that the correction term approaches zero as $Re \to \infty$, where the shape factor $H$ approaches unity:
By adding this correction term to the ZS scaling, the complete scaling form for the velocity defect of non-equilibrium APG TBLs is
Equation (3.8) represents a novel scaling due to the inclusion of the second term. As the orange symbols show in figure 3, the velocity defect data collapse over a large pressure gradient range from $\beta =0$ to $\beta =28.2$. The proposed scaling is superior to the original ZS scaling in the range of approximately $y/\delta =0.2$ to $y/\delta =0.6$. To quantify the improvement, we integrate the scaled velocity defect again:
The area enclosed by the $x$ axis is no longer one. Figure 4 shows that the correction term $H({\delta }/{\rho U_{e}^{2}}) ({\mathrm {d} P_{e}}/{\mathrm {d}\kern0.7pt x})$ gradually increases as the flow approaches separation. It finally tends to 0.1, which means that the additional term we have added to the ZS scaling is about 10 % of the original scaling. Bobke et al. (Reference Bobke, Vinuesa, Örlü and Schlatter2017) discovered that even with the same pressure gradient parameter and Reynolds number, the mean velocity profile and Reynolds stress differed due to the distinct development of upstream flow. History effects are crucial for non-equilibrium flows. Although this correction term may not seem large, it includes the ratio of normal diffusion to streamwise convection, which gradually increases as the flow approaches separation, reflecting the different degrees of deceleration experienced by the boundary layer.
3.2. Reynolds shear stress $-\langle uv\rangle$
In ZPG TBL theory the Reynolds shear stress $-\langle uv\rangle$ is regarded as the cause of the velocity defect in the TBL. Consequently, $u_{\tau }$ is employed to scale both the velocity defect and the Reynolds shear stress. Scaling $-\langle uv\rangle$ by $u_{\tau }^{2}$, its profile appears to plateau close to unity as the Reynolds number increases, corresponding to the logarithmic region in the mean velocity profile. This indicates that the dominant force is no longer viscous in the outer region of the TBL. However, Romero et al. (Reference Romero, Zimmerman, Philip, White and Klewicki2022b) found that even a small APG can cause $-\langle uv\rangle ^+$ to exceed unity, where $-\langle uv\rangle ^+$ denotes non-dimensional using inner scales. This can be proven by applying the maximum theorem to the integrated mean momentum balance (MMB) equation. Appendix A provides an explicit proof. As the flow separation position is approached, $u_{\tau }$ gradually tends to zero. Using $u_{\tau }$ as the velocity scale can lead to the erroneous outcome of an excessively large non-dimensional Reynolds shear stress. In reality, the magnitude of the Reynolds shear stress remains similar until flow separation occurs, but its distribution changes, resulting in an outwards shift of the peak value. The detailed information provided by the MMB analysis is presented in the subsequent section.
To develop an outer scaling for Reynolds shear stress suitable to a wide range of APGs, it is crucial to address the issue of false amplification of Reynolds stress while ensuring consistency with the velocity defect scaling. One approach is to build upon the successful implementation of the ZS scaling for velocity defect. As the flow approaches separation, the ZS scaling maintains a finite value. The specific scaling form for Reynolds shear stress originates from the mixing-length hypothesis, resulting in the scaling form of $-\langle uv\rangle$ as $u_{\tau }^{2}$ under ZPG conditions. However, in APG TBLs there is no theoretical foundation supporting the continued use of this squared form. Numerous studies have demonstrated that various squared velocity scales do not accurately scale the Reynolds shear stress profile (Maciel et al. Reference Maciel, Wei, Gungor and Simens2018). As shown in figure 5, each component of the Reynolds stress and turbulent kinetic energy utilizing the $U_{zs}^{2}$ scaling shows no similarity. To apply the ZS scaling to Reynolds shear stress, a new theoretical analysis should be carried out.
The linearized outer region equation for TBLs proposed by Tennekes & Lumley (Reference Tennekes and Lumley1972) offers valuable insights for further study:
This equation highlights the significant relationship between the Reynolds shear stress and velocity defect. We find that the combination of $U_e$ and $U_e-U$ appears in each term on the left-hand side of the equation, while the $-\langle uv\rangle$ appears on the other side. When considering non-dimensional scaling for Reynolds stress, an apparent consideration is employing the form $U_{e}U_{o}$, where $U_{o}$ is the scaling of the velocity defect in the TBL outer region. Here $U_{e}U_{o}$ can be interpreted as a mixed scaling that includes the influence of large-scale motion, which is enhanced in the outer region. Therefore, the complete scaling form for the velocity defect of the non-equilibrium APG TBL is
An examination of the scaling at infinite Reynolds numbers reveals that the ratio of the scaling to $U_{e}^{2}$ approaches zero as $Re \to \infty$ (Maciel et al. Reference Maciel, Rossignol and Lemay2006):
As shown in figure 6, the Reynolds shear stress data collapse after scaling. The starting position of data collapse is approximately $y/\delta =0.45$, which is outside the position where the velocity defect data collapse. This is because (3.10) provides an approximate description of the outer region of the TBL and holds closer to the TBL edge. Simultaneously, it can be observed that with an increased pressure gradient, the peak value of the non-dimensional Reynolds shear stress profile shifts towards the region of collapse. This indicates that even as the flow approaches separation and the velocity profile of the TBL becomes distorted, the mixed scaling still reflects the similarity of the profile beyond the peak value of Reynolds shear stress. The scaling itself gradually increases as the flow approaches separation but remains finite.
3.3. Reynolds normal stress $\langle uu\rangle$
The scaling of $\langle uu\rangle$ under APG conditions poses a significant matter to consider. Dróżdż et al. (Reference Dróżdż, Elsner, Niegodajew, Vinuesa, Örlü and Schlatter2020) employed the shape factor as the scaling of the root mean square of $\langle uu\rangle$. As shown in figure 7(a), the peak position of the $\langle uu\rangle$ profile aligns with that of $-\langle uv\rangle$. This raises the question of whether the $-\langle uv\rangle$ scaling presented in this study can be directly used for the $\langle uu\rangle$ scaling. The differences in profile shape indicate that the suitable scaling for $-\langle uv\rangle$ cannot be directly applied to $\langle uu\rangle$. The connection between $\langle uu\rangle$ and $-\langle uv\rangle$ is because $-\langle uv\rangle$ is a component of the generation term for $\langle uu\rangle$. However, as shown in figure 7(b), the generation term involving $-\langle uv\rangle$ does not exhibit significant variations in the outer region under APG conditions. Figure 7(c) shows that the complete generation term is consistent with the peak position of $\langle uu\rangle$ and highlights the importance of ${\mathrm {d} U}/{\mathrm {d}\kern0.7pt x}$ in the APG TBL. This analysis serves as a reminder that a suitable scaling for $\langle uu \rangle$ must consider the complete $\langle uu\rangle$ transport equation. A reasonable approach would be to subtract a term from the $-\langle uv\rangle$ scaling that represents the dissipation effect in the outer region.
Wei (Reference Wei2020) conducted a study on the scaling of turbulent kinetic energy and dissipation in turbulent wall-bounded flows, proposing mixed scaling for dissipation. Another mixed scaling $U_{e}u_{\tau }$ is used to scale the $\langle uu\rangle$ profile in the inner region of the TBL (De Graaff & Eaton Reference De Graaff and Eaton2000; Aubertine & Eaton Reference Aubertine and Eaton2005; Volino Reference Volino2020; Smits et al. Reference Smits, Hultmark, Lee, Pirozzoli and Wu2021). De Graaff & Eaton (Reference De Graaff and Eaton2000) suggested that mixed scaling may be attributed to the energy balance within the TBL. The total power dissipated by the TBL scales with $U_{e}\tau _{w}$, which is proportional to $U_{e}u_{\tau }^{2}$. Hence, the total rate of energy dissipation by turbulence depends on both $U_{e}$ and $u_{\tau }$. Alving & Fernholz (Reference Alving and Fernholz1996) found decreased dissipation around the separation bubble. This aligns with the ZPG results presented by Robinson (Reference Robinson1991), indicating that dissipation results from stretching due to mean shear. Driver (Reference Driver1991) also arrived at a similar conclusion. Maciel et al. (Reference Maciel, Rossignol and Lemay2006) further highlighted that pressure and turbulent transport no longer play a significant dynamic role during the approach to separation.
One characteristic of APG TBL is the thickening of the TBL due to APG effects (Tennekes & Lumley Reference Tennekes and Lumley1972). This contributes to an increase in the displacement thickness $\delta ^*$, representing the viscous effect, and the momentum thickness $\theta$, signifying momentum loss. The shape factor $H$, which represents the ratio of these two quantities, effectively describes the history effects of the TBL, illustrating the continuous impact of upstream APG accumulation on the velocity profile. It is noteworthy that the pressure gradient itself becomes small as the flow approaches separation. However, the velocity defect $U_{e}-U$ influenced by the pressure gradient becomes significant. To account for the effect of upstream APG accumulation on the TBL, the APG correction term of the ZS scaling is considered to be multiplied by $H$, serving as an amplification factor. The final scaling form applicable to $\langle uu\rangle$ is
An examination of the $\langle uu\rangle$ scaling at an infinite Reynolds number reveals that its ratio to $U_{e}^{2}$ approaches zero:
As shown in figure 8, the maximum correction term $HU_{e}u_{\tau }$ can be up to one third of the $-\langle uv\rangle _{zs\_apg}$. Figure 7 shows the changes in the Reynolds normal stress profile, demonstrating that as the flow approaches separation, the various components of the Reynolds stress tend to exhibit similar shapes, with $\langle uu\rangle$ tending to display a single outer peak. Since $u_\tau$ tends to zero, the correction term $HU_{e}u_{\tau }$ tends to zero. The scaling form of $\langle uu\rangle$ tends to align with that of $-\langle uv\rangle$, indicating the applicability of the given scaling over a relatively wide range of pressure gradients.
As shown in figure 9, the scaled data of $\langle uu\rangle$ collapses in the outer region and bears a resemblance to $-\langle uv\rangle$. The starting position of the collapse is approximately $y/\delta =0.45$. As the flow approaches separation, the peak position gradually shifts outwards onto the collapsed curve. The growth of the outer peak of $\langle uu\rangle$ is considered to be a consequence of the intensified large-scale motion in the outer region under APG conditions. The attached-eddy hypothesis (Townsend Reference Townsend1976) has gained increased attention (Marusic & Monty Reference Marusic and Monty2019), with the logarithmic form of the outer region $\langle uu\rangle$ profile serving as one of its predictions. The scaled $\langle uu\rangle$ profile forms the foundation for quantifying the contribution of attached eddies. Perry & Marušić (Reference Perry and Marušić1995) classified the eddies current in APG TBLs into three types: type A, type B and type C. Yoon et al. (Reference Yoon, Hwang, Yang and Sung2020) conducted further research under APG conditions and found that type A eddies exhibit geometric self-similarity in the APG and ZPG TBLs and are universal structures in wall turbulence. Their main energy-containing motions are in the logarithmic region and do not contribute to the outer peak of the $\langle uu\rangle$. Type B eddies are characterized by the thickness of the boundary layer and are enhanced by the APG. They contribute mainly to the outer peak of the $\langle uu\rangle$. Type C eddies are associated with small-scale motions. Future research is expected to utilize DNS data to verify the relevance of scaling to type B and C eddies under APG conditions. This will facilitate a more precise quantification of the APG effects on large-scale motions in a TBL.
3.4. Other Reynolds stress components and turbulent kinetic energy $k$
Given the strong correlation observed between Reynolds stress components in the TBL, it is natural to extend the application of the successful scaling of $-\langle uv\rangle$ and $\langle uu\rangle$ to other Reynolds stress components. This concept of consistent scaling among Reynolds stress components can be found in Townsend's attached-eddy hypothesis. The variation in the number of peaks and the scales employed in the Reynolds stress profiles elucidate their distinct physical properties. Inactive components such as the Reynolds normal stress $\langle ww\rangle$ and $\langle uu\rangle$ use the same scaling, whereas active components such as $\langle vv\rangle$ and $-\langle uv\rangle$ also use the same scaling (Volino Reference Volino2020):
The turbulent kinetic energy $k$ is primarily governed by $\langle uu\rangle$ and exhibits the same scaling behaviour, yielding desirable results in the outer region. Figure 10 shows that the consistent scaling effectively collapses the data of each component of the Reynolds stress. We introduce a correction term (3.4) for the ZS scaling to construct a novel scaling (3.8), and then extend it to (3.11), (3.13), (3.15) and (3.16). Consequently, consistent outer scaling from the velocity defect to each Reynolds stress component in the APG TBL has been accomplished.
3.5. Apply to near-equilibrium flow
In the first four subsections we described in detail the application of the proposed scaling in the non-equilibrium flow where the pressure gradient parameter $\beta$ spans two orders of magnitude. In this subsection we apply the scaling to the near-equilibrium flow.
Near-equilibrium flow is considered to characterize the Reynolds number effects on the pressure gradient. Bobke et al. (Reference Bobke, Vinuesa, Örlü and Schlatter2017) and Pozuelo et al. (Reference Pozuelo, Li, Schlatter and Vinuesa2022) have provided comprehensive analyses of near-equilibrium flow, investigating the applicability of different scaling, including the ZS scaling. The ZS scaling is selected again for comparison in this subsection. As shown in figure 11, the profiles of different streamwise stations within the same database do not collapse under the inlet scaling. However, an interesting observation emerges as the databases with different virtual origins and power-law exponents collapse in similar streamwise positions. As shown in figure 12, when the ZS scaling is applied, the velocity defect almost collapses into a line. As shown in figure 13, the proposed new scaling outperforms the ZS scaling in the outer region of TBLs. The most substantial improvement is observed in the m18 database marked in purple, which has a higher pressure gradient parameter $\beta$ compared with the others. The proposed new scaling effectively collapses the velocity defect and also shows potential for collapsing other Reynolds stress components above $y/\delta =0.7$. However, its effectiveness is not as pronounced as for the non-equilibrium databases. We attribute this to the fact that the proposed new scaling is primarily influenced by the response distance of TBLs to non-equilibrium conditions. For near-equilibrium flow, the dominant change in the streamwise direction is Reynolds numbers. Therefore, the proposed new scaling is more suitable for the cases with pressure gradient changes, which significantly improves the performance of the m18 database.
4. Discussion
By analysing the relationship between the velocity defect and Reynolds stress in the APG TBL, a set of consistent scaling for these physical quantities is derived. To gain a better understanding of the variations in these quantities within the TBL while under the influence of the APG, this discussion focuses on the momentum and energy perspectives. It should be noted that the physical quantities presented in this section are non-dimensional with respect to the free-stream value at the inlet.
4.1. Momentum perspective
The initial objective of this study is to establish a set of consistent scaling suitable for the outer regions of APG TBLs, building upon existing theoretical research on APG TBLs. During the establishment of the Reynolds shear stress scaling, it is observed that the peak value of Reynolds shear stress shifted outwards. Existing research suggests that this position is close to the displacement thickness (Kitsios et al. Reference Kitsios, Sekimoto, Atkinson, Sillero, Borrell, Gungor, Jiménez and Soria2017; Maciel et al. Reference Maciel, Wei, Gungor and Simens2018; Vila et al. Reference Vila, Vinuesa, Discetti, Ianiro, Schlatter and Örlü2020). Lighthill (Reference Lighthill1958) extensively deliberated on the physical significance of the displacement thickness, considering it to be indicative of vorticity redistribution. We also note the importance of the peak of the Reynolds shear stress $-\langle uv\rangle$ and its position in the scaling proposed by Wei & Knopp (Reference Wei and Knopp2023). They emphasized the connection between the proposed scaling and the ZS scaling.
To provide a more detailed explanation of this phenomenon, it is necessary to investigate the reasons for the variation in the peak position of the Reynolds shear stress with APG. Due to the complex interaction between the Reynolds shear stress and mean flow, a pivotal aspect involves analysing the disparity between their interaction modes in the APG TBL and ZPG TBL. The MMB equation serves as a powerful tool to accomplish this task. By examining changes in the magnitude of each element of the momentum equation at various positions in the normal direction of the TBL, a coherent understanding of the TBL can be gained from the perspective of momentum transport. This approach also facilitates the extension to the mean energy balance, supporting a rational comprehension of the APG TBL from an energy transport perspective.
The MMB can be understood as the distribution of the TBL equation's solution in the normal direction, given the specific boundary conditions outlined in table 2. Assume a nearly constant passage of the APG through the normal direction of the TBL and ignore terms containing the Reynolds normal stress in the MMB equation. These are valid except in the vicinity of flow separation positions (Devenport & Lowe Reference Devenport and Lowe2022). Here MI is the mean inertia term, PG is the pressure gradient term, TI is the turbulent inertia term and VF is the viscous stress term:
Figure 14 shows that the MI term at position 1 exhibits relatively small values, whereas the VF, PG and TI terms are balanced. The shape of the TI term closely resembles the VF term. At position 2, the VF term becomes subdominant, resulting in the appearance of a logarithmic region in the ZPG TBL. Position 3 corresponds to the peak Reynolds shear stress $-\langle uv\rangle$ and the TI term crossing zero. Position 4 aligns with the peak of the MI term, which corresponds to the negative peak of the TI term. Based on these observations, a comprehensive analysis of the variations in the MMB under the influence of the APG is conducted.
At the TBL edge and the wall, both $-\langle uv\rangle$ and its derivative become zero, indicating the presence of at least one peak of $-\langle uv\rangle$. This peak occurs at position 3, where the TI term crosses zero. At this position, only the MI and PG terms attain balance. Subsequently, as $-\langle uv\rangle$ decreases and the TI term becomes negative, the MI term increases. Eventually, the TI term must become zero, resulting in the appearance of a new extreme point in the TI term profile at position 4, where the MI term also increases to reach its extreme value. Beyond this extreme point, as the TI term diminishes to zero, the MI and PG terms eventually achieve balance at the boundary layer edge. Close to the wall, the PG term is balanced by the VF term.
This finding outlines the momentum exchange within the APG TBL from the outer to the inner region. The MI term balances the PG term in the outer region, facilitating the generation of Reynolds stress that drives the momentum exchange within the TBL. The responsibility of balancing the PG term near the wall transfers to the VF term. The TI term can be understood as an energy sink extracting energy from the mean flow in the outer region, while the inner region acts as an energy source that resists the influence of the APG (Romero et al. Reference Romero, Zimmerman, Philip, White and Klewicki2022b). Based on the aforementioned analysis, it is evident that different positions within the TBL are influenced differently by APG effects. In the non-equilibrium APG TBL, the inner region tends to adapt to local flow conditions, while the outer region demonstrates non-equilibrium effects. This occurs as the APG intensifies the interaction between MI and TI terms in the outer region of the TBLs. The scaling of $-\langle uv\rangle$ proposed in this study is suitable for the TBL outer region after TI crosses zero and provides a basis for further quantitative analysis of the complex interactions of the outer region.
The above analysis provides an analysis of the momentum exchange process at different normal positions of the TBL. The following is an MMB analysis of the effect of PG changes on the position of the TI crossing zero to explain the continuous outwards shift of the peak position of the Reynolds shear stress with the enhancement of the APG effects. This makes the proposed scaling applicable to a wider range of APGs. Figure 15(a) shows that under ZPG conditions, when the TI term crosses zero, only the VF term is capable of balancing the MI term. In the case of a high Reynolds number, the VF term solely influences the region close to the wall. To achieve momentum balance at the position of TI crossing zero, the peak of the Reynolds shear stress $-\langle uv\rangle$ in the ZPG TBL occurs in proximity to the wall rather than in the outer region observed under APG conditions. Additionally, the MI term from this position to the wall is negligible, and the trend of the TI term aligns with that of the VF term. Following a rapid decay of the VF term, the $-\langle uv\rangle$ obtained through TI integration has a sufficiently long normal distance to diminish towards zero in the outer region. This makes the peak value of the TI term in the outer region very small. Consequently, the MI term, which balances the TI term in the outer region, does not develop throughout the entire TBL.
In the presence of the APG within the TBL, after the inevitable decay of the VF term to zero, the MI term alone is insufficient to balance the PG term, necessitating the contribution of the TI term. This makes the position where TI crosses zero shift outwards, separating from the point where the VF term loses its leading order. Here $-\langle uv\rangle$ begins to decrease after reaching its peak at the TI crossing the zero position, while the TI term takes negative values. At this stage, the MI term must balance the TI and PG terms, resulting in its continued increase and the presence of larger MI terms in the APG TBL. Thus, in the APG TBL there is no distinct separation between the viscous and inertial regions as in the ZPG TBL, and the influence of the MI term extends into the inner region of the TBL. Unlike the ZPG condition, the TBL does not exhibit a distinct process of the VF term exchanging dominance with the MI term. In the APG TBL the logarithmic region transforms into a state of scale superposition instead of scale separation.
As the flow separation position approaches, the APG itself decreases, but the distortion of the velocity profile continues to increase. This corresponds to a downward trend in the pressure gradient $({Y}/{\rho U_\infty ^2}) ({\mathrm {d} P_e}/{\mathrm {d}\kern0.7pt x})$ and $\beta _{zs}$ in figure 1(c), while the $\beta$ is still increasing. Figure 15(b) shows that the absolute value of the peak VF term decreases in the inner region of the TBL. This occurs because the VF term at the wall is equal to the PG term, while the integral over the entire TBL is $-u_{\tau }^{2}$:
As the flow approaches separation and $u_{\tau }$ approaches zero, the area enclosed by the VF term and the $x$ axis gradually approaches positive and negative cancellation. The decrease in the VF term leads to a reduction in the TI term within the inner region, while the MI term also decreases due to the deceleration of flow. This results in a slow decay of the TI term and continuous outwards shifting of the position where TI crosses zero. Additionally, above the logarithmic region of the mean velocity profile, a half-power-law region with a larger velocity gradient appears.
The Reynolds number influences this phenomenon by strengthening the impact of inertial forces. From the previous analysis, it is evident that as the VF term approaches zero and the MI term remains weak, the TI term must increase further. Consequently, by increasing the MI term relative to its previous value, the position where TI crosses zero can shift inwards. This phenomenon can be observed in figure 16(a). However, as shown in figure 16(b), when the pressure gradient parameter $\beta$ remains approximately unchanged in the near-equilibrium flow, the position of the TI crossing zero remains almost unchanged. This means that the peak positions of the Reynolds shear stress $-\langle uv\rangle$ at different streamwise stations remain almost unchanged. Figures 16(c) and 16(d) show the partial enlargement of TI crossing zero in figures 16(a) and 16(b). Kitsios et al. (Reference Kitsios, Sekimoto, Atkinson, Sillero, Borrell, Gungor, Jiménez and Soria2017) showed that in the near-equilibrium flow with a constant $\beta$, the peak position of the $-\langle uv\rangle$ can be scaled by the displacement thickness $\delta ^*$. Figure 2 shows that the ratio of the displacement thickness $\delta ^*$ to the boundary layer thickness $\delta$ remains almost constant in the near-equilibrium flow. Pozuelo et al. (Reference Pozuelo, Li, Schlatter and Vinuesa2022) showed that in the near-equilibrium flow with a constant $\beta$, the outer peak position of the Reynolds normal stress $\langle uu\rangle$ can be scaled by the $\delta ^*$. And the outer peak position scaled by the $\delta$ changes slightly with the Reynolds number. Figure 11 shows that the outer peak position of the $\langle uu\rangle$ is close to that of the $-\langle uv\rangle$. This means that although $\delta ^*/\delta \to 0$ as $Re \to \infty$, the peak position of the $-\langle uv\rangle$ can be approximately measured by the $\delta$ in the near-equilibrium flow within the current Reynolds number range.
In summary, as the flow gradually approaches the separation position, the APG effect gradually strengthens, and the peak position of Reynolds shear stress $-\langle uv\rangle$ gradually shifts outwards. The scaling provided by this study can accurately reflect this phenomenon.
Notably, the hierarchical scaling analysis method introduced by Fife et al. (Reference Fife, Wei, Klewicki and McMurtry2005) is closely connected to the analysis of the MMB. The hierarchical scaling approach aims to normalize the PG term when three terms in the momentum equation reach the same order of magnitude near the position TI term crossing zero. This normalization assists in rescaling the momentum equation. Hierarchical scaling has gradually been applied to the channel flow, favourable pressure gradient TBL, pipe flow and ZPG TBL. However, applying this method to the APG, particularly in a strong APG TBL, presents challenges in selecting a suitable position to achieve balance among the four terms in the MMB equation. This is due to the significant separation between the position where the TI term crosses zero and the VF term loses its dominance. Romero et al. (Reference Romero, Zimmerman, Philip, White and Klewicki2022b) examined the hierarchical scaling of the TBL under weak APG conditions. Further research is expected to explore whether suitable approaches can extend hierarchical scaling analysis to a strong APG TBL.
4.2. Energy perspective
In the previous subsection the $-\langle uv\rangle _{zs\_apg}$ scaling using the peak shift characteristic of the Reynolds shear stress is analysed from the momentum perspective. In the process of extending the scaling to the Reynolds normal stress $\langle uu\rangle$, an energy analysis is performed and $\langle uu\rangle _{zs\_apg}$ scaling with an additional term is proposed, which is consistent with the form of the $-\langle uv\rangle _{zs\_apg}$ scaling. The $\langle uu\rangle _{zs\_apg}$ scaling is also applicable to turbulent kinetic energy $k$. Therefore, it is necessary to discuss in detail the relationship between the Reynolds shear stress $-\langle uv\rangle$ and the turbulent kinetic energy $k$ in APG TBLs, as well as the role of the main contribution terms in the turbulent kinetic energy transport equation. These help clarify the role of consistency scaling.
The Townsend structural parameters $a_1=-\langle uv\rangle /k$ (Townsend Reference Townsend1961) act as limiters to enhance the nonlinear effects of the turbulence model and improve its computational efficiency for the APG and separated flow. However, the $a_1$ proposal is based on the dimensional analysis of ZPG equilibrium turbulence, which does not maintain a calibration value of 0.31 under APG conditions but instead decreases (Aubertine & Eaton Reference Aubertine and Eaton2005). Figure 17 shows the value of $a_1$, which signifies the efficiency of energy extraction from the mean flow. Gungor et al. (Reference Gungor, Maciel, Simens and Soria2016) also discovered that the efficiency of the large velocity defect TBL in extracting turbulent energy from the mean flow is generally lower compared with the ZPG TBL. The decrease in $a_1$ primarily results from the increase in turbulent kinetic energy. This again shows that as the APG changes, the ratio of $-\langle uv\rangle$ to $\langle uu\rangle$ changes, and the same scaling cannot be used. Furthermore, an analysis of the premultiplied turbulent kinetic energy generation term $P_k=-\langle u_iu_j\rangle ({\partial \langle U_i\rangle }/{\partial x_j})$ and dissipation term $-\epsilon _k=-\nu \langle ({\partial u_i}/{\partial x_j}) ({\partial u_i}/{\partial x_j}) \rangle$ in figure 18 reveals how turbulent kinetic energy is affected by the APG. The relatively mild APG effects reduce the contributions of both generation and dissipation terms to the overall TBL. With increasing APG effects, the primary contributions of both generation and dissipation tend to concentrate outwards. This is consistent with the appearance of the outer peak of the Reynolds normal stress. This study conducted a reasonable scaling for the Reynolds normal stress.
5. Conclusions
The APG TBL exhibits several changes compared with the ZPG TBL, including an increased velocity defect, an outwards shift of the peak Reynolds shear stress and an appearance of the outer peak of the Reynolds normal stress. Exploring suitable scaling based on these characteristics for a non-equilibrium TBL, where the APG varies in the streamwise direction and eventually leads to flow separation, is crucial for further quantitative research on these issues.
In this study, non-equilibrium and near-equilibrium APG TBLs are investigated using ten databases that include experiments and numerical simulation. The pressure gradient parameter $\beta$ spans two orders of magnitude. By considering the TBL response distance to non-equilibrium conditions, the ZS scaling extension form for scaling the velocity defect $U_{e}-U$ under APG conditions is derived. From an asymptotic perspective, it is confirmed that the original form of the ZS scaling is recovered at an infinite Reynolds number, aligning with the classic two-layer framework of TBLs. Moreover, by linearizing the outer region equation of the TBL and based on the relationship between the velocity defect and Reynolds shear stress, the scaling is extended to Reynolds shear stress $-\langle uv\rangle$. The peak positions of the Reynolds shear stress $-\langle uv\rangle$ and Reynolds normal stress $\langle uu\rangle$ are consistent and approximately equal to the displacement thickness. In terms of energy transport, the relationship between the $\langle uu\rangle$ peak and $-\langle uv\rangle$ is analysed, and the scaling is extended to $\langle uu\rangle$ by subtracting a term from the $-\langle uv\rangle$ scaling. The Reynolds stress scaling satisfies the asymptotic property at an infinite Reynolds number. Finally, inspired by the Townsend attached-eddy hypothesis, the scaling is extended to encompass other Reynolds stress components and turbulent kinetic energy, resulting in data collapses in the outer region of the TBL. Figures 3, 6, 9, 10 and 13 show consistent scaling from velocity defects to each Reynolds stress component for non-equilibrium and near-equilibrium APG TBLs.
To further investigate the changes in physical quantities within an APG TBL, assessments are conducted from the perspectives of momentum and energy. The MMB equation provides a detailed analysis of the change process of Reynolds stress and other terms in the momentum equation influenced by the APG, as shown in figure 15. The shift of the $-\langle uv\rangle$ peak to the outer region under APG conditions is attributed to the insufficient inertia term near the inner region to balance the APG. The ratio of $-\langle uv\rangle$ to turbulent kinetic energy $k$ decreases. From a global perspective, the energy change process in the APG TBL is observed by premultiplying the turbulent energy term. As the APG effects strengthen, the contribution of the turbulent kinetic energy generation and dissipation terms to the entire TBL initially decreases and then concentrates outwards. The aforementioned study highlights the distinct effects of the APG on different normal positions of the TBL. The outer and inner regions of the TBL interact with each other and possess relatively independent properties under the influence of the APG.
This study primarily focuses on the outer region of the APG TBL, and further research is needed to address two key issues. First, it is necessary to investigate whether a consistent scaling can be applied to the inner region of a TBL under APG conditions. The scaling of the inner peak in $\langle uu\rangle$ under ZPG conditions, as discussed by Chen & Sreenivasan (Reference Chen and Sreenivasan2021) using the finite dissipation law, has received considerable attention. Extending this scaling to APG conditions requires considering the impact of the inertial term infiltrating the inner layer, as described in the previous analysis. This is important because the inner region $-\langle uv\rangle$ plays a crucial role in the generation of $\langle uu\rangle$. Second, it is essential to examine the relationship between the peak values of the Reynolds stress components and the Reynolds number and pressure gradient parameters, as well as quantify their correlation with the large-scale motion within the TBL. The scaling proposed in this study is just the initial step in quantitative research on APG TBLs. In comparison to ZPG TBLs, which have more comprehensive theory and modelling, it is expected that quantitative research on APG TBLs will be conducted over a wider range of Reynolds numbers.
Acknowledgements
We would like to express our gratitude to Dr Wei, Dr Vinuesa and Dr Kitsios for sharing the data.
Funding
This study is supported by grants from the National Natural Science Foundation of China (grant no. 92252201 and 11721202).
Declaration of interests
The authors report no conflict of interest.
Appendix A. Proof of the maximum value of $-\langle uv\rangle ^+ > 1$ under APG conditions
The non-dimensional MMB equation using inner scales is
Integrating (A1) from $y^+ = 0$ to $y^{*+}$, where $y^{*+}$ is the position of the maximum value of $-\langle uv\rangle ^+$:
As shown in figure 14, the $-U^+({\partial U^+}/{\partial x^+})-V^+({\partial U^+}/{\partial y^+})$ term is an increasing function from $y^+ = 0$ to $y^{*+}$ and reaches its maximum value $(\nu /{\rho u_\tau ^3})({\mathrm {d}P_e}/{\mathrm {d}\kern0.7pt x})$ in this interval at $y^{*+}$. Using the maximum value theorem, we obtain
Note that the ${\partial U^{*+}}/{\partial y^{*+}}$ value at $y^{*+}$ can be ignored; therefore, the maximum value of $-\langle uv\rangle ^+ > 1$ under APG conditions is