Hostname: page-component-745bb68f8f-s22k5 Total loading time: 0 Render date: 2025-01-14T04:30:04.887Z Has data issue: false hasContentIssue false

The effect of flight on a turbulent jet: coherent structure eduction and resolvent analysis

Published online by Cambridge University Press:  19 April 2024

Igor A. Maia*
Affiliation:
Divisão de Engenharia Aeronáutica, Instituto Tecnológico de Aeronáutica, São José dos Campos, 12228-900, Brazil
Liam Heidt
Affiliation:
Division of Mechanical and Civil Engineering, California Institute of Technology, Pasadena, CA 91101, USA
Ethan Pickering
Affiliation:
Department of Mechanical Engineering, Massachusetts Institute of Technology, Cambridge, MA 02138, USA
Tim Colonius
Affiliation:
Division of Mechanical and Civil Engineering, California Institute of Technology, Pasadena, CA 91101, USA
Peter Jordan
Affiliation:
Département Fluides, Thermique, Combustion, Institut Pprime, CNRS - Université de Poitiers - ENSMA, 86360 Chasseneuil-du-Poitou, France
Guillaume A. Brès
Affiliation:
Cascade R&D, Cadence Design Systems, San Jose, CA 95134, USA
*
Email address for correspondence: igoriam@ita.br

Abstract

We study coherent structures in subsonic turbulent jets subject to a flight stream. A thorough characterisation of the effects of a flight stream on the turbulent field was recently performed by Maia et al. (Phys. Rev. Fluids, vol. 8, 2023, 063902) and fluctuation energy attenuations were observed over a broad range of frequencies and azimuthal wavenumbers. The Kelvin–Helmholtz, Orr and lift-up mechanisms were all shown to be weakened by the flight stream. Here we expand upon that study and model the changes in the dynamics of jets in flight using global resolvent analysis. The resolvent model is found to correctly capture the main effects of the flight stream on the dynamics of coherent structures, which are educed from a large-eddy simulation database using spectral proper orthogonal decomposition. Three modifications of note are: the damping of low-frequency streaky/Orr structures that carry most of the fluctuation energy; a degradation of the low-rank behaviour of the jet in frequencies where modal instability mechanisms are dominant; and a rank decrease at very low Strouhal numbers. The latter effect is underpinned by larger gain separations predicted by the resolvent analysis, due to a reduction in the wavelength of associated flow structures. This leads to a clearer relative dominance of streaky structures generated by the lift-up mechanism, despite the fact that the lift-up mechanism has been weakened with respect to the static jet.

Type
JFM Papers
Copyright
© The Author(s), 2024. Published by Cambridge University Press

1. Introduction

The effect of forward flight on jet aeroacoustics has been a matter of industrial and scientific interest for decades. On the one hand, characterising and quantifying the acoustic field of jets in the presence of a flight stream is important for the certification of aircraft flyover noise (Viswanathan & Czech Reference Viswanathan and Czech2011). On the other hand, understanding how the flight stream modifies the acoustic field can help improve sound-source models (Crighton, Ffowcs & Cheeseman Reference Crighton, Ffowcs and Cheeseman1977). Numerous experimental studies have been performed in order to understand sound radiation from jets in flight (Von Glahn, Groesbeck & Goodykoontz Reference Von Glahn, Groesbeck and Goodykoontz1973; Bushel Reference Bushel1975; Cocking & Bryce Reference Cocking and Bryce1975; Packman, Ng & Paterson Reference Packman, Ng and Paterson1975; Plumbee Reference Plumbee1975; Bryce Reference Bryce1984; Viswanathan & Czech Reference Viswanathan and Czech2011). More recently, large-eddy simulation (LES) has been used to investigate the acoustics of jets with flight streams in free (Wang, Naqavi & Tucker Reference Wang, Naqavi and Tucker2017) and installed (Tyacke, Wang & Tucker Reference Tyacke, Wang and Tucker2018) configurations.

Where the turbulent jet is concerned, Tanna & Morris (Reference Tanna and Morris1977) studied the effects of forward flight on flow statistics and observed that the flight stream modifies the development of the mean flow, producing a stretching of the potential core, and a reduction of both shear-layer thickness and turbulent kinetic energy. The latter effect underpins the reduction of radiated sound pressure levels. Michalke & Hermann (Reference Michalke and Hermann1982) recognised that the mean-flow modification leads to a stabilising effect on the Kelvin–Helmholtz (KH) instability. This was recently confirmed by Soares et al. (Reference Soares, Cavalieri, Kopiev and Faranosov2020) using a stability model based on the parabolised stability equations (PSE) for different flight stream velocities. The effect of the flight stream on coherent structures is of some interest given their now recognised importance for jet dynamics and sound radiation (Jordan & Colonius Reference Jordan and Colonius2013; Cavalieri, Jordan & Lesshafft Reference Cavalieri, Jordan and Lesshafft2019). Motivated by this, Maia et al. (Reference Maia, Brès, Lesshafft and Jordan2023) performed a characterisation of the effect of a flight stream on the frequency-azimuthal wavenumber spectrum, using time-resolved particle-image velocimetry (PIV) and LES databases. The study showed that the reduction in fluctuating energy, observed in early experiments (Tanna & Morris Reference Tanna and Morris1977), is distributed over a broad region of frequency-azimuthal wavenumber space and that the attenuation of coherent structures is associated with a weakening of Orr, KH and lift-up instability mechanisms. Streaky structures with azimuthal wavenumbers in the range $1\leq m \leq 4$, that carry most of the fluctuation energy downstream of the end of the jet potential core, are the most strongly impacted by the flight stream. A locally parallel, linear mean-flow model was used to investigate whether those changes were associated with linear instability mechanisms. The use of local analysis in jets is certainly appealing, due to the weak variation of the mean flow in the streamwise direction. It has been successfully used in previous studies to understand many aspects of coherent structure dynamics, including in the jet far field, where the jet is self-similar (Kuhn, Soria & Oberleithner Reference Kuhn, Soria and Oberleithner2021).

In Maia et al. (Reference Maia, Brès, Lesshafft and Jordan2023) the local model was also found to predict the overall attenuation trend of linear mechanisms observed in the data with the flight stream. However, it displayed a few shortcomings. First of all, the shape of gain spectrum computed with resolvent analysis at a given streamwise position did not reflect the modal energy spectrum from spectral proper orthogonal decomposition (SPOD). In the initial jet region the model predicted gains that decayed monotonically for $m \geq 1$, whereas the peak energy in the SPOD energy maps occurred at higher $m$. This is a limitation of the local model that predicts the gain and shape of optimally forced structures that, from a given streamwise position, will grow downstream as they are convected with the parallel mean flow. The highest gain computed for the model is for $m = 1$. Indeed, further downstream the $m = 1$ mode does become dominant; but because the local model does not take into account the upstream amplification of higher wavenumbers, it is not equipped to provide the correct shape of the energy spectrum at that position. Secondly, studying the Orr mechanism with the local model is not straightforward, because it requires knowledge of the streamwise wavenumber, which is an input parameter to the model. But the streamwise wavenumber is unknown a priori. This was found to be particularly troublesome for the comparison of jets in static and flight conditions, because the low-frequency Orr/streaky structures suffer a change in wavenumber due to the flight stream. This leads to a third issue, which is an interesting rank decrease in jet dynamics in flight, observed at low Strouhal numbers ($St$) in the SPOD results, but that could not be explained by the local model. As will be shown later, this issue is associated with the change in wavenumber, and is found to affect the dynamics of coherent structures significantly. In this work we perform a global resolvent analysis to overcome these issues and to assess the extent to which linear mean-flow analysis can be used to explain the impact of a flight stream on the organisation of a turbulent jet.

Resolvent analysis has been widely used to model the mechanisms underpinning coherent structures observed in jets, both in locally parallel (Tissot et al. Reference Tissot, Zhang, Lajús, Cavalieri and Jordan2017; Nogueira et al. Reference Nogueira, Cavalieri, Jordan and Jaunet2019; Kuhn et al. Reference Kuhn, Soria and Oberleithner2021) and global (Garnaud et al. Reference Garnaud, Lesshafft, Schmid and Huerre2013; Jeun, Nichols & Jovanovic Reference Jeun, Nichols and Jovanovic2016; Schmidt et al. Reference Schmidt, Towne, Rigas, Colonius and Brès2018; Lesshafft et al. Reference Lesshafft, Semeraro, Jaunet, Cavalieri and Jordan2019; Pickering et al. Reference Pickering, Rigas, Schmidt, Sipp and Colonius2021) frameworks. In the case of turbulent jets, linearisation is performed about the mean flow. In ‘static’ conditions, the resolvent framework has been used to model and classify coherent structures according to the underlying growth mechanisms. Kelvin–Helmholtz wavepackets are underpinned by convective modal instability, whereas Orr-like structures arise when multiple, convectively stable modes, forced by ambient turbulence, combine linearly to produce transient growth on account of their non-normality. These structures have been characterised by the studies of Garnaud et al. (Reference Garnaud, Lesshafft, Schmid and Huerre2013), Jeun et al. (Reference Jeun, Nichols and Jovanovic2016), Tissot et al. (Reference Tissot, Zhang, Lajús, Cavalieri and Jordan2017), Schmidt et al. (Reference Schmidt, Towne, Rigas, Colonius and Brès2018) and Lesshafft et al. (Reference Lesshafft, Semeraro, Jaunet, Cavalieri and Jordan2019). More recently, resolvent analysis has revealed the existence of the lift-up mechanism in turbulent jets (Nogueira et al. Reference Nogueira, Cavalieri, Jordan and Jaunet2019; Pickering et al. Reference Pickering, Rigas, Nogueira, Cavalieri, Schmidt and Colonius2020; Wang et al. Reference Wang, Lesshafft, Cavalieri and Jordan2021). This mechanism, characterised by higher azimuthal wavenumbers than the Orr mechanism, can also be understood in the linear mean-flow framework as arising from a non-normal linear combination of forced, convectively stable modes. The cited studies thus provide an explanation for streak-like structures that have been observed in numerous previous studies (Becker & Massaro Reference Becker and Massaro1968; Browand & Laufer Reference Browand and Laufer1975; Yule Reference Yule1978; Dimotakis, Miake-Lye & Papantoniou Reference Dimotakis, Miake-Lye and Papantoniou1983; Agüí & Hesselink Reference Agüí and Hesselink1988; Jung, Gamard & George Reference Jung, Gamard and George2004).

For certain frequencies, the turbulent jet exhibits a low-rank behaviour (Schmidt et al. Reference Schmidt, Towne, Rigas, Colonius and Brès2018; Lesshafft et al. Reference Lesshafft, Semeraro, Jaunet, Cavalieri and Jordan2019), where the dynamics is largely dominated by the leading forcing and response modes. In that case, resolvent response modes are generally in good agreement with coherent structures educed from measurement or simulation data. When the dynamics is not low rank, there is no clear distinction between the leading and sub-optimal modes, and the leading response modes tend do differ substantially from empirical coherent structures. In that case, the nonlinear Reynolds stresses, treated as an endogenous forcing term in the resolvent framework, must be considered in order to achieve a complete picture of the coherent structure dynamics. But that term is experimentally inaccessible, and even in high-fidelity simulations, its eduction is a delicate task (Karban et al. Reference Karban, Martini, Jordan, Brès and Towne2022).

In an attempt to improve the agreement between resolvent response modes and observed coherent structures, many recent studies have considered eddy-viscosity models. An eddy viscosity can partially account for the nonlinear effects of turbulence that attenuate the growth of coherent structures via a gradient-diffusion-like sink mechanism. Such models have been used for a variety of flows, both in the framework of stability (Crouch, Garbaruk & Magidov Reference Crouch, Garbaruk and Magidov2007; Oberleithner, Paschereit & Wygnanski Reference Oberleithner, Paschereit and Wygnanski2014; Rukes, Paschereit & Oberleithner Reference Rukes, Paschereit and Oberleithner2016; Tammisola & Juniper Reference Tammisola and Juniper2016; Kuhn et al. Reference Kuhn, Soria and Oberleithner2021) and resolvent analysis (Hwang & Cossu Reference Hwang and Cossu2010; Morra et al. Reference Morra, Semeraro, Henningson and Cossu2019; Towne, Lozano-Durán & Yang Reference Towne, Lozano-Durán and Yang2020; Heidt et al. Reference Heidt, Colonius, Nekkanti, Schmdit, Maia and Jordan2021; Pickering et al. Reference Pickering, Rigas, Schmidt, Sipp and Colonius2021). A caveat of these models is that the modified forcing term loses its physical interpretability as the frequency-dependent Reynolds stresses and the resulting system of equations is no longer exact. However, the improved agreement between resolvent and SPOD modes that is observed when an eddy-viscosity model is used (Pickering et al. Reference Pickering, Rigas, Schmidt, Sipp and Colonius2021) makes them appealing from the point of providing a basis suitable for description of empirical coherent structures and that would allow these and the mechanisms that drive them to be better understood.

The main contribution of the present work is the study of subsonic turbulent jets in the presence of a flight stream through global resolvent analysis. We analyse how coherent structures associated with different linear mean-flow mechanisms (characterised in static conditions by the studies cited above) are modified by the flight stream. While we focus here on the effect of the flight stream on the turbulent field, the results can be used to inform sound-source models, such as those developed by Karban et al. (Reference Karban, Bugeat, Towne, Lesshafft, Agarwal and Jordan2023), Maia et al. (Reference Maia, Jordan, Cavalieri and Jaunet2019) and Cavalieri et al. (Reference Cavalieri, Jordan, Agarwal and Gervais2011). The remainder of the paper is organised as follows. In § 2 we present the numerical databases used for the study. In § 3 we describe the SPOD and resolvent frameworks used to educe and model coherent structures in the jet, respectively. In § 4 we present modal energy and amplification maps, and discuss how they are modified by the flight stream. This is followed in § 5 by a detailed analysis of coherent structures at different regions of the frequency–wavenumber plane. Finally, in § 6 we summarise the main conclusions of the study.

2. Numerical database

We explore two high-fidelity LES databases of subsonics jets at Mach number $M_j=0.9$ with and without flight streams. The simulations were performed using the compressible flow solver ‘CharLES’ (Brès et al. Reference Brès, Ham, Nichols and Lele2017), developed at Cascade Technologies, now part of Cadence Design Systems. Results for the case without the flight stream, $M_f=0$, were initially reported by Brès et al. (Reference Brès, Jordan, Jaunet, Le Rallic, Cavalieri, Towne, Lele, Colonius and Schmidt2018). The present database are extensions of that study for both $M_f = 0$ and $0.15$ with longer databases and a higher sampling frequency. All the LES feature localised adaptive mesh refinement, synthetic turbulence and wall modelling on the internal nozzle surface (and external nozzle surfaces at $M_f = 0.15$) to match the fully turbulent nozzle-exit boundary layers in the experiments. The LES methodologies, numerical set-up and comparisons with measurements are described in more details in Brès et al. (Reference Brès, Jordan, Jaunet, Le Rallic, Cavalieri, Towne, Lele, Colonius and Schmidt2018) and Maia et al. (Reference Maia, Brès, Lesshafft and Jordan2023).

The nozzle pressure ratio and nozzle temperature ratio are ${\rm NPR} = P_t/P_f = 1.7$ and ${\rm NTR} = T_t/T_f = 1.15$, respectively, and match the experimental conditions. The jet is isothermal ($T_j/T_f=1.0$) and the jet Mach number is $M_j = U_j/c = 0.9$. The subscript $_t$ refers to total conditions, $_j$ refers to jet exit conditions and $_f$ to the flight stream. For both experiment and simulation, the Reynolds number is $Re = U_j D/\nu _j \approx 1\times 10^6$, where $\nu$ is the kinematic viscosity, $U_j$ is the jet exit velocity and $D$ is the nozzle diameter, which is 50 mm. Synthetic turbulence boundary conditions are applied inside and outside the nozzle surfaces to model the boundary layer trip used in the experiments 3D upstream of the nozzle exit. Simulation parameters and LES settings are shown in table 1. To facilitate postprocessing and analysis, the LES data are interpolated from the original unstructured LES grid onto structured cylindrical grids in the jet plume and in the nozzle pipe. These structured cylindrical grids were originally designed for the grid with 16M control volumes, such that the resolution approximately corresponds to the underlying LES resolution. For both structured grids, the points are equally spaced in the azimuthal direction to enable a Fourier series decomposition in azimuth. A detailed validation of the databases was carried out by Maia et al. (Reference Maia, Brès, Lesshafft and Jordan2023) through comparisons with extensive PIV experiments.

Table 1. Operating conditions and simulation parameters of the main LES, where $t_{sim}$ is the simulation time and $\Delta t$ is the sampling period of the database recording.

3. Tools

3.1. Spectral proper orthogonal decomposition

Spectral proper orthogonal decomposition is now a widely used tool for the study of turbulent flows. It decomposes the data into an orthogonal basis ranked in terms of an energy norm, and can provide a useful basis for the description of empirical coherent structures, particularly when the leading eigenvalue is substantially larger than its subdominante counterparts.

In the framework of SPOD, given the state vector, $\boldsymbol {q}=[\rho, u_{x},u_{r}, u_{\theta }, T]^{{\rm T}}$, subject to a Reynolds decomposition,

(3.1)\begin{equation} \boldsymbol{q}(x,r,\theta,t) = \bar{\boldsymbol{q}}(x,r,\theta) + \boldsymbol{q}'(x,r,\theta,t), \end{equation}

optimal modes for a given azimuthal wavenumber and Strouhal number pair, $\boldsymbol {\varPsi }_{m,\omega }$, are obtained through eigendecomposition of the cross-spectral density (CSD) matrix, $\hat {\boldsymbol {S}}_{m,\omega }$,

(3.2)\begin{equation} \hat{\boldsymbol{S}}_{m,\omega}\boldsymbol{\mathsf{W}}\boldsymbol{\varPsi}_{m,\omega} =\boldsymbol{\varPsi}_{m,\omega}\boldsymbol{\varLambda}_{m,\omega}. \end{equation}

The CSD matrix is computed as $\hat {\boldsymbol {S}}_{m,\omega }=\hat {\boldsymbol {Q}}_{m,\omega }\hat {\boldsymbol {Q}}_{m,\omega }^{H}$, where $\hat {\boldsymbol {Q}}_{m,\omega }=[\hat {\boldsymbol {q}}_{m,\omega }^{(1)}\ \hat {\boldsymbol {q}}_{m,\omega }^{(2)} \cdots \hat {\boldsymbol {q}}_{m,\omega }^{(N_{blk})}]$ is the ensemble of $N_{blk}$ flow realisations at $(m,\omega )$, with $\hat {\boldsymbol {q}}_{m,\omega _{k}}^{(l)}$ denoting the $l$th Fourier realisation of the turbulent fluctuations, $\boldsymbol {q}'$, in time and azimuthal direction at the frequency $\omega$ and wavenumber $m$. The superscript $^{H}$ denotes Hermitian transpose.

The eigenvalues, $[\lambda _{m,\omega }^{(1)}, \lambda _{m,\omega }^{(2)} \cdots \lambda _{m,\omega }^{(nblk)}]$ corresponding to the modal energy are organised in decreasing order in the diagonal matrix $\boldsymbol {\varLambda }_{m,\omega }$. The modes so obtained are orthogonal with respect to a given inner product,

(3.3)\begin{equation} \langle \boldsymbol{q}_{1},\boldsymbol{q}_{2}\rangle =\boldsymbol{q}_{1}^{H} \boldsymbol{\mathsf{W}} \boldsymbol{q}_{2}. \end{equation}

Here we consider a weighting matrix, $\boldsymbol{\mathsf{W}}$, describing Chu's compressible energy norm (Chu Reference Chu1965),

(3.4)\begin{equation} \langle \boldsymbol{q}_{1},\boldsymbol{q}_{2}\rangle_{E}=\iiint\boldsymbol{q}_{1}^{H}\,\mathrm{diag} \left(\frac{\bar{T}}{\gamma \bar{\rho}M_{j}^2},\bar{\rho}, \bar{\rho}, \bar{\rho}, \frac{\bar{\rho}}{\gamma(\gamma-1)\bar{T}M_{j}^2} \right)\boldsymbol{q}_{2} r\,\mathrm{d}\kern0.06em x\,\mathrm{d}r \,\mathrm{d}\theta. \end{equation}

The CSDs are computed using Welch's periodogram method. The data was segmented into blocks of 512 samples with 75 % overlap, resulting in a frequency resolution of $\Delta St=0.0217$. Convergence of the SPOD modes was checked by varying the number and length of the blocks in the Welch algorithm, while keeping a suitable frequency resolution. We found that the parameters we used are sufficient to attain converged modes, including in the $St \to 0$ limit. Using larger blocks of 1024 yielded almost identical SPOD modes, although the uncertainty was larger due to the reduced number of blocks. Furthermore, we have also tried the time-shifting SPOD technique recently introduced by Blanco et al. (Reference Blanco, Martini, Sasaki and Cavalieri2022). The main idea of the technique is to align cross-correlations inside each block according to the convection velocity of the underlying flow structures. This helps improving convergence of SPOD modes by increasing the number of blocks available for a given time series, which can be useful for large datasets that usually have a limited number of snapshots. However, application of this technique to our databases did not yield any noticeable improvement on convergence, which indicates that the chosen block size and the number of blocks was already sufficient.

3.2. Resolvent analysis

Since the works of Hwang & Cossu (Reference Hwang and Cossu2010) and McKeon & Sharma (Reference McKeon and Sharma2010), resolvent analysis has been extensively used to identify optimal forcing and response mechanisms in laminar and turbulent flows and to model coherent structures. The analysis starts with the linearised Navier–Stokes equations in frequency domain, expressed in input–output form (Schmidt et al. Reference Schmidt, Towne, Rigas, Colonius and Brès2018),

(3.5) $$\begin{gather} ({\rm i}\omega\boldsymbol{\mathsf{I}}-\boldsymbol{\mathsf{A}}_m)\hat{\boldsymbol{q}}_{m,\omega} = \boldsymbol{\mathsf{B}}\hat{\boldsymbol{f}}_{m,\omega}, \end{gather}$$
(3.6)$$\begin{gather}\hat{\boldsymbol{y}}_{m,\omega} = \boldsymbol{\mathsf{C}}\hat{\boldsymbol{q}}_{m,\omega}, \end{gather}$$

where $\boldsymbol{\mathsf{A}}_m$ is the linearised Navier–Stokes operator, $\hat {\boldsymbol {q}}_{m,\omega }$ is the Fourier-transformed state vector and $\hat {\boldsymbol {f}}_{m,\omega }$ is a term representing the nonlinear Reynolds stresses, which are treated as an endogenous forcing term. The subscript $_{m,\omega }$, with $m$ the azimuthal wavenumber and $\omega$ the frequency, denotes Fourier transform in the azimuthal and time directions. Here $\hat {\boldsymbol {y}}_{m,\omega }$ defines the desired response, or output, as a function of the state; $\boldsymbol{\mathsf{I}}$ is the identity matrix and $\boldsymbol{\mathsf{B}}$ and $\boldsymbol{\mathsf{C}}$ are matrices that can be used to restrict forcing and observation to specific regions of space and/or to a limited number of forcing and response terms.

Input and output are related through

(3.7)\begin{equation} \hat{\boldsymbol{y}}_{m,\omega} = \boldsymbol{R}_{m,\omega}\,\hat{\boldsymbol{f}}_{m,\omega}, \end{equation}

where $\boldsymbol {R}_{m,\omega }$ is the resolvent operator,

(3.8)\begin{equation} \boldsymbol{R}_{m,\omega} = \boldsymbol{\mathsf{C}}({\rm i}\omega\boldsymbol{\mathsf{I}}-\boldsymbol{\mathsf{A}}_m)^{{-}1}\boldsymbol{\mathsf{B}}. \end{equation}

We then define a weighted resolvent operator, $\tilde {\boldsymbol {R}}_{m,\omega }$, by introducing Chu's compressible energy norm through the matrix $\boldsymbol{\mathsf{W}}$,

(3.9)\begin{equation} \tilde{\boldsymbol{R}}_{m,\omega} = \boldsymbol{\mathsf{W}}^{1/2}\boldsymbol{R}_{m,\omega}\boldsymbol{\mathsf{W}}^{{-}1/2}. \end{equation}

The goal of resolvent analysis is to seek an optimal forcing that maximises the norm of the associated flow response,

(3.10) \begin{equation} \sigma_1^2 = \max_{\|\,\hat{{f}}_{m,\omega}\|=1}\frac{\| \tilde{\boldsymbol{R}}_{m,\omega}\,\hat{\boldsymbol{f}}_{m,\omega} \|^{2}_{\boldsymbol{W}}}{\|\,\hat{\boldsymbol{f}}_{m,\omega} \|^{2}_{\boldsymbol{W}}}. \end{equation}

This can be achieved through singular-value decomposition of the resolvent operator,

(3.11)\begin{equation} \tilde{\boldsymbol{R}}_{m,\omega} = \boldsymbol{\mathsf{U}}\boldsymbol{\varSigma}\boldsymbol{\mathsf{V}}^{H}. \end{equation}

Forcing ($\boldsymbol {u}_{i}$) and response ($\boldsymbol {v}_{i}$) modes are defined as $\boldsymbol {v}_{i} = (\boldsymbol {W}^{-1/2})^{H}\boldsymbol {V}_{i}$ and $\boldsymbol {u}_{i} = (\boldsymbol {W}^{-1/2})^{H}\boldsymbol {U}_{i}$, with $i$ denoting the $i$th column of $\boldsymbol{\mathsf{V}}$ and $\boldsymbol{\mathsf{U}}$. The singular values associated with each forcing-response pair, $\sigma _{i}$, are arranged in descending order in the diagonal matrix $\boldsymbol {\varSigma }$. Optimal forcings and responses for each $m, \omega$ pair are then given by $\boldsymbol {v}_{i}$ and $\boldsymbol {u}_{1}$, and their associated energy gain is the square of the leading singular value, $\sigma _1^2$. As in Schmidt et al. (Reference Schmidt, Towne, Rigas, Colonius and Brès2018), the governing equations are discretised using fourth-order summation by parts finite differences (Mattsson & Nordström Reference Mattsson and Nordström2004), the polar singularity is treated as in Mohseni & Colonius (Reference Mohseni and Colonius2000), and non-reflecting boundary conditions/sponges are employed at the domain boundaries. The dominant resolvent modes are computed using randomised linear algebra methods (Martinsson Reference Martinsson2019) that allow for the efficient computation of dominant singular values/vectors.

As mentioned above, we focus on the characterisation of the flight stream effect on the turbulent field, rather than the acoustic field, as done by many previous studies (Von Glahn et al. Reference Von Glahn, Groesbeck and Goodykoontz1973; Bushel Reference Bushel1975; Cocking & Bryce Reference Cocking and Bryce1975; Packman et al. Reference Packman, Ng and Paterson1975; Plumbee Reference Plumbee1975; Morfey & Tester Reference Morfey and Tester1977; Bryce Reference Bryce1984; Viswanathan & Czech Reference Viswanathan and Czech2011). To that end, we restrict the forcing and observation fields to the hydrodynamic region via the matrices $\boldsymbol{\mathsf{B}}$ and $\boldsymbol{\mathsf{C}}$. This is done by setting the elements of those matrices to one within the jet shear layer, delimited by the region where $\bar {U}_x/\bar {U}_j \geq 0.05$, and gradually reducing them to zero for larger $r$. Here we also enforce a mask on the forcing field inside the jet potential core. The reason for this is that the jet supports trapped acoustic waves that resonate, producing a tonal dynamics in the potential core (Schmidt et al. Reference Schmidt, Towne, Colonius, Cavalieri, Jordan and Brès2017; Towne et al. Reference Towne, Cavalieri, Jordan, Colonius, Schmidt, Jaunet and Brès2017). The resonant mechanism at $M_j=0.9$ is such that the jet is marginally globally stable at certain frequencies, and the resolvent analysis thus identifies this resonance mechanism as a leading candidate for optimal growth. This mechanism is not dominant in the SPOD analysis, as we will briefly show, and therefore, we choose to mask it, so as to focus on the dominant turbulent structures. In Appendix A we briefly discuss their presence in the forcing and response modes. Regarding the fact that the trapped waves are more pronounced in the resolvent modes, Schmidt et al. (Reference Schmidt, Towne, Rigas, Colonius and Brès2018) attributes this to two factors: the first is the choice of an effective Reynolds number, which, in our case, corresponds to the choice of the eddy viscosity. In mean-flow-based resolvent models, different mechanisms respond differently to changes in Reynolds number/eddy viscosity, and the choice of these parameters might highlight one mechanism to the detriment of the other (for instance, accentuating trapped waves to the detriment of KH waves). Secondly, the resonance provides an optimal forcing mechanism in the resolvent model; but in the real flow the resonance mechanism might not be forced so efficiently, which would attenuate these waves. Analysis of the effect of nonlinear forcing on trapped waves is outside the scope of this work. We emphasise that these issues are minor in the context of the present work and, as we show in Appendix A, the suppression of these waves does not affect the analysis of the other linear instability mechanisms.

Figure 1 shows the resulting mean-flow masks applied to the forcing and response fields. The goal of the resolvent analysis is therefore to seek an optimal forcing that maximises the compressible energy norm of the associated flow response in the highlighted region.

Figure 1. Example of mean-flow masks applied to (a) the forcing and (b) the response for the static case, $M_f=0$.

3.2.1. Eddy-viscosity model

The effects of eddy viscosity on the predictive capabilities of linear analysis have been explored in a number of recent studies (Crouch et al. Reference Crouch, Garbaruk and Magidov2007; Hwang & Cossu Reference Hwang and Cossu2010; Oberleithner et al. Reference Oberleithner, Paschereit and Wygnanski2014; Rukes et al. Reference Rukes, Paschereit and Oberleithner2016; Tammisola & Juniper Reference Tammisola and Juniper2016; Schmidt et al. Reference Schmidt, Towne, Rigas, Colonius and Brès2018; Morra et al. Reference Morra, Semeraro, Henningson and Cossu2019; Kuhn et al. Reference Kuhn, Soria and Oberleithner2021; Pickering et al. Reference Pickering, Rigas, Schmidt, Sipp and Colonius2021). The study of Pickering et al. (Reference Pickering, Rigas, Schmidt, Sipp and Colonius2021) showed substantial improvements in the agreement between resolvent response modes and coherent structures educed from flow data through SPOD.

Here we adopt the mean-flow-consistent eddy-viscosity model of Pickering et al. (Reference Pickering, Rigas, Schmidt, Sipp and Colonius2021), which is useful in cases where experimental and numerical databases do not provide an eddy-viscosity field directly, as is the case with the LES database used here. The molecular viscosity, $\mu$, is replaced by the sum $\mu + \mu _T$ in the linearised equations, and a suitable spatial structure for the eddy viscosity, $\mu _T$, is determined, as described below. The resolvent operator can then be rewritten as

(3.12) \begin{equation} \boldsymbol{\mathsf{R}}_{m,\omega} = \boldsymbol{\mathsf{C}}({\rm i}\omega\boldsymbol{\mathsf{I}}-\boldsymbol{\mathsf{A}}_{m} - \boldsymbol{\mathsf{A}}_{m,T}(\mu_T) )^{{-}1}\boldsymbol{\mathsf{B}}, \end{equation}

where $\boldsymbol{\mathsf{A}}_{m,T}$ only possess terms including $\mu _T$. The reader is referred to Pickering et al. (Reference Pickering, Rigas, Schmidt, Sipp and Colonius2021) for the equations for the modified operator. The eddy-viscosity field, $\mu _T(x,r)$, is found by minimising the error by which the mean flow satisfies the zero-frequency, zero-azimuthal wavenumber linearised Navier–Stokes equations, modified with the addition of an eddy-viscosity field. The forcing term, which represents frequency-dependent Reynolds stresses, is approximated through an eddy-viscosity model, and subsequently lumped on the linear operator on the left-hand side. For $\omega =0$ and $m=0$, $\hat {\boldsymbol {q}}_{m,\omega }$ becomes the mean flow itself, $\bar {\boldsymbol {q}}$, which leads to the equation

(3.13) \begin{equation} (\boldsymbol{\mathsf{A}}+\boldsymbol{\mathsf{A}}_{\boldsymbol{\mathsf{T}}})\bar{\boldsymbol{q}}=\bar{f}, \end{equation}

where $\bar {f}$ is a residual term. Note that, if the eddy-viscosity approximation were exact, the left-hand side of (3.13) would be identically zero; but since the model is not exact, there is a residual. We then find the eddy-viscosity field through an optimisation procedure that minimises the following cost function:

(3.14)\begin{equation} \mathcal{J} ={-}\bar{f}\boldsymbol{\mathsf{W}}\bar{f}. \end{equation}

Details about the optimisation algorithm can be found in Pickering et al. (Reference Pickering, Rigas, Schmidt, Sipp and Colonius2021). The optimisation provided order-of-magnitude reductions in the residual. Figure 2 shows the mean-flow-consistent eddy-viscosity fields for the $M_f=0$ and $M_f=0.15$ jets. Their shapes are similar to those obtained previously at lower Mach number (Pickering et al. Reference Pickering, Rigas, Schmidt, Sipp and Colonius2021). Some streamwise waviness can be seen in the fields obtained for both cases. Optimisation of the entire eddy-viscosity field at once leads to a stiff problem prone to numerical errors. To alleviate this, the domain is broken into overlapping subsections, and a block-by-block optimisation is performed. This generates the observed streamwise waviness between adjacent blocks. These differences are numerical artifacts and while they could be carefully tuned and smoothed away, these improvements would only create marginal improvements to the resolvent analysis.

Figure 2. Mean-flow-consistent eddy-viscosity fields computed at zero frequency and azimuthal wavenumber for (a) the static case, $M_f=0$, and (b) the flight stream case, $M_f=0.15$.

The amplitude of the eddy-viscosity model was scaled by a constant, $\widetilde {\mu _T} = c\mu _T$. This constant is used as a frequency-independent tuning parameter that allows us to improve the alignment between resolvent and SPOD modes (Pickering et al. Reference Pickering, Rigas, Schmidt, Sipp and Colonius2021). Physically, $c$ is necessary as the eddy-viscosity field found through the mean-flow optimisation considers both large- and fine-scale fluctuations. Thus, we consider small values, 0.1–0.2, to represent only the fine-scale eddy-viscosity contribution and effect in modelling the large-scale structures. Here we found $c=0.15$ to provide the best alignment with respect to leading SPOD modes at different frequencies and azimuthal wavenumbers. The physical consistency of this value was verified through a comparison with the Boussinesq approximation, as done by Kuhn et al. (Reference Kuhn, Soria and Oberleithner2021). Using a nonlinear least square algorithm, we have computed the constant values that give the best fit of $\mu _{T}(x,r)$ to the Boussinesq eddy-viscosity field, given by

(3.15)\begin{equation} \mu_{T{_B}} ={-}\frac{\overline{u_x'u_r'}}{\mathrm{d}\bar{U}/\mathrm{d}r}. \end{equation}

This best fit was obtained for values of $c=0.16$ and $c=0.12$ in the static and flight stream cases, respectively, which are quite close to the constant value used in this study. Furthermore, the shapes of the eddy-viscosity fields of the two models were found to be in fair qualitative agreement, which further supports the consistency of the eddy-viscosity model adopted here. We emphasise, though, that the model displays limited sensitivity to the scaling constant, and similar model results can be obtained with other choices of $c$ (albeit with a reduced alignment with respect to SPOD). In Appendix B we explore resolvent analyses conducted with $c=0.10$ and $c=0.20$. Overall, the trends are similar to the results presented in §§ 4 and 5 for $c=0.15$, indicating that the main results of this study (and its main conclusions) are not restricted to a specific choice of scaling parameter. Furthermore, this constant was also found to be remarkably robust between different cases of the same jet. For instance, Heidt et al. (Reference Heidt, Colonius, Nekkanti, Schmdit, Maia and Jordan2021) showed that a constant tuned for a natural jet at $Ma=0.4$ could be used, with the same level of accuracy, when the jets are forced at different frequencies and amplitudes.

4. Modal energy and amplification maps

Leading SPOD modes reveal coherent structures, as mentioned above, that can frequently be associated with linear mean-flow mechanisms in jets (Cavalieri et al. Reference Cavalieri, Jordan and Lesshafft2019; Nogueira et al. Reference Nogueira, Cavalieri, Jordan and Jaunet2019; Pickering et al. Reference Pickering, Rigas, Nogueira, Cavalieri, Schmidt and Colonius2020). We compare the modal energy of leading SPOD modes, $\lambda _1(\omega,m)$, and the optimal resolvent gains, $\sigma _1(\omega,k)$. The association of leading SPOD modes with a given mechanism can be made according to the regions of dominance of each mechanism in frequency–wavenumber space, as characterised in previous studies (Garnaud et al. Reference Garnaud, Lesshafft, Schmid and Huerre2013; Jeun et al. Reference Jeun, Nichols and Jovanovic2016; Tissot et al. Reference Tissot, Zhang, Lajús, Cavalieri and Jordan2017; Schmidt et al. Reference Schmidt, Towne, Rigas, Colonius and Brès2018; Lesshafft et al. Reference Lesshafft, Semeraro, Jaunet, Cavalieri and Jordan2019; Nogueira et al. Reference Nogueira, Cavalieri, Jordan and Jaunet2019; Pickering et al. Reference Pickering, Rigas, Nogueira, Cavalieri, Schmidt and Colonius2020) (figure 6 roughly delimits those regions, based on the work of Pickering et al. Reference Pickering, Rigas, Nogueira, Cavalieri, Schmidt and Colonius2020).

Figure 3 shows maps of modal energy and leading resolvent gains in $St$-$m$ space for static, $M_f=0$, and flight, $M_f=0.15$, conditions. The modal energy maps reveal that most of the flow energy is in the $St \to 0$ zone of the spectrum, and is carried by streaky structures (Nogueira et al. Reference Nogueira, Cavalieri, Jordan and Jaunet2019; Pickering et al. Reference Pickering, Rigas, Nogueira, Cavalieri, Schmidt and Colonius2020). The map of the flight stream case shows a striking attenuation in that region of the spectrum, especially for azimuthal modes $m=1\unicode{x2013}4$. At higher $St$, mode $m=1$ is the most energetic, for both flow conditions. The resolvent gain spectrum is similar to the SPOD modal energy maps. The regions of high SPOD energy correspond, to a great extent, to the zones of maximum amplification predicted by the resolvent model. Modes $m=1\unicode{x2013}4$ possess the largest amplification rates in the $M_f=0$ case and are those most impacted by the flight stream, in agreement with what is observed in the flow data. This is a first indication that the resolvent analysis correctly captures the leading-order effect of flight on the turbulent kinetic energy. A slight discrepancy exists for the axisymmetric mode, for which the resolvent model predicts large gains in the range $0.4 \leq St \leq 0.8$, which is not mirrored in the SPOD energy maps. This large-gain region highlights the signature of KH wavepackets, and this discrepancy is partly due to the fact that the KH mechanism is dominant in the initial region (first 5–6 jet diameters), where the jet is convectively unstable, and the details of the nonlinear forcing are less important. Downstream of the end of the potential core, on the other hand, nonlinearity, expressed through the endogenous forcing term, plays a major role in the jet dynamics (Reference Jordan, Zhang, Lehnasch and CavalieriJordan et al.; Tissot et al. Reference Tissot, Zhang, Lajús, Cavalieri and Jordan2017), overwhelming the signature of the linear mechanism. This effect is naturally present in the data; but it is absent in the resolvent maps, which only consider the optimal response mechanism. The SPOD/resolvent maps shown in figure 3 are based on calculations that consider the full computational domain (which extends up to 30D in the streamwise direction), and, therefore, they reflect the dominance of low-frequency Orr/streaky structures far downstream. One way to highlight the signature of the axisymmetric mode is to truncate the domain. In Appendix C we present results of resolvent analyses performed with domains truncated at $x/x_c=1$ and $x/x_c=1.5$, where $x_c$ is the potential core length, which increases with the flight stream. The truncations highlight the zone where KH wavepackets are dominant, and the results show how the energy/gain of the axisymmetric mode is enhanced (albeit not being dominant). Alternatively, the signature of KH wavepackets can be highlighted by normalising the modal energies and gains at each $(St, m)$ pair by the sum of the energy/gain across all wavenumbers, $\sum _m \lambda (St, m)$, $\sum _m \sigma (St, m)$. This was done by Pickering et al. (Reference Pickering, Rigas, Nogueira, Cavalieri, Schmidt and Colonius2020) and Maia et al. (Reference Maia, Brès, Lesshafft and Jordan2023), but is not shown here for the sake of conciseness. Furthermore, in § 5 we show that the alignment between leading resolvent and SPOD is almost perfect at KH-dominated frequencies. This is consistent with previous modelling studies cited above, and indicates that the linear model correctly captures the dominant KH mechanism, despite the discrepancy in the gain/energy maps.

Figure 3. Modal energy maps from SPOD and resolvent analysis. (a,b) Modal energy of the leading SPOD mode, $\lambda _1$. (c,d) Leading resolvent gain, $\sigma _1^2$. Contours are in logarithmic scale.

Figure 4 shows contours of the ratio between the leading and second SPOD eigenvalues, $\lambda _1/\lambda _2$, and the ratio between the optimal and first suboptimal resolvent gains, $\sigma _1^2/\sigma _2^2$. The eigenvalue separation map for the $M_f=0$ case shows large peaks for the first three azimuthal wavenumbers around $St=0.4\unicode{x2013}0.5$, due to the KH modal instability mechanism. The flight stream reduces the peak values, but produces a broader region of low-rank behaviour, and a slight shift of that region towards higher $St$. These trends were shown by Maia et al. (Reference Maia, Brès, Lesshafft and Jordan2023) to be consistent with a larger range of unstable frequencies in the flight case, and a shift of the most unstable KH mode towards higher frequency. The low-rank behaviour is found to be more pronounced in the resolvent model, including a large gain separation region for the $m=1$ mode at low $St$, which is not observed in the data. Unlike the SPOD maps, no weakening of the low-rank behaviour is observed in the resolvent model in the zone $0.3 \lessapprox St \lessapprox 1$, which is dominated by modal instability mechanisms for low azimuthal mode order. In Appendix C we show that, by truncating the domain, a reduction in gain separation in flight condition becomes apparent, revealing a weakening of the low-rank behaviour in the KH-dominated zone, which is not clear when the computation considers the full domain.

Figure 4. Maps of eigenvalue separation, $\lambda _1/\lambda _2$, from SPOD (a,b) and gain separation, $\sigma _1^2/\sigma _2^2$, from resolvent analysis (c,d), highlighting zones of low-rank jet dynamics.

Interestingly, in the $St \to 0$ zone, the flight stream produces an increase in the ratio $\lambda _1/\lambda _2$. This trend is found to be captured by the resolvent model. This can be seen in figure 5, which shows the low $St$ zone in more detail. The $\sigma _1^2/\sigma _2^2$ is clearly enhanced for the helical modes in that zone as a result of the mean-flow modification in the flight stream case. An interpretation for this behaviour is provided in the following sections.

Figure 5. Resolvent gain separation, $\sigma _1^2/\sigma _2^2$, close to the $St \to 0$ limit.

5. Mode shapes

In this section we perform a detailed comparison of coherent structures, educed through SPOD, and optimal resolvent modes in the static and flight cases. We define a projection coefficient,

(5.1)\begin{equation} \beta = | \boldsymbol{u}_{1}^{H} \boldsymbol{\mathsf{W}} \boldsymbol{\varPsi}_{1}|, \end{equation}

that quantifies the alignment between SPOD and resolvent response modes. The metric varies between 0, in which case the modes are orthogonal to each other, to 1, for perfect alignment. Figure 6 shows $\beta$ as a function of $St$ and $m$. The maps are divided in regions that roughly delimit the regions of dominance of the linear mechanisms studied. These regions are hypothesised based on inspection of the forcing-response pairs conducted at several frequency–wavenumber pairs by Pickering et al. (Reference Pickering, Rigas, Nogueira, Cavalieri, Schmidt and Colonius2020). Based on the characteristics shared by forcing and response modes within a given zone, a specific instability mechanism was assigned as dominant. Forcing and response modes in the KH-dominated zone are characterised by a spatial separation; forcing modes are concentrated near the nozzle lip, whereas response modes display a rapid exponential growth in the initial jet region, followed by saturation and decay after the end of the potential core. In the lift-up-dominated zone, forcing modes display a dominance of radial and azimuthal velocity components (characterising rolls), whereas the response modes are largely dominated by the streamwise component, typical of streaks. The Orr region is characterised by spatially extended forcing and response modes, with lower phase speeds than KH structures and slower growth rates in the streamwise direction. The characteristics of the forcing-response pair of each mechanism will be discussed in more detail briefly. These zones are useful for the purpose of discussing each mechanism separately, but we emphasise that they are not intended to suggest that such a clear demarcation exists between the different mechanisms.

Figure 6. Maps of alignment, measured by the $\beta$ metric, between leading SPOD and resolvent modes. The black lines are from Pickering et al. (Reference Pickering, Rigas, Nogueira, Cavalieri, Schmidt and Colonius2020), and approximately delimit the regions of dominance of the KH, Orr and lift-up mechanisms.

Good alignment is obtained between SPOD and response modes in KH-dominated zones, for both flow conditions. A frequency shift is observed in the peak values of $\beta$ with the flight stream, following the changes in the modal stability characteristics discussed above. The alignment is noticeably worse at $St<0.2$, in the Orr-dominated and lift-up-dominated zones. A similar trend was observed by Pickering et al. (Reference Pickering, Rigas, Schmidt, Sipp and Colonius2021), even with optimal eddy-viscosity models. Due to the small gain separation in this region, suboptimal modes are as important as the leading mode, and the details of the nonlinear forcing projection on the input space are necessary for a correct description of the dynamics. We note, however, an improved alignment in the $St \to 0$ region in the $M_f=0.15$ case. This region of improved alignment overlaps with the region where higher eigenvalue and gain separations were observed with the flight stream (figures 4 and 5). Due to the larger gain separation in that zone, the optimal response mode is likely more amplified by the nonlinear forcing and is likely to become more dominant in the flow. As a result, the coherent structures associated with that mechanism are more clearly observed in the SPOD mode, as can be inferred from the improved SPOD/resolvent alignment. This, in turn, translates into a stronger dominance of the leading SPOD mode, which is consistent with the larger eigenvalue separation. In static conditions, on the other hand, the dynamics, which is more high rank, is underpinned by a mixture of mechanisms, which are amplified to a similar degree. In this sense, the clearer dominance of the leading modes lead to the low-frequency dynamics being more organised in flight condition, despite the global weakening of linear, mean-flow growth mechanisms.

Maia et al. (Reference Maia, Brès, Lesshafft and Jordan2023) characterised the alignment between SPOD modes in the static and flight cases using the same metric defined above, but scaling the mean flows by the potential core length, $x_c$, which increases in the presence of the flight stream. It was shown that $\beta$ assumes high values in the KH-dominated zone, showing that the change in organisation of KH structures is largely dictated by the stretching of the potential core. The static-flight alignment in the Orr-dominated and lift-up-dominated zones, on the other hand, was found to be much poorer. Here we extend that comparison to the leading resolvent modes in static and flight conditions, and compare it with SPOD results. The results, which are displayed in figure 7, also take into account the rescaling of the modes and mean flow by the potential core length, $x_c$. The agreement between KH wavepackets in static and flight conditions is even more striking in the model; throughout the KH-dominated zone, the alignment is virtually perfect. As in the SPOD map, the alignment between resolvent modes deteriorates in the Orr and lift-up regions, showing that their reorganisation by the flight stream is more subtle than a simple mean-flow stretching.

Figure 7. Alignment between leading modes in the static and flight cases, measured by the $\beta$ metric. The left chart represents the alignment between SPOD modes and the right chart represents the alignment between resolvent modes. Modes and mean flow are scaled by $x_c$ prior to the computation of the projection.

In the following we analyse separately the shapes of coherent structures associated with the three instability mechanisms with and without the flight stream. As mentioned above, previous studies have provided extensive characterisations of such structures in static conditions. Therefore, here we focus mainly on the modifications observed in flight condition. In what follows, the streamwise coordinate is scaled by the potential core length, as done by Maia et al. (Reference Maia, Brès, Lesshafft and Jordan2023).

5.1. KH mechanism

The modal KH mechanism is dominant over a broad frequency range, $St \gtrsim 0.2$ (Schmidt et al. Reference Schmidt, Towne, Rigas, Colonius and Brès2018; Lesshafft et al. Reference Lesshafft, Semeraro, Jaunet, Cavalieri and Jordan2019; Pickering et al. Reference Pickering, Rigas, Nogueira, Cavalieri, Schmidt and Colonius2020), and can be observed up to $St=4$ and $m=4$ near the nozzle region (Sasaki et al. Reference Sasaki, Cavalieri, Jordan, Schmidt, Colonius and Brès2017). Here we present results for the axisymmetric azimuthal mode at $St=0.6$ as a representative case where KH wavepackets are clear in the jet response. Similar trends were found for other azimuthal wavenumbers and Strouhal numbers within the KH-dominated region of the spectrum, indicated in figure 6. Figures 8 and 9 show leading forcing, $\boldsymbol {v}_1$, and response, $\boldsymbol {u}_1$, modes for the static and flight cases, respectively. The leading SPOD mode of streamwise velocity is also shown for comparison, and is in striking agreement with the leading response mode in both cases, consistent with the alignment metric shown in figure 6. The forcing modes exhibits Orr-like structures localised in the vicinity of the nozzle lip, and are in agreement with observations made at lower-Mach-number jets (Garnaud et al. Reference Garnaud, Lesshafft, Schmid and Huerre2013; Schmidt et al. Reference Schmidt, Towne, Rigas, Colonius and Brès2018; Lesshafft et al. Reference Lesshafft, Semeraro, Jaunet, Cavalieri and Jordan2019). Similar structures have also been observed within the nozzle boundary layer (Kaplan et al. Reference Kaplan, Jordan, Cavalieri and Brès2021). Figures 8(b) and 9(b) show the streamwise evolution of the response and forcing amplitudes for each velocity component. The curves correspond to the local compressible inner products, $|\boldsymbol {u}_1^{H}\boldsymbol{\mathsf{W}}\boldsymbol {u}_1|$ and $|\boldsymbol {v}_1^{H}\boldsymbol{\mathsf{W}}\boldsymbol {v}_1|$ for the resolvent, and $|\varPsi _1^{H}\boldsymbol{\mathsf{W}}\varPsi _1|$ for the SPOD modes, at each streamwise position. Note that the $u_\theta$ component is null for the axisymmetric mode. The amplitudes of those curves is arbitrary, as SPOD and resolvent modes are not scaled by modal energy and gains, respectively (this also applies to figures 10–13). The growth rates of the resolvent response modes are found to be significantly larger than those of the SPOD modes (the modes are scaled so as to have the same amplitudes at $x/x_c=0$). However, they attain saturation at roughly the same streamwise position. Furthermore, as mentioned above, the shapes are in very good agreement, indicating that the main mechanism is well captured by the model. The forcing amplitudes display a noisy behaviour in the initial jet region, as opposed to the smooth decay observed at a lower Mach number (Pickering et al. Reference Pickering, Rigas, Nogueira, Cavalieri, Schmidt and Colonius2020). This behaviour is due to the signature of trapped waves. Despite the mask in the potential core being able to significantly attenuate these waves (see, for instance, the results of figure 17 without the core mask), it does not eliminate them altogether. A more efficient way to suppress them completely would be to also restrict the response at the jet core; but this would also impact the growth of KH waves in that zone and, therefore, it has not been done here. The structure of KH wavepackets in static and flight conditions are found to be quite similar (which can also be inferred from the alignment maps of figure 7). With the potential core scaling, the regions of exponential, growth, stabilisation and decay are found to be quite similar. Note that the SPOD modes do not display clear signs of trapped waves, although no mask has been applied in the SPOD computation. In Appendix A we show that the mechanism of the trapped waves is present in the SPOD as well, but their energy is much smaller than that of KH wavepackets. They can be clearly seen in the response modes if the amplitude of the KH waves is artificially reduced, as shown in figure 17. Moreover, they appear more clearly in the second SPOD mode, which is not considered in this section.

Figure 8. (a) Leading forcing and response modes of the axisymmetric wavenumber $m=0$ and Strouhal number $St=0.6$ for the static case, $M_f=0$. Leading SPOD mode is also shown for comparison. The modes are shown with contours corresponding to $\pm 0.7\|u_{x,r}\|$. (b) Component-wise amplitudes as a function of streamwise coordinate, computed through the compressible energy norm.

Figure 9. Leading forcing and response modes of the axisymmetric wavenumber $m=0$ and Strouhal number $St=0.6$ for the flight case, $M_f=0.15$. Legend is as in figure 8.

Figure 10. Leading forcing and response modes of the axisymmetric wavenumber $m=0$ and Strouhal number $St=0.2$ for the static case, $M_f=0$. Legend is as in figure 8.

Figure 11. (a) Leading forcing and response modes of the axisymmetric wavenumber $m=0$ and Strouhal number $St=0.2$ for the flight case, $M_f=0.15$. Legend is as in figure 8.

Figure 12. Leading forcing and response modes of the axisymmetric wavenumber $m=3$ and Strouhal number $St=0.02$ for the static case, $M_f=0$. Legend is as in figure 8.

Figure 13. Leading forcing and response modes of the axisymmetric wavenumber $m=3$ and Strouhal number $St=0.02$ for the flight case, $M_f=0.15$. Legend is as in figure 8.

5.2. Orr mechanism

The Orr mechanism is dominant for the axisymmetric wavenumber and low Strouhal numbers ($St \lesssim 0.2$), where the flow dynamics is high rank (Schmidt et al. Reference Schmidt, Towne, Rigas, Colonius and Brès2018; Lesshafft et al. Reference Lesshafft, Semeraro, Jaunet, Cavalieri and Jordan2019), and the KH mechanism is weak. As pointed out by Pickering et al. (Reference Pickering, Rigas, Nogueira, Cavalieri, Schmidt and Colonius2020), it also exists for $m>0$, but is overwhelmed either by streaky structures generated by the lift-up mechanism in the $St \to 0$ limit or by KH wavepackets at higher $St$. Figures 10 and 11 show forcing and response modes for $(m,St)=(0,0.2)$ without and with the flight, respectively. In static conditions the response modes grow over the first 1.5 potential core lengths. This feature is consistent with the SPOD mode, but the growth process is clearly different between model and data; the rank-1 model is not sufficient for a detailed discussion of the data. The forcing modes also present an overall growth with streamwise distance, after a slight decay in the initial region.

The flight stream changes these trends. Instead of presenting monotonic growth, the response modes saturate around $x/x_c \approx 0.5$ and propagate with constant amplitude further downstream, as shown in figure 11. The forcing amplitude remains essentially constant for $1.5x_c$, in contrast with the gradual increase seen in the static case. It can be seen that, despite sharing general traits, there is a significant discrepancy between leading SPOD and response modes for both jets, as indicated by the $\beta$ metric shown in figure 6. Notably, the SPOD modes have a much slower spatial growth than the model. Improving the agreement between model and flow data would probably require taking the suboptimals into account, since at this Strouhal number their gain is comparable to that of the optimal mode. Here the potential core scaling provides little help in explaining the modifications produced by the flight stream (see also figure 7), showing that they involve effects other than mean-flow stretching.

5.3. Lift-up mechanism

We now focus on the $St \to 0$, $m>0$ region of the frequency–wavenumber plane, whose associated coherent structures are underpinned by streaks generated via the lift-up mechanism. These structures are streamwise elongated and forced by counter-rotating streamwise vortices. Figures 12 and 13 show the spatial structure and amplitudes of the forcing and response modes of the static case for $(m,St)=(3,0.02)$, with $St=0.02$ being the first frequency bin obtained with the fast Fourier transform resolution chosen for the SPOD computation. The SPOD and resolvent response modes display spatially extended structures that follow the shear layer development and reach their maximal amplitudes far downstream. In the static case, SPOD and resolvent modes display some similar features. For instance, their amplitude envelopes exhibit the same streamwise increase behaviour and their wavelength is roughly the same. However, far downstream of the end of the potential core, $x/x_c>2.5$, the wavelengths of the flow structures in the SPOD and resolvent modes differ, which explains their poor alignment, as seen in figure 6. Forcing structures for the three velocity components are spatially extended and inclined with respect to the mean flow, similar to an Orr-type behaviour. However, inspection of the model amplitude curves shows that the lift-up mechanism is dominant. The radial and azimuthal components of the forcing are orders of magnitude higher than the streamwise component in the initial jet region (although this difference disappears further downstream), as opposed to the comparable contributions of the streamwise and radial components that characterise the Orr mechanism. The radial and azimuthal components form the streamwise rolls that optimally force the flow, producing positive and negative regions of fluid ‘lifting’ via the streamwise component. As a result, the streamwise velocity component becomes dominant in the flow response, as can be observed in the response amplitude curve.

Figure 13 presents $m=3$ streaky structures in flight condition. The SPOD mode reveals a structure with a larger wavelength with respect to the static case, which is a consequence of the higher phase velocity produced by the flight stream. This behaviour is correctly captured by the model, which displays larger wavelengths both in the forcing and response modes. Note that with the flight stream the SPOD and resolvent modes are clearly in better agreement, as also indicated by the $\beta$ metric shown earlier. Analysis of the forcing amplitude envelope reveals a more marked dominance of the radial and azimuthal velocity components over the streamwise component. While that is the case in the first 1.5 potential core lengths in the static case, it occurs for approximately 2.5$x_c$ with the flight stream, suggesting clearer and stronger rolls in the forcing mechanism in flight condition. As a consequence, the streamwise component is reinforced in the response, and its separation to the other two components increases with respect to the static case. These trends suggest that, despite the global weakening of the linear mean-flow growth mechanisms in flight condition, due to the reduction in shear, there is a relative reinforcement of the lift-up mechanism, which becomes more clearly distinguishable in the optimal forcing and response modes. The amplitude envelopes of the SPOD modes also exhibit a larger dominance of the streamwise component, showing that the relative reinforcement of the lift-up mechanism predicted by the model is also manifest in the flow. The flight stream response modes also display slower beyond $x/x_c \approx 2$, indicating streaks that remain energetic for longer streamwise distances. Note that, also for the streaks, the potential core scaling alone is not sufficient to correct for the modifications of the flight stream case.

All of these trends were observed for other azimuthal wavenumbers in the $St \to 0$ limit. Figure 14 shows a direct comparison between amplitudes of forcing and response modes in the static and flight cases for $m=1,3,5$. For all azimuthal wavenumbers, the flight stream leads to a more pronounced predominance of streamwise rolls in the optimal forcing. In the associated leading response modes the separation between the streamwise component and the $u_r$-$u_\theta$ (which compose the streamwise response rolls) components is systematically larger than in the static condition. It is important to emphasise that, although they are not dominant, the Orr and KH mechanisms are also active at low frequencies, and the associated coherent structures for $m>0$ are likely a mixture of Orr structures, streaks and weak KH wavepackets. The results presented above suggest that in flight condition, in spite of the overall energy attenuation, the lift-up mechanism is strengthened with respect to the other two. This is a direct consequence of the rank decrease at $St \to 0$ shown in figure 5. As the resolvent model predicts a larger gain separation, the more discernible streaky structures of the leading response modes are also more likely to be excited by the nonlinear forcing, and therefore, more likely to be observed in the flow data. This is consistent with the improved alignment between leading SPOD and resolvent modes obtained in the flight case (figure 6), and with the larger eigenvalue separation observed in the SPOD (figure 4).

Figure 14. Component-wise amplitude of leading response (a) and forcing (b) modes at $St=0.02$ for different azimuthal wavenumbers.

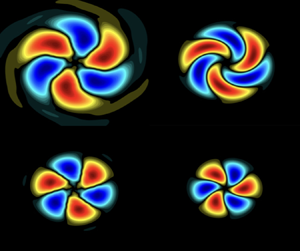
The explanation for the larger gain separation and clearer dominance of the streak mechanism comes from the larger phase velocities, and smaller associated streamwise wavenumbers, in the flight stream case. Strictly speaking, streaky structures are characterised by zero streamwise wavenumbers, developing parallel to the jet axis. This is the case at $St=0$. For small, but non-zero frequencies, the flow structures have non-zero streamwise wavenumbers (in which case they become helical), but they still bear most of the characteristics of streaks (Pickering et al. Reference Pickering, Rigas, Nogueira, Cavalieri, Schmidt and Colonius2020). However, they acquire an azimuthal phase velocity, $U_\theta = \omega /m$, which makes them rotate slightly around the jet axis as they evolve downstream. This can be seen in figure 15, which shows a cross-plane cut, made at $x/x_c =2.5$, of $m=3$ SPOD and resolvent modes at $St=0.02$. Resolvent modes computed at $St=0$ are also shown for comparison. In the flight stream case, the streamwise phase velocity, $U_c = \omega /\alpha$, with $\alpha$ the streamwise wavenumber, at a given frequency is higher. The higher phase velocity induces a smaller streamwise wavenumber of the associated structures, which has a direct impact on the gain separation. This can be demonstrated using a locally parallel model, which takes $\alpha$ as input. In Appendix D we use the model explored by Maia et al. (Reference Maia, Brès, Lesshafft and Jordan2023) to show that, at $St=0$, reducing the wavenumber indeed leads to a higher non-normality/gain separation. This agrees with the results obtained in the global analyses and explains the better agreement with SPOD modes in the flight stream case. Furthermore, the total phase velocity, given as the sum of the azimuthal and streamwise component, is more aligned with the streamwise direction in flight conditions. Note how, in figure 15, the rotation/swirling effect is much less marked with the flight stream. Besides from being more aligned with the jet axis, coherent structures in flight are also underpinned by a clearer signature of the lift-up mechanism, as discussed above. This makes them more similar to ‘classic’ $\omega =0$, $\alpha =0$ streaks.

Figure 15. Cross-plane cut of leading SPOD and resolvent modes at $m=3$ and taken at $x/x_c=2.5$. The real part of the streamwise velocity modes are shown, with contours scaled to $\pm \|u_{x}\|$. (a) Static case, $M_f=0$, (b) flight case, $M_f=0.15$.

6. Conclusions

We study coherent structures in turbulent subsonic jets subject to a uniform external flight stream. This work builds on the recent study of Maia et al. (Reference Maia, Brès, Lesshafft and Jordan2023), which presented a comprehensive characterisation of the frequency–wavenumber energy spectrum in flight condition using time-resolved PIV and high-fidelity LES databases. Here we extend their analysis by modelling coherent structures educed from the flow with global resolvent analysis. Spectral proper orthogonal decomposition is used to characterise empirically the effect of the flight stream on the most energetic flow structures. The mode energies and spatial structures are systematically compared with gains and shapes of resolvent response modes. The alignment between SPOD and resolvent modes is high for a broad range of Strouhal number and azimuthal wavenumbers, thanks to the use of the mean-flow-consistent eddy-viscosity model in the linear operator. The model is found to correctly describe a number of important effects of flight on the jet dynamics, and it is demonstrated that the most prominent modifications are associated with linear mean-flow mechanisms, rather than the effects of nonlinear interactions. We highlight three important effects:

  1. (i) Both the frequency-azimuthal wavenumber distribution of SPOD modal energy and the change in this distribution with flight is correctly mirrored by the distribution of resolvent gains. These distributions show how low-frequency streaky/Orr structures, which carry the bulk of the fluctuation energy, are those most damped by the flight stream. The trend is faithfully reproduced by the resolvent model.

  2. (ii) At intermediate Strouhal numbers, $0.4 \lesssim St \lesssim 0.8$, the low-rank behaviour of the flow is degraded by the flight stream, as evidenced by the smaller eigenvalue separation between leading and second SPOD modes. A similar reduction in gain separation is observed in the resolvent spectrum. This effect is enhanced when the computation domain is truncated to the first 1, 1.5 potential core lengths, which highlights the region where the KH mechanism is active.

  3. (iii) In the $St \to 0$ frequency limit, SPOD shows an enhanced low-rank behaviour in flight condition, despite the large attenuation of the dominant streaky structures: the low-frequency dynamics in flight are less energetic but more organised than they are in static conditions. This behaviour is reproduced by the resolvent model. Analysis of the response modes and their component-wise amplitude curves reveals that the lift-up mechanism is more marked with the flight stream. Streamwise vortices emerge more clearly in the forcing modes with respect to the streamwise forcing component, and streamwise velocity streaks are more marked in the flow response with respect to the radial and azimuthal components. The latter trend is also manifested in the empirical structures educed from SPOD. These results reveal that the lift-up mechanism stands out more clearly for a jet in flight. We show that this effect is associated with the higher phase velocity/smaller wavenumber of the flow structures with the flight stream, which produces low-frequency streamwise velocity structures that are more aligned with the jet axis, and are thus more similar to standard zero-frequency streaks. The smaller wavelengths also result in larger gain separations predicted by the resolvent analysis, which explains the rank decrease observed at low $St$. In summary, the results show that coherent structures associated with linear instability mechanisms are globally weakened, due to a reduction in shear; but the extra convection effect of flight nonetheless makes streaks stand out more clearly than the Orr and KH structures at low $St$.

The results described here may be used to guide future sound-source models of jets in flight. The acoustic field of such jets present broadband changes with respect to the static case (Viswanathan & Czech Reference Viswanathan and Czech2011), which are likely associated to changes in coherent structures (and associated instability mechanisms) in the turbulent field. Resolvent analysis is shown here to be clearly equipped to reproduce, to a great extent, these changes; therefore, it might provide a useful framework to explore sound-radiation mechanisms.

Acknowledgements

The authors would like to thank André Cavalieri and Diego Blanco for helpful discussions regarding streaky structures and convergence of SPOD modes at low frequency.

Funding

This work has received funding from the Clean Sky 2 Joint Undertaking (JU) under the European Union's Horizon 2020 research and innovation programme under grant agreement no. 785303. Results reflect only the authors’ view and the JU is not responsible for any use that may be made of the information it contains. The LES studies were performed at Cascade Technologies and were supported in part by NAVAIR SBIR project with computational resources provided by DoD HPCMP. I.A.M. also acknowledges support from the Science Without Borders program through the CNPq grant no. 200676/2015-6.

Declaration of interests

The authors report no conflict of interest.

Appendix A. Trapped waves in the potential core

This appendix presents results of resolvent analyses carried out with the mean-flow mask shown in figure 1(b) applied to both the forcing and response fields, thus removing the restriction in the forcing field inside the jet potential core. Figure 16 shows the leading gain maps for the two flow conditions studied. Overall, the maps are quite similar to those shown in § 4, obtained with the core mask. The highest optimal amplification occurs at the $St \to 0$ limit and concerns streaky/Orr structures that dominate the flow in the jet far field. These are the structures most affected by the flight stream, which significantly reduces their associated gains. Note, however, the spike that emerges for the axisymmetric mode around $St=0.4$ (and that cannot be clearly seen in the SPOD modal energy maps). This frequency matches the location of branches of trapped acoustic modes in the jet core (Schmidt et al. Reference Schmidt, Towne, Colonius, Cavalieri, Jordan and Brès2017) identified through global stability analysis. The signature of these trapped waves can be clearly seen in the forcing and response modes at that Strouhal number, which are reported in figure 17 for the $M_f=0$ jet. These waves are also found to be present in the SPOD modes; but their energy is small, and they are overwhelmed by KH wavepackets. In figure 17(e,f) the amplitude of KH wavepackets in the SPOD modes is artificially decreased by 95 % in order to highlight the trapped waves. They are clearly present in the jet core, and are more pronounced in the first suboptimal mode. Their signature, however, is not apparent in the eigenvalue spectrum.

Figure 16. Leading resolvent gain, $\sigma _1^2$, computed without the potential core mask. Contours are in $\log _{10}$ scale.

Figure 17. Resolvent and SPOD modes at $St=0.4$. Plots (a,b) show the leading resolvent response and forcing modes. Plots (c,d) display the leading and second SPOD modes, respectively. In (e,f) the amplitude of the KH wavepackets are artificially reduced by 95 %, in order to highlight the trapped waves in the jet core. The streamwise velocity component is shown, with contours corresponding to $\pm 0.7\|u_x\|$ in (ad).

Appendix B. Scaling parameter in the eddy-viscosity model

In this section we present results of resolvent analyses carried out using different values of the scaling constant, $c$, in the eddy-viscosity model, in order to assess the sensitivity of the model to changes in this parameter. Figure 18 shows resolvent gains for the static and flight cases computed with $c=0.10$ and $c=0.20$. Overall, the maps display features that are very similar to those shown in figure 3 for $c=0.15$. The zones of maximum energy/amplification are the same, and the attenuation of low-frequency Orr/streaky structures is well captured in all cases. A slight discrepancy with respect to the SPOD energy maps is seen in the $St \to 0$ limit with $c=0.10$: the map is quite flat in that zone, as the model predicts similar amplifications for all wavenumbers, whereas in the SPOD mode the peak energy is clearly between $m=1$ and $m=2$.

Figure 18. Resolvent gain maps for the static and flight cases computed with (a) $c=0.10$ and (b) $c=0.20$.

Figure 19 shows SPOD/resolvent alignment maps computed with $c=0.10$ and $c=0.20$ using the $\beta$ metric introduced in (5.1). Again, the main trends are essentially the same as those reported earlier for $c=0.15$. High alignment is always seen in the KH-dominated zone, and improved alignment at $St \to 0$ in the flight stream case is also present for all constant values considered, further demonstrating that those are physical trends, and not an artefact of a particular choice of scaling constant. Note, however, that with $c=0.20$ the alignment is poorer for $m>0$ in a broad range of frequencies in the KH-dominated region. In light of these small deficiencies observed with $c=0.10$ and $c=0.20$, the value of $c=0.15$ was adopted in order to conduct the main SPOD/resolvent comparisons throughout the study.

Figure 19. Maps of SPOD/resolvent alignment, measured by the $\beta$ metric, computed with (a) $c=0.10$ and (b) $c=0.20$.

Appendix C. SPOD and resolvent analysis with truncated domains

When performing SPOD and resolvent analysis with the full computational domain, which extends up to 30D in the streamwise direction, modal energy and resolvent gains are biased towards low-frequency structures that dominate the jet far downstream, and that are underpinned by the non-modal Orr and lift-up mechanisms. This inevitably masks most of the contribution of the KH mechanism to the global energy/gain spectrum, as they are convectively unstable in the initial jet region, approximately up to the end of the potential core. As KH wavepackets are highly efficient acoustic radiators (Jordan & Colonius Reference Jordan and Colonius2013), the initial jet region is of fundamental important for understanding jet noise. In this appendix we present results of resolvent analyses performed with domains truncated at $x/x_c=1$ and $x/x_c=1.5$, with a view to highlighting the changes produced by the flight stream on the zones of the spectrum underpinned by modal instability. Modal energy and gain maps are shown in figures 20 and 21. The spectra are much more broadband with respect to those obtained with the full domain and include, in addition to the high energy/amplification zone near the $St \to 0$ limit, considerable enegy/amplification in intermediate frequencies, $0.2 \lesssim St \lesssim 0.8$. The signature of the $m=0$ wavepackets, peaking toward $St=0.4\unicode{x2013}0.8$ are also more clear in the truncated maps (more so in the resolvent results). The clearest effect of the flight stream is still the attenuation of the $St \to 0$ zone, as seen previously for the full domain, but with the attenuation now concentrated at higher $m$, as when going upstream the peak energy evolves towards higher $m$ (Maia et al. Reference Maia, Brès, Lesshafft and Jordan2023).

Figure 20. Eigenvalue and resolvent gain spectra computed with domains truncated at $x/x_c=1$.

Figure 21. Eigenvalue and resolvent gain spectra computed with domains truncated at $x/x_c=1.5$

Figure 22 shows the gain separation, $\sigma _1^2/\sigma _2^2$ in the truncated domain. A reduction in gain separation in flight condition becomes apparent, highlighting the weakening of the low-rank behaviour in the KH-dominated zone. This trend is also consistent with a smaller growth rate of the KH instability, whose mechanism is mainly manifest in the leading resolvent mode.

Figure 22. Resolvent gain separation, $\sigma _1^2/\sigma _2^2$, computed with a domain truncated at (a) $x/x_c=1$ and (b) $x/x_c=1.5$.

Appendix D. Locally parallel model: gain separation at $St=0$ and low $\alpha$

Here we consider a locally parallel model to explore the effect of decreasing wavenumber on the gain separation of the resolvent operator.

In the locally parallel framework, we assume flow perturbations of the form

(D1)\begin{equation} \boldsymbol{q}'(x,r,\theta,t)=\hat{\boldsymbol{q}}(r)\exp^{{\rm i}(\alpha x - \omega t +m\theta)}, \end{equation}

where the radial structure of the perturbations is given by $\hat {\boldsymbol {q}}(r)$, $\alpha$ and $m$ are streamwise and azimuthal wavenumbers, respectively, and $\omega$ is the frequency. Fourier transforming the Navier–Stokes equations and introducing the above ansatz yields

(D2) \begin{equation} \hat{\boldsymbol{q}}_{\alpha,\omega,m} = \boldsymbol{\mathsf{C}}({\rm i}\omega\boldsymbol{\mathsf{I}} -\boldsymbol{\mathsf{A}}_{0} - \alpha\boldsymbol{\mathsf{A}}_{1} - \alpha^2 \boldsymbol{\mathsf{A}}_{2} )_{\bar{\boldsymbol{q}}}^{{-}1}\boldsymbol{\mathsf{B}}\hat{\boldsymbol{f}}_{\alpha,\omega,m}, \end{equation}

where the linear operators $\boldsymbol{\mathsf{A}}_{0}, \boldsymbol{\mathsf{A}}_{1}$ and $\boldsymbol{\mathsf{A}}_{2}$ contain terms issuing from zeroth-, first- and second-order derivatives in $x$, respectively. The superscripts $\hat {}$ denote Fourier-transformed quantities. Matrices $\boldsymbol{\mathsf{B}}$ and $\boldsymbol{\mathsf{C}}$ can be used to restrict forcing and response to a desired subspace. In a more compact form, we can write

(D3)\begin{equation} \hat{\boldsymbol{q}}_{\alpha,\omega,m}=\boldsymbol{\mathsf{R}}_{\bar{\boldsymbol{q}},\alpha,\omega,m} \,\hat{\boldsymbol{f}}_{\alpha,\omega,m}, \end{equation}

where $\boldsymbol{\mathsf{R}}_{\bar {\boldsymbol {q}},\alpha,\omega,m} = \boldsymbol{\mathsf{C}}(i\omega -\boldsymbol{\mathsf{A}}_{0} - \alpha \boldsymbol{\mathsf{A}}_{1} - \alpha ^2 \boldsymbol{\mathsf{A}}_{2} )_{\bar {\boldsymbol {q}}}^{-1}\boldsymbol{\mathsf{B}}$ is the resolvent operator. The discretisation in the radial direction is carried out using Chebyshev collocation points. The domain is extended to the far field by mapping the original domain $r \in [-1, 1]$ to $r \in [0,\infty )$ using a mapping. The reader is referred to Maia et al. (Reference Maia, Brès, Lesshafft and Jordan2023) for details about the matrices and boundary conditions. The locally parallel resolvent analysis is carried out at a fixed streamwise position using the mean flow, $\alpha$, $\omega$ and $m$ as inputs. The mean-flow profile is based on the LES data, fitted with the hyperbolic tangent profile proposed by Michalke & Hermann (Reference Michalke and Hermann1982) for the static case. Here we consider a profile taken at $x/x_c=0.7$. We consider a Reynolds number of $Re=50$, which is consistent with the eddy-viscosity model used in the global resolvent framework. Since we are interested in the behaviour of streaky structures, we set $\omega =0$. The azimuthal wavenumber considered is $m=3$. Figure 23 shows the resolvent gain separation computed for different values of $\alpha$. It can be observed that, although the largest gain separation is not strictly at $\omega =0$, approaching zero streamwise wavenumber (‘classic’ streaky structures) can lead to substantially larger gain separations. This explains why this behaviour is observed in the global framework, and why it leads to a clearly distinguishable streak mechanism in the forcing and response modes.

Figure 23. Resolvent gain separation, $(\sigma _1/\sigma _2)^2$, computed with the locally parallel model at $St=0$ and low values of the streamwise wavenumber, $\alpha$.

References

Agüí, J.C. & Hesselink, L. 1988 Flow visualization and numerical analysis of a coflowing jet: a three-dimensional approach. J. Fluid Mech. 191, 1945.CrossRefGoogle Scholar
Becker, H.A. & Massaro, T.A. 1968 Vortex evolution in a round jet. J. Fluid Mech. 31 (3), 435448.CrossRefGoogle Scholar
Blanco, D.C.P., Martini, E., Sasaki, K. & Cavalieri, A.V.G. 2022 Improved convergence of the spectral proper orthogonal decomposition through time shifting. J. Fluid Mech. 950, A9.CrossRefGoogle Scholar
Brès, G.A., Ham, F.E., Nichols, J.W. & Lele, S.K. 2017 Unstructured large eddy simulations of supersonic jets. AIAA J. 55 (4), 11641184.CrossRefGoogle Scholar
Brès, G.A., Jordan, P., Jaunet, V., Le Rallic, M., Cavalieri, A.V.G., Towne, A., Lele, S.K., Colonius, T. & Schmidt, O.T. 2018 Importance of the nozzle-exit boundary-layer state in subsonic turbulent jets. J. Fluid Mech. 851, 83124.CrossRefGoogle Scholar
Browand, F.K. & Laufer, J. 1975 The roles of large scale structures in the initial development of circular jets. In Symposia on Turbulence in Liquids, University of Missouri-Rolla.Google Scholar
Bryce, W. 1984 The prediction of static-to-flight changes in jet noise. AIAA Paper 1984-2358.CrossRefGoogle Scholar
Bushel, K.W. 1975 Measurement and prediction of jet noise in flight. AIAA Paper 75-461.CrossRefGoogle Scholar
Cavalieri, A.V.G., Jordan, P., Agarwal, A. & Gervais, Y. 2011 Jittering wave-packet models for subsonic jet noise. J. Sound Vib. 330, 44744492.CrossRefGoogle Scholar
Cavalieri, A.V.G., Jordan, P. & Lesshafft, L. 2019 Wave-packet models for jet dynamics and sound radiation. Appl. Mech. Rev. 71, 020802.CrossRefGoogle Scholar
Chu, B.-T. 1965 On the energy transfer to small scale disturbances in fluid flow (Part 1). Acta Mech. 1 (3), 215234.CrossRefGoogle Scholar
Cocking, B.J. & Bryce, W.D. 1975 Subsonic jet noise in flight based on some wind tunnel results. AIAA Paper 75-462.CrossRefGoogle Scholar
Crighton, D.G., Ffowcs, J.E. & Cheeseman, I.C. 1977 The outlook for simulation of forward flight effects on aircraft noise. J. Aircraft 14 (11), 11171125.CrossRefGoogle Scholar
Crouch, J.D., Garbaruk, A. & Magidov, D. 2007 Predicting the onset of flow unsteadiness based on global instability. J. Comput. Phys. 224 (2), 924940.CrossRefGoogle Scholar
Dimotakis, P.E., Miake-Lye, R.C. & Papantoniou, D.A. 1983 Structure and dynamics of round turbulent jets. Phys. Fluids 26 (11), 31853192.CrossRefGoogle Scholar
Garnaud, X., Lesshafft, L., Schmid, P. & Huerre, P. 2013 The preferred mode of incompressible jets: linear frequency response analysis. J. Fluid Mech. 716, 189202.CrossRefGoogle Scholar
Heidt, L., Colonius, T., Nekkanti, A., Schmdit, O., Maia, I. & Jordan, P. 2021 Analysis of forced subsonic jets using spectral proper orthogonal decomposition and resolvent analysis. AIAA Paper 2021-2108. AIAA Aviation 2021 Forum.CrossRefGoogle Scholar
Hwang, G.Y. & Cossu, C. 2010 Amplification of coherent streaks in the turbulent Couette flow: an input–output analysis at low Reynolds number. J. Fluid Mech. 633, 333348.CrossRefGoogle Scholar
Jeun, J., Nichols, J.W. & Jovanovic, M.R. 2016 Input-output analysis of high-speed axisymmetric isothermal jet noise. Phys. Fluids (1994-present) 28 (4), 047101.CrossRefGoogle Scholar
Jordan, P. & Colonius, T. 2013 Wave packets and turbulent jet noise. Annu. Rev. Fluid Mech. 45, 173195.CrossRefGoogle Scholar
Jordan, P., Zhang, M., Lehnasch, G. & Cavalieri, A.V.G. Modal and non-modal linear wavepacket dynamics in turbulent jets. AIAA Paper 2017-3379. 23rd AIAA/CEAS Aeroacoustics Conference. Available at: https://doi.org/10.2514/6.2017-3379.CrossRefGoogle Scholar
Jung, D., Gamard, S. & George, W.K. 2004 Downstream evolution of the most energetic modes in a turbulent axisymmetric jet at high Reynolds number. Part 1. The near-field region. J. Fluid Mech. 514, 173204.CrossRefGoogle Scholar
Kaplan, O., Jordan, P., Cavalieri, A.V.G. & Brès, G. 2021 Nozzle dynamics and wavepackets in turbulent jets. J. Fluid Mech. 923, A22.CrossRefGoogle Scholar
Karban, U., Bugeat, B., Towne, A., Lesshafft, L., Agarwal, A. & Jordan, P. 2023 An empirical model of noise sources in subsonic jets. J. Fluid Mech. 965, A18.CrossRefGoogle Scholar
Karban, U., Martini, E., Jordan, P., Brès, G. & Towne, A. 2022 Solutions to aliasing in time-resolved flow data. Theor. Comput. Fluid Dyn. 36, 887914.CrossRefGoogle Scholar
Kuhn, P., Soria, J. & Oberleithner, K. 2021 Linear modelling of self-similar jet turbulence. J. Fluid Mech. 919, A7.CrossRefGoogle Scholar
Lesshafft, L., Semeraro, O., Jaunet, V., Cavalieri, A.V.G. & Jordan, P. 2019 Resolvent based modelling of coherent structures wave packets in a turbulent jet. Phys. Rev. Fluids 4, 063901.CrossRefGoogle Scholar
Maia, I.A., Brès, G., Lesshafft, L. & Jordan, P. 2023 Effect of a flight stream on subsonic turbulent jets. Phys. Rev. Fluids 8, 063902.CrossRefGoogle Scholar
Maia, I.A., Jordan, P., Cavalieri, A.V.G. & Jaunet, V. 2019 Two-point wavepacket modelling of jet noise. Proc. R. Soc. A 475, 20190199.CrossRefGoogle ScholarPubMed
Martinsson, P-G. 2019 Randomized methods for matrix computations. Math. Data 25 (4), 187231.CrossRefGoogle Scholar
Mattsson, K. & Nordström, J. 2004 Summation by parts operators for finite difference approximations of second derivatives. J. Comput. Phys. 199 (2), 503540.CrossRefGoogle Scholar
McKeon, B.J. & Sharma, A.S. 2010 A critical-layer framework for turbulent pipe flow. J. Fluid Mech. 658, 336382.CrossRefGoogle Scholar
Michalke, A. & Hermann, G. 1982 On the inviscid instability of a circular jet with external flow. J. Fluid Mech. 114, 343359.CrossRefGoogle Scholar
Mohseni, K. & Colonius, T. 2000 Numerical treatment of polar coordinate singularities. J. Comput. Phys. 157 (2), 787795.CrossRefGoogle Scholar
Morfey, C.L. & Tester, B.J. 1977 Noise measurements in a free jet flight simulation facility: shear layer refraction and facility-to-flight corrections. J. Sound Vib. 54 (1), 83106.CrossRefGoogle Scholar
Morra, P., Semeraro, O., Henningson, D.S. & Cossu, C. 2019 On the relevance of Reynolds stresses in resolvent analyses of turbulent wall-bounded flows. J. Fluid Mech. 867, 969984.CrossRefGoogle Scholar
Nogueira, P., Cavalieri, A.V.G., Jordan, P. & Jaunet, V. 2019 Large-scale streaky structures in turbulent jets. J. Fluid Mech. 873, 211237.CrossRefGoogle Scholar
Oberleithner, K., Paschereit, C.O. & Wygnanski, I. 2014 On the impact of swirl on the growth of coherent structures. J. Fluid Mech. 741, 156199.CrossRefGoogle Scholar
Packman, A.B., Ng, K.W. & Paterson, R.W. 1975 Effect of simulated flight on subsonic jet exhaust noise. AIAA Paper 75-869.CrossRefGoogle Scholar
Pickering, E., Rigas, G., Nogueira, P., Cavalieri, A.V.G., Schmidt, O. & Colonius, T. 2020 Lift-up, Kelvin–Helmholtz and Orr mechanisms in turbulent jets. J. Fluid Mech. 896, A2.CrossRefGoogle Scholar
Pickering, E., Rigas, G., Schmidt, O.T., Sipp, D. & Colonius, T. 2021 Optimal eddy-viscosity models of coherent structures in turbulent jet. J. Fluid Mech. 917, A29.CrossRefGoogle Scholar
Plumbee, H.E. 1975 Effects of forward flight on turbulent jet mixing noise. AIAA Paper 75-869.Google Scholar
Rukes, L., Paschereit, O. & Oberleithner, K. 2016 An assessment of turbulence models for linear hydrodynamic stability analysis of strongly swirling jets. Eur. J. Fluid Mech. 59, 205218.CrossRefGoogle Scholar
Sasaki, K., Cavalieri, A.V.G., Jordan, P., Schmidt, O.T., Colonius, T. & Brès, G. 2017 High-frequency wavepackets in turbulent jets. J. Fluid Mech. 830, R2.CrossRefGoogle Scholar
Schmidt, O.T., Towne, A., Colonius, T., Cavalieri, A.V.G., Jordan, P. & Brès, G. 2017 Wavepackets and trapped acoustic modes in a turbulent jet: coherent structure eduction and global stability. J. Fluid Mech. 825, 11531181.CrossRefGoogle Scholar
Schmidt, O.T., Towne, A., Rigas, G., Colonius, T. & Brès, G.A. 2018 Spectral analysis of jet turbulence. J. Fluid Mech. 855, 953982.CrossRefGoogle Scholar
Soares, L.F., Cavalieri, A.V.G., Kopiev, V. & Faranosov, G. 2020 Flight effects on turbulent-jet wave packets. AIAA J. 58 (9), 38773888.CrossRefGoogle Scholar
Tammisola, O. & Juniper, M.P. 2016 Coherent structures in a swirl injector at $Re = 4800$ by nonlinear simulations and linear global modes. J. Fluid Mech. 3 (5), 620657.CrossRefGoogle Scholar
Tanna, H. & Morris, P. 1977 In-flight simulation experiments on turbulent jet mixing noise. J. Sound Vib. 53 (3), 343359.CrossRefGoogle Scholar
Tissot, G., Zhang, M., Lajús, F.C. Jr., Cavalieri, A.V.G. & Jordan, P. 2017 Sensitivity of wavepackets in jets to nonlinear effects: the role of the critical layer. J. Fluid Mech. 811, 95137.CrossRefGoogle Scholar
Towne, A., Cavalieri, A.V.G., Jordan, P., Colonius, T., Schmidt, O., Jaunet, V. & Brès, G.A. 2017 Acoustic resonance in the potential core of subsonic jets. J. Fluid Mech. 825, 11131152.CrossRefGoogle Scholar
Towne, A., Lozano-Durán, A. & Yang, X. 2020 Resolvent-based estimation of space–time flow statistics. J. Fluid Mech. 883, A17.CrossRefGoogle Scholar
Tyacke, J.C., Wang, Z.-N. & Tucker, P.G. 2018 Noise source, length and time scale distributions in installed jets with a flight stream. AIAA Paper 2018-3619. 2018 AIAA/CEAS Aeroacoustics Conference, Atlanta, Georgia, USA.CrossRefGoogle Scholar
Viswanathan, K. & Czech, M. 2011 Measurement and modeling of effect of forward flight on jet noise. AIAA J. 49 (1), 216234.CrossRefGoogle Scholar
Von Glahn, U., Groesbeck, D. & Goodykoontz, J. 1973 Velocity decay and acoustic characteristics of various nozzle geometries in forward flight. AIAA Paper 73-629.CrossRefGoogle Scholar
Wang, C., Lesshafft, L., Cavalieri, A.V.G. & Jordan, P. 2021 The effect of streaks on the instability of jets. J. Fluid Mech. 910, A14.CrossRefGoogle Scholar
Wang, Z-N., Naqavi, I. & Tucker, P.G. 2017 Large eddy simulation of the flight effects on single stream heated jets. AIAA Paper 2017-0457. 55th AIAA Aerospace Sciences Meeting, Grapevine, Texas, USA.CrossRefGoogle Scholar
Yule, A.J. 1978 Large-scale structure in the mixing layer of a round jet. J. Fluid Mech. 89 (3), 413432.CrossRefGoogle Scholar
Figure 0

Table 1. Operating conditions and simulation parameters of the main LES, where $t_{sim}$ is the simulation time and $\Delta t$ is the sampling period of the database recording.

Figure 1

Figure 1. Example of mean-flow masks applied to (a) the forcing and (b) the response for the static case, $M_f=0$.

Figure 2

Figure 2. Mean-flow-consistent eddy-viscosity fields computed at zero frequency and azimuthal wavenumber for (a) the static case, $M_f=0$, and (b) the flight stream case, $M_f=0.15$.

Figure 3

Figure 3. Modal energy maps from SPOD and resolvent analysis. (a,b) Modal energy of the leading SPOD mode, $\lambda _1$. (c,d) Leading resolvent gain, $\sigma _1^2$. Contours are in logarithmic scale.

Figure 4

Figure 4. Maps of eigenvalue separation, $\lambda _1/\lambda _2$, from SPOD (a,b) and gain separation, $\sigma _1^2/\sigma _2^2$, from resolvent analysis (c,d), highlighting zones of low-rank jet dynamics.

Figure 5

Figure 5. Resolvent gain separation, $\sigma _1^2/\sigma _2^2$, close to the $St \to 0$ limit.

Figure 6

Figure 6. Maps of alignment, measured by the $\beta$ metric, between leading SPOD and resolvent modes. The black lines are from Pickering et al. (2020), and approximately delimit the regions of dominance of the KH, Orr and lift-up mechanisms.

Figure 7

Figure 7. Alignment between leading modes in the static and flight cases, measured by the $\beta$ metric. The left chart represents the alignment between SPOD modes and the right chart represents the alignment between resolvent modes. Modes and mean flow are scaled by $x_c$ prior to the computation of the projection.

Figure 8

Figure 8. (a) Leading forcing and response modes of the axisymmetric wavenumber $m=0$ and Strouhal number $St=0.6$ for the static case, $M_f=0$. Leading SPOD mode is also shown for comparison. The modes are shown with contours corresponding to $\pm 0.7\|u_{x,r}\|$. (b) Component-wise amplitudes as a function of streamwise coordinate, computed through the compressible energy norm.

Figure 9

Figure 9. Leading forcing and response modes of the axisymmetric wavenumber $m=0$ and Strouhal number $St=0.6$ for the flight case, $M_f=0.15$. Legend is as in figure 8.

Figure 10

Figure 10. Leading forcing and response modes of the axisymmetric wavenumber $m=0$ and Strouhal number $St=0.2$ for the static case, $M_f=0$. Legend is as in figure 8.

Figure 11

Figure 11. (a) Leading forcing and response modes of the axisymmetric wavenumber $m=0$ and Strouhal number $St=0.2$ for the flight case, $M_f=0.15$. Legend is as in figure 8.

Figure 12

Figure 12. Leading forcing and response modes of the axisymmetric wavenumber $m=3$ and Strouhal number $St=0.02$ for the static case, $M_f=0$. Legend is as in figure 8.

Figure 13

Figure 13. Leading forcing and response modes of the axisymmetric wavenumber $m=3$ and Strouhal number $St=0.02$ for the flight case, $M_f=0.15$. Legend is as in figure 8.

Figure 14

Figure 14. Component-wise amplitude of leading response (a) and forcing (b) modes at $St=0.02$ for different azimuthal wavenumbers.

Figure 15

Figure 15. Cross-plane cut of leading SPOD and resolvent modes at $m=3$ and taken at $x/x_c=2.5$. The real part of the streamwise velocity modes are shown, with contours scaled to $\pm \|u_{x}\|$. (a) Static case, $M_f=0$, (b) flight case, $M_f=0.15$.

Figure 16

Figure 16. Leading resolvent gain, $\sigma _1^2$, computed without the potential core mask. Contours are in $\log _{10}$ scale.

Figure 17

Figure 17. Resolvent and SPOD modes at $St=0.4$. Plots (a,b) show the leading resolvent response and forcing modes. Plots (c,d) display the leading and second SPOD modes, respectively. In (e,f) the amplitude of the KH wavepackets are artificially reduced by 95 %, in order to highlight the trapped waves in the jet core. The streamwise velocity component is shown, with contours corresponding to $\pm 0.7\|u_x\|$ in (ad).

Figure 18

Figure 18. Resolvent gain maps for the static and flight cases computed with (a) $c=0.10$ and (b) $c=0.20$.

Figure 19

Figure 19. Maps of SPOD/resolvent alignment, measured by the $\beta$ metric, computed with (a) $c=0.10$ and (b) $c=0.20$.

Figure 20

Figure 20. Eigenvalue and resolvent gain spectra computed with domains truncated at $x/x_c=1$.

Figure 21

Figure 21. Eigenvalue and resolvent gain spectra computed with domains truncated at $x/x_c=1.5$

Figure 22

Figure 22. Resolvent gain separation, $\sigma _1^2/\sigma _2^2$, computed with a domain truncated at (a) $x/x_c=1$ and (b) $x/x_c=1.5$.

Figure 23

Figure 23. Resolvent gain separation, $(\sigma _1/\sigma _2)^2$, computed with the locally parallel model at $St=0$ and low values of the streamwise wavenumber, $\alpha$.