Hostname: page-component-745bb68f8f-f46jp Total loading time: 0 Render date: 2025-01-14T00:11:55.263Z Has data issue: false hasContentIssue false

Flow patterns and energy spectra in forced quasi-two-dimensional turbulence: effect of system size and damping rate

Published online by Cambridge University Press:  02 October 2024

Hang-Yu Zhu
Affiliation:
Centre for Complex Flows and Soft Matter Research, Southern University of Science and Technology, Shenzhen 518055, PR China Department of Mechanics and Aerospace Engineering, Southern University of Science and Technology, Shenzhen 518055 PR China Department of Mechanics, School of Aerospace Engineering, Huazhong University of Science and Technology, Wuhan 430074, PR China
Jin-Han Xie
Affiliation:
Department of Mechanics and Engineering Science at College of Engineering, and State Key Laboratory for Turbulence and Complex Systems, Peking University, Beijing 100871, PR China
Ke-Qing Xia*
Affiliation:
Centre for Complex Flows and Soft Matter Research, Southern University of Science and Technology, Shenzhen 518055, PR China Department of Mechanics and Aerospace Engineering, Southern University of Science and Technology, Shenzhen 518055 PR China Department of Physics, Southern University of Science and Technology, Shenzhen 518055, PR China
*
Email address for correspondence: xiakq@sustech.edu.cn

Abstract

An experimental investigation is conducted to study the flow patterns, spectral properties and energy fluxes in thin-layer turbulence with varying system sizes and damping rates. It is found that although a system-size vortex (an indicator of spectral condensation) occurs for small system sizes and does not for large ones, the spectra for different system sizes consistently exhibit a scaling close to $k^{-3}$ in inverse cascade (another indicator of spectral condensation). On the other hand, under a fixed system size larger than the friction-dominated length scale, the energy spectrum in the inverse cascade range changes from $k^{-3}$ to $k^{-5/3}$ as the damping rate increases, suggesting that the friction-dominated length scale may not be a suitable parameter for predicting spectral transition. At lower damping rates and large system sizes, turbulent structures grow larger via inverse cascade, manifesting as long streamers, and the small-scale vortices are suppressed. This suppression leads to a reduction of energy flux at intermediate scales and a change in the spectral shape. The dimensionless Taylor microscale is found to exhibit a monotonic dependence on the damping rate. With the reduction in the damping rate, the Taylor microscale increases to become comparable with the forcing scale, and the spectrum in inverse cascade transits to a steeper scaling, $k^{-3}$, indicating that the dimensionless Taylor microscale may be used as a diagnostic parameter for spectral transition.

Type
JFM Papers
Copyright
© The Author(s), 2024. Published by Cambridge University Press

1. Introduction

Turbulence is a ubiquitous phenomenon in both natural and engineering systems. The reduction of dimensionality in turbulent flows can give rise to novel physical phenomena. In two-dimensional (2-D) turbulence, enstrophy transfers to smaller length scales and is dissipated by viscous effects, while energy cascades to larger scales and is dissipated by large-scale damping mechanisms. This behaviour of 2-D turbulence differs significantly from its three-dimensional (3-D) counterpart. Although perfect 2-D turbulence is never realized in either natural or in laboratory settings, the characteristics of 2-D turbulence play essential roles in large-scale geophysical and astrophysical flows (Boffetta & Ecke Reference Boffetta and Ecke2012).

In unbounded 2-D turbulence, the growth of turbulent structures via energy inverse cascade is arrested by frictional effects at a friction-dominated scale, $L_\alpha$. This scale is estimated by $L_\alpha \approx \epsilon _\alpha ^{1/2}\alpha ^{-3/2}$ (Lilly Reference Lilly1972; Alexakis & Biferale Reference Alexakis and Biferale2018), where $\alpha$ is the linear damping rate. Here, $\epsilon _\alpha$ is the energy flux towards large scales and can be estimated as $\alpha u_{rms}^2$, with $u_{rms}$ the characteristic velocity of turbulence. In this case, the energy spectrum presents a $k^{-5/3}$ scaling in the inertial range of the inverse cascade (Lee Reference Lee1951). For a bounded system, Kraichnan (Reference Kraichnan1967) predicted that when the system size $L_B$ is smaller than $L_\alpha$ (but much larger than the forcing scale $l_f$), the inverse energy transfer would be terminated at $L_B$, where most energy piles up. This phenomenon is known as spectral condensation, which is analogous to Einstein–Bose condensation in 2-D quantum gas. In previous studies, it was suggested that spectral condensation has two characteristic manifestations, i.e. the appearance of a coherent vortex with a size comparable to $L_B$, and a steep inverse cascade spectrum, which is close to $k^{-3}$ (Paret & Tabeling Reference Paret and Tabeling1998; Danilov & Gurarie Reference Danilov and Gurarie2000; Chertkov et al. Reference Chertkov, Connaughton, Kolokolov and Lebedev2007; Xia et al. Reference Xia, Punzmann, Falkovich and Shats2008).

However, these two manifestations do not always occur simultaneously. In laboratory thin-layer turbulence, Xia, Shats & Falkovich (Reference Xia, Shats and Falkovich2009) found that the system-size vortex did not emerge at relatively high damping rates, even though they observed a steepened scaling of $k^{-3}$ in the inverse cascade spectrum. Specifically, their experiments implied that spectral condensation also occurred when $L_\alpha /L_B<1.0$. More recently, Fang & Ouellette (Reference Fang and Ouellette2021) observed a regular vortex in a bounded turbulence with $L_\alpha /L_B>1.0$, which was previously interpreted as a sign of spectral condensation, but they did not observe the associated indicator in the energy spectra. They further claimed that the inverse energy transfers for smaller $L_B$ appeared to be weakened, and the additional damping caused by the sidewalls may prevent condensation. These observations demonstrate that the condition for the appearance of the spectral condensation in quasi-2-D turbulence is highly ambiguous. Xia et al. (Reference Xia, Punzmann, Falkovich and Shats2008, Reference Xia, Shats and Falkovich2009) distinguished the weak, intermediate and strong condensations by measuring the strength of the mean flow (not the system-size vortex), which is different from that in Kraichnan's original sense. Numerical studies carried out by van Kan & Alexakis (Reference van Kan and Alexakis2019) and De Wit, van Kan & Alexakis (Reference De Wit, van Kan and Alexakis2022) demonstrated the hysteresis bistability of the condensation dynamics in thin-layer flows, taking into account the effect of thin-layer thickness, box size and Reynolds number. Considering the concept of coherent bundles as the underlying Lagrangian structures in 2-D turbulence (Francois et al. Reference Francois, Xia, Punzmann and Shats2018; Yang et al. Reference Yang, Davoodianidalik, Xia, Punzmann, Shats and Francois2019), Yang (Reference Yang2021) argued that the protection of coherent bundles from turbulent fluctuations would result in an increased correlation length, and when this correlation length exceeds $L_B$, a condensate may form. Moreover, Kolokolov & Lebedev (Reference Kolokolov and Lebedev2020) suggested that the formation of coherent vortices depends on the relative strength of two dissipation mechanisms: viscosity and bottom friction. They analytically distinguished two states of turbulence: the coherent vortex state and the strong chaotic state, which was determined by the dimensionless damping rate $\gamma =\alpha l_f^2/\nu$, where $\nu$ is kinematic viscosity. Doludenko et al. (Reference Doludenko, Fortova, Kolokolov and Lebedev2022) further demonstrated numerically that when $\gamma \lesssim 10$, the first state can be observed, whereas for $\gamma \gtrsim 10$, the chaotic state is expected.

Large-scale coherent structures produced by inverse cascade in 2-D turbulence could be large-scale vortices (Chertkov et al. Reference Chertkov, Connaughton, Kolokolov and Lebedev2007; Scott Reference Scott2007; Xia et al. Reference Xia, Punzmann, Falkovich and Shats2008), jets (Frishman, Laurie & Falkovich Reference Frishman, Laurie and Falkovich2017) or streamers (Jiménez Reference Jiménez2020). In fact, Kraichnan's theory was essentially spectral and did not include coherent vortices. McWilliams (Reference McWilliams1984) suggested that while the presence of persistent coherent structures coexisting with small-scale turbulence does not invalidate many of the traditional characterizations of 2-D and geostrophic turbulence, the interaction between the small and large scales may suppress the cascading process (McWilliams Reference McWilliams1990; Nazarenko & Laval Reference Nazarenko and Laval2000; Falkovich Reference Falkovich2016; Frishman Reference Frishman2017). Balk, Zakharov & Nazarenko (Reference Balk, Zakharov and Nazarenko1990) proposed theoretically that once the length scales of turbulent structures reach some threshold level via inverse cascade, the local energy transfer ceases and a non-local energy flux arises, which eventually modifies the shape of energy spectra (Biglari, Diamond & Terry Reference Biglari, Diamond and Terry1990; Shaing, Crume & Houlberg Reference Shaing, Crume and Houlberg1990). In the numerical studies, Scott and co-workers (Scott Reference Scott2007; Fontane, Dritschel & Scott Reference Fontane, Dritschel and Scott2013) found that even without friction or the length scale of vortices without reaching the system size, a steeper spectral scaling was observed in the inverse cascade range due to the emergence of coherent vortices when the Reynolds number is large enough. Subsequently, they proposed the vortex scaling theories explaining the properties of vortex populations (Burgess, Dritschel & Scott Reference Burgess, Dritschel and Scott2017; Burgess & Scott Reference Burgess and Scott2017). Chertkov et al. (Reference Chertkov, Connaughton, Kolokolov and Lebedev2007) found numerically that in a bounded domain, the presence of large-scale coherent vortices leads to a steepened spectrum $k^{-3}$, and the subtraction of the coherent component from the flow field recovered a close to $k^{-5/3}$ spectrum of underlying turbulence, which was consistent with the experiments (Xia et al. Reference Xia, Punzmann, Falkovich and Shats2008, Reference Xia, Shats and Falkovich2009, Reference Xia, Byrne, Falkovich and Shats2011). In bounded thin-layer turbulence, Shats et al. (Reference Shats, Xia, Punzmann and Falkovich2007) demonstrated experimentally that the self-generated or externally induced large-scale flows (called mean flows) can suppress small-scale turbulence and reduce the energy flux via shearing and sweeping of the turbulent eddies, which may be attributed to non-local interaction in turbulence (Alexakis, Mininni & Pouquet Reference Alexakis, Mininni and Pouquet2005). One may imagine a scenario where, in unbound 2-D turbulence, if the damping rate is sufficiently small, then the flow structures can grow to sizes much larger than the forcing-scale vortices. It is worth noting that the coherent structures in this context may not necessarily be large-scale vortices but could also be large-scale streamers (Jiménez Reference Jiménez2020). Would one also expect these large-scale structures to suppress small-scale turbulence and alter the energy spectra? When does this suppression occur?

To address the above questions, in this study we perform an experimental investigation that is designed to explore the flow patterns, spectral properties and energy transfers in thin-layer turbulence for varying system sizes $L_B/l_f$ and bottom frictions $\gamma$. The aim of this work is to uncover the mist of the conditions necessary for the occurrence of spectral condensation. On the one hand, we wish to examine the two manifestations of the ‘standard’ spectral condensation mentioned above. On the other hand, the condition for spectral transition from the classical $k^{-5/3}$ scaling to a steeper spectrum $k^{-3}$ is of particular interest. In this study, we refer the $k^{-3}$ spectrum in the energy inertial range to the occurrence of spectral condensation, regardless of the presence of the system-sized vortex (Xia et al. Reference Xia, Shats and Falkovich2009). The remainder of this paper is organized as follows. The details of the experimental set-up and main parameters are introduced in § 2. We present the results in § 3, which is divided into three parts. Sections 3.1 and 3.2 describe the effect of $L_B$ and $\gamma$ on spectral properties, respectively, and § 3.3 provides a discussion on the Taylor microscale and non-local interaction across scales in turbulence. Concluding remarks are given in § 4.

2. The experimental set-up

Our quasi-2-D turbulent flows were generated in a Plexiglas container filled with stratified, electromagnetically driven fluid layers. The experimental set-up was similar to previous experiments (Xia et al. Reference Xia, Punzmann, Falkovich and Shats2008; Rivera & Ecke Reference Rivera and Ecke2016; Tithof, Martell & Kelley Reference Tithof, Martell and Kelley2018), and has been described in detail in our previous work (Zhu, Xie & Xia Reference Zhu, Xie and Xia2023). Here, only a brief description is given. We floated a lighter conductive fluid of sodium hydroxide (NaOH) water solution (mass fraction 10 %, density 1.08 kg m$^{-3}$, kinematic viscosity $\nu \approx 1.45\times 10^{-5}$ m$^2$ s$^{-1}$) on a heavier dielectric fluid layer of Fluorinert FC $-$770 (density 1.80 kg m$^{-3}$), which are immiscible. The Fluorinert layer was used to detach the electromagnetic forces from the bottom boundary layer and reduce the bottom drag. Two copper electrodes were attached to two opposite sides of the reservoir and drove direct current through the upper layer. A matrix of cubic permanent magnets placed under the reservoir generated a vertical magnetic field, with the poles of adjacent magnets being opposite to each other. The Lorenz forces resulting from the interaction between the current and the vertical magnetic field stirred the upper fluid to generate a vortex lattice that evolves into turbulent flows.

The forcing scale $l_f$, defined by the magnet spacing, was set to 9.38 and 10 mm for two types of magnet elements used in the present experiments. The system size $L_B$, which corresponds to the size of the flow region, was adjusted by inserting square boundaries in the centre of the reservoir (Xia et al. Reference Xia, Shats and Falkovich2009; Fang & Ouellette Reference Fang and Ouellette2021). These designed boundaries permitted the electric current to pass through but acted as barriers to the fluid flow. By varying the size of these insertable boundaries, the size of the flow region was adjusted to range from 100 to 360 mm, resulting in a wide range of scale separations, i.e. $L_B/l_f=10.6\unicode{x2013}38.4$.

The turbulent flows in the upper layer were measured using a high-resolution particle image velocimetry system. The polyamid spheres (density 1.03 kg m$^{-3}$) of diameter 50 $\mathrm {\mu }$m were seeded as tracer particles on the free surface of the upper layer. These particles were illuminated by a horizontal laser sheet of thickness 0.5 mm. A CMOS camera (FILR ORX-10G-123S6M) with sensor size $4096 \times 3000$ pixels was used to capture the particle images. The digital image resolution was approximately 0.06 mm pixel$^{-1}$ for all tested cases, and the active sensor size of the camera was adjusted according to the field of view $L$. In the present experiments, $L$ was not larger than 208 mm, and was equal to $L_B$ for $L_B<208$ mm. The sampling frequency was set to 10–60 Hz according to the flow strength, to ensure that the mean displacement of the tracer particles between adjacent frames is approximately 8.0 pixels. A total of 4000–10 000 snapshots were taken, depending on the sampling frequency. A state-of-the-art cross-correlation algorithm with window deformation and multi-resolution iteration was used to calculate the velocity field (Scarano & Riethmuller Reference Scarano and Riethmuller2000). The interrogation window of the final pass was $32 \times 32$ pixels with overlap ratio 75 $\%$. The vector spacing in the measured velocity field was approximately 0.5 mm (${\sim }0.05 l_f$), which corresponds to, for example, $173 \times 173$ velocity vectors in the case $L_B=100$ mm (i.e. $L=100$ mm). The velocity components in the horizontal plane of measurement were denoted $u_1(x_1, x_2)$ and $u_2(x_1,x_2)$, respectively. From the velocity field, the vorticity field was calculated using $\omega =\partial _{x_1}u_2-\partial _{x_2}u_1$.

The large-scale friction in thin layers originates from the flow shear, i.e. the velocity gradient, in the boundary layer (Clercx, Van Heijst & Zoeteweij Reference Clercx, Van Heijst and Zoeteweij2003; Boffetta & Ecke Reference Boffetta and Ecke2012; Suri et al. Reference Suri, Tithof, Mitchell, Grigoriev and Schatz2014). We adjusted the thickness of the bottom fluid layer to regulate the dissipation due to bottom friction. In this work, the damping rate $\alpha$ ranged from 0.07 to 0.26 s$^{-1}$, and the corresponding dimensionless damping rate expressed by $\gamma =\alpha l_f^2/\nu$ (Rivera, Wu & Yeung Reference Rivera, Wu and Yeung2001; Kolokolov & Lebedev Reference Kolokolov and Lebedev2020) varied from 4.2 to 14.3. By modifying the current densities and the distances between the magnet array and the upper layer, the forcing-scale-based Reynolds number $Re_f=u_{rms}l_f/\nu$ was set to 45–130, where $u_{rms}=6\unicode{x2013}17$ mm s$^{-1}$ is the in-plane root mean square (rms) velocity. The corresponding Taylor-scale Reynolds number $Re_\lambda =\lambda u_{rms}/\nu$ is based on the Taylor microscale expressed as $\lambda =\sqrt {E_0/\varOmega }$ (Rivera, Vorobieff & Ecke Reference Rivera, Vorobieff and Ecke1998), where $E_0=u_{rms}^2/2$ is the mean energy density of the turbulent flow, and $\varOmega =\omega _{rms}^2/2$ is the enstrophy density. In this experiment, $Re_\lambda$ ranged from 30 to 75 ($\lambda /l_f=0.25\unicode{x2013}1.20$), which values are similar to those reported in previous experiments on soap-film flow (Rivera et al. Reference Rivera, Vorobieff and Ecke1998) and thin-layer turbulence (Xia et al. Reference Xia, Shats and Falkovich2009).

The thickness of the upper fluid layer, $h_t$, is fixed at 3 mm in our experiments. Consequently, the ratio of the lateral to the vertical length scales of the turbulent flows, $L_B/h_t$, is much larger than 1.0, which ensures the quasi-two-dimensionality of the turbulent flows. We have not observed any surface waves or laser-void regions in the upper layer while checking the uniformity of the laser illumination or the homogeneity of the tracer particles in particle images. It has also been checked that the ratio of the velocity divergence to the vorticity, $(\boldsymbol {\nabla } \boldsymbol {\cdot } \boldsymbol {u})_{rms}/\omega _{rms}$, is about 0.1, which also indicates that the flow is quasi-2-D (Rivera & Ecke Reference Rivera and Ecke2016; Zhu et al. Reference Zhu, Xie and Xia2023). In addition, the compressibility factor is defined as $C=\langle (\boldsymbol {\nabla } \boldsymbol {\cdot } \boldsymbol {u})^2\rangle /\langle (\boldsymbol {\nabla } \boldsymbol {u})^2\rangle$, and $C>0.5$ is indicative of a compressible 2-D flow (Goldburg et al. Reference Goldburg, Cressman, Vörös, Eckhardt and Schumacher2001; Schumacher Reference Schumacher2003; Lovecchio, Zonta & Soldati Reference Lovecchio, Zonta and Soldati2015). In current experiments, $C$ is approximately 0.035, much smaller than 0.5, which further indicates that the two-dimensionality is well satisfied. During the experimental process, the direct current caused Joule heating, resulting in a maximum temperature increase of approximately 2 $^\circ$C in the upper layer. This temperature increase led to a minor change in kinematic viscosity of less than 5 $\%$, which was deemed negligible for our experimental purposes (Tithof et al. Reference Tithof, Martell and Kelley2018).

3. Results and discussions

3.1. Effect of system size

To investigate the impact of system size on flow patterns and spectral properties, we varied the system sizes while maintaining the forcing and fluid layer depth (i.e. bottom friction) unchanged. Figure 1 shows the instantaneous vorticity fields for five different cases of $L_B/l_f$. Note that for the case of the largest $L_B/l_f=29.9$, the size of the field of view is $L/l_f=22.2$, smaller than $L_B/l_f$. Our results reveal that the flow patterns differ significantly for different values of $L_B$. Specifically, for large $L_B/l_f$ ($=29.9, 22.2$), the large-scale streamers identified by the co-directional velocity vectors, connecting the neighbouring vortices, can be observed, whereas for small $L_B/l_f$ ($=13.2, 10.6$), a coherent vortex with a size close to $L_B$ dominates the flow field. The mechanism of the formation of a system-sized coherent vortex is that the streamers, produced by the same-sign neighbouring vortices in the initial stage of the flow evolution, are guided by the side boundaries to evolve into a large-scale vortex in a finite domain (Xia & Shats Reference Xia and Shats2012). These observations are consistent with the previous experiments by Fang & Ouellette (Reference Fang and Ouellette2021). According to the arguments given in previous studies (Paret & Tabeling Reference Paret and Tabeling1998; Chertkov et al. Reference Chertkov, Connaughton, Kolokolov and Lebedev2007), the presence of a system-size vortex in the cases $L_B/l_f =13.2$ and 10.6 here indicates the occurrence of spectral condensation.

Figure 1. The instantaneous vorticity fields $\omega$ overlaid with the down-sampled velocity vectors under the same forcing and bottom damping in the cases of different system sizes: (a) $L_B/l_f = 29.9$, (b) $L_B/l_f = 22.2$, (c) $L_B/l_f = 16.8$, (d) $L_B/l_f = 13.2$, (e) $L_B/l_f = 10.6$.

We plot the time evolution of the kinetic energy in figure 2(a). The damping rate $\gamma$ ($=\alpha l_f^2/\nu$) was estimated by fitting the exponential decay of kinetic energy after switching off the forcing (Xia et al. Reference Xia, Shats and Falkovich2009; Fang & Ouellette Reference Fang and Ouellette2017), i.e. $E(t)\propto {\rm e}^{-2\alpha t}$, where $E(t)= \sum [u_1(t)^2+u_2(t)^2]/2N^2$ is the kinetic energy at time $t$ (with $N^2$ the number of velocity vectors in a snapshot). As shown in table 1, $\gamma$ exhibits a moderate decreasing trend with the increase of $L_B$. This could be attributed to the different flow patterns or the additional dissipation caused by the solid boundaries which may be more severe for small domain sizes. Figure 2(b) shows the fraction of kinetic energy in the mean flow field $E_m/E_0$ as a function of $L_B/l_f$, where $E_0 = u_{rms}^2/2$ (see figure 2a) and $E_m=\sum (\bar u_1^2+\bar u_2^2)/2N^2$ (with $\bar u_1$ and $\bar u_2$ the time-averaged velocity fields in the steady state). Our results indicate that the flow field becomes more stable as $L_B$ decreases, which is consistent with previous studies (Xia et al. Reference Xia, Shats and Falkovich2009; Fang & Ouellette Reference Fang and Ouellette2021). Figure 2(c) plots the friction-dominated scale $L_\alpha$ ($=u_{rms}/\alpha$) as a function of $L_B/l_f$. It is seen that for the cases $L_B/l_f$ =13.2 and 10.6, $L_\alpha /L_B\gtrsim 1.0$ is satisfied, which was previously considered to indicate spectral condensation, and seems to agree with the observations of the flow patterns shown in figure 1.

Figure 2. (a) The time evolution of the kinetic energy $E(t)$. The red dashed line denotes the linear growth stage after the forcing is switched on, which can be used to estimate the energy injection rate $\epsilon _{i}={\rm d}E/{\rm d}t$, and the blue dotted curve denotes the exponential decay after the forcing is switched off, i.e. $E\propto {\rm e}^{-2\alpha t}$, from which $\alpha$ can be estimated. (b) The proportion of kinetic energy in the mean flow field $E_m/E_0$. (c) The scale ratio $L_\alpha /L_B$ as a function of the system size $L_B/l_f$.

Table 1. Physical parameters of the thin-layer turbulent flows for the different system sizes under the same forcing and bottom friction conditions.

In this system, the energy $\epsilon_{i}$ injected at the forcing scale is dissipated by two mechanisms due to the large-scale friction $\epsilon _{\alpha }$ and viscosity $\epsilon _{\nu }$, respectively, i.e. $\epsilon _{i} = \epsilon _{\alpha }+\epsilon _{\nu }$, where $\epsilon _{\alpha }=\alpha u_{rms}^2$ and $\epsilon _{\nu }=\nu \omega _{rms}^2$. The energy injection rate $\epsilon _{i}$ can be estimated by the linear growth stage of the kinetic energy after switching on the forcing (Xia et al. Reference Xia, Shats and Falkovich2009), as shown in figure 2(a). Table 1 shows the energy budget of the turbulent flows for different cases of $L_B/l_f$. It is seen that more energy is dissipated by friction than by viscosity, i.e. $\epsilon _{\alpha }>\epsilon _{\nu }$, which facilitates the process of an inverse energy cascade. Moreover, the energy injection rate $\epsilon _{i}$ is larger than $\epsilon _{\alpha }+\epsilon _{\nu }$, which could be due to the additional dissipation by the boundaries $\epsilon _{bound}$ ($\approx \epsilon _{i}-\epsilon _{\alpha }-\epsilon _{\nu }$), although it is relatively weak and much smaller than $\epsilon_\alpha$. However, $\epsilon _{bound}$ does not seem to have a clear relationship with $L_B/l_f$.

In addition to the qualitative observations of spectral condensation from the regular vortex pattern, its more quantitative manifestation is the deviation of the spectrum from the classical $k^{-5/3}$ scaling in the inverse cascade range. The energy spectra for different system sizes $L_B/l_f$ are plotted in figure 3. It is surprising that the spectra show a similar pattern in all cases, i.e. a close to $k^{-3}$ scaling below the forcing wavenumber. In previous studies (Sommeria Reference Sommeria1986; Chertkov et al. Reference Chertkov, Connaughton, Kolokolov and Lebedev2007; Xia et al. Reference Xia, Punzmann, Falkovich and Shats2008), the $k^{-3}$ behaviour in the spectrum of the inverse cascade was taken as evidence for the occurrence of the spectral condensation. In this sense, the information conveyed by the flow patterns shown in figure 1, the scale ratio $L_\alpha /L_B$ in figure 2(c) and the energy spectra in figure 3 appear to be different. Specifically, $L_\alpha /L_B$ could predict the occurrence of the system-size vortex, but is not able to capture the spectral properties.

Figure 3. The energy spectra for different system sizes $L_B/l_f$.

Figure 4(a) illustrates the temporal evolution of the energy spectrum for the case $L_B/l_f = 16.8$ ($L_\alpha /L_B=0.87$). In the initial stages, the spectrum exhibits a $k^{-5/3}$ scaling, followed by a transition to a steeper $k^{-3}$ scaling. In current experiments, the inertial range of inverse cascade in the energy spectrum is not wider than half a decade, which seems to be the norm in all previous experiments (Sommeria Reference Sommeria1986; Paret & Tabeling Reference Paret and Tabeling1997; Xia et al. Reference Xia, Shats and Falkovich2009). Chertkov et al. (Reference Chertkov, Connaughton, Kolokolov and Lebedev2007) suggested that the $k^{-3}$ spectrum results from the presence of coherent structures and does not represent the turbulent velocity fluctuations involved in the cascade. It is noteworthy that the time evolution of the spectrum shown in figure 4(a) is consistent with the numerical findings of Chertkov et al. (Reference Chertkov, Connaughton, Kolokolov and Lebedev2007), despite the absence of a system-size vortex in our study with large $L_B/l_f$ (see figures 1ac). Furthermore, when the mean flow is subtracted, the spectrum of the velocity fluctuations, as depicted in figure 4(b), recovers a $k^{-5/3}$ scaling, in good agreement with previous studies (Chertkov et al. Reference Chertkov, Connaughton, Kolokolov and Lebedev2007; Xia et al. Reference Xia, Punzmann, Falkovich and Shats2008, Reference Xia, Shats and Falkovich2009).

Figure 4. (a) The time evolution of the energy spectrum for the case $L_B/l_f = 16.8$. (b) Comparison of energy spectra for the whole velocity field with those that contain only the fluctuation part for the two cases $L_B/l_f = 10.6$ and $L_B/l_f = 22.2$.

3.2. Effect of damping rate

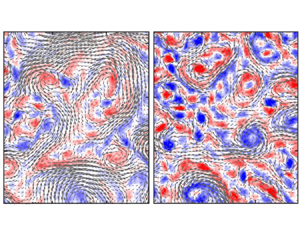
In this subsection, we investigate the effect of the damping rate $\gamma$ on flow patterns and spectral properties for large system sizes ($L_B/l_f>25$, $L_\alpha /L_B<1.0$). It is noted that due to $L_\alpha /L_B<1.0$, we refer to the configuration considered in this subsection as unbounded turbulence. Figures 5(a,d) show instantaneous snapshots of the vorticity field at moderate and low damping rates under the same forcing conditions and system size ($L_B/l_f=38.4$). Notably, the flow patterns differ significantly between the two damping rates. Specifically, for $\gamma = 5.7$, the intermediate-scale turbulent vortices coexist with the large-scale streamers, accompanied by several small vortices. In the case $\gamma = 8.8$, however, the length scales of the turbulent structures are smaller, and the vortices are stronger, indicated by the higher vorticity intensity. These observations are reasonable because the reduced bottom friction facilitates energy transfer to larger scales when the system size is sufficiently large.

Figure 5. The instantaneous snapshots of (a,d) the vorticity field and (b,e) energy-flux fields (filtering kernel size $r = 1.5l_f$) overlaid with the down-sampled velocity vectors for $L_B/l_f=38.4$ and $Re_f \approx 75$ at (a,b) low damping rate ($\gamma =5.7$) and (d,e) moderate damping rate ($\gamma =8.8$). Note that the flow fields in (a,b) are at the same instant shown with different contour maps, as in (d,e). (c) The energy-flux field that is observed 4.3 s subsequent to that in (b) or (a). The dashed-line rectangles in (b,c) show that the small-scale vortices are ‘swept out’ by the subsequent large-scale motions indicated by the bold arrow. ( f) Probability density functions (PDFs) of energy flux $\varPi ^{(1.5l_f)}$ for two damping rates; the inset plots the corresponding PDFs of normalized energy flux.

We implement the filter-space technique (Rivera et al. Reference Rivera, Daniel, Chen and Ecke2003; Chen et al. Reference Chen, Ecke, Eyink, Rivera, Wan and Xiao2006; Liao & Ouellette Reference Liao and Ouellette2013) to calculate the scale-to-scale energy transfer flux $\varPi ^{(r)}$ in physical space based on the filter velocity field with kernel width $r$. The energy flux $\varPi ^{(r)}$ is defined as $\varPi ^{(r)}=-\tau _{ij}^{(r)}s_{ij}^{(r)}$, where $\tau _{ij}^{(r)}=(u_iu_j)^{(r)}-u_i^{(r)}u_j^{(r)}$ and $s_{ij}^{(r)}=(\partial _{x_j}u_i^{(r)}+\partial _{x_i}u_j^{(r)})/2$ are the rate of strain and stress tensor, respectively. Likewise, the enstrophy transfer fluxes $Z^{(r)}=-\partial _{x_i}\omega ^{(r)}((u_i\omega )^{(r)}-u_i^{(r)}\omega ^{(r)})$ are calculated using the filter vorticity field. As with the previous definition, $\varPi ^{(r)}>0$ ($Z^{(r)}>0$) indicates energy (enstrophy) flux to smaller length scales, while $\varPi ^{(r)}<0$ ($Z^{(r)}<0$) denotes energy (enstrophy) flux towards larger scales. Figures 5(b,e) show the instantaneous snapshots of the energy transfer fluxes with $r = 1.5l_f$, i.e. $\varPi ^{(1.5l_f)}$, and figure 5f) shows the probability density functions (PDFs) of $\varPi ^{(1.5l_f)}$ for two damping rates. It can be seen that the alternating lobes of intense spectral energy flux are associated with strong vortices in the flow field (especially in figure 5e), which is consistent with previous studies (Xiao et al. Reference Xiao, Wan, Chen and Eyink2009; Liao & Ouellette Reference Liao and Ouellette2013). Moreover, one sees that the scale-to-scale energy transfers at $r = 1.5l_f$ for $\gamma = 8.8$ are much stronger than for $\gamma = 5.7$. This may seem counter-intuitive, as lower bottom friction would reasonably lead to a stronger inverse energy transfer. As shown in figures 5(b,c), the relatively small-scale vortices (inside the dashed rectangles) seem to be ‘eliminated’ by the subsequent large-scale turbulent structures (or called streamers, indicated by the green arrow), resulting in the weakening energy transfers at these scales. This aspect is illustrated more clearly in figure 6(a).

Figure 6. (a) Ensemble-averaged scale-to-scale energy and enstrophy (inset) transfer fluxes. (b) Energy spectra for different values of $\gamma$. Note that for all cases here, $Re_f= 75\pm 5$, $L_B/l_f=38.4$, and $L_\alpha /L_B$ is within the range 0.19–0.43.

Figure 6(a) plots the spatio-temporally averaged energy transfer fluxes $\langle {\varPi }^{(r)}\rangle$ as functions of $r/l_f$ for different damping rates $\gamma$. For all cases, $\langle {\varPi }^{(r)}\rangle \lesssim 0$ holds true, even at small scales. This indicates the dominant effect of the inverse energy transfers, which is also characterized by the negative-skewed PDFs shown in figure 5f). It is seen that the inverse energy flux for four larger $\gamma$ cases reaches a maximum at approximately the forcing scale ($r/l_f\approx 1.2$), consistent with previous studies (Rivera et al. Reference Rivera, Daniel, Chen and Ecke2003; Liao & Ouellette Reference Liao and Ouellette2013). However, for $\gamma = 5.7$, the peak value of the inverse energy flux occurs at $r/l_f\approx 4$ and is the smallest among the five cases. In addition, for $r/l_f<3$, the inverse energy flux decreases with decreasing damping rate, while an opposite trend is observed for $r/l_f>3$. Figure 6(a) suggests that although turbulent structures can grow larger at smaller damping rates (as evidenced by the large-scale streamers shown in figures 5ac), the existence of these large-scale coherent structures suppresses the energy flux in the intermediate scales. Moreover, this suppression effect also leads to the reduced enstrophy flux below the forcing scale, as shown in the inset of figure 6(a).

Figure 6(b) illustrates the effect of damping rate $\gamma$ on the spectral properties of the quasi-2-D unbounded turbulence. Notably, the fine scales ($k\gtrsim 1000$ m$^{-1}$) dominated by viscous dissipation are nearly unaffected by the large-scale friction, which could be expected. Conversely, the kinetic energy around the forcing wavenumber is diminished as $\gamma$ decreases. This observation is consistent with the behaviour of enstrophy and energy fluxes with respect to $\gamma$, as illustrated in figure 6(a). Furthermore, we found that with the decrease of $\gamma$, the spectrum in the enstrophy inertial range becomes flatter (as a result of reduced kinetic energy at intermediate scales) and approaches the theoretical prediction of $k^{-3}$ (Kraichnan Reference Kraichnan1967; Boffetta & Musacchio Reference Boffetta and Musacchio2010). This trend aligns with previous experiments (Boffetta et al. Reference Boffetta, Cenedese, Espa and Musacchio2005). The steepening of the energy spectrum in the enstrophy inertial range has been observed commonly in previous studies, and potential causes include the presence of viscous dissipation (Tran & Bowman Reference Tran and Bowman2004), the existence of large-scale long-lived vortices (Kramer et al. Reference Kramer, Keetels, Clercx and van Heijst2011), and linear damping (Boffetta et al. Reference Boffetta, Cenedese, Espa and Musacchio2005). However, our experimental results indicate that it is the suppression of small-scale turbulence by large-scale coherent structures that leads to the spectrum in the forward enstrophy cascade approaching $k^{-3}$.

The spectral properties in the inverse energy cascade are now being analysed. With a large damping rate ($\gamma =13.9$), the energy spectrum is observed to be flatter than $k^{-5/3}$ despite the presence of strong inverse energy transfers (as seen in figure 6a). This deviation indicates that the energy flux is strongly influenced by the bottom damping and undergoes significant changes within the energy cascade range. As $\gamma$ decreases, the energy spectrum gradually recovers the classical $k^{-5/3}$ scaling. Further reduction in the damping rate to $\gamma =5.7$ leads to a steeper spectrum close to $k^{-3}$, which is usually taken as evidence for the occurrence of spectral condensation. It is worth noting that the ratio $L_\alpha /L_B$ for all cases shown in figure 6 is in the range 0.19–0.43, which is notably smaller than 1.0.

To further investigate the scaling behaviour of the spectrum in the inverse cascade range, the scaling exponent $\zeta _{IC}$ is determined by least squares fitting for different cases of damping rate, as depicted in figure 7. The inset of figure 7(a) plots $\zeta _{IC}$ as functions of $L_\alpha /L_B$ for various $L_B/l_f$. Interestingly, the transition of the spectrum from the classical $k^{-5/3}$ scaling to the $k^{-3}$ scaling occurs at different values of $L_\alpha /L_B$, all of which are smaller than 1.0. Furthermore, it has been demonstrated in § 3.1 that the system size $L_B/l_f$ has little impact on the spectral properties. These findings challenge the existing understanding of spectral condensation, which says that condensation would not be expected for $L_\alpha /L_B < 1.0$ (Danilov & Gurarie Reference Danilov and Gurarie2000; Boffetta & Musacchio Reference Boffetta and Musacchio2010; Alexakis & Biferale Reference Alexakis and Biferale2018). Therefore, $L_\alpha /L_B$ may not be a suitable parameter for predicting the occurrence of spectral condensation.

Figure 7. The exponent $\zeta _{IC}$ of the spectrum in the inverse cascade range as functions of two dimensionless parameters: (a) $\gamma$ and (b) $\lambda /l_f$. The data points in the present experiments (solid circles) are coloured by $Re_f$. The data from previous thin-layer turbulence experiments are also shown as hollow symbols for comparison, and their key parameters are listed in table 2. The inset in (a) shows $\zeta _{IC}$ as a function of $L_\alpha /L_B$ with different $L_B/l_f$: 38.4 (circles), 29.8 (left triangles), 27.7 (upper triangles) and 26.0 (hexagrams), and the thin dashed lines indicate that there is no universal value of $L_\alpha /L_B$ for the spectral transition. The inset in (b) shows $\lambda /l_f$ as a function of $\gamma$; the data shown by asterisks are from the soap-film experiments (Rivera et al. Reference Rivera, Vorobieff and Ecke1998; Rivera & Wu Reference Rivera and Wu2002; Zhou et al. Reference Zhou, Fang, Ouellette and Xu2020); the grey dash-dotted line denotes $\lambda /l_f\propto \gamma ^{-1.2}$.

Table 2. Parameters of thin-layer quasi-2-D turbulence. The sources are (a) Paret & Tabeling (Reference Paret and Tabeling1997), (b) Xia et al. (Reference Xia, Punzmann, Falkovich and Shats2008, Reference Xia, Francois, Punzmann, Byrne and Shats2016), (c) Rivera & Ecke (Reference Rivera and Ecke2016), and (d) present work (only the cases $L_\alpha /L_B<1.0$ are shown). The last row denotes whether a steepened spectrum in the inverse cascade range is observed in the corresponding parameter space.

As shown in figure 7(a), we observe a transition in the scaling exponent $\zeta _{IC}$ from $-$5/3 to $-$3 at $\gamma \approx 6.8$. This value of $\gamma$ agrees to a certain degree with the numerical studies of Doludenko et al. (Reference Doludenko, Fortova, Kolokolov and Lebedev2022), in which $\gamma \approx 10$ is considered as a critical value for distinguishing the chaotic state and the coherent vortex state in 2-D turbulence. Furthermore, the results from the studies by Xia et al. (Reference Xia, Punzmann, Falkovich and Shats2008, Reference Xia, Francois, Punzmann, Byrne and Shats2016), using a similar forcing scale ($l_f = 10$ mm) in their experiments, demonstrate consistency with the observed trends in our data. However, the data from Paret & Tabeling (Reference Paret and Tabeling1997) ($l_f=15$ mm) and Rivera & Ecke (Reference Rivera and Ecke2016) ($l_f=18$ mm) appear to be inconsistent with our findings. This inconsistency suggests that $\gamma = \alpha l_f^2/\nu$, which incorporates the effect of $l_f$ (or $l_f^2$), may not be the best quantity for describing spectral properties, as the forcing scale itself does not play a crucial role in the energy flux when $L_B/l_f \gg 1.0$ (Paret & Tabeling Reference Paret and Tabeling1998; Xia et al. Reference Xia, Punzmann, Falkovich and Shats2008; Fang & Ouellette Reference Fang and Ouellette2021). Nevertheless, the relative strength of bottom friction to viscous dissipation, represented by the ratio $\alpha /\nu$, was found to have a crucial impact on the spectral properties.

We have seen a reduction in vorticity intensity $\varOmega$ as the damping rate $\gamma$ decreases, as shown in figures 5(a,d). Consequently, we can expect an increase in the Taylor microscale ($\lambda =\sqrt {E_0/\varOmega }=u_{rms}/\omega _{rms}$) with decreasing $\gamma$, which is demonstrated in the inset of figure 7(b). Specifically, the dimensionless Taylor microscale $\lambda /l_f$ presents a monotonic dependence on the damping rate, with a scaling $\lambda /l_f\propto \gamma ^{-1.2}$. The reason for this scaling is currently unclear and requires further research in the future. To shed some light on the transition in $\zeta _{IC}$, we plot it as a function of the ratio $\lambda /l_f$ in figure 7(b). Interestingly, we find that data from this work and from previous experimental studies, following a consistent trend, undergo a transition from $-5/3$ to $-3$ at $\lambda /l_f\approx 0.63$, and saturate when $\lambda /l_f\approx 1.0$. It may not be surprising that the Taylor microscale is able to capture certain spectral properties, as both $E_0$ and $\varOmega$ are integrals of the energy spectrum. However, this does not explain why the transition occurs specifically at $\lambda /l_f\approx 0.63$. Recalling that the suppression of intermediate scales (at approximately the forcing scale) by the large-scale structures leads to the variation of energy flux and spectral properties (see figures 5 and 6), it is natural to ask when this suppression comes into play. One possibility is that the suppression effect becomes significant when the large-scale streamers are stronger than the force-fed vortices, resulting in the latter being submerged or swept away by the former. As a result, the kinetic energy and energy flux at intermediate scales are remarkably diminished. In the current configuration of unbounded turbulence, the coherent structures manifest as large-scale streamers, and their strength can be characterized by $u_{rms}$, while the strength of forcing-scale vortices is represented by $\omega _{rms}$ (which is manifested by the enstrophy spectrum peaking at the forcing scale). Therefore, the condition for the dominant role of this suppression effect could be expressed as $u_{rms}>\omega _{rms}\times l_f/2$ (where $l_f/2$ is the radius of the forcing-scale vortices), i.e. $\lambda /l_f>0.5$. This argument agrees well with the observation in figure 7(b).

Additionally, it is noteworthy that the above argument is also applicable to 2-D soap-film experiments, in which the damping rate is relatively large. In previous studies of soap-film turbulence, the dimensionless Taylor microscale $\lambda /l_f$ did not exceed 0.4 (see the inset of figure 7b) (Rivera et al. Reference Rivera, Vorobieff and Ecke1998; Rivera & Wu Reference Rivera and Wu2002), notably smaller than the critical value 0.63. Correspondingly, the energy spectrum in the inverse cascade of soap-film turbulence is relatively flatter than $k^{-5/3}$, or there is no net inverse energy transfer (Rivera & Wu Reference Rivera and Wu2002; Cerbus & Goldburg Reference Cerbus and Goldburg2013; Zhou et al. Reference Zhou, Fang, Ouellette and Xu2020). Therefore, spectral condensation is not expected in these experiments. From this perspective, the dimensionless Taylor microscale $\lambda /l_f$ appears to be a valuable diagnostic parameter for characterizing the extent of inverse energy cascade and indicating the occurrence of spectral condensation in (quasi-)2-D turbulence experiments. We stress, however, that there is no causality here between the Taylor microscale and spectral condensation, and it is only their correlation (see figure 7b) that allows us to use the former as a diagnostic indicator of the latter.

3.3. Discussion

As mentioned above, we observe a suppression effect of large-scale motions on small-scale turbulence when the damping rate is low. In previous experiments, a similar suppression effect was reported in bounded thin-layer turbulence (Shats, Xia & Punzmann Reference Shats, Xia and Punzmann2005; Shats et al. Reference Shats, Xia, Punzmann and Falkovich2007), where a self-generated or externally imposed system-size vortex suppressed the energy flux through shearing and sweeping of the forcing-scale turbulent vortices. In the present configuration, however, this sweeping effect occurs in unbounded turbulence, and is caused by the large-scale streamers rather than a vortex spanning the entire system. As indicated by the dashed rectangle and green arrow in figures 5(b,c), one can observe that the forcing-scale vortices are ‘swept out’ by the large-scale streamers. This suppression mechanism likely arises from the non-local interaction between the large-scale and small-scale turbulent structures in either 2-D or 3-D turbulence (Balk et al. Reference Balk, Zakharov and Nazarenko1990; Alexakis et al. Reference Alexakis, Mininni and Pouquet2005), which contrasts with the locality of energy transfers in previous inverse cascade theory (Xiao et al. Reference Xiao, Wan, Chen and Eyink2009). However, measuring directly this non-local interaction in 2-D inverse cascade by experiments poses challenges and warrants further investigation in future studies.

On the other hand, the Taylor microscale resides between the integral length scale (large-scale eddies) and the Kolmogorov scale (small-scale eddies). As pointed out by Frisch (Reference Frisch1995), the physical meaning of the Taylor microscale in turbulence is somewhat ambiguous. One of the views is that the Taylor microscale provides an upper bound to the scales at which the inter-scale/space energy exchanges are dominated by viscous diffusion (Valente & Vassilicos Reference Valente and Vassilicos2015). Generally, the Taylor microscale is defined as $\lambda =\sqrt {\langle \boldsymbol {u}^2\rangle /\langle (\boldsymbol {\nabla } \boldsymbol {u})^2\rangle }$ (see equation (5.8) in Frisch Reference Frisch1995), which by definition is a mixture of both large-scale information (through the velocity scale $\boldsymbol {u}$) and small-scale information (by means of velocity gradients $\boldsymbol {\nabla } \boldsymbol {u}$). In this sense, the Taylor microscale reflects the connection across scales in some way, e.g. the non-local interaction across scales. Our experimental results seem to confirm this viewpoint. We found that with the decrease of damping rate, the vorticity intensity (velocity gradient) decreases because the large-scale streamers produced via inverse energy cascade suppress the intense vortices, leading to an increase of Taylor microscale, and subsequently $\lambda /l_f>0.5$.

In 3-D turbulence, however, Taylor microscale is usually much smaller than the forcing scale, i.e. $\lambda /l_f<0.1$. Indeed, it is generally believed that the locality of 3-D turbulence is stronger than that of 2-D turbulence (Boffetta & Ecke Reference Boffetta and Ecke2012). So far, there is a lack of experimentally accessible quantity to characterize the non-localness in either 2-D or 3-D turbulence. According to the argument given in the above paragraph, the Taylor microscale could be used to characterize the degree of non-localness of turbulence, in either 2-D or 3-D.

4. Conclusions

The criterion $L_\alpha /L_B>1$ has been used theoretically to predict the formation of spectral condensation associated with the two characteristic manifestations, i.e. the steepened spectrum and the appearance of a system-size vortex. However, previous experiments have raised questions about the suitability of this criterion, and moreover the two manifestations do not always occur simultaneously (Xia et al. Reference Xia, Shats and Falkovich2009; Fang & Ouellette Reference Fang and Ouellette2021). In the present study, we have investigated systematically the flow patterns, spectral properties and energy fluxes in quasi-2-D turbulence. The system size $L_B/l_f$ and damping rate $\gamma$ are chosen as two main variables in the experiments.

When varying $L_B/l_f$ while keeping the forcing and bottom friction unchanged, the flow patterns differed significantly. For small $L_B/l_f$ (bounded turbulence, $L_\alpha /L_B \geq 1.0$), the flow field was dominated by a system-size vortex, while for larger $L_B/l_f$ (unbounded turbulence, $L_\alpha /L_B < 1.0$), there exist large-scale streamers coexisting with several small-scale vortices. Despite the difference in flow patterns, the energy spectra for all the above cases exhibited consistently a scaling of $k^{-3}$. Moreover, it is found that for various $L_B/l_f$ and $\gamma$, there is no universal value of $L_\alpha /L_B$ for the spectral transition from $k^{-5/3}$ to $k^{-3}$. This suggests that $L_\alpha /L_B$ may not be a reliable indicator for spectral condensation, although $L_\alpha /L_B$ can indeed predict the appearance of the system-sized vortex.

The observed properties of the steepened spectra and the occurrence of large-scale streamers in unbounded turbulence are further verified through an examination of the effects of damping rate $\gamma$. In the instantaneous flow fields at low damping rates, only a few forcing-scale vortices were present. It was observed that the small-scale vortices were ‘swept out’ by the large-scale streamers. This observation suggests that the presence of large-scale streamers, facilitated by a sufficiently inverse cascade, suppresses the formation of small-scale vortices. Consequently, this suppression leads to changes in both the intensity of energy flux at intermediate scales and the shape of the energy spectrum.

The damping rate $\gamma$ has an impact on the distribution of turbulent structures (Doludenko et al. Reference Doludenko, Fortova, Kolokolov and Lebedev2022). For this reason, $\gamma$ can be used to describe the spectral properties. Furthermore, the occurrence of spectral transition is closely related to the suppression effect. We propose that the suppression effect becomes prominent when the strength of large-scale streamers exceeds that of the forcing-scale vortices, specifically when $\lambda /l_f>0.5$. This argument agrees to a very good degree with the observation that the spectral transition occurs at $\lambda /l_f\approx 0.63$. Furthermore, considering that the suppression effect is associated with the non-local interaction between large and small scales in either 3-D or 2-D turbulence, the present results led us to consider the dimensionless Taylor microscale $\lambda /l_f$ as a useful parameter for characterizing the degree of non-localness of turbulence. In particular, in 2-D turbulence, the Taylor microscale could be used to diagnostically characterize the degree of inverse energy cascade and predict the occurrence of spectral condensation.

It is important to emphasize that the spectral condensation discussed in this study differs from Kraichnan's original concept. The friction-dominated scale $L_\alpha$, which was previously regarded as an important control parameter for spectral condensation, is correlated with $u_{rms}$ or the effect of $Re_f$. However, our work demonstrates that the occurrence of spectral condensation is nearly independent of $Re_f$ within the tested range (see figure 7). A numerical study (De Wit et al. Reference De Wit, van Kan and Alexakis2022) has also suggested that the finite system size and finite $Re_f$ do not affect the bistability of the large-scale dynamics in quasi-2-D turbulence. In fact, it can be expected that the suppression of small-scale turbulent eddies by large-scale structures (vortices or streamers) is neither a finite-size nor an $Re_f$ effect. Therefore, in unbounded turbulence with low damping rates, the observation of a steepened spectrum resulting from this suppression effect is reasonable.

To recap, with fixed forcing and low-damping conditions, we observe long streamers when the system size is larger than the friction-dominated scale, while a domain-sized vortex is observed in the opposite case, i.e. the the system becomes smaller than the friction-dominated scale. For both of these flow patterns, however, a $k^{-3}$ spectrum is observed, which is taken as evidence for spectral condensation. This finding suggests that a finite domain size may not be a necessary prerequisite for the occurrence of spectral condensation. We further find evidence that the underlying mechanism responsible for the spectral condensation – or more strictly speaking, the steepened spectrum – may lie in the suppression effect of the large-scale structures generated via inverse cascade on the intermediate scales, rather than the accumulation of energy at the domain size.

Acknowledgements

We appreciate H. Xia, L. Biferale, C. Sun, L. Fang for insightful discussions.

Funding

This work was supported by the National Natural Science Foundation of China (NSFC) (grant nos. 12102167, 12232010, 12072144, 92052102, 12272006 and 42361144844) and the China Postdoctoral Science Foundation (grant no. 2021M701580).

Declaration of interests

The authors report no conflict of interest.

References

Alexakis, A. & Biferale, L. 2018 Cascades and transitions in turbulent flows. Phys. Rep. 767, 1101.10.1016/j.physrep.2018.08.001CrossRefGoogle Scholar
Alexakis, A., Mininni, P.D. & Pouquet, A. 2005 Imprint of large-scale flows on turbulence. Phys. Rev. Lett. 95 (26), 264503.10.1103/PhysRevLett.95.264503CrossRefGoogle ScholarPubMed
Balk, A.M., Zakharov, V.E. & Nazarenko, S.V. 1990 Nonlocal turbulence of drift waves. Sov. Phys. JETP 71 (2), 249260.Google Scholar
Biglari, H., Diamond, P.H. & Terry, P.W. 1990 Influence of sheared poloidal rotation on edge turbulence. Phys. Fluids 2 (1), 14.10.1063/1.859529CrossRefGoogle Scholar
Boffetta, G., Cenedese, A., Espa, S. & Musacchio, S. 2005 Effects of friction on 2D turbulence: an experimental study of the direct cascade. Europhys. Lett. 71 (4), 590.10.1209/epl/i2005-10111-6CrossRefGoogle Scholar
Boffetta, G. & Ecke, R.E. 2012 Two-dimensional turbulence. Annu. Rev. Fluid Mech. 44, 427451.10.1146/annurev-fluid-120710-101240CrossRefGoogle Scholar
Boffetta, G. & Musacchio, S. 2010 Evidence for the double cascade scenario in two-dimensional turbulence. Phys. Rev. E 82 (1), 016307.CrossRefGoogle ScholarPubMed
Burgess, B.H., Dritschel, D.G. & Scott, R.K. 2017 Vortex scaling ranges in two-dimensional turbulence. Phys. Fluids 29 (11), 111104.10.1063/1.4993144CrossRefGoogle Scholar
Burgess, B.H. & Scott, R.K. 2017 Scaling theory for vortices in the two-dimensional inverse energy cascade. J. Fluid Mech. 811, 742756.10.1017/jfm.2016.756CrossRefGoogle Scholar
Cerbus, R.T. & Goldburg, W.I. 2013 Intermittency in 2D soap film turbulence. Phys. Fluids 25 (10), 105111.10.1063/1.4824658CrossRefGoogle Scholar
Chen, S.-Y., Ecke, R.E., Eyink, G.L., Rivera, M., Wan, M.-P. & Xiao, Z.-L. 2006 Physical mechanism of the two-dimensional inverse energy cascade. Phys. Rev. Lett. 96 (8), 084502.10.1103/PhysRevLett.96.084502CrossRefGoogle ScholarPubMed
Chertkov, M., Connaughton, C., Kolokolov, I. & Lebedev, V. 2007 Dynamics of energy condensation in two-dimensional turbulence. Phys. Rev. Lett. 99 (8), 084501.10.1103/PhysRevLett.99.084501CrossRefGoogle ScholarPubMed
Clercx, H.J.H., Van Heijst, G.J.F. & Zoeteweij, M.L. 2003 Quasi-two-dimensional turbulence in shallow fluid layers: the role of bottom friction and fluid layer depth. Phys. Rev. E 67 (6), 066303.10.1103/PhysRevE.67.066303CrossRefGoogle ScholarPubMed
Danilov, S.D. & Gurarie, D. 2000 Quasi-two-dimensional turbulence. Phys.-Uspekhi 43 (9), 863900.CrossRefGoogle Scholar
De Wit, X.M., van Kan, A. & Alexakis, A. 2022 Bistability of the large-scale dynamics in quasi-two-dimensional turbulence. J. Fluid Mech. 939, R2.10.1017/jfm.2022.209CrossRefGoogle Scholar
Doludenko, A.N., Fortova, S.V., Kolokolov, I.V. & Lebedev, V.V. 2022 Coherent vortex versus chaotic state in two-dimensional turbulence. Ann. Phys. 447, 169072.10.1016/j.aop.2022.169072CrossRefGoogle Scholar
Falkovich, G. 2016 Interaction between mean flow and turbulence in two dimensions. Proc. Math. Phys. Engng 472 (2191), 20160287.Google ScholarPubMed
Fang, L. & Ouellette, N.T. 2017 Multiple stages of decay in two-dimensional turbulence. Phys. Fluids 29 (11), 111105.10.1063/1.4996776CrossRefGoogle Scholar
Fang, L. & Ouellette, N.T. 2021 Spectral condensation in laboratory two-dimensional turbulence. Phys. Rev. Fluids 6 (10), 104605.CrossRefGoogle Scholar
Fontane, J., Dritschel, D.G. & Scott, R.K. 2013 Vortical control of forced two-dimensional turbulence. Phys. Fluids 25 (1), 015101.CrossRefGoogle Scholar
Francois, N., Xia, H., Punzmann, H. & Shats, M. 2018 Rectification of chaotic fluid motion in two-dimensional turbulence. Phys. Rev. Fluids 3 (12), 124602.10.1103/PhysRevFluids.3.124602CrossRefGoogle Scholar
Frisch, U. 1995 Turbulence: The Legacy of A.N. Kolmogorov. Cambridge University Press.CrossRefGoogle Scholar
Frishman, A. 2017 The culmination of an inverse cascade: mean flow and fluctuations. Phys. Fluids 29 (12), 125102.CrossRefGoogle Scholar
Frishman, A., Laurie, J. & Falkovich, G. 2017 Jets or vortices – what flows are generated by an inverse turbulent cascade? Phys. Rev. Fluids 2 (3), 032602.CrossRefGoogle Scholar
Goldburg, W.I., Cressman, J.R., Vörös, Z., Eckhardt, B. & Schumacher, J. 2001 Turbulence in a free surface. Phys. Rev. E 63 (6), 065303.10.1103/PhysRevE.63.065303CrossRefGoogle Scholar
Jiménez, J. 2020 Dipoles and streams in two-dimensional turbulence. J. Fluid Mech. 904, A39.10.1017/jfm.2020.769CrossRefGoogle Scholar
van Kan, A. & Alexakis, A. 2019 Condensates in thin-layer turbulence. J. Fluid Mech. 864, 490518.CrossRefGoogle Scholar
Kolokolov, I.V. & Lebedev, V.V. 2020 Coherent vortex in two-dimensional turbulence: interplay of viscosity and bottom friction. Phys. Rev. E 102 (2), 023108.10.1103/PhysRevE.102.023108CrossRefGoogle ScholarPubMed
Kraichnan, R.H. 1967 Inertial ranges in two-dimensional turbulence. Phys. Fluids 10 (7), 14171423.CrossRefGoogle Scholar
Kramer, W., Keetels, G.H., Clercx, H.J.H. & van Heijst, G.J.F. 2011 Structure-function scaling of bounded two-dimensional turbulence. Phys. Rev. E 84 (2), 026310.10.1103/PhysRevE.84.026310CrossRefGoogle ScholarPubMed
Lee, T.D. 1951 Difference between turbulence in a two-dimensional fluid and in a three-dimensional fluid. J. Appl. Phys. 22 (4), 524524.10.1063/1.1699997CrossRefGoogle Scholar
Liao, Y. & Ouellette, N.T. 2013 Spatial structure of spectral transport in two-dimensional flow. J. Fluid Mech. 725, 281298.10.1017/jfm.2013.187CrossRefGoogle Scholar
Lilly, D.K. 1972 Numerical simulation studies of two-dimensional turbulence: I. Models of statistically steady turbulence. Geophys. Fluid Dyn. 3 (4), 289319.CrossRefGoogle Scholar
Lovecchio, S., Zonta, F. & Soldati, A. 2015 Upscale energy transfer and flow topology in free-surface turbulence. Phys. Rev. E 91 (3), 033010.CrossRefGoogle ScholarPubMed
McWilliams, J.C. 1984 The emergence of isolated coherent vortices in turbulent flow. J. Fluid Mech. 146, 2143.CrossRefGoogle Scholar
McWilliams, J.C. 1990 A demonstration of the suppression of turbulent cascades by coherent vortices in two-dimensional turbulence. Phys. Fluids 2 (4), 547552.10.1063/1.857755CrossRefGoogle Scholar
Nazarenko, S. & Laval, J.-P. 2000 Non-local two-dimensional turbulence and Batchelor's regime for passive scalars. J. Fluid Mech. 408, 301321.10.1017/S0022112099007922CrossRefGoogle Scholar
Paret, J. & Tabeling, P. 1997 Experimental observation of the two-dimensional inverse energy cascade. Phys. Rev. Lett. 79 (21), 41624165.CrossRefGoogle Scholar
Paret, J. & Tabeling, P. 1998 Intermittency in the two-dimensional inverse cascade of energy: experimental observations. Phys. Fluids 10 (12), 31263136.10.1063/1.869840CrossRefGoogle Scholar
Rivera, M., Vorobieff, P. & Ecke, R.E. 1998 Turbulence in flowing soap films: velocity, vorticity, and thickness fields. Phys. Rev. Lett. 81 (7), 14171420.CrossRefGoogle Scholar
Rivera, M. & Wu, X.-L. 2002 Homogeneity and the inertial range in driven two-dimensional turbulence. Phys. Fluids 14 (9), 30983108.CrossRefGoogle Scholar
Rivera, M., Wu, X.-L. & Yeung, C. 2001 Universal distribution of centers and saddles in two-dimensional turbulence. Phys. Rev. Lett. 87 (4), 044501.CrossRefGoogle ScholarPubMed
Rivera, M.K., Daniel, W.B., Chen, S.-Y. & Ecke, R.E. 2003 Energy and enstrophy transfer in decaying two-dimensional turbulence. Phys. Rev. Lett. 90 (10), 104502.10.1103/PhysRevLett.90.104502CrossRefGoogle ScholarPubMed
Rivera, M.K. & Ecke, R.E. 2016 Lagrangian statistics in weakly forced two-dimensional turbulence. Chaos 26 (1), 013103.CrossRefGoogle ScholarPubMed
Scarano, F. & Riethmuller, M.L. 2000 Advances in iterative multigrid PIV image processing. Exp. Fluids 29 (Suppl 1), S051S060.CrossRefGoogle Scholar
Schumacher, J. 2003 Probing surface flows with Lagrangian tracers. Prog. Theor. Phys. Suppl. 150, 255266.CrossRefGoogle Scholar
Scott, R.K. 2007 Nonrobustness of the two-dimensional turbulent inverse cascade. Phys. Rev. E – Stat. Nonlinear Soft Matt. Phys. 75 (4), 046301.10.1103/PhysRevE.75.046301CrossRefGoogle ScholarPubMed
Shaing, K.-C., Crume, E.C. Jr. & Houlberg, W.A. 1990 Bifurcation of poloidal rotation and suppression of turbulent fluctuations: a model for the L–H transition in tokamaks. Phys. Fluids 2 (6), 14921498.10.1063/1.859473CrossRefGoogle Scholar
Shats, M.G., Xia, H. & Punzmann, H. 2005 Spectral condensation of turbulence in plasmas and fluids and its role in low-to-high phase transitions in toroidal plasma. Phys. Rev. E 71 (4), 046409.10.1103/PhysRevE.71.046409CrossRefGoogle ScholarPubMed
Shats, M.G., Xia, H., Punzmann, H. & Falkovich, G. 2007 Suppression of turbulence by self-generated and imposed mean flows. Phys. Rev. Lett. 99 (16), 164502.CrossRefGoogle ScholarPubMed
Sommeria, J. 1986 Experimental study of the two-dimensional inverse energy cascade in a square box. J. Fluid Mech. 170, 139168.CrossRefGoogle Scholar
Suri, B., Tithof, J., Mitchell, R., Grigoriev, R.O. & Schatz, M.F. 2014 Velocity profile in a two-layer Kolmogorov-like flow. Phys. Fluids 26 (5), 053601.10.1063/1.4873417CrossRefGoogle Scholar
Tithof, J., Martell, B.C. & Kelley, D.H. 2018 Three-dimensionality of one-and two-layer electromagnetically driven thin-layer flows. Phys. Rev. Fluids 3 (6), 064602.10.1103/PhysRevFluids.3.064602CrossRefGoogle Scholar
Tran, C.V. & Bowman, J.C. 2004 Robustness of the inverse cascade in two-dimensional turbulence. Phys. Rev. E 69 (3), 036303.10.1103/PhysRevE.69.036303CrossRefGoogle ScholarPubMed
Valente, P.C. & Vassilicos, J.C. 2015 The energy cascade in grid-generated non-equilibrium decaying turbulence. Phys. Fluids 27 (4), 045103.10.1063/1.4916628CrossRefGoogle Scholar
Xia, H., Byrne, D., Falkovich, G. & Shats, M.G. 2011 Upscale energy transfer in thick turbulent fluid layers. Nat. Phys. 7 (4), 321324.CrossRefGoogle Scholar
Xia, H., Francois, N., Punzmann, H., Byrne, D. & Shats, M.G. 2016 Simultaneous observation of energy and enstrophy cascades in thin-layer turbulence. In International Journal of Modern Physics: Conference Series, vol. 42, 1660185. World Scientific.10.1142/S201019451660185XCrossRefGoogle Scholar
Xia, H., Punzmann, H., Falkovich, G. & Shats, M.G. 2008 Turbulence–condensate interaction in two dimensions. Phys. Rev. Lett. 101 (19), 194504.CrossRefGoogle ScholarPubMed
Xia, H. & Shats, M. 2012 Structure formation in spectrally condensed turbulence. In International Journal of Modern Physics: Conference Series, vol. 19, pp. 257–261. World Scientific.CrossRefGoogle Scholar
Xia, H., Shats, M.G. & Falkovich, G. 2009 Spectrally condensed turbulence in thin layers. Phys. Fluids 21 (12), 125101.CrossRefGoogle Scholar
Xiao, Z.-L., Wan, M.-P., Chen, S.-Y. & Eyink, G.L. 2009 Physical mechanism of the inverse energy cascade of two-dimensional turbulence: a numerical investigation. J. Fluid Mech. 619, 144.CrossRefGoogle Scholar
Yang, J. 2021 Finite-size anisotropic particles in two-dimensional turbulent flows. PhD thesis, The Australian National University (Australia).Google Scholar
Yang, J., Davoodianidalik, M., Xia, H., Punzmann, H., Shats, M. & Francois, N. 2019 Passive propulsion in turbulent flows. Phys. Rev. Fluids 4 (10), 104608.10.1103/PhysRevFluids.4.104608CrossRefGoogle Scholar
Zhou, Z.-Y., Fang, L., Ouellette, N.T. & Xu, H.-T. 2020 Vorticity gradient stretching in the direct enstrophy transfer process of two-dimensional turbulence. Phys. Rev. Fluids 5 (5), 054602.CrossRefGoogle Scholar
Zhu, H.-Y., Xie, J.-H. & Xia, K.-Q. 2023 Circulation in quasi-2D turbulence: experimental observation of the area rule and bifractality. Phys. Rev. Lett. 130 (21), 214001.10.1103/PhysRevLett.130.214001CrossRefGoogle ScholarPubMed
Figure 0

Figure 1. The instantaneous vorticity fields $\omega$ overlaid with the down-sampled velocity vectors under the same forcing and bottom damping in the cases of different system sizes: (a) $L_B/l_f = 29.9$, (b) $L_B/l_f = 22.2$, (c) $L_B/l_f = 16.8$, (d) $L_B/l_f = 13.2$, (e) $L_B/l_f = 10.6$.

Figure 1

Figure 2. (a) The time evolution of the kinetic energy $E(t)$. The red dashed line denotes the linear growth stage after the forcing is switched on, which can be used to estimate the energy injection rate $\epsilon _{i}={\rm d}E/{\rm d}t$, and the blue dotted curve denotes the exponential decay after the forcing is switched off, i.e. $E\propto {\rm e}^{-2\alpha t}$, from which $\alpha$ can be estimated. (b) The proportion of kinetic energy in the mean flow field $E_m/E_0$. (c) The scale ratio $L_\alpha /L_B$ as a function of the system size $L_B/l_f$.

Figure 2

Table 1. Physical parameters of the thin-layer turbulent flows for the different system sizes under the same forcing and bottom friction conditions.

Figure 3

Figure 3. The energy spectra for different system sizes $L_B/l_f$.

Figure 4

Figure 4. (a) The time evolution of the energy spectrum for the case $L_B/l_f = 16.8$. (b) Comparison of energy spectra for the whole velocity field with those that contain only the fluctuation part for the two cases $L_B/l_f = 10.6$ and $L_B/l_f = 22.2$.

Figure 5

Figure 5. The instantaneous snapshots of (a,d) the vorticity field and (b,e) energy-flux fields (filtering kernel size $r = 1.5l_f$) overlaid with the down-sampled velocity vectors for $L_B/l_f=38.4$ and $Re_f \approx 75$ at (a,b) low damping rate ($\gamma =5.7$) and (d,e) moderate damping rate ($\gamma =8.8$). Note that the flow fields in (a,b) are at the same instant shown with different contour maps, as in (d,e). (c) The energy-flux field that is observed 4.3 s subsequent to that in (b) or (a). The dashed-line rectangles in (b,c) show that the small-scale vortices are ‘swept out’ by the subsequent large-scale motions indicated by the bold arrow. ( f) Probability density functions (PDFs) of energy flux $\varPi ^{(1.5l_f)}$ for two damping rates; the inset plots the corresponding PDFs of normalized energy flux.

Figure 6

Figure 6. (a) Ensemble-averaged scale-to-scale energy and enstrophy (inset) transfer fluxes. (b) Energy spectra for different values of $\gamma$. Note that for all cases here, $Re_f= 75\pm 5$, $L_B/l_f=38.4$, and $L_\alpha /L_B$ is within the range 0.19–0.43.

Figure 7

Figure 7. The exponent $\zeta _{IC}$ of the spectrum in the inverse cascade range as functions of two dimensionless parameters: (a) $\gamma$ and (b) $\lambda /l_f$. The data points in the present experiments (solid circles) are coloured by $Re_f$. The data from previous thin-layer turbulence experiments are also shown as hollow symbols for comparison, and their key parameters are listed in table 2. The inset in (a) shows $\zeta _{IC}$ as a function of $L_\alpha /L_B$ with different $L_B/l_f$: 38.4 (circles), 29.8 (left triangles), 27.7 (upper triangles) and 26.0 (hexagrams), and the thin dashed lines indicate that there is no universal value of $L_\alpha /L_B$ for the spectral transition. The inset in (b) shows $\lambda /l_f$ as a function of $\gamma$; the data shown by asterisks are from the soap-film experiments (Rivera et al.1998; Rivera & Wu 2002; Zhou et al.2020); the grey dash-dotted line denotes $\lambda /l_f\propto \gamma ^{-1.2}$.

Figure 8

Table 2. Parameters of thin-layer quasi-2-D turbulence. The sources are (a) Paret & Tabeling (1997), (b) Xia et al. (2008, 2016), (c) Rivera & Ecke (2016), and (d) present work (only the cases $L_\alpha /L_B<1.0$ are shown). The last row denotes whether a steepened spectrum in the inverse cascade range is observed in the corresponding parameter space.