Hostname: page-component-cd9895bd7-jn8rn Total loading time: 0 Render date: 2024-12-27T13:43:14.615Z Has data issue: false hasContentIssue false

Gas-sheared falling liquid films beyond the absolute instability limit

Published online by Cambridge University Press:  25 September 2023

Misa Ishimura
Affiliation:
Université Paris-Saclay, CNRS, FAST, 91405 Orsay, France Université Savoie Mont Blanc, CNRS, LOCIE, 73000 Chambèry, France Department of Mechanical Engineering, Yokohama National University, Kanagawa 240-8501, Japan
Sophie Mergui
Affiliation:
Université Paris-Saclay, CNRS, FAST, 91405 Orsay, France Sorbonne Université, UFR 919, 4 place Jussieu, F-75252 Paris CEDEX 05, France
Christian Ruyer-Quil
Affiliation:
Université Savoie Mont Blanc, CNRS, LOCIE, 73000 Chambèry, France
Georg F. Dietze*
Affiliation:
Université Paris-Saclay, CNRS, FAST, 91405 Orsay, France
*
Email address for correspondence: dietze@fast.u-psud.fr

Abstract

We study the effect of a confined turbulent counter-current gas flow on the waviness of a weakly inclined falling liquid film. Our study is centred on experiments in a channel of 13 mm height, using water and air, where we have successively increased the counter-current gas flow rate until flooding. Computations with a new low-dimensional model and linear stability calculations are used to elucidate the linear and nonlinear wave dynamics. We find that the gas pressure gradient plays an important role in countering the stabilizing effect of the tangential gas shear stress at the liquid–gas interface. At very low inclination angles, the latter effect dominates and can suppress the long-wave Kapitza instability unconditionally. By contrast, for non-negligible inclination, the gas effect is linearly destabilizing, amplifies the height of nonlinear Kapitza waves, and exacerbates coalescence-induced formation of large-amplitude tsunami waves. Kapitza waves do not undergo any catastrophic transformation when the counter-current gas flow rate is increased beyond the absolute instability (AI) limit. On the contrary, we find that AI is an effective linear wave selection mechanism in a noise-driven wave evolution scenario, leading to highly regular downward-travelling nonlinear wave trains, which preclude coalescence events. In our experiments, where Kapitza waves develop in a protected region before coming into contact with the gas, flooding is eventually caused far beyond the AI limit by upward-travelling short-wave ripples. Based on our linear stability calculations for arbitrary wavenumbers, we have uncovered a new short-wave interfacial instability mode with negative linear wave speed, causing these ripples.

Type
JFM Papers
Copyright
© The Author(s), 2023. Published by Cambridge University Press

1. Introduction

Falling liquid films intervene in many engineering applications (Alekseenko et al. Reference Alekseenko, Antipin, Bobylev and Markovich2007; Azzopardi et al. Reference Azzopardi, Mudde, Lo, Morvan, Yan and Zhao2011; Lapkin & Anastas Reference Lapkin and Anastas2018). One example is rectification columns containing structured packings for cryogenic air separation (Fair & Bravo Reference Fair and Bravo1990), where the liquid film is subject to a turbulent counter-current gas flow within narrow channels (Valluri et al. Reference Valluri, Matar, Hewitt and Mendes2005). Surface waves, forming at the liquid–gas interface due to the inertia-driven Kapitza instability (Kapitza Reference Kapitza1948), which consist of large humps preceded by several precursory capillary ripples, are known to greatly intensify inter-phase heat and mass transfer (Yoshimura, Nosoko & Nagata Reference Yoshimura, Nosoko and Nagata1996; Miyara Reference Miyara1999; Dietze Reference Dietze2019). At the same time, they can trigger flooding events (Bankoff & Lee Reference Bankoff and Lee1986) that are detrimental to adequate process operation. Such events include obstruction of the channel cross-section (Vlachos et al. Reference Vlachos, Paras, Mouza and Karabelas2001), wave reversal (Tseluiko & Kalliadasis Reference Tseluiko and Kalliadasis2011), fragmentation and droplet entrainment (Zapke & Kröger Reference Zapke and Kröger2000), and (partial) liquid reversal (Trifonov Reference Trifonov2010b, Reference Trifonov2019). In light of these two competing roles played by surface waves, numerous experimental (Vlachos et al. Reference Vlachos, Paras, Mouza and Karabelas2001; Drosos, Paras & Karabelas Reference Drosos, Paras and Karabelas2006; Kofman, Mergui & Ruyer-Quil Reference Kofman, Mergui and Ruyer-Quil2017), numerical (Trifonov Reference Trifonov2010a, Reference Trifonov2019; Vellingiri, Tseluiko & Kalliadasis Reference Vellingiri, Tseluiko and Kalliadasis2015; Schmidt et al. Reference Schmidt, Náraigh, Lucquiaud and Valluri2016; Lavalle et al. Reference Lavalle, Li, Mergui, Grenier and Dietze2019) and modelling (Tseluiko & Kalliadasis Reference Tseluiko and Kalliadasis2011; Dietze & Ruyer-Quil Reference Dietze and Ruyer-Quil2013; Lavalle et al. Reference Lavalle, Grenier, Mergui and Dietze2020, Reference Lavalle, Mergui, Grenier and Dietze2021) works have been dedicated to unravelling the effect of a counter-current gas flow on the linear and nonlinear dynamics of wavy falling liquid films. Our current paper seeks to further contribute to this task.

We study the configuration of a laminar falling liquid film sheared by a turbulent counter-current gas flow confined in a rectangular channel of height $H^\star \sim 10\,{\rm mm}$ (the star superscript denotes dimensional quantities throughout), according to the experimental set-up sketched in figure 1. The confinement level chosen here is representative of structured packings (Fair & Bravo Reference Fair and Bravo1990) and lies in between those used in the experiments of Lavalle et al. (Reference Lavalle, Li, Mergui, Grenier and Dietze2019), $H^\star \sim 5\,{\rm mm}$, where the gas flow was laminar, and those of Kofman et al. (Reference Kofman, Mergui and Ruyer-Quil2017), $H^\star \sim 20\,{\rm mm}$, where the confinement was weak and the gas flow was turbulent. We have applied three different approaches to study this flow: (i) experiments, where developed surface waves of prescribed frequency were produced within a protected zone before being submitted to the counter-current gas flow; (ii) linear stability analysis based on the full governing equations; and (iii) nonlinear numerical computations with a new integral boundary layer model. Our study is guided by a set of experimental runs, where we have successively increased the counter-current gas flow rate, starting from conditions where the gas effect is weak, up until breakdown of the experiment due to flooding. Computations with our low-dimensional model and linear stability calculations have allowed us to elucidate the linear and nonlinear wave dynamics associated with this transition.

Figure 1. Sketch of our experimental set-up. A falling liquid film of water flows down a glass plate inclined at an angle $\phi =5^{\circ }$, and enters into contact with a counter-current turbulent air flow within a rectangular channel of height $H^\star =13$ mm and width $W^\star =27$ mm. A loudspeaker is used to force Kapitza waves on the surface of the liquid film, which grow and saturate within a protected region.

We focus mainly (but not exclusively) on weakly inclined falling liquid films, which allows us to investigate weakly supercritical flow regimes. According to Brooke Benjamin (Reference Brooke Benjamin1957) and Yih (Reference Yih1963), the onset of the Kapitza instability for a liquid film falling in a passive atmosphere is given by $Re_L=5/6\cot (\phi )$, where $\phi$ denotes the inclination angle, and $Re_L=q^\star _L/\nu _L$ is the liquid Reynolds number based on the liquid flow rate per unit width $q^\star _L$ and liquid kinematic viscosity $\nu _L$. Thus the smaller $\phi$, the more closely the instability threshold can be approached while maintaining an experimentally realizable film thickness $h_0^\star =(3\,Re_L\,\nu _L^2/g/\sin (\phi ))^{1/3}$, where the subscript $0$ denotes the primary flow, and $g$ is the gravitational acceleration. Closer to the instability threshold, the interfacial dynamics are less complicated, and surface waves are predominantly two-dimensional (Kofman, Mergui & Ruyer-Quil Reference Kofman, Mergui and Ruyer-Quil2014).

Our current work is inspired by several recent findings reported in the literature, which we discuss next. Lavalle et al. (Reference Lavalle, Li, Mergui, Grenier and Dietze2019) demonstrated that the onset of the Kapitza instability can be delayed significantly at low inclination angles, by strongly confining the surrounding gas, as conjectured by Tilley, Davis & Bankoff (Reference Tilley, Davis and Bankoff1994). Moreover, they discovered that the gas-induced stabilization is strongest in the counter-current configuration, and increases with increasing magnitude of the gas flow rate. Kushnir et al. (Reference Kushnir, Barmak, Ullmann and Brauner2021) showed subsequently that stabilization also occurs in the case of a confined recirculating gas, i.e. when the net gas flow rate is zero. In the above three studies, the gas flow was considered laminar and the stabilization occurred for strong confinement, i.e. $H^\star \le 5\,{\rm mm}$. As demonstrated by Lavalle et al. (Reference Lavalle, Li, Mergui, Grenier and Dietze2019), it is caused by the linear response of the interfacial tangential gas shear stress $T_G$ to a perturbation of the liquid film thickness. Potentially, gas-induced stabilization may thus be achieved for weaker confinement if the gas flow is turbulent, as turbulence increases the magnitude of $T_{{G}}$. In the current paper, we have checked this hypothesis based on linear stability calculations. In particular, we find that the Kapitza instability can be suppressed fully by a turbulent counter-current gas flow for $H^\star \sim 10\,{\rm mm}$ when the inclination angle is very small ($\phi \sim 1^{\circ }$). By ‘full suppression’ we mean that the falling liquid film becomes unconditionally stable to long-wave disturbances, i.e. for all $Re_L$. By contrast, at non-negligible inclination ($\phi \sim 5^{\circ }$), the linear gas effect is destabilizing and the counter-current gas flow can render the liquid film unconditionally unstable to long-wave disturbances, as reported previously for laminar flow conditions (Trifonov Reference Trifonov2017; Kushnir et al. Reference Kushnir, Barmak, Ullmann and Brauner2021). We find that turbulence can significantly delay the onset of this unconditional instability.

Recent numerical (Lavalle et al. Reference Lavalle, Mergui, Grenier and Dietze2021) and experimental (Mergui et al. Reference Mergui, Lavalle, Li, Grenier and Dietze2023) investigations of weakly inclined falling liquid films have shown that a strongly confined laminar counter-current gas flow can attenuate the amplitude of nonlinear travelling-wave solutions (TWS), even though the linear gas effect is destabilizing. In our current configuration, where the inclination angle is similar but the confinement is weaker and the gas flow is turbulent, both the TWS amplitude and the linear spatial growth rate increase with increasing counter-current gas flow rate, at least until the absolute instability (AI) limit is reached.

Several works on gas-sheared falling liquid films in narrow (vertical) channels have identified wave coalescence as a possible route towards flooding. For example, Drosos et al. (Reference Drosos, Paras and Karabelas2006) measured the probability density function of the wave height and found that the dominant wave frequency strongly decreases as the flooding limit is approached. Later, Dietze & Ruyer-Quil (Reference Dietze and Ruyer-Quil2013) computed the noise-driven spatial evolution of Kapitza waves sheared by a superconfined laminar gas flow, and showed that coalescence can trigger an intermittent obstruction of the channel. Geometrical obstruction is not possible in our current configuration, where $H^\star$, although smaller than the typical wavelength $\varLambda ^\star$, is much greater than $h_0^\star$. Nonetheless, we find that the counter-current gas flow exacerbates coalescence events, entailing very large waves that form via the successive absorption of smaller waves. Such waves have been designated as tsunami waves (Meza & Balakotaiah Reference Meza and Balakotaiah2008), and we will employ this term throughout. In particular, the onset of coalescence moves upstream significantly when the counter-current gas flow rate is increased, precipitating the usual wave coarsening dynamics observed in liquid films falling in a quiescent gas (Chang et al. Reference Chang, Demekhin, Kalaidin and Ye1996b).

The transition between convective instability (spatial growth) and AI (temporal growth), which occurs when the counter-current gas flow rate is increased, has been suggested as another potential cause for the onset of flooding. For example, Vellingiri et al. (Reference Vellingiri, Tseluiko and Kalliadasis2015) showed that the AI limit predicted by their linear stability analysis lies not too far from the flooding threshold reported in the experiments of Zapke & Kröger (Reference Zapke and Kröger2000), where a vertically falling liquid film was sheared by a counter-current gas flow. However, the trends of the two limits versus the liquid Reynolds number $Re_L$ were opposed, i.e. the flooding onset, expressed in terms of the superficial gas velocity, increased with increasing $Re_L$, whereas the AI limit diminished. In the current work, we have thus explored the spatio-temporal evolution of nonlinear Kapitza waves beyond the AI limit, based on experiments and numerical computations. We find that AI is not necessarily dangerous in our configuration, i.e. no catastrophic events occur until far beyond the AI limit. Moreover, in the case of a noise-driven wave evolution scenario, AI can act as an effective linear selection mechanism, leading to a regular train of downward-travelling nonlinear surface waves, thus precluding dangerous coalescence events.

Lavalle et al. (Reference Lavalle, Grenier, Mergui and Dietze2020) studied vertically falling wavy liquid films sheared by a superconfined laminar counter-current gas flow, and discovered an oscillatory secondary instability. This instability entails a regular spatial modulation of TWS generated by coherent inlet forcing. We have performed computations for the same liquid-side parameters, but with our moderate confinement, i.e. $H^\star \sim 10\,{\rm mm}$. Although we do not observe any oscillatory instability, wave amplitude modulations occur nonetheless, albeit due to an entirely different mechanism, which sets in beyond the AI limit. There, a competition between the forcing frequency and the absolute frequency can lead to coalescence-induced tsunami waves that are separated by a long and thin residual film, on which small-amplitude standing ripples form as a result of AI. These ripples continually perturb the tsunami waves passing over them, similar to the effect of wall corrugations (Dietze Reference Dietze2019).

Several numerical works have suggested that a counter-current gas flow may provoke the reversal of nonlinear Kapitza waves, which can be viewed as another manifestation of flooding. Tseluiko & Kalliadasis (Reference Tseluiko and Kalliadasis2011) observed this for a vertically falling liquid film sheared by a weakly confined turbulent gas flow. However, in their computations, the average film thickness $\bar {h}$ was fixed instead of the liquid flow rate, which is more representative of a sudden gas flow rate increase in an experiment. Trifonov (Reference Trifonov2017) observed the reversal of travelling Kapitza waves in the case of an inclined falling liquid film sheared by a laminar gas flow. However, the gas Reynolds number in his computations was far greater than the turbulence threshold, i.e. $|Re_G|> 10\,000$. Lavalle et al. (Reference Lavalle, Grenier, Mergui and Dietze2020) observed wave reversal due to a gas-induced secondary instability of TWS in the case of extreme confinement ($H^\star \sim 1\,{\rm mm}$). In our current configuration, where the liquid flow rate is imposed, the gas flow is turbulent and the confinement is moderate, we did not observe any reversal of Kapitza waves, either in terms of TWS or in the case of spatially evolving waves.

In our experiments, flooding is triggered (far beyond the AI limit) by upward-travelling short ripples that first coexist with the initial Kapitza waves and then overpower the latter. As soon as these ripples appear, liquid, in the form of small droplets, starts to accumulate in the gas loop, eventually forcing a shutdown of the experiment. Such ripples were first observed in the experiments of Kofman et al. (Reference Kofman, Mergui and Ruyer-Quil2017). In the current paper, we elucidate their origin, which has remained an open question.

Kofman et al. (Reference Kofman, Mergui and Ruyer-Quil2017) pointed out that the ripples observed in their experiments have wavelengths and amplitudes similar to those of ripples forming in horizontal liquid films sheared by an unconfined co-current turbulent gas flow (Özgen, Carbonaro & Sarma Reference Özgen, Carbonaro and Sarma2002). Those ripples are caused by a short-wave interfacial instability mode (Miesen & Boersma Reference Miesen and Boersma1995). They have also been observed when the co-current gas flow is confined, e.g. in the experiments of Hanratty & Engen (Reference Hanratty and Engen1957), where $H^\star =25.4$ mm, and where the ripples were seen to coalesce into fast-travelling slugs. The corresponding instability mode was identified by McCready & Chang (Reference McCready and Chang1994). They showed that the dispersion curve of the linear temporal growth rate $kc_i$, where $k$ and $c_i$ denote the wavenumber and complex celerity, originates at $k=c_i=0$, and displays two unstable ($kc_i>0$) humps, one at small and another at large $k$, the short-wave hump being dominant. However, no short-wave instability mode has ever been identified for falling liquid films sheared by a counter-current (turbulent) gas flow, despite several previous linear stability investigations. And the ripples observed in our experiments move upstream, i.e. in the opposite direction to the liquid.

Schmidt et al. (Reference Schmidt, Náraigh, Lucquiaud and Valluri2016) applied the Chebyshev collocation approach (Orszag Reference Orszag1971; Barmak et al. Reference Barmak, Gelfgat, Ullman and Brauner2016a) to study this problem in the vertical configuration at $|Re_{G}|> 35\,000$, where $Re_G=q_G^\star /\nu _G$ designates the gas Reynolds number based on the gas flow rate per unit width $q_G^\star$ and the gas kinematic viscosity $\nu _G$. Although the gas flow under these conditions would be turbulent in an experiment, the laminar Navier–Stokes equations were used. The authors identified four instability modes: (1) the long-wave Kapitza mode (Brooke Benjamin Reference Brooke Benjamin1957; Yih Reference Yih1963), which is an interfacial mode; (2) the liquid-side short-wave Tollmien–Schlichting mode (Floryan, Davis & Kelly Reference Floryan, Davis and Kelly1987; Samanta Reference Samanta2020), which travels in the direction of the liquid and occurs at very large $Re_L$; (3) the gas-side short-wave Tollmien–Schlichting mode; and (4) a so-called long-wave internal mode, which appears at $|Re_{G}|\sim 10\times 10^4$ and can merge with the Kapitza mode. Trifonov (Reference Trifonov2017) applied the same approach to the case of an inclined falling liquid film, and showed that the gas-side Tollmien–Schlichting mode corresponds to the classical result for channel flow, i.e. $|Re_G|=\frac {4}{3}\times 5772=7696$ (Orszag Reference Orszag1971). This mode always travels in the direction of the gas flow, but it does not perturb the liquid–gas interface meaningfully. Thus it cannot generate the upward-travelling ripples observed in our experiment, which, moreover, occur at $|Re_{G}|\sim 6000$.

The works of Schmidt et al. (Reference Schmidt, Náraigh, Lucquiaud and Valluri2016) and Trifonov (Reference Trifonov2017) did not account for turbulence in the primary flow, even though the gas Reynolds number $|Re_G|$ was far greater than the experimental turbulence threshold $|Re_G|\sim 1800$ (Pope Reference Pope2000). Following the seminal work of Náraigh et al. (Reference Náraigh, Spelt, Matar and Zaki2011), this shortcoming was remedied by Vellingiri et al. (Reference Vellingiri, Tseluiko and Kalliadasis2015), who represented the turbulent gas flow via the Reynolds averaged Navier–Stokes (RANS) equations, using curvilinear coordinates and Prandtl's mixing-length approach. These authors observed a transition of the long-wave Kapitza instability from downward-convective to upward-convective upon increasing the counter-current gas flow rate $q_{L 0}$. However, as the liquid film thickness $h_0$ and not $q_{L 0}$ was fixed in these calculations, upward-travelling waves were associated with $q_{L 0}<0$. By contrast, $q_{L 0}$ is fixed and positive in our experiments. Vellingiri et al. (Reference Vellingiri, Tseluiko and Kalliadasis2015) did not identify any short-wave instability mode. Nonetheless, they reported a non-monotonic variation of the cut-off wavenumber $k_{c}$ upon increasing $|Re_{G}|$ for the long-wave instability mode, i.e. a decrease followed by an increase in $k_{c}$. Trifonov (Reference Trifonov2017) later made a similar observation. We will show that this behaviour results from an interaction between the long-wave Kapitza instability mode and a new short-wave interfacial instability mode, which we have detected via temporal linear stability calculations at fixed $q_{L 0}>0$, using the Chebyshev collocation approach.

This new short-wave mode emerges around the AI limit of the long-wave Kapitza instability mode, upon increasing the counter-current gas flow rate. Initially, the long-wave and short-wave modes coexist, but, at sufficiently large $|Re_G|$, they merge to form a two-humped dispersion curve originating at $k=c_i=0$, and the short-wave maximum eventually becomes dominant. Linear waves corresponding to this maximum display a negative wave celerity $c_r< 0$, and both their wavelength $\varLambda$ and $c_r$ agree well with the upward-travelling ripples observed in our experiment. The wave celerity $c_r$ of the new short-wave instability mode is always negative at the most-amplified wavenumber $k=k_{max}$, but it can change sign at lower $k$. This is a fundamental difference with the gas-side Tollmien–Schlichting mode. Conversely, when $c_r< 0$, the liquid film surface velocity is not necessarily negative. Thus ripples travel upwards, even when the liquid travels downwards across the entire film thickness. This is a difference with the interfacial mode observed in co-current liquid/gas flows (Miesen & Boersma Reference Miesen and Boersma1995).

Nonlinear computations in the current paper have been performed with a new low-dimensional model, which we introduce. Therein, the liquid film is represented via the weighted residual integral boundary layer (WRIBL) approach of Ruyer-Quil & Manneville (Reference Ruyer-Quil and Manneville1998), leading to two coupled evolution equations for the local instantaneous film thickness $h$ and liquid flow rate $q_L$. We develop these equations up to second order in the long-wave parameter, and account for the effect of an adjacent gas via the gas shear stress $T_G$ and the gas pressure $P_G$, acting at the liquid–gas interface. Following Camassa, Ogrosky & Olander (Reference Camassa, Ogrosky and Olander2017), we obtain these coupling quantities from a first-order long-wave (LW) approximation of the gas-side RANS equations written in curvilinear coordinates (Thorsness, Morrisroe & Hanratty Reference Thorsness, Morrisroe and Hanratty1978), while assuming a frozen liquid–gas interface. Our thus obtained WRIBL-LW model represents several improvements with respect to previous works, which we will discuss next.

Demekhin (Reference Demekhin1981) used the integral boundary layer approach of Shkadov (Reference Shkadov1967) to model the liquid film, and accounted for the effect of a turbulent gas flow, via $T_G$ and $P_G$, through the linear response of the gas-side RANS equations to a waviness of the liquid–gas interface (assumed frozen). This linearized approach is valid in the limit $h/H\ll 1$, i.e. assuming a large channel height versus the film thickness. Further, the authors invoked the quasi-laminar assumption (Miles Reference Miles1957; Brooke Benjamin Reference Brooke Benjamin1959), where turbulence enters only via the unperturbed flow and linear perturbations of the Reynolds stresses are neglected, which is usually valid in gas-sheared wavy liquid films (Náraigh et al. Reference Náraigh, Spelt, Matar and Zaki2011). However, the liquid-side integral boundary layer approach is known to significantly over-predict the instability threshold of an inclined falling liquid film.

Tseluiko & Kalliadasis (Reference Tseluiko and Kalliadasis2011) remedied this shortcoming by combining the gas-side description of Demekhin (Reference Demekhin1981) with a WRIBL representation of the liquid film. However, their liquid-side WRIBL model was developed only up to first order in the long-wave parameter, thus in conjunction with the linear gas-side approach, the gas pressure $P_G$ did not enter the problem. We will show that this changes the linear response of the liquid film qualitatively in our configuration, and that a second-order liquid-side WRIBL development, accounting for $P_G$, is needed to capture accurately the effect of the counter-current gas flow.

Such a liquid-side treatment was applied by Samanta (Reference Samanta2014), but the author made several simplifications in the gas-side description, i.e. $P_G$ was neglected altogether, and $T_G$ was assumed constant. The latter assumption entails that the gas-induced stabilization observed in superconfined falling liquid films (Lavalle et al. Reference Lavalle, Li, Mergui, Grenier and Dietze2019), which relies on the linear response of $T_G$, cannot be captured.

Camassa et al. (Reference Camassa, Ogrosky and Olander2017) accounted for variations in $P_G$ and $T_G$ in their gas-side description. Moreover, their gas-side description relies on a long-wave rather than low-amplitude expansion of the RANS equations, thus finite confinement levels can be studied. However, their description of the liquid film relied on the lubrication approach. Thus the inertia-driven Kapitza instability, which is responsible for generating long waves in our configuration but was irrelevant in theirs, cannot be captured.

By coupling the gas-side approach of Camassa et al. (Reference Camassa, Ogrosky and Olander2017) with a second-order WRIBL description of the liquid film, our WRIBL-LW model remedies the different limitations discussed above. Our model is aimed at moderate confinement levels, where the gas flow is turbulent and the gas pressure is relevant. In that sense, it complements the model of Dietze & Ruyer-Quil (Reference Dietze and Ruyer-Quil2013), for superconfined laminar liquid–gas flows, and the models of Demekhin (Reference Demekhin1981) and Tseluiko & Kalliadasis (Reference Tseluiko and Kalliadasis2011), for weakly confined falling liquid films sheared by a turbulent gas flow, where the effect of $P_G$ is negligible. For completeness, we point out that our model does not rely on the quasi-laminar assumption (Alekseenko et al. Reference Alekseenko, Aktershev, Cherdantsev, Kharlamov and Markovich2009; Trifonov Reference Trifonov2010a; Tseluiko & Kalliadasis Reference Tseluiko and Kalliadasis2011; Vellingiri et al. Reference Vellingiri, Tseluiko and Kalliadasis2015). We will show that it predicts accurately the dynamics of Kapitza waves under the effect of a counter-current turbulent gas flow, in good agreement with experiments.

Our paper is structured as follows. In § 2, we introduce our experimental set-up for studying surface waves in gas-sheared falling liquid films. In § 3, we present our low-dimensional WRIBL-LW model (§§ 3.1 and 3.2), and the numerical methods underlying our linear and nonlinear computations therewith (§ 3.4). Section 4 concerns linear stability calculations based on the full RANS equations in the gas, where the liquid-side description is based either on the WRIBL model (§ 4.1) or on the full Navier–Stokes equations (§ 4.2). In § 5, we validate our WRIBL-LW model versus linear stability calculations and experiments. Section 6 presents our results concerning the gas effect on linear and nonlinear wave dynamics. We first focus on waves resulting from the long-wave Kapitza instability (§ 6.1), and then discuss upward-travelling short-wave ripples (§ 6.2). Conclusions are drawn in § 7, followed by Appendices A and B, containing validation results, and Appendix C, where we justify one of our model assumptions.

2. Experiments

Figure 1 sketches the set-up used for our experiments. A liquid film (index $L$) of water flows down a glass plate inclined at $\phi =5^{\circ }$, and enters into contact with a counter-current turbulent gas flow (index $G$) of air confined within a rectangular channel of height $H^\star =13$ mm and width $W^\star =27$ cm. This set-up is a slightly modified version of the set-up used in the work of Mergui et al. (Reference Mergui, Lavalle, Li, Grenier and Dietze2023), where $H^\star =5$ mm and the gas flow was laminar.

The liquid flow rate $q^\star _L$ is controlled through a gear pump and measured with error ${\pm }3\,\%$ using a conductance flow meter (IFM electonic, SM6000). In the current paper, we focus on two liquid-side regimes: $Re_L\sim 33$ and $Re_L\sim 45$. A loudspeaker integrated into the upstream liquid reservoir enables the forcing of Kapitza waves with prescribed frequency $f_0^\star$ on the surface of the liquid film. These waves are allowed to grow and saturate within a protected region spanning from $x^\star =0$ to $x^\star =36.5$ cm, before entering the gas-sheared section of the set-up ($36.5\,{\rm cm}\le x^\star \le 100\,{\rm cm}$). In our experiments, $f_0^\star$ is chosen such as to maximize the linear growth rate of the Kapitza waves, yielding a train of regular waves within the protected region. Also, the forcing amplitude is adjusted so that the waves reach a saturated amplitude before entering the gas-sheared section.

The gas flow rate $q^\star _G$ is controlled through a fan, and quantified via a calibration curve (relating the fan power to $q^\star _G$) obtained from gas velocity measurements in the dry channel. Details of the procedure are given in Mergui et al. (Reference Mergui, Lavalle, Li, Grenier and Dietze2023). An error on $Re_G$ of 3 % was estimated for all our experiments. For a given liquid flow rate, the fan power was varied from zero up until breakdown of the experiment due to flooding, when liquid droplets accumulated in the gas buffer box. At zero fan power, the gas is subject to an aerostatic pressure drop, which is imposed by the quiescent ambient air. In this case, which we will designate as aerostatic configuration, the gas flows downwards under the shearing action of the falling liquid film, i.e. $q^\star _G> 0$. Conversely, in the case of a counter-current gas flow, we have $q^\star _G< 0$. Thus we consider $q_G^\star$, and the gas Reynolds number $Re_G$, as signed quantities.

In our counter-current experimental runs, $Re_G$ was typically varied from $Re_G=-3000$ to $Re_G=-6800$, after an initial measurement under aerostatic conditions. Due to evaporation, the liquid temperature typically decreased by a few Kelvin between the aerostatic and counter-current configurations. As $q_L^\star$ remained fixed during each run, a corresponding variation of $Re_L$ occurred due to changes in the fluid properties. To account for this, we have monitored the liquid temperature $T_{inlet}$ in the inlet tank over the course of each experiment, using a thermocouple. The temperature decrease was observed as soon as the counter-current air flow was imposed, but the temperature varied little upon increasing the gas flow rate after that. Thus, when reporting experimental data, we will give $Re_L^{as}$, which corresponds to the aerostatic configuration, and $Re_L$, which corresponds to the counter-current configuration.

Representative values of the density and kinematic viscosity of water and air for our counter-current experiments ($T_{inlet}\simeq 19\,^{\circ }{\rm C}$) are $\rho _L=998.3\,{\rm kg}\,{\rm m}^{-3}$, $\nu _L=1.03\times 10^{-6}\,{\rm m}^2\,{\rm s}^{-1}$ and $\rho _G=1.21\,{\rm kg}\,{\rm m}^{-3}$, $\nu _G=14.9\times 10^{-6}\,{\rm m}^2\,{\rm s}^{-1}$. The surface tension of our water was measured once and for all at $T=19.9\,^{\circ }{\rm C}$ with a drop shape analyser (Krüss), yielding $\sigma =71\,{\rm mN}\,{\rm m}^{-1}$. Based on this, we obtain $Ka=\sigma/(\rho_L g^{1/3} \nu_L^{4/3})=3174$ for the Kapitza number. Conversely, for our experiments in the aerostatic configuration ($T_{inlet}\simeq 21\,^{\circ }{\rm C}$), we obtain $Ka=3394$.

Two methods were applied to characterize the gas effect on the dynamics of nonlinear surface waves (for details, see Kofman et al. Reference Kofman2014; Mergui et al. Reference Mergui, Lavalle, Li, Grenier and Dietze2023): (1) shadowgraphy of the wavy liquid–gas interface, using an sCMOS camera (PCO, pco.edge 5.5) with 100 Hz frame rate; (2) pointwise measurements of the film thickness time trace, using a confocal chromatic imaging (CCI) technique (Cohen-Sabban, Gaillard-Groleas & Crepin Reference Cohen-Sabban, Gaillard-Groleas and Crepin2001; Lel et al. Reference Lel, Al-Sibai, Leefken and Renz2005) with 400 Hz acquisition frequency and accuracy ${\pm }1\,\mathrm {\mu }$m (Stil S.A., CL-MG CL4 line sensor).

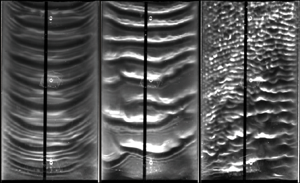
Figures 2 and 3 show typical data obtained with these two methods. Figure 2 represents shadowgraphs for an experiment, where the fan power was increased step by step (from left to right), while maintaining $q^\star _L$ and $f_0^\star =3$ Hz fixed. Each shadowgraph represents the entire width of the channel and almost the entire length of the gas-sheared section of the set-up, i.e. $44\,{\rm cm}\le x^\star \le 100\,{\rm cm}$. At zero fan power (figure 2a), regularly spaced Kapitza waves with quasi-two-dimensional wave fronts are observed. Applying and increasing a counter-current gas flow rate causes first coalescence events (figure 2b) and then the emergence of upward-travelling short ripples that coexist with the long Kapitza waves (figure 2c). This dynamics will be the focus of § 6.

Figure 2. Transition of the wavy falling liquid film under a counter-current gas flow: water/air, $Re_L^{as}=44.7$, $Re_L=43.1$, $f_0^\star =3$ Hz. Shadowgraphs of the liquid–gas interface for increasingly strong fan power: (a) zero fan power (aerostatic configuration), regularly-spaced Kapitza waves; (b) $Re_G=-5830$, coalescence of Kapitza waves; (c) $Re_G=-6760$, coexistence of Kapitza waves with upward-travelling short ripples.

Figure 3. Typical CCI film thickness measurements in the aerostatic configuration: water/air, $Re_L^{as}=33.7$, $f_0^\star =2.8$ Hz. (a) Film thickness time traces measured at different positions. From left to right: $x^\star =13.5$, 27.5, 49.5 and 62.5 cm. (b) Spatial profiles of averaged quantities (at least 100 waves). Open/filled circles indicate ensemble-averaged wave height $h_{max}^\star$ and minimum film thickness $h_{min}^\star$; crosses indicate time-averaged film thickness $\bar {h}^\star$. Error bars indicate standard deviation, and red arrows mark positions for the traces in (a).

Figure 3 represents measurement data obtained with the CCI technique for the aerostatic configuration at $Re_L^{as}=33.7$ and $f_0^\star =2.8$ Hz. In figure 3(a), we have plotted time traces of the film thickness $h^\star$ at streamwise positions representative for the regimes of linear growth, nonlinear growth and saturation of Kapitza waves. These time traces evidence the formation of characteristic precursory capillary ripples. Figure 3(b) represents spatial profiles of the ensemble-averaged (over at least 100 waves) maximum film thickness $h_{max}^\star$, minimum film thickness $h_{min}^\star$, and time-averaged (over at least 100 wave periods) film thickness $\bar {h}^\star$. Error bars illustrate the standard deviation. To obtain these profiles, the CCI probe was displaced incrementally using a rail (see figure 1).

3. Low-dimensional WRIBL-LW model

We consider the flow in figure 4. A two-dimensional laminar falling liquid film of thickness $h(x,t)$ flows along an inclined plane under the action of gravity, while being sheared by a counter-current turbulent gas flow. The gas flow is confined by a second wall at $y^\star =H^\star$ (the star superscript denotes dimensional quantities throughout), which is not represented. We impose a symmetry condition at the centreline of the average gas layer, i.e. $y^\star =D^\star$. In the case of a symmetrical vertical configuration with liquid films lining both walls (Vlachos et al. Reference Vlachos, Paras, Mouza and Karabelas2001), this condition is satisfied analytically, and we have $D^\star =H^\star /2$. In the case of an inclined configuration with a dry upper wall, which is the one considered here, the symmetry condition remains a reasonable approximation, provided that the liquid holdup $\bar {h}^\star /H^\star$, where $\bar {h}^\star$ designates the average film thickness, is not too large. In the current work, $\bar {h}^\star /H^\star < 0.1$, thus the symmetry condition is acceptable. In that case, $D^\star =(H^\star +\bar {h}^\star )/2$. Moreover, due to the inter-phase coupling conditions that we will apply in our gas-side description (frozen-interface assumption), and the nature of our calculations (linear stability analysis and long-wave asymptotic expansion), the symmetry condition at $y^\star =D^\star$ holds analytically, even when the upper wall is dry. This will be explained further in §§ 3.2 and 4.1.

Figure 4. Falling liquid film (subscript $L$) on an inclined wall subject to a counter-current turbulent gas flow (subscript $G$). The flow is confined by an upper wall (not shown) at $y^\star =H^\star$ (stars denote dimensional quantities), and a symmetry condition is imposed at the centreline of the average gas layer $y^\star =D^\star$. Gas–liquid coupling is expressed via the tangential gas shear stress $T_G$ and the gas pressure $P_G$ at the film surface $y^\star =h^\star$. Red dashed lines illustrate the orthogonal curvilinear coordinate system $(\eta, \xi )$, where $\eta =\underline {y}\bar {d}/d$.

Following previous works (Halpern & Grotberg Reference Halpern and Grotberg2003; Tseluiko & Kalliadasis Reference Tseluiko and Kalliadasis2011; Samanta Reference Samanta2014; Camassa et al. Reference Camassa, Ogrosky and Olander2017), we relax the inter-phase coupling conditions and apply a weakly coupled treatment of the two-phase flow. The liquid film (§ 3.1) is modelled with the WRIBL method (Kalliadasis et al. Reference Kalliadasis, Ruyer-Quil, Scheid and Velarde2012), where the effect of the gas enters via the tangential gas shear stress $T_G$ and the gas pressure $P_G$ acting at the film surface $y^\star =h^\star$ (figure 4), neglecting the normal gaseous viscous stress. These inter-phase coupling quantities are obtained from the gas-side model (§ 3.2), which is derived via long-wave asymptotic expansion, following Camassa et al. (Reference Camassa, Ogrosky and Olander2017).

3.1. Liquid-side WRIBL model

The liquid film (subscript $L$), with density $\rho _L$, dynamic viscosity $\mu _L$ and surface tension $\sigma$, is governed by the dimensionless continuity and Navier–Stokes equations written in Cartesian coordinates $x$ and $y$ (figure 4):

(3.1a)$$\begin{gather} \partial_xu_L + \partial_yv_L = 0, \end{gather}$$
(3.1b)$$\begin{gather}\epsilon(\partial_tu_L + u_L\,\partial_xu_L + v_L\,\partial_yu_L)={-} \epsilon\, \partial_xp + \frac{1}{Re_L}\,(\epsilon^2\,\partial_{xx}u_L + \partial_{yy}u_L) + \frac{\sin(\phi)}{Fr ^2}, \end{gather}$$
(3.1c)$$\begin{gather}\epsilon^3(\partial_tv_L + u_L\,\partial_xv + v_L\,\partial_yv_L) ={-} \epsilon\,\partial_yp_L + \frac{1}{Re_L}\,(\epsilon^4\,\partial_{xx}v_L + \epsilon^2\,\partial_{yy}v_L) - \epsilon\,\frac{\cos(\phi)}{Fr ^2}, \end{gather}$$

where $Re_L=\rho _L\mathcal {U}_L\mathcal {L}/\mu _L$ and $Fr=\mathcal {U}_L/\sqrt {\mathcal {L}g}$ denote the liquid Reynolds number and Froude number, and where we have applied the scaling

(3.1d)\begin{equation} u_L=\frac{u^\star_L}{\mathcal{U}_L},\quad v_L=\frac{v_L^\star}{\epsilon\mathcal{U}_L},\quad x=\epsilon\,\frac{x^\star}{\mathcal{L}},\quad y=\frac{y^\star}{\mathcal{L}},\quad t=\epsilon t^\star\,\frac{\mathcal{U}_L}{\mathcal{L}},\quad p_L=\frac{p_L^\star}{\rho_L\mathcal{U}_L^2}. \end{equation}

Here, we have introduced the long-wave parameter $\epsilon =\mathcal {L}/\varLambda ^\star$, which relates the cross-stream length scale $\mathcal {L}$ to the streamwise length scale given by the wavelength $\varLambda ^\star$. For the purpose of the current derivation, it suffices to say that the scales $\mathcal {L}$ and $\mathcal {U}_L$ are representative of the film thickness $h^\star$ and streamwise liquid velocity $u_L^\star$. In § 3.3, we will rescale our problem and make the final choice for $\mathcal {L}$ and $\mathcal {U}_L$.

The system is closed with the boundary conditions at $y=0$

(3.1e)\begin{equation} u_L=v_L=0, \end{equation}

the kinematic condition

(3.1f)\begin{equation} \left.{v_L}\right|_{y=h}=\left.{u_L}\right|_{y=h} \partial_{x} h + \partial_{t} h, \end{equation}

and the inter-phase stress coupling conditions at $y=h$

(3.1g)\begin{align}& -\partial_yu_L\,\frac{1}{1+\epsilon^2\,\partial_xh^2}\, (-\epsilon^4\,\partial_xh^2\,\partial_xv_L -4 \epsilon^2\, \partial_xh\,\partial_xu_L + \epsilon^2\,\partial_xv_L)= \frac{\varPi_\mu \varPi_u}{\varPi_L}\,T_G, \end{align}
(3.1h)\begin{align} & \epsilon P_L + \frac{2}{1+\epsilon^2\,\partial_xh^2}\,\frac{1}{Re_L}\, (\epsilon^4\,\partial_xh^2\,\partial_xu_L - \epsilon^4\,\partial_xh\, \partial_xv_L -\epsilon^2\,\partial_xu_L - \epsilon^2\,\partial_xh\,\partial_yu_L) \nonumber\\ &\quad -\epsilon^3\,We\,\partial_{xx}h = \frac{1}{Re_G}\,\frac{\varPi_\rho \varPi_u^2}{\varPi_L}\, P_G, \end{align}

where $We=\sigma/(\rho_L\mathcal{L}\mathcal{U}_L^2)$ denotes the Weber number. The liquid–gas coupling enters through $T_G$ and $P_G$, which are scaled as follows:

(3.2a,b)\begin{equation} T_G=\frac{\mathcal{L}_G}{\mu_G \mathcal{U}_G}\,T_G^\star,\quad P_G=\underline{\epsilon}\,\frac{\mathcal{L}_G}{\mu_G \mathcal{U}_G}\,P_G^\star, \end{equation}

where $\mathcal {L}_G$, $\mathcal {U}_G$ and $\underline {\epsilon }=\mathcal {L}_G/\varLambda ^\star =\epsilon \varPi _L$ denote the gas-side cross-stream length scale, velocity scale and long-wave parameter, which will be defined in § 3.2. As a result, the gas Reynolds number $Re_G=\rho _G\mathcal {U}_G\mathcal {L}_G/\mu _G$, the velocity scale ratio $\varPi _u=\mathcal {U}_G/\mathcal {U}_L$, the length scale ratio $\varPi _L=\mathcal {L}_G/\mathcal {L}$, and the viscosity and density ratios $\varPi _\mu =\mu _G/\mu _L$ and $\varPi _\rho =\rho _G/\rho _L$ enter (3.1g) and (3.1h).

Next, we apply the WRIBL approach to derive two evolution equations involving the local instantaneous liquid flow rate $q(x,t)$ and the film thickness $h(x,t)$. In principle, we follow the same steps as Samanta (Reference Samanta2014), except that we account for the gas pressure $P_G$, which plays an important role in our current configuration, allow $P_G$ and $T_G$ to vary in space and time, and account for turbulence in the gas.

First, the governing equations (4.1a,b) are truncated at ${O}(\epsilon ^2)$, except for inertial terms, which are truncated at ${O}(Re_L\,\epsilon )$. Next, we eliminate $p$ from (3.1b) via an integrated form of (3.1c) using (3.1h). Then we substitute for the streamwise velocity $u$ ($v$ is obtained from (3.1a)) the decomposition

(3.3)\begin{equation} u_L=\hat{u}_L+\epsilon u_L^{(1)}, \end{equation}

where the base profile $\hat {u}_L$ is governed by

(3.4)\begin{equation} \left.\begin{gathered} \partial_{yy}\hat{u}_L=\text{const.},\quad \left.{\partial_y\hat{u}_L}\right|_{y=h}= \frac{\varPi_\mu\varPi_u}{\varPi_L}\,T_G,\quad \left.{\hat{u}_L}\right|_{y=0}=0,\\ \int_0^{h(x,t)}\hat{u}_L\,\mathrm{d}y=q_L(x,t). \end{gathered}\right\} \end{equation}

Finally, the unknown ${O}(\epsilon )$ velocity correction $\epsilon u^{(1)}_L$ is eliminated from the problem by multiplying the truncated form of (3.1b) with a weight function $w(y)$, integrating the result across the film thickness $h(x,t)$, and applying the tangential inter-phase coupling condition (3.1g). The weight function $w$ satisfies

(3.5ac)\begin{equation} \partial_{yy}w=\text{const.},\quad \left.{w}\right|_{y=0}=0,\quad \partial_yw|_{y=h}=0. \end{equation}

As a final result, we obtain the integral momentum equation for the liquid film,

(3.6a) \begin{align} & \partial_t q_L+\frac{17}{7}\,\frac{q_L}{h}\,\partial_xq_L-\frac{9}{7}\, \frac{q^2_L}{h^2}\,\partial_xh=\frac{5}{6}\,We\,h\,\partial_{xxx}h+ \frac{5}{6}\,Fr^{{-}2}\,h\left\{\sin\left(\phi\right)-\cos(\phi)\,\partial_xh\right\} \nonumber\\ &\quad +Re_L^{{-}1}\left\{-\frac{5}{2}\,\frac{q_L}{h^2}+4\,\frac{q_L}{h^2}\, \partial_xh^2-\frac{9}{2h}\,\partial_xq_L\,\partial_xh-6\,\frac{q_L}{h}\,\partial_{xx}h+ \frac{9}{2}\,\partial_{xx}q_L\right\} \nonumber\\ &\quad +\frac{\varPi_\mu\varPi_u}{\varPi_L}\,T_G\left\{Re_L^{{-}1} \left[\frac{5}{4}+\frac{h}{6}\,\partial_{xx}h+\frac{1}{2}\,\partial_{x}h^2\right]- \frac{5}{112}\,q_L\,\partial_xh-\frac{19}{336}\,\partial_xq_L h\right\} \nonumber\\ &\quad -\frac{19}{672}\,\frac{\varPi_\mu^2\varPi_u^2}{\varPi_L^2}\,h^2\,\partial_xh T_G^2- \frac{5}{6}\,Re_G^{{-}1}\,\frac{\varPi_\rho\varPi_u^2}{\varPi_L}\,h\,\partial_xP_G \nonumber\\ &\quad +\frac{\varPi_\mu\varPi_u}{\varPi_L}\left\{\partial_xT_G\left[Re_L^{{-}1}\, \frac{3}{4}\,h\,\partial_{x}h-\frac{15}{224}\,hq_L\right]-\frac{25}{1344}\, \frac{\varPi_\mu\varPi_u}{\varPi_L}\,h^3T_G\,\partial_xT_G-\frac{h^2}{48}\, \partial_tT_G\right\}, \end{align}

to which is added an integral continuity equation obtained by integrating (3.1a) across the liquid film and applying (3.1f):

(3.6b)\begin{equation} \partial_th+\partial_xq_L=0. \end{equation}

In the limit $T_G=\partial _xP_G=0$, (3.6a) reduces to (41) from Ruyer-Quil & Manneville (Reference Ruyer-Quil and Manneville2000). In the limit $\partial _xT_G=\partial _tT_G=\partial _xP_G=0$, it collapses with (3.9) from Samanta (Reference Samanta2014), except for a typo in the $T_G\,\partial _xh^2$ term of that reference. Here, we will neglect the terms involving $\partial _xT_G$ and $\partial _tT_G$, but we will account for the space and time variation of $T_G(x,t)$ and $P_G(x,t)$ in the remaining terms. This amounts to a quasi-developed approach. See Appendix C for a justification of this approximation.

Versus the model of Tseluiko & Kalliadasis (Reference Tseluiko and Kalliadasis2011), which is based on a linear representation of the gas response, our model accounts for the gas pressure $P_G$, which plays a role for the confinement considered here. It also accounts for streamwise viscous diffusion in the liquid, which is known to affect the dynamics of precursory capillary ripples (Ruyer-Quil & Manneville Reference Ruyer-Quil and Manneville2002).

3.2. Gas-side asymptotic long-wave model

We represent the turbulent flow of the gas (subscript $G$), with density $\rho _G$ and dynamic viscosity $\mu _G$, in two dimensions via the (dimensionless) Reynolds-averaged continuity and steady Navier–Stokes (RANS) equations, written here in the Cartesian gas-side coordinates $x$ and $\underline {y}$ (see figure 4) as

(3.7)\begin{equation} \partial_x u_G+\partial_{\underline{y}}v_G=0, \end{equation}
(3.8a)\begin{align} {\underline{\epsilon}}( u_G\,\partial_x u_G + v_G\,\partial_{\underline{y}} u_G) &={-}\frac{1}{{Re_G}}\,\partial_x p_G + \frac{\varPi_L}{\varPi_u^2}\,\frac{\sin(\phi)}{Fr^2} + \frac{1}{{Re_G}} \left\{\partial_{\underline{y} \underline{y}} u_G+{\underline{\epsilon}}^2\,\partial_{xx} u_G\right\} \nonumber\\ &\quad + \frac{1}{{Re_G}} \left\{\partial_{\underline{y}} \left(\frac{\mu_{t}}{\mu_G}\,\partial_{{\underline{y}}} u_G \right)+ {\underline{\epsilon}}^2\,\partial_x \left(\frac{\mu_{t}}{\mu_G}\, \partial_{x} u_G \right)\right\}, \end{align}
(3.8b)\begin{align} {\underline{\epsilon}}^3( u_G\,\partial_x v_G + v_G\, \partial_{{\underline{y}}} v_G) &={-}\frac{1}{{Re_G}}\, \partial_{{\underline{y}}} p_G+{\underline{\epsilon}} \frac{\varPi_L}{\varPi_u^2}\,\frac{\cos(\phi)}{Fr ^2} + \frac{1}{{Re_G}} \left\{{\underline{\epsilon}}^2\,\partial_{{\underline{y}} {\underline{y}}} v_G+{\underline{\epsilon}}^4\,\partial_{xx} v_G\right\} \nonumber\\ &\quad + \frac{1}{{Re_G}} \left\{{\underline{\epsilon}}^2\,\partial_{\underline{y}} \left(\frac{\mu_{t}}{\mu_G}\,\partial_{{\underline{y}}} v_G \right)+{\underline{\epsilon}}^4\,\partial_x \left(\frac{\mu_{t}}{\mu_G}\,\partial_{x} v_G \right)\right\}, \end{align}

where $\mu _{t}$ denotes the turbulent viscosity, $Re_G=\rho _G\mathcal {U}_G\mathcal {L}_G/\mu _G$ is the gas Reynolds number, and we have applied the scaling

(3.9ae)\begin{equation} u_G=\frac{u^\star_G}{\mathcal{U}_G},\quad v_G=\frac{v^\star_G}{\underline{\epsilon}\mathcal{U}_G},\quad x=\underline{\epsilon}\,\frac{x^\star}{\mathcal{L}_G},\quad \underline{y}=\frac{\underline{y}^\star}{\mathcal{L}_G},\quad p_G=p^\star_G\,\frac{\underline{\epsilon}\mathcal{L}_G}{\mu_G\mathcal{U}_G}, \end{equation}

introducing the gas-side long-wave parameter $\underline {\epsilon }=\mathcal {L}_G/\varLambda ^\star$. For the gas-side reference scales, we choose once and for all

(3.10a,b)\begin{equation} \mathcal{L}_G=H^\star,\quad \mathcal{U}_G=\frac{q_{G 0}^\star}{H^\star}, \end{equation}

where $q_{G 0}^\star$ is the nominal gas flow rate per unit width of the primary flow (subscript $0$), thus $\mathcal {U}_G$ corresponds to the superficial gas velocity. We have scaled pressure with a measure for the viscous shear stress, in contrast to (3.1d), where the dynamic pressure was used.

The turbulent viscosity $\mu _t$ is formulated via the mixing-length approach (Prandtl Reference Prandtl1925):

(3.11)\begin{equation} \frac{\mu_t}{\mu_G}=Re_G\,l_t^2\left|\partial_{\underline{y}}u_G\right|, \end{equation}

where $l_t=l_t^\star /\mathcal {L}_G$ denotes the dimensionless mixing length. At this point, a remark about choosing a turbulent viscosity model, such as (3.11), is in order. Luchini & Charru (Reference Luchini and Charru2019) have shown that such models cannot fully reproduce the momentum redistribution induced by wall perturbations to a parallel turbulent flow. Nonetheless, comparisons with different experiments (Zilker, Cook & Hanratty Reference Zilker, Cook and Hanratty1977; Frederick & Hanratty Reference Frederick and Hanratty1988) have shown that turbulent viscosity models based on the van Driest equation, which will be introduced in (3.22), capture satisfactorily the linear (Russo & Luchini Reference Russo and Luchini2016) and nonlinear (Tseluiko & Kalliadasis Reference Tseluiko and Kalliadasis2011; Camassa et al. Reference Camassa, Ogrosky and Olander2017) responses of the wall shear stress. Thus such models allow us to account adequately for the inter-phase coupling in our current configuration.

We assume a large gas/liquid velocity contrast $\varPi _u\gg 1$, which warrants two simplifications. First, we have neglected time derivatives in (3.8), as

(3.12)\begin{equation} {O}\left\{\frac{\partial_{t^\star} u^\star_G}{u^\star_G\, \partial_{x^\star} u^\star_G}\right\}=\frac{1}{\varPi_u}\ll 1, \end{equation}

assuming that the time scale is dictated by the waviness of the liquid film, i.e. $\mathcal {T}=\varLambda ^\star /\mathcal {U}_L$. Second, we set zero-velocity conditions at the film surface $\underline {y}=d$:

(3.13a)\begin{equation} u_G=v_G=0. \end{equation}

Thus, from the point of view of the gas, the film surface is represented as a frozen wavy wall (Tseluiko & Kalliadasis Reference Tseluiko and Kalliadasis2011). Our system is closed via a symmetry condition at $\underline {y}=0$:

(3.13b)\begin{equation} \partial_{\underline{y}}u_G=v_G=0. \end{equation}

The ultimate aim of the gas-side model, to be derived next, is to obtain the inter-phase coupling quantities in (3.6a), which are evaluated at $\underline {y}=d$, implying $l_{t}=0$:

(3.14a)\begin{gather} P_G=p_G, \end{gather}
(3.14b)\begin{align} T_G=\frac{T_G^\star}{\mu_G\mathcal{U}_G/\mathcal{L}_G} &={-}\partial_{\underline{y}} u_G-\left\{\epsilon^2\,\partial_xd^2-1\right\}^{{-}1} \left\{2\epsilon^2\,\partial_xd\,\partial_{\underline{y}} v_G\right. \nonumber\\ &\quad \left.{}+2\epsilon^2\,\partial_xd\,\partial_xu_G+\epsilon^2\,\partial_xv_G-\epsilon^4\, \partial_xd^2\,\partial_xv_G\right\}. \end{align}

Following Camassa et al. (Reference Camassa, Ogrosky and Olander2017), we introduce the curvilinear coordinates $\eta$ and $\xi$ (see figure 4), which will facilitate the account of turbulence:

(3.15a,b)\begin{equation} \eta=\underline{y}\,\frac{\bar{d}}{d},\quad \xi=x+\underline{\epsilon}\,F(\xi,\eta), \end{equation}

where $\bar {d}$ denotes the spatial average of $d$, and orthogonality implies

(3.16)\begin{equation} \partial_\eta F=\underline{\epsilon}\,\frac{d}{\bar{d}^2}\,\partial_\xi d\, \frac{1}{\underline{\epsilon}\,\partial_\xi F-1}. \end{equation}

Red dashed lines in figure 4 represent curves of constant $\eta$ and $\xi$, where

(3.17)\begin{equation} \left.{\partial_x\underline{y}}\right|_\eta={-}\left.{\partial_{\underline{y}}x}\right|_\xi= \frac{\underline{y}}{\bar{d}}\,\partial_xd. \end{equation}

Next, we recast the governing equations (3.8) and (3.13) in the curvilinear coordinate system (tilde symbol), using the projection rules

(3.18a,b)$$\begin{gather} u_G=\tilde{u}_G+{O}(\underline{\epsilon}^2),\quad v_G=\tilde{v}_G+\frac{\partial_\xi d}{\bar{d}}\,\eta \tilde{u}_G+{O}(\underline{\epsilon}), \end{gather}$$
(3.19a,b)$$\begin{gather}\partial_x=\partial_{\xi}-\eta\,\frac{\partial_\xi d}{d}\,\partial_\eta+ {O}(\underline{\epsilon}), \quad \partial_{\underline{y}}= \frac{\bar{d}}{d}\,\partial_\eta+{O}(\underline{\epsilon}^2), \end{gather}$$

and truncate the result at ${O}(\underline {\epsilon }^1)$. Upon eliminating the pressure variable $p$ in (3.8a) via an appropriate integration of (3.8b), we obtain

(3.20a)\begin{align} &\frac{\partial_\xi d}{d}\,\partial_\xi \tilde{u}_G+\partial_\xi \tilde{u}_G+ \frac{\bar{d}}{d}\,\partial_\eta \tilde{v}_G= 0, \end{align}
(3.20b)\begin{align} \underline{\epsilon}\tilde{u}_G\,\partial_\xi \tilde{u}_G+\underline{\epsilon}\, \frac{\bar{d}}{d}\,\tilde{v}_G\,\partial_\eta \tilde{u}_G &={-}\frac{1}{Re_G}\,\partial_\xi P_G+\frac{\varPi_L}{\varPi_u^2}\, \frac{1}{Fr^2}\left(\sin(\phi)+\underline{\epsilon}\cos(\phi)\,\partial_\xi d\right) \nonumber\\ &\quad +\frac{1}{Re_G}\,\frac{\bar{d}^2}{d^2}\left\{\partial_{\eta\eta} \tilde{u}_G+ \partial_\eta\left[\frac{\tilde{\mu}_t}{\mu_G}\,\partial_\eta\tilde{u}_G\right]\right\}, \end{align}

where $P_G=p_G|_{\eta =\bar {d}}$, and $\tilde {\mu }_t$ satisfies

(3.21)\begin{equation} \frac{\tilde{\mu}_t}{\mu_G}=\frac{d}{\bar{d}}\,Re_G\,\tilde{l}_t^2 \left|\partial_\eta \tilde{u}_G\right|, \end{equation}

with $\tilde {l}_t=l_t\bar {d}$/$d$.

In this curvilinear formulation, the variation of the mixing length $\tilde {l}_t$ is expressed in terms of $\eta$, i.e. normal to the film surface, thus correlations for parallel flows can be used. Following Tseluiko & Kalliadasis (Reference Tseluiko and Kalliadasis2011), we employ the van Driest equation (Van Driest Reference Van Driest1956)

(3.22)\begin{equation} \tilde{l}_t=\kappa\left(\bar{d}-\eta\right)\left\{1-\exp\left[\sqrt{\left|T_{G 0}\right|Re_G}\, \frac{\eta-\bar{d}}{A}\right]\right\}, \end{equation}

where $A=26$, $\kappa =0.41$ is the von Kármán constant, and $T_{G 0}$ denotes the primary-flow tangential stress, obtained by evaluating (3.30) in the limit $\underline {\epsilon }=0$, which intervenes in the traditional scaling based on the friction velocity $\mathcal {U}^+$:

(3.23a,b)\begin{equation} \mathcal{U}^+{=}\left\{\rho_G^{{-}1}\left|T^\star_{G 0}\right|\right\}^{1/2},\quad \mathcal{L}^+{=}\frac{\mu_G}{\rho_G \mathcal{U}^+}. \end{equation}

Finally, the boundary conditions (3.13) become

(3.24a,b)\begin{equation} \left.{\tilde{u}_G}\right|_{\eta=\bar{d}}=\left.{\tilde{v}_G}\right|_{\eta=\bar{d}}=0,\quad {\partial_\eta \tilde{u}_G}|_{\eta=0}=\left.{\tilde{v}_G}\right|_{\eta=0}=0. \end{equation}

The boundary-value problem (BVP) given by (3.20) and (3.24a,b) is solved order by order based on a regular expansion in $\underline {\epsilon }$ around $\underline {\epsilon }=0$ (Camassa et al. Reference Camassa, Ogrosky and Olander2017):

(3.25a)\begin{align}\tilde{u}_G=\tilde{u}_G^{(0)}+\underline{\epsilon}\tilde{u}_G^{(1)}+{O}(\underline{\epsilon}^2),\end{align}
(3.25b)\begin{align}\tilde{v}_G=\tilde{v}_G^{(0)}+ \underline{\epsilon}\tilde{v}_G^{(1)}+{O}(\underline{\epsilon}^2),\end{align}
(3.25c)\begin{align}P_G=P_G^{(0)}+\underline{\epsilon}P_G^{(1)}+{O}(\underline{\epsilon}^2).\end{align}

The zeroth-order problem is obtained by inserting (3.25a) into (3.20) and (3.24a,b), and then truncating at ${O}(\underline {\epsilon }^0)$. We anticipate a solution in the form of the product ansatz

(3.26)\begin{equation} \tilde{u}_G^{(0)}=g_0(\xi)\,U_0(\eta)=\frac{\bar{d}}{d}\,U_0(\eta), \end{equation}

which leads to the variable-separated zeroth-order momentum equation

(3.27a)\begin{equation} \frac{d^3}{\bar{d}^3}\left\{\frac{1}{Re_G}\,\partial_\xi P_G^{(0)}- \frac{\varPi_L}{\varPi_u^2}\,\frac{1}{Fr^2}\sin(\phi)\right\}=\frac{1}{Re_G}\, \partial_{\eta\eta}U_0+\partial_\eta\left\{\tilde{l}_t^2\,\text{sgn} \left(\partial_\eta U_0\right)\left(\partial_\eta U_0\right)^2\right\}=C_0, \end{equation}

subject to the boundary conditions

(3.27b)\begin{equation} \left.{U_0}\right|_{\eta=\bar{d}}={\partial_\eta U_0}|_{\eta=0}=0, \end{equation}

where we have employed the signum function $\textrm {sgn}$ to substitute $|\partial _\eta U_0|=\textrm {sgn}(\partial _\eta U_0)\,\partial _\eta U_0$, and the separation constant $C_0$ is obtained from the gauge condition

(3.27c)\begin{equation} \int_0^d\tilde{u}_G^{(0)}\,{\rm d}\tilde{y}=\int_0^{\bar{d}}U_0\,{\rm d}\eta=\frac{q_{G 0}}{2}=\frac{1}{2}. \end{equation}

At the next order, i.e. ${O}(\underline {\epsilon }^1)$, we obtain in a similar way

(3.28a)\begin{align} & \frac{d^2}{\bar{d}^2}\left\{\frac{1}{Re_G}\,\partial_\xi P_G^{(1)}\, \frac{d}{\partial_\xi d}-\frac{\varPi_L}{\varPi_u^2}\,\frac{1}{Fr^2}\cos(\phi)\,d\right\} = U_0^2+\frac{1}{Re_G}\,\partial_{\eta\eta}U_1 \nonumber\\ &\quad +\partial_\eta\left\{\tilde{l}_t^2\,\text{sgn}\left(\partial_\eta U_0\right) \partial_\eta U_0\,\partial_\eta U_1\right\}=C_1, \end{align}
(3.28b)$$\begin{align}& \left.{U_1}\right|_{\eta=\bar{d}}={\partial_\eta U_1}|_{\eta=0}=0, \end{align}$$
(3.28c)$$\begin{align}&\int_0^d\tilde{u}_G^{(1)}\,{\rm d}\tilde{y}=\int_0^{\bar{d}}U_1\,{\rm d}\eta=0, \end{align}$$

where we have employed the product ansatz

(3.29)\begin{equation} \tilde{u}_G^{(1)}=g_1(\xi)vU_1(\eta)=\frac{\partial_\xi d}{d}\,U_1(\eta), \end{equation}

and the separation constant $C_1$ is obtained from (3.28c).

The two BVPs (3.27) and (3.28) are solved numerically for $U_0$, $U_1$, $C_0$ and $C_1$ via the continuation software Auto07P (Doedel Reference Doedel2008). The solution is obtained for a given $\bar {d}$ on a fixed domain spanning $0\le \eta \le \bar {d}$. Based on this, the coupling quantities $T_G$ and $\partial _x P_G$, which appear in the liquid-side model (3.6a), are constructed readily at ${O}(\underline {\epsilon }^1)$:

(3.30a)\begin{align} T_G&={-}\frac{\bar{d}}{d}\left.\partial_\eta \tilde{u}_G\right|_{\eta=\bar{d}}+ {O}(\underline{\epsilon}^2)={-}\frac{\bar{d}}{d}\left\{\left.\partial_\eta \tilde{u}_G^{(0)}\right|_{\eta=\bar{d}}+\underline{\epsilon}\left.\partial_\eta \tilde{u}_G^{(1)}\right|_{\eta=\bar{d}} \right\}+{O}(\underline{\epsilon}^2), \nonumber\\ &={-}\frac{\bar{d}^2}{d^2}\left\{\left.\partial_\eta U_0\right|_{\eta=\bar{d}}+ \frac{\partial_{x^\star} d^\star}{\bar{d}}\left.\partial_\eta U_1\right|_{\eta=\bar{d}} \right\}+ {O}(\underline{\epsilon}^2), \end{align}
(3.30b)\begin{align} \partial_x P_G&=\partial_\xi P_G^{(0)}+\underline{\epsilon}\,\partial_\xi P_G^{(1)}+ {O}(\underline{\epsilon}^2) \nonumber\\ &=Re_G\left\{\frac{\bar{d}^3}{d^3} \left(C_0+C_1\,\frac{\partial_{x^\star}d^\star}{\bar{d}}\right)+\frac{\varPi_L}{\varPi_u^2} \frac{1}{Fr^2}\left(\sin(\phi)+\cos(\phi)\,\partial_{x^\star}d^\star\right)\right\}+ {O}(\underline{\epsilon}^2), \end{align}

where we have used the velocity expansion (3.25a):

(3.31)\begin{equation} \tilde{u}_G=\frac{\bar{d}}{d}\,U_0+\frac{\partial_{x^\star}d^\star}{d}\,U_1+ {O}(\underline{\epsilon}^2). \end{equation}

Importantly, at fixed $\bar {d}$, $T_G$ and $\partial _x P_G$ in (3.30) depend only on $d=D-h/\varPi _L$, which varies with $x$ and $t$. By contrast, Samanta (Reference Samanta2014) assumed $T_G=\textrm {const}$ and $\partial _x P_G=0$.

In contrast to the gas-side description of Demekhin (Reference Demekhin1981) and Tseluiko & Kalliadasis (Reference Tseluiko and Kalliadasis2011), (3.30) is obtained from a long-wave not small-wave amplitude expansion. Thus it works better when the liquid holdup is larger, whereas the cited models work better when the liquid holdup is small, i.e. $h^\star /\bar {d}^\star \to 0$.

As a result of our frozen-interface assumption ($\varPi _u{\gg }1$) expressed via (3.13), one would obtain exactly the same relations for the functions $U_0$ and $U_1$ appearing in (3.30) should one apply no-slip and no-penetration conditions at $y^\star =H^\star$ instead of a symmetry condition at $y^\star =D^\star$. This is because the BVPs for $U_0$ (3.27) and $U_1$ (3.28) would remain symmetrical in that case. Thus, up to the order of expansion of our WRIBL-LW model, our symmetry condition (3.13b) is valid without loss of generality.

3.3. Rescaling

For the remainder of the paper, we rescale streamwise lengths by setting $\epsilon =\underline {\epsilon }=1$, and we choose

(3.32ac)\begin{equation} \mathcal{L}=\mathcal{L}_G=H^\star,\quad \mathcal{U}_L=\frac{q_{L 0}^\star}{H^\star},\quad \mathcal{U}_G=\frac{q_{G 0}^\star}{H^\star}. \end{equation}

This implies $\varPi _L=1$, i.e. all lengths are now scaled with the channel height $H^\star$. We recall that $q_{L 0}^\star$ and $q_{G 0}^\star$ are the primary-flow liquid and gas flow rates per unit width, thus $\mathcal {U}_L$ and $\mathcal {U}_G$ are the superficial velocities. The corresponding Reynolds numbers are

(3.33a,b)\begin{equation} Re_L=\frac{q_{L 0}^\star}{\nu_L},\quad Re_G=\frac{q_{G 0}^\star}{\nu_G}, \end{equation}

where $\nu _L=\mu _L/\rho _L$ and $\nu _G=\mu _G/\rho _G$.

At some places, we will rescale quantities with the natural scales

(3.34ac)\begin{equation} \mathcal{L}_\nu=\nu_L^{2/3}g^{{-}1/3},\quad \mathcal{U}_\nu=(\nu_L g)^{1/3},\quad \mathcal{T}_\nu=\frac{\mathcal{L}_\nu}{\mathcal{U}_\nu}=\nu_L^{1/3}g^{{-}2/3}. \end{equation}

3.4. Model computations

We perform three types of numerical computations based on our WRIBL-LW model (3.6), (3.30): linear stability calculations, nonlinear computations of TWS, and nonlinear computations of spatially evolving falling liquid films.

To obtain the linear stability formulation, we perturb the dependent variables $q_L$ and $h$ around their primary flow values $q_{L 0}$ and $h_0$:

(3.35a)$$\begin{gather} q_L=q_{L 0}+\check{q}_L(x,t)=q_{0}+\hat{q}\exp\{{\rm i}(kx-\omega t)\}, \end{gather}$$
(3.35b)$$\begin{gather}h=h_0+\check{h}(x,t)=h_0+\hat{h}\exp\{{\rm i}(kx-\omega t)\}, \end{gather}$$

where the check mark denotes infinitesimal perturbations, $\omega$ denotes the angular frequency, and $\hat {q}_L=\hat {h}\omega /k$ follows from (3.6b). Surface waves resulting from the Kapitza instability grow spatially, but a counter-current gas flow can cause the onset of AI. Both phenomena can be captured via a spatial stability formulation (Vellingiri et al. Reference Vellingiri, Tseluiko and Kalliadasis2015). Thus we will usually (but not exclusively) assume $k \in \mathbb {C}$ and $\omega \in \mathbb {R}$, with

(3.36)\begin{equation} k = k_r + {\rm i} k_i, \end{equation}

where $k_r=2{\rm \pi} /\varLambda$ is the physical wavenumber, and $-k_i$ is the spatial growth rate.

The film surface perturbation (3.35b) translates to the gas-side problem via

(3.37)\begin{equation} d=d_0+\check{d}=d_0+\hat{d}\exp\{{\rm i}(kx-\omega t)\},\quad\hat{d}={-}\frac{\hat{h}}{\varPi_L}. \end{equation}

Inserting this in (3.30) and then linearizing yields the linear responses of the inter-phase coupling quantities:

(3.38a)$$\begin{gather} T_G=T_{G 0}+\check{T}_G=T_{G 0}+\hat{T}_G\exp\{{\rm i}(kx-\omega t)\}, \end{gather}$$
(3.38b)$$\begin{gather}P_G=P_{G 0} + \check{P}_G=P_{G 0}+\hat{P}_G\exp\{{\rm i}(kx-\omega t)\}, \end{gather}$$

with

(3.39a,b)$$\begin{gather} T_{G 0} ={-}\partial_{\eta} U_0 |_{d_0},\quad \hat{T}_G=\frac{\hat{d}}{d_0}\left\{2\,\partial_{\eta} U_0 |_{d_0}+ \varPi_L {\rm i}k\,\partial_{\eta} U_1 |_{d_0}\right\}, \end{gather}$$
(3.40a,b)$$\begin{gather}\partial_xP_{G 0}=Re_{G}\left\{C_0+\frac{\varPi_L}{\varPi_u^2}\, \frac{\sin(\phi)}{Fr^2}\right\},\quad \hat{P}_G={-}Re_{G}\,\frac{\hat{d}}{{\rm i}k} \left\{3\,\frac{C_0}{d_0}-\varPi_L\,\frac{C_1}{d_0}-\frac{\varPi_L^2}{\varPi_u^2}\, \frac{\cos\left(\phi\right)}{Fr^2}\right\}. \end{gather}$$

Introducing (3.35) and (3.38) into (3.6), and linearizing once again, yields the dispersion relation for the spatial stability problem:

(3.41) \begin{align} {DR}&={-}{\rm i}\omega^2+{\rm i}k\omega\,\frac{17}{7}\, \frac{q_{L 0}}{h_0}-{\rm i}k^2\,\frac{9}{7}\,\frac{q_{L 0}^2}{h_0^2}+ \frac{5}{6}\,Fr^{{-}2}\left\{{\rm i}k^2\cos(\phi)\,h_0-k\sin(\phi)\right\} \nonumber\\ &\quad -{\rm i}^3k^4\,\frac{5}{6}\,We\,h_0+\frac{5}{2}\,\frac{1}{Re_L}\,\frac{1}{h_0^2} \left\{\omega-2k\,\frac{q_{L 0}}{h_0}\right\}+{\rm i}^2k^3\,\frac{6}{Re_L}\, \frac{q_{L 0}}{h_0}-{\rm i}^2k^2\omega\,\frac{9}{2}\,\frac{1}{Re_L} \nonumber\\ &\quad +\frac{\varPi_\mu \varPi_u}{\varPi_L} \left\{T_{G 0} \left[{\rm i}k\omega\,\frac{19}{336}\,h_0-{\rm i}^2k^3\,\frac{1}{6}\,\frac{1}{Re_L}\,h_0+{\rm i} k^2\, \frac{5}{112}\,q_{L 0}\right]+k\,\frac{5}{4}\,\frac{1}{Re_L}\,\frac{1}{\varPi_L}\, \frac{\hat{T}_G}{\hat{d}}\right\} \nonumber\\ &\quad +{\rm i}k^2\,\frac{19}{672}\,\frac{\varPi_\mu^2 \varPi_u^2}{\varPi_L^2}\,h_0^2T_{G 0}^2+k\, \frac{5}{6}\,\frac{\varPi_\rho \varPi_u^2}{\varPi_L}\,\frac{1}{Re_{G}} \left\{\partial_xP_{G 0}-\frac{h_0}{\varPi_L}\,{\rm i}k\, \frac{\hat{P}_G}{\hat{d}}\right\}=0, \end{align}

where $\hat {d}$ will cancel, due to $\hat {T}_G\propto \hat {d}$ and $\hat {P}_G\propto \hat {d}$, according to (3.39a,b) and (3.40a,b).

To compute nonlinear TWS, we recast (3.6a) into an ordinary differential equation in terms of the wave coordinate $\gamma =x-ct$:

(3.42a)$$\begin{gather} h'''={NL}(h,h',h'';\bar{h},c,q^{MF}_L), \end{gather}$$
(3.42b)$$\begin{gather}q^{MF}_L=q_L-hc=\bar{q}_L-\bar{h}c, \end{gather}$$

where primes denote differentiation with respect to $\gamma$, bars signify averaging over the wavelength $\varLambda$ in terms of $\gamma$, $c$ denotes the nonlinear wave speed, and the superscript ${MF}$ refers to the moving reference frame. Further, (3.42b) is the integral form of (3.6b), which we have used to eliminate $q$ from (3.42a). The system is closed through periodicity boundary conditions

(3.42c)$$\begin{gather} \left.{h^{(j)}}\right|_{\gamma=0}=\left.{h^{(j)}}\right|_{\gamma=\varLambda},\quad j=0,1,2, \end{gather}$$

and it is solved for a fixed value of $\bar {q}_L$, enforced through the integral condition

(3.43)$$\begin{gather} \varLambda^{{-}1}\int_0^\varLambda q_L\,{\rm d}\gamma=\bar{q}_L. \end{gather}$$

We do this numerically via the continuation software Auto07P, after recasting (3.42a) into a dynamical system. First, we continue the fixed-point solutions ($h'=h''=h''''=0$) of (3.42a) at $q_L=q_{L 0}$ and $h=h_0$ in terms of $c$, until reaching the Hopf bifurcation of the Kapitza instability. Then, starting from this point, periodic solutions are continued in terms of a selected control parameter, e.g. the liquid Reynolds number $Re_L$. The BVPs associated with the turbulent gas flow, (3.27) and (3.28), are solved simultaneously. In addition, we solve the linear dispersion relation (3.41) for the spatially most-amplified angular frequency $\omega _{max}$:

(3.44a,b)\begin{equation} {DR}(\omega_{max},k)=0,\quad \left.{\partial_\omega k_i}\right|_{\omega=\omega_{max}}=0. \end{equation}

By imposing $f=f_{max}=\omega _{max}/2/{\rm \pi}$, TWS most likely to emerge in an experiment can be tracked.

To compute the spatial evolution of nonlinear Kapitza waves, we solve (3.6a) and (3.6b) numerically on an open domain with inlet/outlet conditions. Details of the numerical scheme are given in Appendix F3 of Kalliadasis et al. (Reference Kalliadasis, Ruyer-Quil, Scheid and Velarde2012). In particular, we apply a second-order central-differences spatial discretization and a quasi-linearized Crank–Nicolson time integration. At the liquid outlet, we impose the soft boundary conditions of Richard, Ruyer-Quil & Vila (Reference Richard, Ruyer-Quil and Vila2016). At the liquid inlet, we prescribe explicitly $h$ and $q$ at the first two grid points ($i_x=1,2$), based on the primary flow:

(3.45a)$$\begin{gather} \left.h\right|_{i_x=1}=\left.h\right|_{i_x=2}=h_0, \end{gather}$$
(3.45b)$$\begin{gather}\left.q_L\right|_{i_x=1}=\left.q_L\right|_{i_x=2}=q_{L 0}\left[1+F(t)\right], \end{gather}$$

where the function $F(t)$ allows us to apply a tailored inlet forcing,

(3.46)\begin{equation} F(t)=\varepsilon_1\sin(2{\rm \pi} ft)+\varepsilon_2 \sum_{k=1}^{N} \sin(2{\rm \pi} k\,{\rm \Delta} f\,t+\varphi_{rand}),\quad {\rm \Delta} f=2f_{c}/N. \end{equation}

The first RHS term in (3.46) constitutes a harmonic perturbation of frequency $f$, and the second RHS term mimics white noise through a series of $N=1000$ Fourier modes that are shifted by a random phase shift $\varphi _{rand}=\varphi _{rand}(k)\in [0,2{\rm \pi} ]$ and span a frequency range of twice the linear cut-off frequency $f_{c}$ (Chang, Demekhin & Kalaidin Reference Chang, Demekhin and Kalaidin1996a). When $\varepsilon _1=0$, the inlet perturbation consists of only white noise. This setting will be used to simulate the natural, noise-driven evolution of a wavy film as it would occur in a real system. In other computations, we will apply additional coherent inlet forcing by setting $\varepsilon _1> 0$.

4. Linear stability analysis based on full RANS equations

The long-wave asymptotic expansion underlying the gas-side representation (3.30) in our WRIBL-LW model is truncated at order $\underline {\epsilon }^1$, whereas our liquid-side representation (3.6) is consistent up to order $\epsilon ^2$. To validate linear stability predictions based on this model, and to go beyond its limitations, we introduce two linear stability formulations that are based on the full RANS equations in the gas (4.3). The first formulation (§ 4.1) relies on the WRIBL model in the liquid (3.6), and we designate this approach as WRIBL-OS, where OS refers to the Orr–Sommerfeld equation. The second formulation (§ 4.2) relies on the full Navier–Stokes equations in the liquid (4.1a,b), and we designate that approach as OS-OS.

4.1. The WRIBL-OS approach

In our WRIBL-OS approach, the linear response of the liquid film is governed by the dispersion relation (3.41), but the perturbation amplitudes $\hat {T}_G$ and $\hat {P}_G$ are now obtained from the full (steady) RANS equations (3.8). For this, we recast (3.8) in terms of the curvilinear coordinates (3.15a,b) and introduce the gas stream function $\varPsi$,

(4.1a,b)\begin{equation} \tilde{u}=\frac{\bar{d}}{d}\,\partial_{\eta}\varPsi,\quad \tilde{v}={-}\partial_{\xi}\varPsi, \end{equation}

which we perturb, along with $p_G$ and $d$, around the primary flow (subscript $0$):

(4.2a)$$\begin{gather} \varPsi=\varPsi_0+\check{\varPsi}=\varPsi_0+\psi(\eta)\exp\left\{{\rm i}(k\xi-\omega t)\right\}, \end{gather}$$
(4.2b)$$\begin{gather}p_G=p_{G 0}+\check{p}_G=p_{G 0}+\hat{p}_G(\eta)\exp\left\{{\rm i}(k\xi-\omega t)\right\}, \end{gather}$$
(4.2c)$$\begin{gather}d=d_0+\check{d}=d_0+\hat{d}\exp\left\{{\rm i}(k\xi-\omega t)\right\}, \end{gather}$$

where $k=k_r\in \mathbb {R}$, and the time dependence is included formally to account for the unsteadiness of the liquid film. Upon linearization and subtraction of the primary flow, we obtain the linearized curvilinear RANS equations ${OS}_\xi$ in the $\xi$ direction,

(4.3a) \begin{align} & Re_{G}\,{\rm i}k\left\{\psi'\varPsi_0'-\frac{\hat{d}}{d_0}\, \varPsi_0'^2-\psi\varPsi_0''\right\}+Re_{G}\,\tilde{l}_{t}\left|\varPsi_0''\right| \left\{\tilde{l}_{t}'\left[k^2\left({-}2\psi+3\,\frac{\hat{d}}{d_0}\,\eta\varPsi_0'\right) \right.\right. \nonumber\\ &\qquad \left. -\,4\psi''+6\,\frac{\hat{d}}{d_0}\,\varPsi_0''\right]+\tilde{l}_{t} \left[{-}2\psi'''+6\,\frac{\hat{d}}{d_0}\,\varPsi_0'''-2\,\frac{\varPsi_0'''}{\varPsi_0''}\,\psi'' \right.\nonumber\\ &\qquad \left.\left. +\,k^2\left(-\psi'+\frac{3}{2}\,\frac{\hat{d}}{d_0}\,\varPsi_0'+\frac{3}{2}\, \frac{\hat{d}}{d_0}\,\eta\varPsi_0''-\frac{\varPsi_0'''}{\varPsi_0''}\,\psi+\frac{3}{2}\, \frac{\hat{d}}{d_0}\,\eta\,\frac{\varPsi_0'''\varPsi_0'}{\varPsi_0''}\right)\right]\right\} \nonumber\\ &\quad ={-}{\rm i\ }k\hat{p}_G+\psi'''-3\,\frac{\hat{d}}{d_0}\,\varPsi_0'''-k^2\left\{\psi'-\frac{\hat{d}}{d_0}\, \varPsi_0'-\frac{\hat{d}}{d_0}\,\eta\varPsi_0''\right\}, \end{align}

and ${OS}_\eta$ in the $\eta$ direction,

(4.3b) \begin{align} & Re_{G}\,k^2\left\{\psi\varPsi_0'-\frac{\hat{d}}{d_0}\,\eta\varPsi_0'^2\right\}+ Re_{G}\,\tilde{l}_{t}\left|\varPsi_0''\right|{\rm i}k\left\{2\tilde{l}_{t}'\,\frac{\hat{d}}{d_0}\, \eta\varPsi_0''+\tilde{l}_{t}\left[{-}2\psi''+2\,\frac{\hat{d}}{d_0}\,\varPsi_0''\right.\right. \nonumber\\ &\quad \left.\left.{}+2\eta\,\frac{\hat{d}}{d_0}\,\varPsi_0'''+k^2\left(-\psi+\frac{3}{2}\, \frac{\hat{d}}{d_0}\,\eta\varPsi_0'\right)\right]\right\}={-}\hat{p}'_G-{\rm i}k^3 \left\{-\psi+\frac{\hat{d}}{d_0}\,\eta\varPsi_0'\right\} \nonumber\\ &\quad\ -{\rm i}k\left\{\psi''-2\,\frac{\hat{d}}{d_0}\,\varPsi_0''-\frac{\hat{d}}{d_0}\,\eta\varPsi_0'''\right\}, \end{align}

where primes denote differentiation with respect to $\eta$. The pressure perturbation amplitude $\hat {p}_G$ can be removed from (4.3a) and (4.3b) via the final gas-side Orr–Sommerfeld equation

(4.3c)\begin{equation} \partial_{\eta}{OS}_\xi-{\rm i}k\,{OS}_\eta, \end{equation}

involving only $\psi$ and its derivatives. The problem is closed with the boundary conditions (3.24a,b):

(4.3d) \begin{equation} {\psi''}|_{\eta=0}=0,\quad \left.{\psi}\right|_{\eta=0}=0,\quad {\psi'}|_{\eta=d_0}=0,\quad \left.{\psi}\right|_{\eta=d_0}=0. \end{equation}

We solve (4.3) numerically for $\psi$ with the continuation software Auto07P, starting from the analytically tractable laminar long-wave limit ($\tilde {l}_{t}=k=0$). The amplitudes of the linear perturbations of the inter-phase coupling quantities,

(4.4a,b)\begin{equation} \check{T}_G=\hat{T}_G\exp\left\{{\rm i}(k\xi-\omega t)\right\},\quad \check{P}_G=\hat{P}_G\exp\left\{{\rm i}(k\xi-\omega t)\right\}, \end{equation}

can be obtained readily by recasting (3.14) in curvilinear coordinates, inserting (4.2), and linearizing:

(4.5a)$$\begin{gather} \hat{T}_G={-}\left.{\psi''}\right|_{\eta=d_0}+2\,\frac{\hat{d}}{d_0}\left.{\varPsi_0''}\right|_{\eta=d_0}, \end{gather}$$
(4.5b)$$\begin{gather}{\rm i}k\hat{P}_G=\left\{\left.{\psi'''}\right|_{\eta=d_0}-3\,\frac{\hat{d}}{d_0} \left.{\varPsi_0'''}\right|_{\eta=d_0}+k^2\hat{d}\left.{\varPsi_0''}\right|_{\eta=d_0}\right\}. \end{gather}$$

We point out that $\psi \propto \hat {d}$, thus $\hat {d}$ once again cancels from (3.41), as it should. Also, the spatial variations prescribed in (3.37) and (4.2) are equivalent in the linear limit $\hat {d}\to 0$, where the curvilinear coordinates collapse with the Cartesian ones. Thus $\partial _x\check {P}_G=\partial _\xi \check {P}_G$.

Figures 5(a) and 5(b) represent spatial linear stability predictions obtained with our WRIBL-OS approach, based on (3.41) and (4.3c), for parameters according to the experiments of Kofman et al. (Reference Kofman, Mergui and Ruyer-Quil2017) in an $H^\star =19$ mm channel. According to figure 5(a), the maximum of the growth rate dispersion curve increases with increasing counter-current gas flow rate, until forming a pinch point at $Re_G=-8490$, where the AI limit is reached (curve with crosses).

Figure 5. Spatial linear stability calculations with the WRIBL-OS approach. Parameters based on experiments of Kofman et al. (Reference Kofman, Mergui and Ruyer-Quil2017): $Ka=3174$ (water and air I in table 1), $\phi =5^\circ$, $Re_L=45$. Circles: passive-gas limit, $\varPi _\rho =\varPi _\mu =0$ in (3.41). Values of $|Re_G|$ increase in the order diamonds, squares, crosses, pentagons. (a,c) Full model, (b,d) $\varPi _\rho =0$ in (3.41), with (a,b) $H^\star =19$ mm, (c,d) $H^\star =40$ mm. Here: (a) $Re_G=[-6234, -8145, -8490\ (\textrm {AI})]$, dashed line $Re_G=-8500$; (b) $Re_G=[-6234, -8145, -8490, -15\,000]$; (c) $Re_G=[-8145, -15\,000, -20\,430 \ (\textrm {AI\ limit})]$, dashed line $Re_G=-20\,440$; (d) $Re_G=[-8145, -15\,000, -20\,430, -35\,000]$. We have rescaled $\omega$ with $\mathcal {T}_\nu =2.207\times 10^{-3}$ s (see (3.34ac)).

Table 1. Fluid combinations used in our computations. The Kapitza number is defined as $Ka=\sigma/(\rho_L g^{1/3} \nu_L^{4/3})$, where $\sigma$, $\rho _L$ and $\nu _L$ denote the surface tension, density and kinematic viscosity of the liquid, and $g$ designates the gravitational acceleration.

This destabilization of the liquid film is caused by the inter-phase pressure coupling, as can be deduced by confronting figure 5(a) with figure 5(b), where we have represented corresponding growth rate curves in the limit $\varPi _\rho =0$. In that case, the gas effect enters only via $T_G$, and we observe a stabilization of the liquid film at large $|Re_G|$ (compare crosses and pentagons). Models that do not account for the gas pressure $P_G$ – e.g. the weak-confinement first-order WRIBL model of Tseluiko & Kalliadasis (Reference Tseluiko and Kalliadasis2011) – may thus give qualitatively incorrect linear stability predictions for the current configuration. The same observation also holds at weaker confinement, as shown by confronting figures 5(c) and 5(d), where we have chosen $H^\star =40$ mm.

As a result of our frozen-interface assumption ($\varPi _u{\gg }1$) expressed through the last two equations in (4.3d), one would obtain exactly the same linear stability problem (4.3) should one apply no-slip and no-penetration conditions at $y^\star =H^\star$ instead of a symmetry condition at $y^\star =D^\star$. This is because the primary gas flow would remain symmetrical about the centreline of the gas layer. Thus for all linear stability calculations based on the gas-side OS BVP (4.3), our symmetry condition (4.3d) is valid analytically.

4.2. The OS-OS approach

Linear stability calculations based on our WRIBL-LW and WRIBL-OS approaches may be limited to long-wave instability modes. To capture short-wave instability modes (§ 6.2), we introduce a stability formulation based on the full Navier–Stokes equations (4.1a,b) in the liquid and the full RANS equations (4.3) in the gas.

The gas-side linear response is governed by the same equations as in the WRIBL-OS approach, i.e. (4.3) and (4.5), and we focus here on deriving the equations governing the liquid-side linear response. For this, we perturb the film thickness as

(4.6)\begin{equation} h=h_0+\check{h}=h_0+\hat{h}\exp\left\{{\rm i}k(x-ct)\right\}, \end{equation}

assuming a temporal stability formulation this time, i.e. $k\in \mathbb {R}$ and $c=c_r+\textrm {i}c_i\in \mathbb {C}$, where $c_r$ denotes the wave speed, and $k c_i$ is the temporal growth rate.

We start with the full governing equations (4.1a,b). Considering these in the limit of fully developed flow with $h=h_0$ yields the liquid primary flow

(4.7a)$$\begin{gather} u_{L 0}=\frac{1}{2}\,Re_L\left\{\varPi_\rho\,\partial_xp_{G 0}- \frac{\sin(\phi)}{Fr^2}\right\}(y^2-2yh_0)+ \frac{\varPi_\mu\varPi_u}{\varPi_L}\,T_{G 0}y, \end{gather}$$
(4.7b)$$\begin{gather}\partial_y p_{L 0}={-}\frac{\cos(\phi)}{Fr^2}. \end{gather}$$

Next, we introduce the liquid stream function $\varPhi$,

(4.8a,b)\begin{equation} u_L=\partial_{y}\varPhi,\quad v_L={-}\partial_{x}\varPhi, \end{equation}

which we perturb around the primary flow:

(4.9)\begin{equation} \varPhi=\varPhi_0+\check{\varPhi}=\varPhi_0+\phi(y)\exp\left\{{\rm i}k(x-ct)\right\}. \end{equation}

Substituting (4.8a,b) and (4.9) into (4.1a,b), linearizing with respect to $\check {\varPhi }$, subtracting the primary flow, and applying standard manipulations, we obtain the liquid-side Orr–Sommerfeld equation

(4.10a)\begin{equation} \phi^{{\rm i}v}-2k^2\phi''+k^4\phi={\rm i}k\,Re_L\left\{\left(c-u_{L 0}\right) \left(k^2\phi-\phi''\right)-\phi u''_{L 0}\right\}, \end{equation}

the boundary conditions at $y=0$

(4.10b)\begin{equation} \phi''=\phi=0, \end{equation}

and the inter-phase coupling conditions at $y=h_0$,

(4.10c)\begin{align} &\phi u_{L 0}''+\tilde{c}\left\{\phi''+k^2\phi\right\}=\varPi_\mu\varPi_u\tilde{c}\hat{\underline{T}}_G, \end{align}
(4.10d)\begin{align} & -\frac{1}{Re_L}\left\{2k^2\phi u_{L 0}'+\tilde{c} \left[3 k^2\phi'-\phi'''\right]\right\}-{\rm i} k\tilde{c}\left\{-\tilde{c}\phi'-\phi u_{L 0}\right\} \nonumber\\ &\quad +{\rm i}k\phi p_{L 0}'={\rm i}k\,\frac{\varPi_\rho\varPi_u^2}{Re_{G}}\, \tilde{c}\hat{\underline{P}}_G+{\rm i} k^3\,We\,\phi, \end{align}

where primes denote differentiation with respect to $y$, and we have introduced $\tilde {c}=c-{u_{L 0}}|_{y=h_0}$. The nonlinearity involving $\tilde {c}$ in (4.10d) can be eliminated via (4.10c). Further, $\hat {\underline {T}}_G$ and $\hat {\underline {P}}_G$ are rescaled versions of the amplitudes in (4.5):

(4.11a,b)\begin{equation} \hat{\underline{T}}_G={-}\hat{h}\,\frac{\hat{T}_G}{\hat{d}},\quad \hat{\underline{P}}_G=\hat{h}\,\frac{\hat{P}_G}{\hat{d}}, \end{equation}

where $\hat {d}$ is an arbitrary deflection amplitude used in the solution of the gas-side problem (4.3), and $\hat {h}$ is linked directly to $\phi$ via the kinematic condition (3.1f),

(4.12)\begin{equation} \hat{h}=\frac{\left.{\phi}\right|_{y=h_0}}{\tilde{c}}. \end{equation}

The rescaling in (4.11a,b) allows us to solve the gas- and liquid-side problems sequentially.

We solve the two-phase BVP comprising (4.3) and (4.10) by expanding the stream function amplitudes $\phi$ and $\psi$ in terms of Chebyshev polynomials (Boomkamp et al. Reference Boomkamp, Boersma, Miesen and Beijnon1997; Barmak et al. Reference Barmak, Gelfgat, Vitoshkin, Ullman and Brauner2016b):

(4.13a,b)\begin{equation} \phi(\zeta)=c_{L 0}+\sum_{j=1}^{Np}c_{{l}j}\,T_j(\zeta),\quad \psi(\zeta)=c_{G 0}+\sum_{j=1}^{Np}c_{{g}j}\,T_j(\zeta), \end{equation}

where $T_j$ are $j$th-degree Chebyshev polynomials of the first kind, defined on the interval $\zeta \in [-1,1]$, with

(4.14)$$\begin{gather} \zeta=2\,\frac{y}{h_0}-1\quad \text{for}\ 0\le y\le h_0, \end{gather}$$
(4.15)$$\begin{gather}\zeta=1-2\,\frac{{\eta}}{d_0}\quad \text{for}\ 0\le {\eta}\le d_0. \end{gather}$$

Thus there are $2(N_p+1)$ unknown coefficients $c_{kj}$, which are fixed by the eight conditions in (4.10b), (4.10c), (4.10d) and (4.3d), and $2(N_p+1)-8$ additional constraints obtained by evaluating the ordinary differential equations (4.10a) and (4.3c) at the inner collocation points $\zeta _{2},\ldots,\zeta _{N_p-2}$, defined according to

(4.16)\begin{equation} \zeta_{i}=\cos\left[\frac{{\rm i}{\rm \pi}}{N_p}\right] \quad\text{for all}\ {\rm i}\in[0,N_p]. \end{equation}

Instead of solving for the coefficients $c_{kj}$, we solve directly for the $2(N_p+2)$ unknowns $\phi (\zeta _i)$ and $\psi (\zeta _i)$, arranged into the solution vectors

(4.17a,b)\begin{equation} \boldsymbol{\phi}=\left[\phi(\zeta_0),\ldots,\phi(\zeta_{N_p})\right]^{{\rm T}},\quad \boldsymbol{\psi}=\left[\psi(\zeta_0),\ldots,\psi(\zeta_{N_p})\right]^{{\rm T}}. \end{equation}

Then, by making use of the Chebyshev differentiation matrix $\boldsymbol{\mathsf{D}}$ (Trefethen Reference Trefethen2000),

(4.18)$$\begin{gather} \left[\phi^{(i)}(\zeta_0),\ldots,\phi^{(i)}(\zeta_{N_p})\right]^{{\rm T}}=\boldsymbol{\mathsf{D}}^{i} \left[\phi(\zeta_0),\ldots,\phi(\zeta_{N_p})\right]^{{\rm T}}, \end{gather}$$
(4.19)$$\begin{gather}\left[\psi^{(i)}(\zeta_0),\ldots,\psi^{(i)}(\zeta_{N_p})\right]^{{\rm T}}=\boldsymbol{\mathsf{D}}^{i} \left[\psi(\zeta_0),\ldots,\psi(\zeta_{N_p})\right]^{{\rm T}}, \end{gather}$$

where $i=1, 2, 3, 4$, and $(i)$ indicates the order of differentiation with respect to $\zeta$, (4.10) is cast into a generalized eigenvalue problem in matrix form,

(4.20) \begin{equation} \underline{\boldsymbol{\mathsf{A}}}\boldsymbol{\phi}=\tilde{c}\underline{\boldsymbol{\mathsf{B}}}\boldsymbol{\phi}, \end{equation}

and (4.3) is cast into a linear system of equations,

(4.21)\begin{equation} \underline{\boldsymbol{\mathsf{C}}}\boldsymbol{\psi}=\boldsymbol{b}, \end{equation}

introducing the coefficient matrices $\underline {\boldsymbol{\mathsf{A}}}$, $\underline {\boldsymbol{\mathsf{B}}}$ and $\underline {\boldsymbol{\mathsf{C}}}$, and the inhomogeneity $\boldsymbol {b}$. With the help of MATLAB (2015), we first solve (4.21) for $\boldsymbol {\psi }$ by numerical inversion via the / operator and then (4.20) for the eigenvalues $\tilde {c}$ and eigenvectors $\boldsymbol {\phi }$ via the eig function.

Using this approach, the full set of eigenmodes is computed at once. Thus short-wave instability modes, i.e. modes with $c_i\ne 0$ at $k=0$, can be obtained readily. Once a mode has been identified at a given wavenumber $k$, it can be tracked by advancing $k$, using the function eigs, which searches for eigenvalues in the vicinity of a previous solution.

In Appendix A, we validate our OS-OS approach, (4.20) and (4.21), versus Vellingiri et al. (Reference Vellingiri, Tseluiko and Kalliadasis2015) and Schmidt et al. (Reference Schmidt, Náraigh, Lucquiaud and Valluri2016). Figure 6 confronts temporal linear stability predictions from this approach (solid lines) with predictions from our WRIBL-OS approach (symbols), for parameters similar those in figure 5(a). Agreement is good up to $|Re_G|\sim 8000$. Thus our liquid-side WRIBL description suffices to predict the gas effect on the long-wave Kapitza instability.

Figure 6. Temporal stability predictions from the OS-OS (solid curves) and WRIBL-OS (open symbols) approaches. Parameters similar to those in figure 5(a): $Ka=3174$, $H^\star =19$ mm, $\phi =5^\circ$, $Re_L=32.7$. Circles indicate passive-gas limit ($\varPi _\rho =\varPi _\mu =0$ in (3.41)); pentagons indicate $Re_G=-4123$; squares indicate ${Re_G=-6173}$; diamonds indicate $Re_G=-8220$. (a) Growth rate; (b) wave speed.

5. Model validation

To evaluate the linear and nonlinear predictions of our WRIBL-LW model, we confront these with stability predictions from Vellingiri et al. (Reference Vellingiri, Tseluiko and Kalliadasis2015) and Samanta (Reference Samanta2014), our own stability calculations using the WRIBL-OS approach, and experiments from Kofman (Reference Kofman2014).

By design, our WRIBL-LW model predicts exactly the neutral linear stability bound of the long-wave Kapitza instability. We consider a temporal linear stability formulation and expand the complex wave speed $c=\omega /k$ in terms of $k\in \mathbb {R}$ around the limit $k=0$:

(5.1)\begin{equation} c=c_0+k c_1+{O}(k^2). \end{equation}

Inserting this into (3.41), and truncating order by order, we obtain $c_0$ and $c_1$:

(5.2a)$$\begin{gather} c_0=2\left.{u_{L 0}}\right|_{h_0}+\varPi_\mu\varPi_u T_{G 0} \left\{{-}h_0+\frac{h_0^2}{d_0}\right\}+Re_L\,\varPi_\rho\varPi_u^2\, \frac{h_0^3}{d_0}\left\{-\frac{\partial_xP_{G 0}}{Re_G}+\varPi_u^{{-}4}\, \frac{\sin(\phi)}{Fr^2}\right\}, \end{gather}$$
(5.2b)$$\begin{gather}c_1={\rm i}\mathcal{R}, \end{gather}$$

where $\mathcal {R}{\in }\mathbb {R}$ is written out in Appendix B, and the primary flow yields

(5.3)\begin{equation} \left.{u_{L 0}}\right|_{h_0}=\frac{1}{2}\,\frac{Re_L}{Fr^2} \sin(\phi) h_0^2+\varPi_\mu\varPi_u T_{G 0}h_0-\frac{1}{2}\,\varPi_\rho\varPi_u^2\, \frac{Re_L}{Re_G}\,\partial_xP_{G 0}h_0^2. \end{equation}

Thus the asymptotic wave speed is given by $c_0$, the (temporal) growth rate by $k c_1$, and the neutral stability bound by $\mathcal {R}=0$.

In the zero-confinement limit $h_0/d_0\to 0$, $c_0$ (5.2a) and $c_1$ (5.2b) should collapse with the expressions in (B4b) and (B7b) of Vellingiri et al. (Reference Vellingiri, Tseluiko and Kalliadasis2015). Applying this limit to (5.1) and rescaling appropriately, we obtain

(5.4)\begin{align} \underline{c}=\underline{c}_0+\underline{k}\underline{c}_1+{O} (\underline{k}^2)&=2+\underline{T}_{G 0}+{\rm i}\underline{k} \left\{\frac{4}{15}\,\underline{Re}_L\left(2+\underline{T}_{G 0}\right)- \frac{2}{3}\cot(\phi)\left[1-\varPi_\rho\right] \vphantom{\frac{\underline{Re}_L}{\varPi_\mu^2} \frac{\underline{C}_1}{\underline{d}_0}}\right. \nonumber\\ &\quad \left.{}+\frac{1}{3}\,\varPi_\rho\,\frac{\underline{Re}_L}{\varPi_\mu^2}\, \frac{\underline{C}_1}{\underline{d}_0}+\frac{1}{2}\,\varPi_\mu\,\frac{1}{\underline{d}_0} \left.{\partial_{\underline{\eta}}\underline{U}_1}\right|_{\underline{d}_0}\right\}+ {O}(\underline{k}^2), \end{align}

where the underline refers to the scaling of Vellingiri et al. (Reference Vellingiri, Tseluiko and Kalliadasis2015), i.e. $\underline {\mathcal {L}}=h_0^\star$ and $\underline{\mathcal {U}}=\underline{\mathcal {U}}_G=\frac {1}{2}\nu _L^{-1} g\sin (\phi )\, h_0^{\star 2}$. Our result matches that in Vellingiri et al. (Reference Vellingiri, Tseluiko and Kalliadasis2015), except for three additional terms: the gas-density correction in the $\cot (\phi )$ term, and the last two terms within the accolades, which stem from the linear perturbations of $P_G$ and $T_G$. In the laminar limit,

(5.5a,b)\begin{equation} \underline{C}_1=\frac{6}{35}\,\underline{d}_0^2\underline{T}_{G 0}^2,\quad \left.{\partial_{\underline{\eta}}\underline{U}_1}\right|_{\underline{d}_0}= \frac{4}{105}\,\frac{\varPi_\rho\,\underline{Re}_L}{\varPi_\mu^3}\,\underline{d}_0^3 \underline{T}_{G 0}^2, \end{equation}

thus these terms do not necessarily vanish for $1/\underline {d}_0\to 0$. Thus the gas pressure $P_G$ can affect stability even under weak confinement, in line with observations in figures 5(c) and 5(d).

Figure 7 compares spatial linear stability predictions of our WRIBL-LW model (symbols) with calculations using the WRIBL-OS approach (solid lines), for parameters based on figure 3 in Samanta (Reference Samanta2014), which are inspired by the experiments of Liu & Gollub (Reference Liu and Gollub1994) in a water–glycerol film. We fix the channel height at $H^\star =15$ mm, and apply a co-current turbulent gas flow with $Re_G=2000$. Figure 7(a) represents dispersion curves of the linear wave speed $c_r=k_r/\omega$ around the long-wave limit. We see that the two data sets converge as $k\to 0$. Further, our WRIBL model captures accurately the long-wave instability threshold, as evidenced by the neutral stability bounds plotted in figure 7(b). Comparing the circles (full model) with the diamonds (passive-gas limit $\varPi _\rho =\varPi _\mu =0$), we see that the gas effect is destabilizing, and this is maintained in the limit $\varPi _\rho =0$ (squares). By contrast, assuming $T_G=\textrm {const}$ and $\varPi _\rho =0$ (crosses), according to the model of Samanta (Reference Samanta2014), results in a qualitatively incorrect prediction of gas-induced stabilization.

Figure 7. Spatial linear stability predictions obtained from WRIBL-LW (symbols) and WRIBL-OS (lines) calculations. Inclined falling liquid film sheared by a co-current gas based on parameters in Samanta (Reference Samanta2014): $Ka=963$ (glycerol–water and air II in table 1), $\phi =4^\circ$, $H^\star =15$ mm, $Re_G=2000$. S/U indicate stable/unstable regions. Circles indicate full formulation; squares indicate $\varPi _\rho =0$ in (3.41); diamonds indicate $T_{G}=T_{{G}0}$, $\varPi _\rho =0$; crosses indicate $\varPi _{\mu }=\varPi _\rho =0$. (a) Wave speed $c_r=\omega /k_r$ around the long-wave limit $k_r\to 0$; (b) neutral stability bound, $k_i=0$.

We now turn to the experimental conditions of Kofman (Reference Kofman2014), who considered a falling liquid film sheared by a turbulent counter-current gas flow. Figure 8 confronts linear spatial growth rate dispersion curves from our WRIBL-LW model (figures 8a,c) with calculations based on our WRIBL-OS approach (figures 8b,d). Comparing figures 8(a) and 8(b), we see that our WRIBL-LW model predicts the gas effect on the maximum growth rate $\{-k_i\}_{max}$ and on the associated angular frequency $\{\omega \}_{max}$ reasonably well. And the AI limit is predicted with precision 10 %, i.e. $Re _G ^{AI}=-9157$ from WRIBL-LW versus $Re_G^{AI}=-8220$ from WRIBL-OS. Figures 8(c) and 8(d) represent corresponding stability calculations in the limit $\varPi _\rho =0$. Versus figures 8(a) and 8(c), we observe a qualitative change in the gas effect from destabilizing to stabilizing (similar to figure 5), and our WRIBL-LW model captures this feature accurately. In contrast to Tseluiko & Kalliadasis (Reference Tseluiko and Kalliadasis2011), our WRIBL-LW model can thus be applied to confinement levels, where the gas pressure plays a role.

Figure 8. Spatial linear stability predictions from (a,c) WRIBL-LW and (b,d) WRIBL-OS approaches. Parameters according to experiments of Kofman (Reference Kofman2014): $Ka=3174$ (water and air I in table 1), $H^\star =19$ mm, $\phi =5^\circ$, $Re_L=32.7$. Open circles indicate passive-gas limit, $\varPi _\rho =\varPi _\mu =0$ in (3.41). Values of $|Re_G|$ increase in the order diamonds, squares, crosses/asterisks, pentagons, pluses. (a,b) Full model; (c,d) $\varPi _\rho =0$ in (3.41). Here: (a) $Re_G=[-4123,-6713,-9157]$; (b) $Re_G=[-4123,-6713,-8220]$; (c) $Re_G=[-6713,-9100,-11\,000,-15\,000]$; (d) $Re_G=[-6713,-9100,-11\,000,-15\,000]$. Red dot-dashed curves track growth rate maximum $\{-k_i\}_{max}$. We have rescaled $\omega$ with $\mathcal {T}_\nu =2.207\times 10^{-3}$ s (see (3.34ac)).

On the downside, our WRIBL-LW model cannot reproduce the strong gas-induced reduction of the cut-off frequency predicted by the WRIBL-OS calculation in figure 8(b). This is due to truncating our asymptotic gas-side description (§ 4.2) at ${O}(\underline {\epsilon }^1)$. However, it is almost inconsequential for the prediction of nonlinear Kapitza waves. Figure 9 compares film thickness time traces at a fixed streamwise position $x$, as obtained from open-domain (dashed black) and TWS (solid green) computations with our WRIBL-LW model, with experimental data (red open circles) from Kofman (Reference Kofman2014). In these experiments, the counter-current gas flow rate was increased up to $|Re_G|\sim 7000$. Our WRIBL-LW model accurately captures the gas effect on both the wave height and the number of precursory capillary ripples. The wavenumber $k$ of precursory ripples is several tenfold greater than the cut-off wavenumber $k_{c}$ of the Kapitza instability (Dietze Reference Dietze2016; Zhou & Prosperetti Reference Zhou and Prosperetti2020). As a result, over-prediction of the linear cut-off (figure 8a) does not translate to a significant nonlinear error (figure 9).

Figure 9. Nonlinear computations (solid and dashed lines) with our WRIBL-LW model (3.6) versus experiments (symbols) of Kofman (Reference Kofman2014): $Ka=3174$ (water and air I in table 1), $H^\star =19$ mm, $\phi =5^\circ$, $Re_L=32.7$, $f_0^\star =2.8$ Hz ($\omega _0^\star \mathcal {T}_\nu =0.039$). Film thickness time traces at fixed streamwise position. Solid green lines indicate TWS from numerical continuation; dashed black lines indicate open-domain computations with coherent inlet forcing ($\varepsilon _1=0.01$, $\varepsilon _2=0$). (a) Quiescent gas ($\varPi _\rho =\varPi _\mu =0$ in computations);(b) $Re_G=-4123$; (c) $Re_G=-6713$.

6. Results

Figure 10 shows top-view snapshots of one of our experiments, where we have successively increased the counter-current gas flow rate from the second snapshot onwards. Guided by this experiment, using the different linear stability calculations as well as nonlinear computations with our WRIBL-LW model, we wish to understand how the waviness of the falling liquid film is altered under the effect of the gas flow. In particular, we are interested in the transition from a regular train of long waves (first snapshot), via an increasingly disordered wave pattern (e.g. tenth snapshot), until the occurrence of upward-travelling short ripples, which lead to a breakdown of our experiment (last snapshot).

Figure 10. Top view snapshots from one of our experiments. Falling water film sheared by a counter-current air flow and subject to coherent inlet forcing: $H^\star =13$ mm, $\phi =5^\circ$, $Re_L^{as}=44.7$, $Re_L=43.1$, $f_0^\star =3.0$ Hz. The first snapshot indicates aerostatic configuration; the second snapshot and onwards indicate counter-current turbulent gas flow with increasing $|Re_G|$. Absolute instability limit from linear stability calculation in figure 12: $Re_G^{AI}=-5182$.

6.1. Gas effect on Kapitza waves

This subsection is concerned with the linear (§ 6.1.1) and nonlinear (§§ 6.1.2 and 6.1.3) gas effects on the long-wave Kapitza instability. Waves resulting from this instability are dominant at weaker counter-current gas flow rates in figure 10, i.e. $|Re_G|\lesssim 6200$ (first ten snapshots), and the linear instability becomes absolute in this range, as will be shown in figure 12.

6.1.1. Linear gas effect

We start by discussing the gas effect on the threshold of the Kapitza instability. Figure 11(a) represents the neutral stability bound, $c_1=0$ according to (5.2b), in terms of $Re_L$ and $Re_G$, for two inclination angles, i.e. $\phi =5^{\circ }$ (black curves with circles), which corresponds to our experiment in figure 10, and $\phi =1^{\circ }$ (red curves with diamonds). For each $\phi$, we have plotted two curves, one obtained from our WRIBL-LW model for turbulent gas flow conditions (filled symbols), and another obtained from the fully coupled governing equations (Tilley et al. Reference Tilley, Davis and Bankoff1994) for laminar gas flow conditions (open symbols). Only the curve segments within the appropriate $Re_G$ range are represented with solid lines, and the laminar/turbulent transition is highlighted via the shaded region.

Figure 11. Gas effect on threshold of long-wave Kapitza instability. Linear stability predictions for a falling liquid film sheared by a counter-current gas flow: $Ka=3174$ (water and air I in table 1), $H^\star =13$ mm.(a) Neutral stability bounds. Black curves with circles indicate $\phi =5^\circ$; red curves with diamonds indicate $\phi =1^\circ$. Curves with filled symbols indicate WRIBL-LW/WRIBL-OS prediction for turbulent gas flow; curves with open symbols indicate fully coupled prediction for laminar gas flow (Tilley et al. Reference Tilley, Davis and Bankoff1994); dot-dashed magenta curve indicates short-wave instability mode (§ 6.2) at $\phi =1^{\circ }$; shaded zone indicates turbulence transition, $Re_G \in [-1800, -1300]$. S/U denote stable/unstable regions. (b) Spatial growth rate dispersion curves from WRIBL-OS: $\phi =1^\circ$, $Re_L=1.5\ (5/6)\cot (\phi )$. Pentagons indicate $\varPi _\rho =\varPi _\mu =0$ in (3.41); squares to pluses indicate $Re_G=-1000, -2000, -3000, -3600$.

For $\phi =5^{\circ }$ (black curves with circles), the linear effect of the counter-current gas flow is destabilizing. Further, when the counter-current gas flow rate is sufficiently large, the falling liquid film becomes unconditionally unstable (limit point marked by filled circle), i.e. for all $Re_L$, in agreement with previous works (Trifonov Reference Trifonov2017; Kushnir et al. Reference Kushnir, Barmak, Ullmann and Brauner2021). We find that turbulence in the gas greatly delays this limit versus a laminar prediction (compare filled and open circles).

By contrast, for $\phi =1^{\circ }$ (red curves with diamonds), we find a change in nature of the gas effect, as a result of gas-side turbulence. While the gas effect remains destabilizing in the laminar limit (red curve with open diamond), it switches to stabilizing when turbulence is accounted for (red curve with filled diamond). This is illustrated further in figure 11(b), which represents dispersion curves of the linear spatial growth rate for increasing $|Re_G|$ at $Re_L=1.5\ (5/6)\cot (\phi )$. Thus turbulence allows us to achieve a gas-induced suppression of the Kapitza instability for the current confinement, $H^\star \sim 10$ mm, which is much weaker than the confinement studied in Lavalle et al. (Reference Lavalle, Li, Mergui, Grenier and Dietze2019), namely $H^\star \sim 1$ mm, where the gas flow was laminar. And the counter-current gas flow can render the falling liquid film unconditionally stable to long-wave disturbances at the limit point marked by a filled diamond in figure 11(a). However, as we will discover in § 6.2, the film can become unstable to a short-wave instability mode at small $\phi$, and the threshold for this mode (dot-dashed curve in figure 11a) lies below the neutral stability bound of the Kapitza instability for the parameters considered here. Thus the falling liquid film cannot be fully stabilized in this case.

Gas-induced stabilization of the Kapitza mode is limited to small inclination angles, and plays no role in our current experiments, where the effect of the counter-current gas flow on the falling liquid film is destabilizing. In this case, it is interesting to determine the AI limit and to confront it with the $Re_G$ range of our experiments. Figure 12 represents WRIBL-OS spatial linear stability predictions for the experimental parameters in figure 10. Upon increasing the counter-current gas flow rate (from circles to crosses), the $-k_i$ versus $\omega$ curve in figure 12(a) and the $c_r$ versus $\omega$ curve in figure 12(b) develop a cusp at $Re_G=-5114$. This cusp corresponds to a pinch point in the $-k_i$ versus $k_r$ curve (inset of figure 12a), which indicates the AI limit (Kupfer, Bers & Ram Reference Kupfer, Bers and Ram1987). Thus the falling liquid film in figure 10 is absolutely unstable from the fifth snapshot onwards, i.e. well before the breakdown of our experiment due to upward-travelling ripples ($Re_G\sim -6800$). Consequently, AI does not seem to play a role in the flooding onset. On the contrary, well-defined downward-travelling Kapitza waves persist far beyond the AI limit (up to the tenth snapshot in figure 10), and we will discuss the nonlinear dynamics of these waves in the following subsections.

Figure 12. Transition to AI predicted by spatial linear stability analysis with our WRIBL-OS approach. Parameters according to experiment in figure 10: $Ka=3174$ (water and air I in table 1), $H^\star =13$ mm, $\phi =5^\circ$, $Re_L=43.1$. Circles indicate $\varPi _\rho =\varPi _\mu =0$ in (3.41); diamonds indicate $Re_G=-4000$; crosses indicate $Re_G=-5181$. (a) Growth rate $-k_i$ versus $\omega$. Inset shows $-k_i$ versus $k_r$. Dot-dashed line indicates $Re_G=-5180$; dot-dot-dashed line indicates $Re_G=Re_G^{AI}=-5182$. (b) Wave speed $c_r=\omega /k_r$. Vertical dashed line indicates forcing frequency $f_0^\star =3$ Hz from figure 10. We have rescaled $\omega$ with $\mathcal {T}_\nu =2.207\times 10^{-3}$ s (see (3.34ac)).

6.1.2. Nonlinear gas effect: TWS

We wish to know whether the nonlinear response of the wavy falling liquid film is in line with the linear gas effect discussed in the previous subsubsection. Figure 13 compares the wave height (figures 13a,c) and wave speed (figures 13b,d) of nonlinear TWS obtained from our WRIBL-LW model at fixed frequency $f$ (solid curves), with experiments (symbols) from our current work (figures 13a,b), where $H^\star =13$ mm, and from Kofman et al. (Reference Kofman, Mergui and Ruyer-Quil2017) (figures 13c,d), where $H^\star =19$ mm. The experimental wave height data in figure 13(a) were selected from film thickness time trace measurements performed over the entire channel length, which will be discussed in § 6.1.3 (see figure 14). The wave speed data in figure 13(b) were obtained via video image processing from our experiment in figure 10, where the $Re_L$ value is slightly different to that in figure 13(a).

Figure 13. Gas effect on nonlinear TWS obtained with our WRIBL-LW model (curves) versus experiments (empty symbols). Inclined falling liquid film sheared by counter-current turbulent gas flow: $Ka=3174$ (water and air I in table 1), $\phi =5^\circ$. Filled/open symbols distinguish number of capillary ripples (CR): diamonds indicate 0-CR; squares indicate 1-CR; triangles indicate 2-CR; circles indicate3-CR; dashed line indicates >3-CR. Solid curves indicate $f^\star =f_0^\star$; dot-dashed curves indicate $f^\star =f^\star _{max}$. Crosses indicate AI limit; asterisks indicate nonlinear limit points. Open/filled red arrows mark AI limits obtained from WRIBL-LW/WRIBL-OS. (a,c) Wave height; (b,d) wave speed scaled with $\hat {u}_{Nu}^\star =(3/2)q_{L 0}^\star /h_{Nu}^\star$, where $h_{Nu}^\star =(3q_{L0}^\star\nu_L/(g\sin(\phi)))^{1/3}$. (a,b) Versus our experiments: $H^\star =13$ mm, $f_0^\star =3.0$ Hz, with (a) $Re_L=44.2\pm 0.3$, (b) $Re_L=43.1$. Filled arrow indicates $Re_G^{AI}=-5194$; empty arrow indicates $Re_G^{AI}=-5366$. (c,d) Versus experiments of Kofman et al. (Reference Kofman, Mergui and Ruyer-Quil2017): $H^\star =19$ mm, $Re_L=45$, $f_0^\star =3.05$ Hz. Filled arrow indicates $Re_G^{AI}=-8490$; empty arrow indicates $Re_G^{AI}=-9633$.

Figure 14. Gas effect on streamwise evolution of the wavy liquid film. Compilation of our experiments: water/air, $H^\star =13$ mm, $\phi =5^\circ$, $Re_L^{as}=46$, $Re_L=44.2\pm 0.3$, $f_0^\star =3$ Hz, $Re_G^{AI}=-5194$.(a) Ensemble-averaged wave height $h_{max}^\star$. Error bars represent standard deviation, and check marks mark the start of the coalescence-dominated region. Filled symbols mark data points used in figure 13(a). Circles indicate aerostatic configuration; diamonds indicate $Re_G=-3040$; squares indicate $Re_G=-4190$; pentagons indicate $Re_G=-5200$; triangles indicate $Re_G=-5750$. (b) Frequency spectra of the film height $h^\star$, with $Re_G=-5750$, where $|\hat {h}^\star _i|$ denotes the amplitude of the Fourier mode with $f_i^\star$. Crosses mark primary and secondary peaks. Left, $x^\star =41.5$ cm; middle, $x^\star =51.5$ cm; right, $x^\star =58.5$ cm.

Different solid curves in figure 13 correspond to different branches of TWS, which are associated with different numbers of precursory capillary ripples (CR) and distinguished by different filled symbols. For the experimental data points, the number of CR is distinguished via corresponding open symbols. Error bars in figure 13(a) represent the standard deviation of experimental film thickness time traces, which increases with increasing $|Re_G|$ as a result of wave coalescence events (§ 6.1.3). Beyond a certain $|Re_G|$, coalescence destroys entirely the coherence of the wave train, and comparison with TWS is futile.

Overall, our WRIBL-LW predictions in figures 13(a), 13(b), 13(c) and 13(d) are in reasonable agreement with the experimental data. Both the gas effect on the wave height and the wave speed are captured quantitatively, when accounting for the number of CR.

Based on these predictions, we may make the following observations. Downward-travelling TWS exist far beyond the AI limit, marked by open (WRIBL-LW calculation) and filled (WRIBL-OS calculation) red arrows in figures 13(a) and 13(c). Below the AI limit, the wave height $h_{max}$ increases with increasing $|Re_G|$, while the wave speed mainly decreases. And we have checked that the relative wave amplitude $h_{max}/\bar {h}$ (not shown here) also increases. Thus the nonlinear gas effect is destabilizing, in line with the linear effect discussed in § 6.1.1.

For the 0-CR, 1-CR and 2-CR branches, the $h_{max}$ versus $|Re_G|$ trend in figures 13(a) and 13(c) changes beyond the AI limit, i.e. $h_{max}$ now decreases with $|Re_G|$ (except for small non-monotonic regions). For the 3-CR branches (solid curves with filled circles), the trend beyond the AI limit is more complicated, i.e. $h_{max}$ first decreases with $|Re_G|$, and then increases, beyond $|Re_G|=8000$ in figure 13(a), and beyond $|Re_G|=16\,000$ in figure 13(c). This increase is associated with the formation of an increasing number of additional CR (dashed curve segments), and a strong increase of the wave speed $c$ is observed in figures 13(b) and 13(d), whereas $c$ mostly decreases with $|Re_G|$ for the other solution branches (solid curves with filled diamonds, squares and triangles).

Focusing now on the experimental data points (open symbols in figures 13a,b), we observe that the number of CR decreases when increasing $|Re_G|$ (from open circles to open diamonds). According to the computations with our WRIBL-LW model (solid curves), this corresponds to a switching of TWS branches in the direction of lowest wave speed. This is surprising, because one would expect the fastest TWS to persist in an experiment at fixed $Re_{G}$. Additional effects must thus play a role in the wave selection.

In our experiment, saturated waves of fixed frequency $f_0^\star$ are formed before entering into contact with the counter-current gas flow. In figures 13(a) and 13(b), we have compared the gas effect on such waves, i.e. TWS at $f^\star =f_0^\star =3$ Hz (solid curves), with TWS at the linearly most-amplified frequency, i.e. $f^\star =f_{max}^\star$ (dot-dashed blue curves). Except for the 3-CR branch (dot-dashed curve with asterisk), both types of TWS behave quite similarly until the AI limit (where the $f_{max}^\star$ branches break down). This is because $f_{max}^\star$ does not vary much with $Re_G$, thus the forcing frequency $f_0^\star$ chosen in the experiment remains close to $f_{max}^\star$. By contrast, in the case of the 3-CR branch, the most-amplified TWS are lost due to a nonlinear limit point (blue asterisk), before the gas flow reaches the fully turbulent regime ($|Re_G|<1800$).

6.1.3. Nonlinear gas effect: spatio-temporal wave dynamics

In a spatially evolving falling liquid film, the counter-current gas flow not only acts on nonlinear Kapitza waves individually, but can trigger interactions between consecutive waves. Thus we study the gas effect on the spatio-temporal dynamics of such waves.

Figure 14(a) summarizes spatial profiles of film thickness data obtained from our experiments at $Re_L^{as}=46$, $Re_L=44.2\pm 0.7$ and $f_0^\star =3$ Hz, under increasing $|Re_G|$. Symbols represent the ensemble average of the wave height $h_{max}^\star$ (over at least 100 waves) at a given streamwise position $x^\star$, and error bars represent the corresponding standard deviation. Filled symbols identify the TWS data reported in figures 13(a) and 13(b).

In the aerostatic configuration (open circles in figure 14a), the error bars are very short, implying that waves are highly regular in time. However, $h_{max}^\star$ varies in space as the result of the well-known secondary instability discovered by Liu & Gollub (Reference Liu and Gollub1993).

In the counter-current configuration (from diamonds to triangles in figure 14a), we observe that $h_{max}^\star$ in the lower half of the channel ($x^\star \gtrsim 50\,\textrm {cm}$) increases significantly when $|Re_G|$ is increased. On the one hand, this is due to the gas-induced amplification of TWS discussed in § 6.1.2. On the other hand, the standard deviation of the $h_{max}^\star$ data increases significantly as $|Re_G|$ is increased. This is the signature of wave coalescence events that can suddenly increase the wave height. Figure 15 represents a sequence of snapshots illustrating such an event for $Re_G=-5200$ (pentagons in figure 14a). The solid red and dashed yellow lines highlight the fronts of two consecutive waves that eventually coalesce.

Figure 15. Wave coalescence event. Top-view snapshots from our experiment in figure 10 (parameters similar to pentagons in figure 14a): $Re_L=43.1$, $Re_G=-5200$. Time increases from top left to bottom right with increment 0.48 s. Solid red and dashed yellow lines highlight two consecutive wave fronts.

In figure 14(a), we have marked the streamwise position beyond which such coalescence events become prevalent via check marks on the corresponding error bars. This position, which we will designate as $x_c^\star$, is determined from the spatial evolution of the frequency spectrum of $h^\star$, as illustrated in figure 14(b) for $Re_G=-5750$ (triangles in figure 14a). We see that the spectrum evolves from that of a regular wave train, with clear peaks at the forcing frequency $f_0^\star$ and its harmonics (left-hand plot), to a form where the dominant frequency $f_{max}^\star$ is lower than the forcing frequency (right-hand plot). The streamwise locations of the transition, i.e. where $f_{max}^\star$ becomes smaller than $f_0^\star$ (middle plot), is defined as $x_c^\star$.

Judging by the standard deviation of the $h_{max}^\star$ profiles in figure 14(a), wave coalescence becomes more prominent as $|Re_G|$ is increased. We have seen in figure 13(b) that the counter-current gas flow reduces the wave speed of TWS. At fixed wave frequency $f^\star$, this leads to a reduction of the wave separation distance, thus favouring wave interaction and coalescence. Figure 16 provides a direct comparison of wave trains for two of the experiments from figure 14(a). Figure 16(a) confronts film thickness time traces measured at $x^\star =82.5$ cm for the aerostatic configuration (solid black curve) and for the counter-current configuration at $Re_G=-5750$ (dashed red curve). Whereas the former represents a regular train of waves responding well to the forcing frequency, the latter displays clear signs of coalescence-induced wave coarsening, leading to large-amplitude tsunami waves with a wave height much greater than the TWS in figure 13(a). Figures 16(b) and 16(c) represent corresponding frequency spectra for the two data sets. Whereas the forcing frequency $f_0^\star =3$ Hz is dominant in the spectrum for the aerostatic configuration (figure 16b), a lower frequency emerges for the counter-current configuration, where periodicity is lost entirely (figure 16c).

Figure 16. Wave trains for two data sets from figure 14(a). (a) Film thickness time traces at $x^\star =82.5$ cm. Solid line indicates aerostatic configuration (circles in figure 14a), $Re_L^{as}=46.0$; dashed line indicates counter-current configuration (triangles in figure 14a), $Re_L=44.2$, $Re_G=-5750$. (b,c) Corresponding frequency spectra, where $|\hat {h}^\star _i|$ is the amplitude of the Fourier mode with $f_i^\star$. (b) Aerostatic configuration; open circles mark peaks at $f_0^\star$ and its harmonics. (c) Counter-current configuration; open circle marks global peak at most-amplified frequency $f_{max}^\star /f_0^\star =0.49$.

In figure 17, we have plotted the starting location $x_c^\star$ of the coalescence-dominated region versus $Re_G$, based on all of our experiments for two values of $Re_L$. The error bars on $x_c^\star$ correspond to the increment with which the $x$-position was varied in the experimental runs reported in figure 14(a). According to figure 17, coalescence is greatly precipitated by the (turbulent) counter-current gas flow, and this effect is stronger, the lower the liquid flow rate.

Figure 17. Gas effect on the starting position $x_c^\star$ of the coalescence-dominated region. Compilation of our experiments: water/air, $H^\star =13$ mm, $\phi =5^\circ$, $f_0^\star =3$ Hz. Circles indicate $Re_L=32.5\pm 0.6$; squares indicate $Re_L=44.3\pm 0.3$; curves indicate polynomial fits to guide the eye.

The nonlinear wave phenomena discussed in figures 1417 do not seem to be disrupted by AI, even though we have considered values of $|Re_G|$ quite far beyond the AI limit, i.e. $Re_G^{AI}=-5194$ at $Re_L=44.2$. This is favoured by the protected zone used in our experiments, where Kapitza waves are allowed to complete their linear and nonlinear growth in a quiescent gas, and where the Kapitza instability remains convective. Only after having attained a saturated nonlinear state do these waves come into contact with the gas flow, and consequently, the AI is bypassed.

Next, we employ open-domain computations with our WRIBL-LW model to study the linear and nonlinear spatio-temporal evolution of Kapitza waves that feel the gas effect from the start. In these computations, the turbulent counter-current gas flow is applied over the entire domain length. Of course, our WRIBL-LW model can capture only long-wave instabilities, such as the Kapitza instability, on which we focus in the current subsection.

We start by studying the gas effect on the dynamics of naturally evolving Kapitza waves, which are more relevant for industrial applications. Here, the liquid flow rate $q$ at the liquid inlet is subject to a noisy perturbation according to (3.46), with $\varepsilon _1=0$, $\varepsilon _2=5\times 10^{-5}$. Figure 18 represents snapshots of our open-domain WRIBL-LW computations for parameters according to three of the experiments in figure 14(a) (circles, squares and triangles there). In figure 18(a) (aerostatic configuration) and figure 18(b) ($Re_G=-4190$), the AI limit $Re_G^{AI}=-5114$ (obtained from the WRIBL-LW model) has not been reached, and we observe the same phenomena as in our experiments from figure 14. In particular, the counter-current gas flow exacerbates coalescence events, leading to large-amplitude tsunami waves, which move very rapidly and absorb numerous smaller waves in their path. This gas-assisted coarsening dynamics is illustrated in figure 19(a), representing a spatio-temporal diagram for the computation in figure 18(b) (see also supplementary movie 1 available at https://doi.org/10.1017/jfm.2023.670).

Figure 18. Gas effect on spatial evolution of naturally-evolving Kapitza waves. Open-domain computations using our WRIBL-LW model on a domain of length $L^\star =1.50$ m. The gas flow is applied over the entire domain length. Noisy inlet perturbation according to (3.46): $\varepsilon _1=0$, $\varepsilon _2=5\times 10^{-5}$. Parameters according to experiments in figure 14(a) (circles, squares and triangles there): $Ka=3174$ (water and air I in table 1), $H^\star =13$ mm, $\phi =5^\circ$, $Re_L=43.1$. Plots for: (a) $\varPi _\rho =\varPi _\mu =0$ in (3.6a); (b) $Re_G=-4190$; (c) $Re_G=-5750$. The AI limits, obtained from WRIBL-LW and WRIBL-OS, are $Re_G^{AI}=-5347$ and $Re_G^{AI}=-5182$.

Figure 19. Spatio-temporal diagrams of the normalized film height $h/h_{max}$ for the computations in figures 18(b) and 18(c): (a) $Re_G=-4190$, (b) $Re_G=-5750$. The AI frequency is ${f_{AI}^\star =3.35}$ Hz, as obtained from linear stability analysis based on our WRIBL-LW model.

A very different dynamics unfolds when $|Re_G|$ is increased beyond the AI limit, as shown in figures 18(c) and 19(b), which correspond to $Re_G=-5750$ (see also supplementary movie 2). Here, coalescence events are absent, and a highly regular train of saturated-amplitude solitary waves develops. The height $h_{max}$ of these waves is significantly smaller than that of the tsunami waves in figure 18(b), thus limiting the risk of flooding. At the same time, $h_{max}$ is large enough that a significant wave-induced intensification of heat and mass transport can be expected (Dietze Reference Dietze2019). Thus AI is not necessarily dangerous in our configuration. On the contrary, the unbounded linear spatial growth rate associated with AI represents an effective linear wave selection mechanism that produces highly regular nonlinear surfaces waves of the absolute frequency $f_{AI}^\star =3.35$ Hz from ambient noise (where $f_{AI}^\star$ is obtained from a WRIBL-LW calculation based on figure 12a). Thereby, nonlinear effects, which set in very close to the liquid inlet, allow the Kapitza waves to travel downstream, notwithstanding the temporal nature of the linear growth. As far as we know, such a dynamics has not been shown before, and we have checked that it persists at $Re_G=-6500$ (not shown here), i.e. far beyond the value of $|Re_G|$ in figure 19(b).

By contrast, it is very hard to produce a regular wave train below the AI limit via coherent inlet forcing. This is demonstrated in figure 20, which represents computations similar to those in figure 18, except that we have additionally applied a harmonic inlet perturbation at frequency $f_0^\star =3$ Hz, using $\varepsilon _1=0.01$ and $\varepsilon _2=5\times 10^{-5}$ in (3.46). Although the applied coherent forcing produces a regular wave train in the aerostatic configuration (figure 20a), coalescence events cannot be avoided for $Re_G=-4190$ (figure 20b). We have not shown the corresponding computation beyond the AI limit (see figure 21(b) for this), because it produces almost exactly the same wave train as in figure 18(c).

Figure 20. Computations according to figures 18(a) and 18(b), but with additional coherent inlet forcing (3.46): $f_0^\star =3$ Hz, $\varepsilon _1=0.01$, $\varepsilon _2=5\times 10^{-5}$. Plots for: (a) $\varPi _\rho =\varPi _\mu =0$ in (3.6a); (b) $Re_G=-4190$.

Figure 21. Summary of wave data from our computations in figures 18 and 20. Maximum wave height $h_{max}$ versus the streamwise location. Circles indicate $\varPi _\rho =\varPi _\mu =0$; crosses indicate $Re_G=-4190$; diamonds indicate $Re_G=-5750$. Naturally evolving versus forced waves. (a) Noisy inlet perturbation: $\varepsilon _1=0$, ${\varepsilon _2=5\times 10^{-5}}$ in (3.46). (b) Additional coherent inlet forcing: $f_0^\star =3.0$ Hz, $\varepsilon _1=0.01$, $\varepsilon _2=5\times 10^{-5}$ in (3.46).

Figure 21 summarizes the wave characteristics of our different WRIBL-LW open-domain computations from figures 18 and 20 by plotting the maximum wave height $h_{max}$ versus the streamwise position $x$. Error bars represent the range of temporal variation of $h_{max}$ at a given position. We see that AI-induced wave selection allows us to (1) reduce the maximum wave height in the lower portion of the domain by about 40 %, and (2) suppress its variance over the entire domain length. For completeness, the diamonds in figure 21(b) report results from our computation with additional coherent inlet forcing for the parameters in figure 18(c), i.e. beyond the AI limit, evidencing that the wave train is not altered meaningfully by this additional forcing.

6.1.4. Standing ripples in a vertically falling liquid film

Our nonlinear spatio-temporal WRIBL-LW computations in § 6.1.3 did not reveal any evidence of the gas-induced oscillatory secondary instability (OI) discovered by Lavalle et al. (Reference Lavalle, Grenier, Mergui and Dietze2020) for the configuration of a vertically falling liquid film sheared by a superconfined counter-current laminar gas flow. In a spatially evolving regular train of surface waves formed by coherent inlet forcing at frequency $f_0$, this instability leads to a periodic spatial modulation of the wave height, which entails an intensification of mixing.

To check whether this dynamics can be recovered in our current weak-confinement setting with a turbulent counter-current gas flow, we perform open-domain WRIBL-LW computations for the same liquid-side parameters as in figure 3(a) of Lavalle et al. (Reference Lavalle, Grenier, Mergui and Dietze2020), i.e. $Ka=509.5$, $\phi =90^{\circ }$, $Re_{L}=15$ and $f_0^\star =16$ Hz. Further, we set $\varepsilon _1=0.01$ and $\varepsilon _2=0$ in (3.46), and we apply the counter-current gas flow over the entire domain length $L^\star =0.84$ m. In terms of confinement, we set $H^\star =10$ mm, in contrast to $H^\star =1$ mm used by Lavalle et al. (Reference Lavalle, Grenier, Mergui and Dietze2020). The forcing frequency $f_0^\star =16$ Hz corresponds to the linearly most-amplified value in the limit ($\varPi _\rho =\varPi _\mu =0$), which is quite different from the AI frequency $f_{AI}^\star =26.8$ Hz, as obtained from our WRIBL-LW model. We search for signs of the OI by increasing $|Re_G|$.

Figure 22 reports results of computations for two values of $|Re_G|$. The first computation (figure 22a) corresponds exactly to the AI limit $Re_G=Re_G^{AI}=-6500$ and represents the same features as other computations at lower $|Re_G|$ (not shown here): an unaltered regular wave train of frequency $f=f_0$ persists over the entire domain length.

Figure 22. Vertically falling liquid film sheared by a turbulent counter-current gas flow. Liquid-side conditions according to figure 3(a) in Lavalle et al. (Reference Lavalle, Grenier, Mergui and Dietze2020): $Ka=509.46$ (DMSO–water and air II in table 1), $Re_L=15$, $f_0^\star =16$ Hz, $Re_G^{AI}=-6500$. WRIBL computation on an open domain of length $L^\star =0.843$ m. Snapshots of the film height profile $h(x)$ at $f_0 t=61.4$. (a) At AI limit: $Re_G=Re_G^{AI}=-6500$. (b) Beyond AI limit: ${Re_G=-7500}$. Dot-dashed red line indicates $f_0 t=61.6$; green dashed line indicates Lagrangian path of a wave crest.

In the second computation (figure 22b), where the AI limit has been surpassed ($Re_G=-7500$), a more interesting dynamics unfolds. Here, a quite regular wave train of frequency $f=f_{AI}$ emerges near the liquid inlet, as a result of linear wave selection at the AI frequency. However, the coherent inlet forcing at frequency $f_0$ competes with this wave selection, leading to a slight perturbation of the wave train, which grows spatially and eventually disrupts the wave train. As a result, large-amplitude tsunami waves form due to coalescence events. These waves travel extremely fast and absorb all smaller waves travelling in front.

This gas-induced coarsening dynamics, which is well illustrated by the spatio-temporal diagram in figure 23(a), leads to long portions of thin residual film in between two consecutive tsunami waves. There, the liquid flow rate $q_L(x,t)$ is very small (see the $q_L$ profile in figure 23c), thus $|Re_G|$ is even further beyond the AI limit than for the primary flow $q_{L 0}$. This leads to the formation of small-amplitude ripples on the residual film. We call these standing ripples because they are almost fixed in space, as evidenced by several features in figures 22 and 23.

Figure 23. Standing ripples beyond the AI limit $Re_G^{AI}=-6500$. Computation from figure 22(b): ${Re_G=-7500}$. (a) Spatio-temporal diagram of the normalized film height $h/h_{max}$. (b) Film height time trace $h(t)$ at $x/L=0.6$. (c) Spatial profile of the liquid flow rate $q_L(x)$ at $f_0 t=61.4$.

First, the dot-dashed red profile segment in figure 22(b), which corresponds to a slightly later time than the main profile, shows no significant translation of the ripples. Second, the wave fronts of the standing ripples in the spatio-temporal plot in figure 23(a) are almost horizontal. Third, the film height time trace in figure 23(b) does not show any signature of the ripples in between two main wave humps.

The standing ripples are felt like a surface roughness by the tsunami waves propagating over the residual film. This leads to a spatial modulation of the film height $h_{max}$, similar to falling liquid films flowing on a corrugated substrate (Dietze Reference Dietze2019), where they have been shown to intensify mixing and inter-phase mass transfer. This modulation is evidenced by the dashed green curve in figure 22(b), which represents the Lagrangian path of the crest of one of the tsunami waves as it propagates through the domain. The absolute nature of the standing ripples and their interaction with the large tsunami waves is illustrated further in supplementary movie 3.

In conclusion, although we have not found any sign of the OI reported by Lavalle et al. (Reference Lavalle, Grenier, Mergui and Dietze2020) for our confinement level, we nonetheless observe a similar gas-induced spatial modulation of the Kapitza waves, albeit due to an entirely different mechanism.

6.2. Upward-travelling ripples: a new short-wave instability

We now turn to the upward-travelling ripples observed for $|Re_G|\gtrsim 6200$ in our experiment of figure 10 (see the last eight snapshots there). These ripples eventually lead to a breakdown of our experiment due to the accumulation of liquid droplets in the gas loop, thus can be considered as the onset of flooding. In the current subsection, we seek to identify the origin of these ripples via linear stability calculations using our OS-OS approach, which allows us to capture long- and short-wave instability modes.

Figure 24 represents temporal OS-OS linear stability predictions for parameters from the experiment. The different symbols correspond to five different values of $Re_G$, according to the 4th ($Re_G=-4700$), 5th ($Re_G=-5200$), 7th ($Re_G=-5750$), 12th ($Re_G=-6400$) and 17th ($Re_G=-6760$) snapshots in figure 10. The last snapshot in figure 10 (${Re_G=-6830}$) corresponds to the breakdown of our experiment, and is not considered here.

Figure 24. New short-wave instability mode. Falling liquid film sheared by a turbulent counter-current gas flow: $Ka=3174$ (water and air I in table 1), $H^\star =13$ mm, $\phi =5^\circ$, $Re_L=43.1$, $Re_G^{AI}=-5182$. Temporal linear stability predictions using the OS-OS approach. Dashed blue indicates new short-wave mode; dot-dashed red indicates long-wave Kapitza mode; solid black with filled symbols indicates unstable merged mode; solid green with open symbols indicates stable merged mode. Pluses indicate $\varPi _\rho =\varPi _\mu =0$ in (3.41); crosses indicate $Re_G=-4700$; pentagons indicate $Re_G=-5200$; diamonds indicate $Re_G=-5750$; squares indicate ${Re_G=-6400}$; circles indicate $Re_G=-6760$. (a,c) Growth rate; (b,d) wave speed. Shaded magenta bands and filled magenta circles with error bars represent our experiment from figure 10: $Re_L=43.1$, $Re_G=-6760$, $\varLambda _{ripples}^\star =(13\pm 3)$ mm, $c_{ripples}^\star =(-6.2\pm 1.5)$ cm s$^{-1}$.

Figures 24(a) and 24(c) represent growth rate dispersion curves for different instability modes, and figures 24(b) and 24(d) represent the corresponding dispersion curves for the linear wave speed. We have separated the different plots into two pairs in order to better distinguish the different modes. Red dot-dashed curves in figure 24(a) belong to the long-wave Kapitza mode, which we have discussed in § 6.1. The growth rate of this mode increases with increasing $|Re_G|$ (from pluses to pentagons), while its cut-off wavenumber decreases.

The blue dashed curves in figure 24(c) belong to a new short-wave instability mode, which emerges upon increasing $|Re_G|$ beyond $|Re_G|=4837$ (between crosses and pentagons). We call this new instability mode a short-wave mode, because the growth rate $k c_i$ is positive only within a finite span of the wavelength $\varLambda =2{\rm \pi} /k$, and because the maximum growth rate is observed at a large wavenumber, i.e. $k_{max}\sim 10$ versus $k_{max}\sim 2$ for the long-wave Kapitza instability mode. The short-wave mode appears for $|Re_G|\gg 1800$, and this suggests that turbulence in the gas is required to generate this instability mode. This may explain why previous stability investigations (Schmidt et al. Reference Schmidt, Náraigh, Lucquiaud and Valluri2016; Trifonov Reference Trifonov2017), where the gas flow was assumed laminar, did not find the short-wave mode.

At $Re_G=-5200$ (pentagons in figure 24), the growth rate of the short-wave mode (figure 24c) has surpassed that of the Kapitza mode (figure 24a). However, our experiments in figure 10 do not show any clear signature of the short-wave mode, except maybe slight modulations on the crests of the first two wave fronts (see e.g. 8th snapshot in figure 10). This can be attributed to the protected zone in our current experimental set-up, where Kapitza waves are allowed to develop in a virtually quiescent atmosphere, before entering the gas-sheared zone. In other words, the gas-induced short-wave instability mode has to compete with saturated fully-nonlinear Kapitza waves. We demonstrate this via an additional set of experiments that was focused on detecting the first signs of ripples for the parameters in figure 10. Figure 25 shows spatio-temporal diagrams of the film surface slope obtained from these experiments, using the synthetic schlieren technique (Moisy, Rabaud & Salsac Reference Moisy, Rabaud and Salsac2009; Kofman et al. Reference Kofman, Mergui and Ruyer-Quil2014). In figure 25(a), with $Re_{G}=-5200$, wave fronts of upward-travelling ripples are clearly visible in between downward-travelling Kapitza waves. However, these ripples cannot yet compete with the large-amplitude Kapitza wave humps, and thus remain hidden in the dark inter-wave regions of figure 10.

Figure 25. First signature of upward-travelling ripples in our experiments. Spatio-temporal diagrams of the film surface slope $\|\boldsymbol {\nabla } h\|$ for parameters in figure 10, obtained with the synthetic schlieren technique (Kofman et al. Reference Kofman, Mergui and Ruyer-Quil2014): $H^\star =13$ mm, $\phi =5^{\circ }$, $Re_L=43.1$, $f_0^\star =3$ Hz, $x^\star _0=48$ cm, $z^\star =13$ cm. (a) For $Re_G=-5200$, ripples start to appear in between Kapitza wave humps. (b) For $Re_G=-6080$, ripples deform crests of Kapitza waves.

Upon increasing $Re_G$ further (diamonds in figure 24), the short-wave mode and the Kapitza mode merge into a new unstable merged mode (filled diamonds in figure 24a), which initially displays a two-humped growth rate dispersion curve, and a new stable merged mode (open diamonds in figure 24c). Figure 26(a) shows the merging of the growth rate curves in detail. According to this, the long-wave portion of the long-wave mode (red dot-dashed curves) merges with the short-wave portion of the short-wave mode (blue dashed curves), creating the unstable merged mode (solid black curve with filled diamonds). Vice versa, the short-wave portion of the long-wave mode merges with the long-wave portion of the short-wave mode, creating the stable merged mode (solid green curve with open diamonds).

Figure 26. Details of OS-OS linear stability predictions from figure 24: $Ka=3174$, $Re_L=43.1$, $H^\star =13$ mm, $\phi =5^\circ$. (a) Merging between the short-wave and long-wave instability modes from figures 24(a) and 24(c). Diamonds indicate $Re_G=-5750$; lines without symbols indicate $Re_G=-5680$, pentagons indicate $Re_G=-5200$. (b) Primary-flow liquid velocity at the film surface. Solid line indicates $H^\star =13$ mm, ${Re_{G}^{AI}=-5182}$; dot-dashed line indicates $H^\star =19$ mm, $Re_{G}^{AI}=-8461$; dashed line indicates $H^\star =5$ mm, $Re_{G}^{AI}=-1501$. Asterisks indicate the AI limit from WRIBL-OS spatial linear stability calculations.

A direct consequence of the mode merging is a change in trend of the cut-off wavenumber $k_{c}$ versus $Re_G$ when considering the growth rate curves originating at $k=0$, $kc_i=0$ in figure 24(a). Before the merging (pluses to pentagons), these curves are associated with the long-wave Kapitza instability, and $k_{c}$ decreases with increasing $|Re_G|$. After the merging (diamonds to circles), $k_{c}$ jumps to a much greater value and its trend is reversed. This could explain the sudden change in trend of the neutral stability bounds in figure 11 of Vellingiri et al. (Reference Vellingiri, Tseluiko and Kalliadasis2015), which we have reproduced with our WRIBL-OS approach in figure 29(a) of Appendix A.

As $|Re_G|$ is increased beyond $|Re_G|=5750$ in figure 24(a) (from diamonds to circles), the short-wave growth rate maximum of the unstable merged mode becomes dominant and attains very large values. It is here that upward-travelling ripples become strong enough to deform the crests of the Kapitza waves (see figure 25b), and thus become clearly visible in our experiments (last eight snapshots of figure 10). The shaded magenta band in figure 24(a) represents the experimental range of the wavenumber $k$ for these ripples at $Re_G=-6760$ (next to last snapshot in figure 10), and this compares reasonably well with the most-amplified wavenumber $k_{max}$ of the corresponding unstable merged mode (curve with filled circles in figure 24a). Better agreement is expected without the protected region used in our current experimental set-up. In our set-up, short-wave ripples originate on the residual film in between two pre-existing large-amplitude nonlinear Kapitza waves, which is not quite comparable to the primary flow underlying figure 24.

The most important feature of the new short-wave instability mode observed in figures 24(c) and 24(d) is that it displays negative wave speeds ($c_r<0$ in figure 24d) in the range of unstable wavenumbers. And this property is endowed to the unstable merged mode in figure 24(b). In particular, the linear wave speed $c_r$ for $Re_G=-6760$ (solid curve with open circles in figure 24b) is negative across the entire wavenumber span of the upward-travelling ripples observed in the corresponding experiment (vertical shaded magenta band in figure 24b). Moreover, the ripple wave speed estimated from our experiments (filled magenta circle with error bars in figure 24b) agrees quite well with the linear wave speed. Thus we are confident that the short-wave instability uncovered in figure 24 is at the origin of the upward-travelling ripples observed in our experiment of figure 10.

Upward travelling linear waves linked to the short-wave mode, or the unstable merged mode, do not necessarily require a negative liquid velocity. This is shown in figure 26(b), where we have plotted the primary-flow liquid velocity at the liquid–gas interface, ${u_{L 0}}|_{y=h_0}$, in terms of $Re_G$ for the liquid-side parameters from figure 24. Here, we confront our current confinement (solid curve with symbols, $H^\star =13$ mm) with those of Kofman et al. (Reference Kofman, Mergui and Ruyer-Quil2017) (dot-dashed curve, $H^\star =19$ mm) and Mergui et al. (Reference Mergui, Lavalle, Li, Grenier and Dietze2023) (dashed curve, $H^\star =5$ mm). Focusing on the solid curve, where symbols mark $|Re_G|$ values from figures 24(b) and 24(d), we see that ${u_{L 0}}|_{y=h_0}$ becomes negative far beyond the onset of the short-wave instability (between the square and circle in figure 26b). Thus the gas-induced linear short waves can travel upwards even though the liquid moves downwards across the entire film thickness $h_0$.

To characterize further the nature of the short-wave instability mode, figure 27 presents (normalized) profiles of the liquid-side (figure 27a) and gas-side (figure 27b) eigenfunctions, $\phi$ and $\psi$ (see (4.13a,b)), for the most-amplified long-wave (red solid curves) and short-wave (blue dashed curves) instability modes at $Re_G=-5200$ (pentagons in figures 24a,c). We see that $\phi$ is maximal at the liquid–gas interface, $y=h_0$, for both the long-wave and short-wave modes. We may thus conclude that the short-wave mode is an interfacial mode, strengthening our assertion that it lies at the origin of the upward-travelling ripples observed in our experiments.

Figure 27. Eigenfunctions (4.13a,b) for different instability modes from figure 24. Turbulent counter-current gas flow: $Re_G=-5200$. Linearly most-amplified short-wave (dashed blue lines, $k=12.8$) and long-wave (solid red lines, $k=1.6$) instability modes. (a) Liquid film, $\phi$; (b) gas layer, $\psi$.

Interestingly, the onset of the short-wave instability mode in figure 24(c), i.e. $Re_G=-5100$ (between crosses and pentagons), is very close to the AI limit of the Kapitza instability observed in figure 12, i.e. $Re_G^{AI}=-5115$. This may explain why flooding predictions based on the AI limit (Vellingiri et al. Reference Vellingiri, Tseluiko and Kalliadasis2015) are reasonably good, even though AI does not seem to produce any dangerous events in our experiments and nonlinear WRIBL-LW computations.

7. Conclusion

We have studied the effect of a confined turbulent counter-current gas flow on the linear and nonlinear dynamics of a wavy falling liquid film, focusing on regimes beyond the absolute instability (AI) limit of the Kapitza instability. We have done this via experiments and numerical computations based on a new low-dimensional model, which we have introduced and validated here. This model captures accurately the gas-induced transition to AI as well as the nonlinear gas effect on travelling Kapitza waves. In addition, we have performed linear stability calculations based on the full Orr–Sommerfeld equations in the gas and the liquid.

From our investigation, we may draw the following conclusions.

(1) AI is not necessarily dangerous, i.e. no flooding events linked to Kapitza waves were observed even far beyond the AI limit. On the contrary, AI can act as an effective linear wave selection mechanism in a naturally evolving falling liquid film, leading to highly regular downward-travelling nonlinear waves, precluding dangerous coalescence events.

(2) Flooding is eventually triggered by upward-travelling ripples, which were discovered in the experiments of Kofman et al. (Reference Kofman, Mergui and Ruyer-Quil2017) and reproduced here. We find that these ripples result from a short-wave interfacial instability associated with a negative linear wave speed. As far as we know, this short-wave instability has not yet been reported in the literature. On the contrary, the instability was not found in several previous stability investigations of falling liquid films (Schmidt et al. Reference Schmidt, Náraigh, Lucquiaud and Valluri2016; Trifonov Reference Trifonov2017). In these investigations, the counter-current gas flow was assumed laminar, even though the gas Reynolds number $Re_G$ was increased far beyond the turbulence threshold. We may thus surmise that Reynolds stresses associated with gas-side turbulence are essential for generating the short-wave instability, at least in the parameter range where ripples are observed experimentally.

(3) The onset of the short-wave instability coincides approximately with the AI limit of the long-wave Kapitza instability. This could explain why predictions of the flooding threshold based on the AI limit have been found to agree reasonably well with experiments (Vellingiri et al. Reference Vellingiri, Tseluiko and Kalliadasis2015), even though the trends of these two thresholds with respect to the liquid Reynolds number are opposed.

(4) At larger counter-current gas flow rates, the short-wave instability mode merges with the long-wave Kapitza mode, leading to a sudden and drastic increase of the cut-off wavenumber. This may explain the sudden change in the $\theta$ trend of the neutral stability curves reported in figure 11 of Vellingiri et al. (Reference Vellingiri, Tseluiko and Kalliadasis2015), which we have reproduced in figure 29(a) based on our own computations.

(5) Absolute instability of the long-wave Kapitza mode and instability of the new short-wave mode can coincide in a certain parameter range (see figures 12(a) and 24(c)). It remains to be seen how downward-travelling long waves generated by AI interact/compete with upward-travelling ripples generated by the short-wave instability in a naturally evolving falling liquid film. Unravelling the interaction between these two wave types may be the key to understanding flooding in gas-sheared falling liquid films. In our current experiments, this could not be studied, as fixed-frequency saturated-amplitude nonlinear waves were allowed to develop in a protected region, before entering into contact with the counter-current gas flow. In this configuration, Kapitza waves are privileged until the growth rate of the merged instability mode (figure 24a) becomes dominant and upward-travelling ripples appear.

Conversely, computations with our current WRIBL-LW model cannot capture the new short-wave instability. Although this is a limitation of the model, it allowed us to show that the long-wave AI alone does not produce any catastrophic events. An interesting goal for future work is to extend our model to overcome this limitation. For this, the gas-side representation, which currently relies on an ${O}(\epsilon )$ long-wave approximation, needs to be improved. This will require relaxing our symmetry condition (3.13b). Velocimetry experiments similar to those of Cohen & Hanratty (Reference Cohen and Hanratty1968) would allow to gauge the extent of asymmetry in the gas flow.

By contrast, our ${O}(\epsilon ^2)$ liquid-side WRIBL representation is capable of capturing short waves, as evidenced by the precursory capillary ripples in figure 9, which have a smaller wavelength than the upward-travelling ripples. Also, our comparisons between WRIBL-OS and OS-OS linear stability calculations show good agreement (figure 6), including for the short-wave mode (figure 30).

Finally, a detailed study of the new short-wave instability is necessary, and we intend to pursue our work in this direction. For example, it should be verified whether the instability also occurs for the conditions studied by Trifonov (Reference Trifonov2017) and Schmidt et al. (Reference Schmidt, Náraigh, Lucquiaud and Valluri2016). And the mechanism of the instability should be elucidated. For example, how does it compare to the Kelvin–Helmholtz instability and the generation of wind-driven waves?

Supplementary material

Supplementary movies are available at https://doi.org/10.1017/jfm.2023.670.

Acknowledgements

J. Amrani, A. Aubertin, L. Auffray and R. Pidoux contributed to building the experimental set-up.

Declaration of interests

The authors report no conflict of interest.

Appendix A. Validation of WRIBL-OS and OS-OS approaches

In figure 28, we have used our WRIBL-OS approach from § 4.1 to reproduce the growth rate dispersion curves obtained from temporal linear stability analysis in figure 15 of Vellingiri et al. (Reference Vellingiri, Tseluiko and Kalliadasis2015), for a vertically falling liquid film sheared by an unconfined counter-current turbulent gas flow. To recover the formulation used in that reference, we have truncated our liquid-side WRIBL model (3.6a) at ${O}(\epsilon )$, set $\varPi _\rho =0$, and increased $H^\star$ until it no longer affected our results. All quantities in figure 28 have been scaled with $\underline {\mathcal {L}}=h_0^\star$ and $\underline {\mathcal {U}}=h_0^{\star 2}g\sin (\phi )/2/\nu _L$, according to Vellingiri et al. (Reference Vellingiri, Tseluiko and Kalliadasis2015). Thus results are directly comparable with data in figure 15 of that reference, exhibiting very good agreement.

Figure 28. Validation of our WRIBL-OS approach (§ 4.1). Spatial linear stability predictions for parameters in figure 15 of Vellingiri et al. (Reference Vellingiri, Tseluiko and Kalliadasis2015): $Ka=2000$ (methanol and helium in table 1), $\phi =90^{\circ }$, $\underline {Re}_0=3Re_L/\sin (\phi )=10$, $H^\star =30$ mm, $\varPi _\rho =0$, (3.6a) truncated at ${O}(\epsilon )$. Quantities are scaled with $\underline {\mathcal {L}}=h_0^\star$ and $\underline {\mathcal {U}}=h_0^{\star 2}g\sin(\phi)/(2\nu_L)$. The counter-current gas shear stress is quantified via $\varTheta =\left|T^\star_{G 0}\right|\!/(\mu_L \underline{\mathcal{U}}/\underline{\mathcal{L}})$.

In figure 29, we have used our OS-OS approach from § 4.2 to reproduce several temporal linear stability predictions from Vellingiri et al. (Reference Vellingiri, Tseluiko and Kalliadasis2015) and Schmidt et al. (Reference Schmidt, Náraigh, Lucquiaud and Valluri2016). In figure 29(a), we have reproduced the neutral stability predictions in figure 11 of Vellingiri et al. (Reference Vellingiri, Tseluiko and Kalliadasis2015), where a vertically falling liquid film sheared by an unconfined turbulent counter-current gas flow was considered. Crosses correspond to our OS-OS prediction, and open circles to calculations of Vellingiri et al. (Reference Vellingiri, Tseluiko and Kalliadasis2015). In the same figure, we have also plotted predictions obtained from our WRIBL-OS approach (curves). To reproduce the unconfined configuration considered in Vellingiri et al. (Reference Vellingiri, Tseluiko and Kalliadasis2015), we have once again increased $H^\star$ until it no longer affected our results meaningfully.

Figure 29. Validation of our WRIBL-OS (§ 4.1) and OS-OS (§ 4.2) approaches. Temporal linear stability predictions for a gas-sheared vertically falling liquid film. (a) Neutral stability curves for parameters according to figure 11 in Vellingiri et al. (Reference Vellingiri, Tseluiko and Kalliadasis2015): $Ka=2000$, $H^\star =300$ mm. Crosses indicate OS-OS; solid lines indicate WRIBL-OS; open circles indicate data from Vellingiri et al. (Reference Vellingiri, Tseluiko and Kalliadasis2015). Thin solid line, $\varTheta =0$; dashed line, $\varTheta =1$; dot-dashed line, $\varTheta =2$; dot-dot-dashed line, $\varTheta =3$; thick solid line, $\varTheta =3.5$. Same scaling as in figure 28. (b) Growth rate dispersion curves for parameters according to figure 4(e) in Schmidt et al. (Reference Schmidt, Náraigh, Lucquiaud and Valluri2016): $H^\star =10$ mm, $\rho _{L}=1000$ kg m$^{-3}$, $\mu _{L}=0.5\times 10^{-3}$ Pa s, $\rho _{G}=1$ kg m$^{-3}$, $\mu _{G}=1\times 10^{-6}$ Pa s, $\sigma =1$ mN m$^{-1}$, $\delta _{L}=h_0^\star /H^\star =0.08$, $\widetilde {Fr}=\tilde {\mathcal {U}}/\sqrt {g\tilde {\mathcal {L}}}=3$, $Re_{L}=6166$, $Re_{G}=48\,322$. Tildes indicate scaling with $\tilde {\mathcal {L}}=H^\star$ and $\tilde {\mathcal {U}}=[\partial _{x^\star }P_{G 0}^\star H^\star /\rho _G]^{1/2}$. Solid blue line indicates long-wave Kapitza mode; dashed red line indicates short-wave Tollmien–Schlichting mode.

Agreement between crosses and circles in figure 29(a) is good, except for data at $\varTheta =\left|T^\star_{G 0}\right|\!/(\mu_L \underline{\mathcal{U}}/\underline{\mathcal{L}})=3$. This is where the trend of the cut-off wavenumber $k$ in terms of the dimensionless gas shear stress $\varTheta$ changes. We believe that this is the result of the mode merging that we have observed in § 6.2. At thresholds where the stability behaviour changes, large discrepancies between two calculations may occur as a result of small differences between the employed procedures. In particular, we have used a set of curvilinear coordinates different to that used by Vellingiri et al. (Reference Vellingiri, Tseluiko and Kalliadasis2015). We believe that this explains the discrepancy between the cross and circle for $\varTheta =3$.

Interestingly, we have observed that our OS-OS predictions in figure 29(a) change significantly when setting $\varPi _\rho =0$ (not shown). This confirms our conclusion based on (5.5a,b) that $P_G$ can affect stability even in the unconfined limit.

In figure 29(b), we have reproduced with our OS-OS approach the growth rate dispersion curves in figure 4(e) of Schmidt et al. (Reference Schmidt, Náraigh, Lucquiaud and Valluri2016), where a vertically falling liquid film sheared by a confined laminar ($\tilde {l}_{t}=0$ in (3.27) and (3.28)) counter-current gas flow was considered. All quantities have been scaled with $\tilde {\mathcal {L}}=H^\star$ and $\tilde {\mathcal {U}}=[\partial _{x^\star }P_{G 0}^\star H^\star /\rho _G]^{1/2}$, according to Schmidt et al. (Reference Schmidt, Náraigh, Lucquiaud and Valluri2016). Thus results are comparable directly with data in figure 4(e) of that reference, exhibiting very good agreement, for both the long-wave Kapitza mode (solid blue curve) and the Tollmien–Schlichting mode (dashed red curve).

Appendix B. Neutral stability bound based on (5.2)

In (5.2), we have introduced the first-order contribution $c_1$, arising in the long-wave expansion ($k\to 0$) of the linear wave speed $c$:

(B1)\begin{equation} \left.\begin{gathered} c=c_0+k c_1+{O}(k^2),\\ c_1={\rm i}\mathcal{R}. \end{gathered}\right\} \end{equation}

The neutral stability bound is given by $\mathcal {R}=0$, and the solution for $\mathcal {R}$ obtained from our WRIBL-LW model (3.6) is

(B2) \begin{align} \mathcal{R} &= \frac{1}{3}\cos(\phi)\,\frac{Re_L}{Fr^2}\,h_0^3 \left\{{-}1+\frac{\varPi_\rho}{\varPi_u^2}\right\} \nonumber\\ &\quad +\frac{\sin^2(\phi)}{Fr^4}\,Re_L^3\left\{\frac{2}{15}\,h_0^6+ \frac{2}{5}\,\frac{\varPi_\rho^2}{\varPi_u^4}\,\frac{h_0^8}{d_0^2}+\frac{10}{21}\, \frac{\varPi_\rho}{\varPi_u^2}\,\frac{h_0^7}{d_0}\right\}\nonumber\\ &\quad +\varPi_\mu\,\frac{\sin(\phi)}{Fr^2}\,Re_L^2\,T_{G 0} \left\{\frac{\varPi_\rho}{\varPi_u}\left[\frac{7}{24}\,\frac{h_0^6}{d_0}+ \frac{4}{5}\,\frac{h_0^7}{d_0^2}\right]+\varPi_u\left[\frac{2}{15}\,h_0^5+ \frac{10}{21}\,\frac{h_0^6}{d_0}\right]\right\}\nonumber\\ &\quad +\varPi_\mu^2\varPi_u^2\,Re_L\,T_{G 0}^2\left\{\frac{7}{24}\, \frac{h_0^5}{d_0}+\frac{2}{5}\,\frac{h_0^6}{d_0^2}\right\}\nonumber\\ &\quad -\varPi_\mu\varPi_\rho\,\frac{Re_L}{Re_G}\,\varPi_u^3 T_{G 0}\,\partial_x P_{G 0} \left\{\frac{2}{15}\,h_0^5+\frac{43}{56}\,\frac{h_0^6}{d_0}+\frac{4}{5}\,\frac{h_0^7}{d_0^2}\right\}\nonumber\\ &\quad -\frac{\sin(\phi)}{Fr^2}\,\frac{Re_L^3}{Re_G}\,\partial_x P_{G 0} \left\{\varPi_\rho^2\left[\frac{10}{21}\,\frac{h_0^7}{d_0}+\frac{4}{5}\, \frac{h_0^8}{d_0^2}\right]+\varPi_\rho\varPi_u^2\left[\frac{4}{15}\,h_0^6+ \frac{10}{21}\,\frac{h_0^7}{d_0}\right]\right\}\nonumber\\ &\quad +\frac{Re_L^3}{Re_G^2}\,\varPi_\rho^2\varPi_u^2\,\partial_x P_{G 0}^2 \left\{\frac{2}{15}\,h_0^6+\frac{10}{21}\,\frac{h_0^7}{d_0}+\frac{2}{5}\,\frac{h_0^8}{d_0^2}\right\}\nonumber\\ &\quad +\frac{1}{2}\,\varPi_\mu\varPi_u\,\frac{h_0^2}{d_0}\left.{\partial_\eta U_1}\right|_{d_0}+ \frac{1}{3}\,\varPi_\rho\varPi_u^2\,Re_L\,\frac{h_0^3}{d_0}\,C_1, \end{align}

where $C_1$ and $U_1$ are obtained by solving (3.27) and (3.28). Solutions for $C_1$ and ${\partial _\eta U_1}|_{d_0}$ in the laminar limit are given in (5.5a,b).

Appendix C. Accounting for derivatives of $T_G$ and $P_G$ in (3.6a)

We check to what extent the temporal and spatial derivatives of $T_G$ and $P_G$, which appear in (3.6a) and which we have neglected in our WRIBL-LW and WRIBL-OS computations, play a role in the linear stability of a gas-sheared falling liquid film. Figure 30 presents linear stability predictions obtained with three approaches for conditions according to figure 24. Solid curves correspond to OS-OS calculations based on (4.20) and (4.21), dot-dashed curves to WRIBL-OS calculations based on (3.41), and dashed curves to WRIBL-OS calculations with account of the space and time derivatives of $T_G$ and $P_G$ in (3.6a).

Figure 30. Accounting for temporal and spatial derivatives of $T_G$ and $P_G$ in (3.6a). Temporal linear stability predictions based on three approaches for conditions according to figure 24: $Ka=3174$ (water and air I in table 1), $H^\star =13$ mm, $\phi =5^{\circ }$, $Re_{L}=43.1$. Dot-dashed lines indicate WRIBL-OS (3.41); solid lines indicate OS-OS (4.20) and (4.21); dashed lines indicate WRIBL-OS, including derivatives of $T_G$ and $P_G$ in (3.6a). (a) Here, $Re_{G}=-4700$. Red lines indicate long-wave Kapitza mode, blue lines indicate short-wave mode.(b) Here, $Re_{G}=-6760$, merged mode.

According to this, both WRIBL approaches capture accurately the gas effect on the long-wave Kapitza instability mode (red curves in figure 30a), and accounting for the derivatives of $T_G$ and $P_G$ does not bear much benefit. By contrast, not surprisingly, the growth rate of the new short-wave mode is less well predicted by both WRIBL approaches (blue curves in figure 30a). Here, accounting for the derivatives of $T_G$ and $P_G$ (dashed blue curve) improves predictions at intermediate $k$, but the standard WRIBL-OS approach performs better at large $k$. Finally, both WRIBL approaches produced quite good predictions of the merged instability mode (figure 30b), whereby the standard WRIBL-OS approach behaves better.

In summary, accounting for the derivatives of $T_G$ and $P_G$ does not meaningfully improve predictions at low wavenumbers $k$. And at large $k$, it may even deteriorate them. This is because the WRIBL-OS description becomes unbalanced at large $k$, as a result of truncating the governing equations at different orders in the liquid (truncate at ${O}(\epsilon ^2)$ and neglect ${O}(\epsilon ^2\,Re_{L})$ inertial corrections) and gas (full governing equations). Retaining supplementary terms in the governing equations has been shown to deteriorate long-wave model predictions in other configurations (Oron & Gottlieb Reference Oron and Gottlieb2004; Thompson et al. Reference Thompson, Gomes, Denner, Dallaston and Kalliadasis2019). It is interesting to note that both the new short-wave (figure 30a) and merged (figure 30b) instability modes can be captured by the WRIBL approach.

References

Alekseenko, S.V., Aktershev, S.P., Cherdantsev, A.V., Kharlamov, S.M. & Markovich, D.M. 2009 Primary instabilities of liquid film flow sheared by turbulent gas stream. Intl J. Multiphase Flow 35, 617627.CrossRefGoogle Scholar
Alekseenko, S.V., Antipin, V.A., Bobylev, A.V. & Markovich, D.M. 2007 Application of PIV to velocity measurements in a liquid film flowing down an inclined cylinder. Exp. Fluids 43 (2–3), 197207.CrossRefGoogle Scholar
Azzopardi, B.J., Mudde, R.F., Lo, S., Morvan, H., Yan, Y. & Zhao, D. 2011 Hydrodynamics of Gas–Liquid Reactors: Normal Operation and Upset Conditions. John Wiley & Sons.CrossRefGoogle Scholar
Bankoff, S.G. & Lee, S.C. 1986 A Critical Review of the Flooding Literature, vol. 2, pp. 95180. Springer.Google Scholar
Barmak, I., Gelfgat, A., Ullman, A. & Brauner, N. 2016 a Stability of stratified two-phase flows in inclined channels. Phys. Fluids 28, 084101.CrossRefGoogle Scholar
Barmak, I., Gelfgat, A., Vitoshkin, H., Ullman, A. & Brauner, N. 2016 b Stability of stratified two-phase flows in horizontal channels. Phys. Fluids 28, 044101.CrossRefGoogle Scholar
Boomkamp, P.A.M., Boersma, B.J., Miesen, R.H.M. & Beijnon, G.V. 1997 A Chebyshev collocation method for solving two-phase flow stability problems. J. Comput. Phys. 132, 191200.CrossRefGoogle Scholar
Brooke Benjamin, T. 1957 Wave formation in laminar flow down an inclined plane. J. Fluid Mech. 2, 554574.CrossRefGoogle Scholar
Brooke Benjamin, T. 1959 Shearing flow over a wavy boundary. J. Fluid Mech. 6, 161205.CrossRefGoogle Scholar
Camassa, R., Ogrosky, H.R. & Olander, J. 2017 Viscous film-flow coating the interior of a vertical tube. Part 2. Air-driven flow. J. Fluid Mech. 825, 10561090.CrossRefGoogle Scholar
Chang, H.C., Demekhin, E.A. & Kalaidin, E. 1996 a Simulation of noise-driven wave dynamics on a falling film. AIChE J. 42 (6), 15531568.CrossRefGoogle Scholar
Chang, H.C., Demekhin, E.A., Kalaidin, E. & Ye, Y. 1996 b Coarsening dynamics of falling-film solitary waves. Phys. Rev. E 54 (2), 14671477.CrossRefGoogle ScholarPubMed
Cohen, L.S. & Hanratty, T.J. 1968 Effect of waves at a gas–liquid interface on a turbulent air flow. J. Fluid Mech. 31 (3), 467479.CrossRefGoogle Scholar
Cohen-Sabban, J., Gaillard-Groleas, J. & Crepin, P.-J. 2001 Quasi-confocal extended field surface sensing. In Proceedings of SPIE (ed. A. Duparre & B. Singh), Optical Metrology Roadmap for the Semiconductor, Optical, and Data Storage Industries II, vol. 4449, pp. 178–183. SPIE.Google Scholar
Demekhin, E.A. 1981 Nonlinear waves in a liquid film entrained by a turbulent gas stream. Fluid Dyn. 16, 188193.CrossRefGoogle Scholar
Dietze, G.F. 2016 On the Kapitza instability and the generation of capillary waves. J. Fluid Mech. 789, 368401.CrossRefGoogle Scholar
Dietze, G.F. 2019 Effect of wall corrugations on scalar transfer to a wavy falling liquid film. J. Fluid Mech. 859, 10981128.CrossRefGoogle Scholar
Dietze, G.F. & Ruyer-Quil, C. 2013 Wavy liquid films in interaction with a confined laminar gas flow. J. Fluid Mech. 722, 348393.CrossRefGoogle Scholar
Doedel, E.J. 2008 AUTO07P: Continuation and bifurcation software for ordinary differential equations. Montreal Concordia University.Google Scholar
Drosos, E.I.P., Paras, S.V. & Karabelas, A.J. 2006 Counter-current gas–liquid flow in a vertical narrow channel – liquid film characteristics and flooding phenomena. Intl J. Multiphase Flow 32, 5181.CrossRefGoogle Scholar
Fair, J.R. & Bravo, J.L. 1990 Distillation columns containing structured packing. Chem. Engng Prog. 86 (1), 1929.Google Scholar
Floryan, J.M., Davis, S.H. & Kelly, R.E. 1987 Instabilities of a liquid film flowing down a slightly inclined plane. Phys. Fluids 30 (4), 983989.CrossRefGoogle Scholar
Frederick, K.A. & Hanratty, T.J. 1988 Velocity measurements for a turbulent nonseparated flow over solid waves. Exp. Fluids 6 (7), 477486.CrossRefGoogle Scholar
Halpern, D. & Grotberg, J.B. 2003 Nonlinear saturation of the Rayleigh-instability due to oscillatory flow in a liquid-lined tube. J. Fluid Mech. 492, 251270.CrossRefGoogle Scholar
Hanratty, T.J. & Engen, J.M. 1957 Interaction between a turbulent air stream and a moving water surface. AIChE J. 3 (3), 299304.CrossRefGoogle Scholar
Kalliadasis, S., Ruyer-Quil, C., Scheid, B. & Velarde, M.G. 2012 Falling Liquid Films, Applied Mathematical Sciences, vol. 176. Springer.CrossRefGoogle Scholar
Kapitza, P.L. 1948 Wave flow of thin layer of viscous fluid (in Russian). Zh. Eksp. Teor. Fiz. 18 (1), 328.Google Scholar
Kofman, N. 2014 Films liquides tombants avec ou sans contre-écoulement de gaz: application au problème de l'engorgement dans les colonnes de distillation. PhD thesis, Université Pierre et Marie Curie.Google Scholar
Kofman, N., Mergui, S. & Ruyer-Quil, C. 2014 Three-dimensional instabilities of quasi-solitary waves in a falling liquid film. J. Fluid Mech. 757, 854887.CrossRefGoogle Scholar
Kofman, N., Mergui, S. & Ruyer-Quil, C. 2017 Characteristics of solitary waves on a falling liquid film sheared by a turbulent counter-current gas flow. Intl J. Multiphase Flow 95, 2234.CrossRefGoogle Scholar
Kupfer, K., Bers, A. & Ram, A.K. 1987 The cusp map in the complex-frequency plane for absolute instabilities. Phys. Fluids 30 (10), 30753082.CrossRefGoogle Scholar
Kushnir, R., Barmak, I., Ullmann, A. & Brauner, N. 2021 Stability of gravity-driven thin-film flow in the presence of an adjacent gas phase. Intl J. Multiphase Flow 135, 103443.CrossRefGoogle Scholar
Lapkin, A. & Anastas, P.T. (Ed.) 2018 Handbook of Green Chemistry, Green Chemical Engineering, vol. 12. Wiley-VHC.Google Scholar
Lavalle, G., Grenier, N., Mergui, S. & Dietze, G.F. 2020 Solitary waves on superconfined falling liquid films. Phys. Rev. Fluids 5 (3), 032001(R).CrossRefGoogle Scholar
Lavalle, G., Li, Y., Mergui, S., Grenier, N. & Dietze, G.F. 2019 Suppression of the Kapitza instability in confined falling liquid films. J. Fluid Mech. 860, 608639.CrossRefGoogle Scholar
Lavalle, G., Mergui, S., Grenier, N. & Dietze, G.F. 2021 Superconfined falling liquid films: linear versus nonlinear dynamics. J. Fluid Mech. 919, R2.CrossRefGoogle Scholar
Lel, V.V., Al-Sibai, F., Leefken, A. & Renz, U. 2005 Local thickness and wave velocity measurement of wavy films with a chromatic confocal imaging method and a fluorescence intensity technique. Exp. Fluids 39 (5), 856864.CrossRefGoogle Scholar
Liu, J. & Gollub, J.P. 1993 Onset of spatially chaotic waves on flowing films. Phys. Rev. Lett. 70 (15), 22892292.CrossRefGoogle ScholarPubMed
Liu, J. & Gollub, J.P. 1994 Solitary wave dynamics of film flows. Phys. Fluids 6 (5), 17021712.CrossRefGoogle Scholar
Luchini, P. & Charru, F. 2019 On the large difference between Benjamin's and Hanratty's formulations of perturbed flow over uneven terrain. J. Fluid Mech. 871, 534561.CrossRefGoogle Scholar
MATLAB 2015 Version 8.6 (R2015b). The MathWorks.Google Scholar
McCready, M.J. & Chang, H.-C. 1994 Formation of large disturbances on sheared and falling liquid films. Chem. Engng Commun. 141–142 (1), 347358.Google Scholar
Mergui, S., Lavalle, G., Li, Y., Grenier, N. & Dietze, G.F. 2023 Nonlinear dynamics of strongly-confined gas-sheared falling liquid films. J. Fluid Mech. 954, A19.CrossRefGoogle Scholar
Meza, C.E. & Balakotaiah, V. 2008 Modeling and experimental studies of large amplitude waves on vertically falling films. Chem. Engng Sci. 63, 47044734.CrossRefGoogle Scholar
Miesen, R. & Boersma, B.J. 1995 Hydrodynamic stability of a sheared liquid film. J. Fluid Mech. 301, 175202.CrossRefGoogle Scholar
Miles, J.W. 1957 On the generation of surface waves by shear flows. J. Fluid Mech. 3, 185204.CrossRefGoogle Scholar
Miyara, A. 1999 Numerical analysis on flow dynamics and heat transfer of falling liquid films with interfacial waves. Heat Mass Transfer 35, 298306.CrossRefGoogle Scholar
Moisy, F., Rabaud, M. & Salsac, K. 2009 A synthetic Schlieren method for the measurement of the topography of a liquid interface. Exp. Fluids 46, 10211036.CrossRefGoogle Scholar
Náraigh, L.Ó., Spelt, P.D.M., Matar, O.K. & Zaki, T.A. 2011 Interfacial instability in turbulent flow over a liquid film in a channel. Intl J. Multiphase Flow 37 (7), 812830.CrossRefGoogle Scholar
Oron, A. & Gottlieb, O. 2004 Subcritical and supercritical bifurcations of the first- and second-order Benney equations. J. Engng Maths 50 (2–3), 121140.CrossRefGoogle Scholar
Orszag, S.A. 1971 Accurate solution of the Orr–Sommerfeld stability equation. J. Fluid Mech. 50 (4), 689703.CrossRefGoogle Scholar
Özgen, S., Carbonaro, M. & Sarma, G.S.R. 2002 Experimental study of wave characteristics on a thin layer of de/anti-icing fluid. Phys. Fluids 14 (10), 33913402.CrossRefGoogle Scholar
Pope, S.B. 2000 Turbulent Flows. Cambridge University Press.CrossRefGoogle Scholar
Prandtl, L. 1925 Bericht über Untersuchungen zur ausgebildeten Turbulenz. Z. Angew. Math. Mech. 5, 136139.CrossRefGoogle Scholar
Richard, G., Ruyer-Quil, C. & Vila, J.P. 2016 A three-equation model for thin films down an inclined plane. J. Fluid Mech. 804, 162200.CrossRefGoogle Scholar
Russo, S. & Luchini, P. 2016 The linear response of turbulent flow to a volume force: comparison between eddy-viscosity model and DNS. J. Fluid Mech. 790, 104127.CrossRefGoogle Scholar
Ruyer-Quil, C. & Manneville, P. 1998 Modeling film flows down inclined planes. Eur. Phys. J. B 6 (2), 277292.CrossRefGoogle Scholar
Ruyer-Quil, C. & Manneville, P. 2000 Improved modeling of flows down inclined planes. Eur. Phys. J. B 15 (2), 357369.CrossRefGoogle Scholar
Ruyer-Quil, C. & Manneville, P. 2002 Further accuracy and convergence results on the modeling of flows down inclined planes by weighted-residual approximations. Phys. Fluids 14 (1), 170183.CrossRefGoogle Scholar
Samanta, A. 2014 Shear-imposed falling film. J. Fluid Mech. 753, 131149.CrossRefGoogle Scholar
Samanta, A. 2020 Optimal disturbance growth in shear-imposed falling film. AIChE J. 66 (5), 00011541.CrossRefGoogle Scholar
Schmidt, P., Náraigh, L.Ó., Lucquiaud, M. & Valluri, P. 2016 Linear and nonlinear instability in vertical counter-current laminar gas–liquid flows. Phys. Fluids 28, 042102.CrossRefGoogle Scholar
Shkadov, V.Y. 1967 Wave flow regimes of a thin layer of viscous fluid subject to gravity. Fluid Dyn. 2 (1), 2934.CrossRefGoogle Scholar
Thompson, A.B., Gomes, S.N., Denner, F., Dallaston, M.C. & Kalliadasis, S. 2019 Robust low-dimensional modelling of falling liquid films subject to variable wall heating. J. Fluid Mech. 877, 844881.CrossRefGoogle Scholar
Thorsness, C.B., Morrisroe, P.E. & Hanratty, T.J. 1978 A comparison of linear theory with measurements of the variation of shear stress along a solid wave. Chem. Engng Sci. 33, 579592.CrossRefGoogle Scholar
Tilley, B.S., Davis, S.H. & Bankoff, S.G. 1994 Linear stability theory of two-layer fluid flow in an inclined channel. Phys. Fluids 6 (12), 39063922.CrossRefGoogle Scholar
Trefethen, L.N. 2000 Spectral Methods in MATLAB. SIAM.CrossRefGoogle Scholar
Trifonov, Y.Y. 2010 a Counter-current gas–liquid wavy film flow between the vertical plates analyzed using the Navier–Stokes equations. AIChE J. 56 (8), 19751987.Google Scholar
Trifonov, Y.Y. 2010 b Flooding in two-phase counter-current flows: numerical investigation of the gas–liquid wavy interface using the Navier–Stokes equations. Intl J. Multiphase Flow 36, 549557.CrossRefGoogle Scholar
Trifonov, Y.Y. 2017 Instabilities of a gas–liquid flow between two inclined plates analyzed using the Navier–Stokes equations. Intl J. Multiphase Flow 95, 144154.CrossRefGoogle Scholar
Trifonov, Y.Y. 2019 Nonlinear wavy regimes of a gas–liquid flow between two inclined plates analyzed using the Navier–Stokes equations. Intl J. Multiphase Flow 112, 170182.CrossRefGoogle Scholar
Tseluiko, D. & Kalliadasis, S. 2011 Nonlinear waves in counter-current gas–liquid film flow. J. Fluid Mech. 673, 1959.CrossRefGoogle Scholar
Valluri, P., Matar, O.K., Hewitt, G.F. & Mendes, M.A. 2005 Thin film flow over structured packings at moderate Reynolds numbers. Chem. Engng Sci. 60, 19651975.CrossRefGoogle Scholar
Van Driest, E.R. 1956 On turbulent flow near a wall. J. Aeronaut. Sci. 23 (11), 10071011.CrossRefGoogle Scholar
Vellingiri, R., Tseluiko, D. & Kalliadasis, S. 2015 Absolute and convective instabilities in counter-current gas–liquid film flows. J. Fluid Mech. 763, 166201.CrossRefGoogle Scholar
Vlachos, N.A., Paras, S.V., Mouza, A.A. & Karabelas, A.J. 2001 Visual observations of flooding in narrow rectangular channels. Intl J. Multiphase Flow 27, 14151430.CrossRefGoogle Scholar
Yih, C.S. 1963 Stability of liquid flow down an inclined plane. Phys. Fluids 6 (3), 321334.CrossRefGoogle Scholar
Yoshimura, P.N., Nosoko, P. & Nagata, T. 1996 Enhancement of mass transfer into a falling laminar liquid film by two-dimensional surface waves – some experimental observations and modeling. Chem. Engng Sci. 51 (8), 12311240.CrossRefGoogle Scholar
Zapke, A. & Kröger, D.G. 2000 Countercurrent gas–liquid flow in inclined and vertical ducts – I. Flow patterns, pressure drop characteristics and flooding. Intl J. Multiphase Flow 26, 14391455.CrossRefGoogle Scholar
Zhou, G. & Prosperetti, A. 2020 Capillary waves on a falling film. Phys. Rev. Fluids 5, 114005.CrossRefGoogle Scholar
Zilker, D.P., Cook, G.W. & Hanratty, T.J. 1977 Influence of the amplitude of a solid wavy wall on a turbulent flow. Part 1. Non-separated flows. J. Fluid Mech. 82 (1), 2951.CrossRefGoogle Scholar
Figure 0

Figure 1. Sketch of our experimental set-up. A falling liquid film of water flows down a glass plate inclined at an angle $\phi =5^{\circ }$, and enters into contact with a counter-current turbulent air flow within a rectangular channel of height $H^\star =13$ mm and width $W^\star =27$ mm. A loudspeaker is used to force Kapitza waves on the surface of the liquid film, which grow and saturate within a protected region.

Figure 1

Figure 2. Transition of the wavy falling liquid film under a counter-current gas flow: water/air, $Re_L^{as}=44.7$, $Re_L=43.1$, $f_0^\star =3$ Hz. Shadowgraphs of the liquid–gas interface for increasingly strong fan power: (a) zero fan power (aerostatic configuration), regularly-spaced Kapitza waves; (b) $Re_G=-5830$, coalescence of Kapitza waves; (c) $Re_G=-6760$, coexistence of Kapitza waves with upward-travelling short ripples.

Figure 2

Figure 3. Typical CCI film thickness measurements in the aerostatic configuration: water/air, $Re_L^{as}=33.7$, $f_0^\star =2.8$ Hz. (a) Film thickness time traces measured at different positions. From left to right: $x^\star =13.5$, 27.5, 49.5 and 62.5 cm. (b) Spatial profiles of averaged quantities (at least 100 waves). Open/filled circles indicate ensemble-averaged wave height $h_{max}^\star$ and minimum film thickness $h_{min}^\star$; crosses indicate time-averaged film thickness $\bar {h}^\star$. Error bars indicate standard deviation, and red arrows mark positions for the traces in (a).

Figure 3

Figure 4. Falling liquid film (subscript $L$) on an inclined wall subject to a counter-current turbulent gas flow (subscript $G$). The flow is confined by an upper wall (not shown) at $y^\star =H^\star$ (stars denote dimensional quantities), and a symmetry condition is imposed at the centreline of the average gas layer $y^\star =D^\star$. Gas–liquid coupling is expressed via the tangential gas shear stress $T_G$ and the gas pressure $P_G$ at the film surface $y^\star =h^\star$. Red dashed lines illustrate the orthogonal curvilinear coordinate system $(\eta, \xi )$, where $\eta =\underline {y}\bar {d}/d$.

Figure 4

Figure 5. Spatial linear stability calculations with the WRIBL-OS approach. Parameters based on experiments of Kofman et al. (2017): $Ka=3174$ (water and air I in table 1), $\phi =5^\circ$, $Re_L=45$. Circles: passive-gas limit, $\varPi _\rho =\varPi _\mu =0$ in (3.41). Values of $|Re_G|$ increase in the order diamonds, squares, crosses, pentagons. (a,c) Full model, (b,d) $\varPi _\rho =0$ in (3.41), with (a,b) $H^\star =19$ mm, (c,d) $H^\star =40$ mm. Here: (a) $Re_G=[-6234, -8145, -8490\ (\textrm {AI})]$, dashed line $Re_G=-8500$; (b) $Re_G=[-6234, -8145, -8490, -15\,000]$; (c) $Re_G=[-8145, -15\,000, -20\,430 \ (\textrm {AI\ limit})]$, dashed line $Re_G=-20\,440$; (d) $Re_G=[-8145, -15\,000, -20\,430, -35\,000]$. We have rescaled $\omega$ with $\mathcal {T}_\nu =2.207\times 10^{-3}$ s (see (3.34ac)).

Figure 5

Table 1. Fluid combinations used in our computations. The Kapitza number is defined as $Ka=\sigma/(\rho_L g^{1/3} \nu_L^{4/3})$, where $\sigma$, $\rho _L$ and $\nu _L$ denote the surface tension, density and kinematic viscosity of the liquid, and $g$ designates the gravitational acceleration.

Figure 6

Figure 6. Temporal stability predictions from the OS-OS (solid curves) and WRIBL-OS (open symbols) approaches. Parameters similar to those in figure 5(a): $Ka=3174$, $H^\star =19$ mm, $\phi =5^\circ$, $Re_L=32.7$. Circles indicate passive-gas limit ($\varPi _\rho =\varPi _\mu =0$ in (3.41)); pentagons indicate $Re_G=-4123$; squares indicate ${Re_G=-6173}$; diamonds indicate $Re_G=-8220$. (a) Growth rate; (b) wave speed.

Figure 7

Figure 7. Spatial linear stability predictions obtained from WRIBL-LW (symbols) and WRIBL-OS (lines) calculations. Inclined falling liquid film sheared by a co-current gas based on parameters in Samanta (2014): $Ka=963$ (glycerol–water and air II in table 1), $\phi =4^\circ$, $H^\star =15$ mm, $Re_G=2000$. S/U indicate stable/unstable regions. Circles indicate full formulation; squares indicate $\varPi _\rho =0$ in (3.41); diamonds indicate $T_{G}=T_{{G}0}$, $\varPi _\rho =0$; crosses indicate $\varPi _{\mu }=\varPi _\rho =0$. (a) Wave speed $c_r=\omega /k_r$ around the long-wave limit $k_r\to 0$; (b) neutral stability bound, $k_i=0$.

Figure 8

Figure 8. Spatial linear stability predictions from (a,c) WRIBL-LW and (b,d) WRIBL-OS approaches. Parameters according to experiments of Kofman (2014): $Ka=3174$ (water and air I in table 1), $H^\star =19$ mm, $\phi =5^\circ$, $Re_L=32.7$. Open circles indicate passive-gas limit, $\varPi _\rho =\varPi _\mu =0$ in (3.41). Values of $|Re_G|$ increase in the order diamonds, squares, crosses/asterisks, pentagons, pluses. (a,b) Full model; (c,d) $\varPi _\rho =0$ in (3.41). Here: (a) $Re_G=[-4123,-6713,-9157]$; (b) $Re_G=[-4123,-6713,-8220]$; (c) $Re_G=[-6713,-9100,-11\,000,-15\,000]$; (d) $Re_G=[-6713,-9100,-11\,000,-15\,000]$. Red dot-dashed curves track growth rate maximum $\{-k_i\}_{max}$. We have rescaled $\omega$ with $\mathcal {T}_\nu =2.207\times 10^{-3}$ s (see (3.34ac)).

Figure 9

Figure 9. Nonlinear computations (solid and dashed lines) with our WRIBL-LW model (3.6) versus experiments (symbols) of Kofman (2014): $Ka=3174$ (water and air I in table 1), $H^\star =19$ mm, $\phi =5^\circ$, $Re_L=32.7$, $f_0^\star =2.8$ Hz ($\omega _0^\star \mathcal {T}_\nu =0.039$). Film thickness time traces at fixed streamwise position. Solid green lines indicate TWS from numerical continuation; dashed black lines indicate open-domain computations with coherent inlet forcing ($\varepsilon _1=0.01$, $\varepsilon _2=0$). (a) Quiescent gas ($\varPi _\rho =\varPi _\mu =0$ in computations);(b) $Re_G=-4123$; (c) $Re_G=-6713$.

Figure 10

Figure 10. Top view snapshots from one of our experiments. Falling water film sheared by a counter-current air flow and subject to coherent inlet forcing: $H^\star =13$ mm, $\phi =5^\circ$, $Re_L^{as}=44.7$, $Re_L=43.1$, $f_0^\star =3.0$ Hz. The first snapshot indicates aerostatic configuration; the second snapshot and onwards indicate counter-current turbulent gas flow with increasing $|Re_G|$. Absolute instability limit from linear stability calculation in figure 12: $Re_G^{AI}=-5182$.

Figure 11

Figure 11. Gas effect on threshold of long-wave Kapitza instability. Linear stability predictions for a falling liquid film sheared by a counter-current gas flow: $Ka=3174$ (water and air I in table 1), $H^\star =13$ mm.(a) Neutral stability bounds. Black curves with circles indicate $\phi =5^\circ$; red curves with diamonds indicate $\phi =1^\circ$. Curves with filled symbols indicate WRIBL-LW/WRIBL-OS prediction for turbulent gas flow; curves with open symbols indicate fully coupled prediction for laminar gas flow (Tilley et al.1994); dot-dashed magenta curve indicates short-wave instability mode (§ 6.2) at $\phi =1^{\circ }$; shaded zone indicates turbulence transition, $Re_G \in [-1800, -1300]$. S/U denote stable/unstable regions. (b) Spatial growth rate dispersion curves from WRIBL-OS: $\phi =1^\circ$, $Re_L=1.5\ (5/6)\cot (\phi )$. Pentagons indicate $\varPi _\rho =\varPi _\mu =0$ in (3.41); squares to pluses indicate $Re_G=-1000, -2000, -3000, -3600$.

Figure 12

Figure 12. Transition to AI predicted by spatial linear stability analysis with our WRIBL-OS approach. Parameters according to experiment in figure 10: $Ka=3174$ (water and air I in table 1), $H^\star =13$ mm, $\phi =5^\circ$, $Re_L=43.1$. Circles indicate $\varPi _\rho =\varPi _\mu =0$ in (3.41); diamonds indicate $Re_G=-4000$; crosses indicate $Re_G=-5181$. (a) Growth rate $-k_i$ versus $\omega$. Inset shows $-k_i$ versus $k_r$. Dot-dashed line indicates $Re_G=-5180$; dot-dot-dashed line indicates $Re_G=Re_G^{AI}=-5182$. (b) Wave speed $c_r=\omega /k_r$. Vertical dashed line indicates forcing frequency $f_0^\star =3$ Hz from figure 10. We have rescaled $\omega$ with $\mathcal {T}_\nu =2.207\times 10^{-3}$ s (see (3.34ac)).

Figure 13

Figure 13. Gas effect on nonlinear TWS obtained with our WRIBL-LW model (curves) versus experiments (empty symbols). Inclined falling liquid film sheared by counter-current turbulent gas flow: $Ka=3174$ (water and air I in table 1), $\phi =5^\circ$. Filled/open symbols distinguish number of capillary ripples (CR): diamonds indicate 0-CR; squares indicate 1-CR; triangles indicate 2-CR; circles indicate3-CR; dashed line indicates >3-CR. Solid curves indicate $f^\star =f_0^\star$; dot-dashed curves indicate $f^\star =f^\star _{max}$. Crosses indicate AI limit; asterisks indicate nonlinear limit points. Open/filled red arrows mark AI limits obtained from WRIBL-LW/WRIBL-OS. (a,c) Wave height; (b,d) wave speed scaled with $\hat {u}_{Nu}^\star =(3/2)q_{L 0}^\star /h_{Nu}^\star$, where $h_{Nu}^\star =(3q_{L0}^\star\nu_L/(g\sin(\phi)))^{1/3}$. (a,b) Versus our experiments: $H^\star =13$ mm, $f_0^\star =3.0$ Hz, with (a) $Re_L=44.2\pm 0.3$, (b) $Re_L=43.1$. Filled arrow indicates $Re_G^{AI}=-5194$; empty arrow indicates $Re_G^{AI}=-5366$. (c,d) Versus experiments of Kofman et al. (2017): $H^\star =19$ mm, $Re_L=45$, $f_0^\star =3.05$ Hz. Filled arrow indicates $Re_G^{AI}=-8490$; empty arrow indicates $Re_G^{AI}=-9633$.

Figure 14

Figure 14. Gas effect on streamwise evolution of the wavy liquid film. Compilation of our experiments: water/air, $H^\star =13$ mm, $\phi =5^\circ$, $Re_L^{as}=46$, $Re_L=44.2\pm 0.3$, $f_0^\star =3$ Hz, $Re_G^{AI}=-5194$.(a) Ensemble-averaged wave height $h_{max}^\star$. Error bars represent standard deviation, and check marks mark the start of the coalescence-dominated region. Filled symbols mark data points used in figure 13(a). Circles indicate aerostatic configuration; diamonds indicate $Re_G=-3040$; squares indicate $Re_G=-4190$; pentagons indicate $Re_G=-5200$; triangles indicate $Re_G=-5750$. (b) Frequency spectra of the film height $h^\star$, with $Re_G=-5750$, where $|\hat {h}^\star _i|$ denotes the amplitude of the Fourier mode with $f_i^\star$. Crosses mark primary and secondary peaks. Left, $x^\star =41.5$ cm; middle, $x^\star =51.5$ cm; right, $x^\star =58.5$ cm.

Figure 15

Figure 15. Wave coalescence event. Top-view snapshots from our experiment in figure 10 (parameters similar to pentagons in figure 14a): $Re_L=43.1$, $Re_G=-5200$. Time increases from top left to bottom right with increment 0.48 s. Solid red and dashed yellow lines highlight two consecutive wave fronts.

Figure 16

Figure 16. Wave trains for two data sets from figure 14(a). (a) Film thickness time traces at $x^\star =82.5$ cm. Solid line indicates aerostatic configuration (circles in figure 14a), $Re_L^{as}=46.0$; dashed line indicates counter-current configuration (triangles in figure 14a), $Re_L=44.2$, $Re_G=-5750$. (b,c) Corresponding frequency spectra, where $|\hat {h}^\star _i|$ is the amplitude of the Fourier mode with $f_i^\star$. (b) Aerostatic configuration; open circles mark peaks at $f_0^\star$ and its harmonics. (c) Counter-current configuration; open circle marks global peak at most-amplified frequency $f_{max}^\star /f_0^\star =0.49$.

Figure 17

Figure 17. Gas effect on the starting position $x_c^\star$ of the coalescence-dominated region. Compilation of our experiments: water/air, $H^\star =13$ mm, $\phi =5^\circ$, $f_0^\star =3$ Hz. Circles indicate $Re_L=32.5\pm 0.6$; squares indicate $Re_L=44.3\pm 0.3$; curves indicate polynomial fits to guide the eye.

Figure 18

Figure 18. Gas effect on spatial evolution of naturally-evolving Kapitza waves. Open-domain computations using our WRIBL-LW model on a domain of length $L^\star =1.50$ m. The gas flow is applied over the entire domain length. Noisy inlet perturbation according to (3.46): $\varepsilon _1=0$, $\varepsilon _2=5\times 10^{-5}$. Parameters according to experiments in figure 14(a) (circles, squares and triangles there): $Ka=3174$ (water and air I in table 1), $H^\star =13$ mm, $\phi =5^\circ$, $Re_L=43.1$. Plots for: (a) $\varPi _\rho =\varPi _\mu =0$ in (3.6a); (b) $Re_G=-4190$; (c) $Re_G=-5750$. The AI limits, obtained from WRIBL-LW and WRIBL-OS, are $Re_G^{AI}=-5347$ and $Re_G^{AI}=-5182$.

Figure 19

Figure 19. Spatio-temporal diagrams of the normalized film height $h/h_{max}$ for the computations in figures 18(b) and 18(c): (a) $Re_G=-4190$, (b) $Re_G=-5750$. The AI frequency is ${f_{AI}^\star =3.35}$ Hz, as obtained from linear stability analysis based on our WRIBL-LW model.

Figure 20

Figure 20. Computations according to figures 18(a) and 18(b), but with additional coherent inlet forcing (3.46): $f_0^\star =3$ Hz, $\varepsilon _1=0.01$, $\varepsilon _2=5\times 10^{-5}$. Plots for: (a) $\varPi _\rho =\varPi _\mu =0$ in (3.6a); (b) $Re_G=-4190$.

Figure 21

Figure 21. Summary of wave data from our computations in figures 18 and 20. Maximum wave height $h_{max}$ versus the streamwise location. Circles indicate $\varPi _\rho =\varPi _\mu =0$; crosses indicate $Re_G=-4190$; diamonds indicate $Re_G=-5750$. Naturally evolving versus forced waves. (a) Noisy inlet perturbation: $\varepsilon _1=0$, ${\varepsilon _2=5\times 10^{-5}}$ in (3.46). (b) Additional coherent inlet forcing: $f_0^\star =3.0$ Hz, $\varepsilon _1=0.01$, $\varepsilon _2=5\times 10^{-5}$ in (3.46).

Figure 22

Figure 22. Vertically falling liquid film sheared by a turbulent counter-current gas flow. Liquid-side conditions according to figure 3(a) in Lavalle et al. (2020): $Ka=509.46$ (DMSO–water and air II in table 1), $Re_L=15$, $f_0^\star =16$ Hz, $Re_G^{AI}=-6500$. WRIBL computation on an open domain of length $L^\star =0.843$ m. Snapshots of the film height profile $h(x)$ at $f_0 t=61.4$. (a) At AI limit: $Re_G=Re_G^{AI}=-6500$. (b) Beyond AI limit: ${Re_G=-7500}$. Dot-dashed red line indicates $f_0 t=61.6$; green dashed line indicates Lagrangian path of a wave crest.

Figure 23

Figure 23. Standing ripples beyond the AI limit $Re_G^{AI}=-6500$. Computation from figure 22(b): ${Re_G=-7500}$. (a) Spatio-temporal diagram of the normalized film height $h/h_{max}$. (b) Film height time trace $h(t)$ at $x/L=0.6$. (c) Spatial profile of the liquid flow rate $q_L(x)$ at $f_0 t=61.4$.

Figure 24

Figure 24. New short-wave instability mode. Falling liquid film sheared by a turbulent counter-current gas flow: $Ka=3174$ (water and air I in table 1), $H^\star =13$ mm, $\phi =5^\circ$, $Re_L=43.1$, $Re_G^{AI}=-5182$. Temporal linear stability predictions using the OS-OS approach. Dashed blue indicates new short-wave mode; dot-dashed red indicates long-wave Kapitza mode; solid black with filled symbols indicates unstable merged mode; solid green with open symbols indicates stable merged mode. Pluses indicate $\varPi _\rho =\varPi _\mu =0$ in (3.41); crosses indicate $Re_G=-4700$; pentagons indicate $Re_G=-5200$; diamonds indicate $Re_G=-5750$; squares indicate ${Re_G=-6400}$; circles indicate $Re_G=-6760$. (a,c) Growth rate; (b,d) wave speed. Shaded magenta bands and filled magenta circles with error bars represent our experiment from figure 10: $Re_L=43.1$, $Re_G=-6760$, $\varLambda _{ripples}^\star =(13\pm 3)$ mm, $c_{ripples}^\star =(-6.2\pm 1.5)$ cm s$^{-1}$.

Figure 25

Figure 25. First signature of upward-travelling ripples in our experiments. Spatio-temporal diagrams of the film surface slope $\|\boldsymbol {\nabla } h\|$ for parameters in figure 10, obtained with the synthetic schlieren technique (Kofman et al.2014): $H^\star =13$ mm, $\phi =5^{\circ }$, $Re_L=43.1$, $f_0^\star =3$ Hz, $x^\star _0=48$ cm, $z^\star =13$ cm. (a) For $Re_G=-5200$, ripples start to appear in between Kapitza wave humps. (b) For $Re_G=-6080$, ripples deform crests of Kapitza waves.

Figure 26

Figure 26. Details of OS-OS linear stability predictions from figure 24: $Ka=3174$, $Re_L=43.1$, $H^\star =13$ mm, $\phi =5^\circ$. (a) Merging between the short-wave and long-wave instability modes from figures 24(a) and 24(c). Diamonds indicate $Re_G=-5750$; lines without symbols indicate $Re_G=-5680$, pentagons indicate $Re_G=-5200$. (b) Primary-flow liquid velocity at the film surface. Solid line indicates $H^\star =13$ mm, ${Re_{G}^{AI}=-5182}$; dot-dashed line indicates $H^\star =19$ mm, $Re_{G}^{AI}=-8461$; dashed line indicates $H^\star =5$ mm, $Re_{G}^{AI}=-1501$. Asterisks indicate the AI limit from WRIBL-OS spatial linear stability calculations.

Figure 27

Figure 27. Eigenfunctions (4.13a,b) for different instability modes from figure 24. Turbulent counter-current gas flow: $Re_G=-5200$. Linearly most-amplified short-wave (dashed blue lines, $k=12.8$) and long-wave (solid red lines, $k=1.6$) instability modes. (a) Liquid film, $\phi$; (b) gas layer, $\psi$.

Figure 28

Figure 28. Validation of our WRIBL-OS approach (§ 4.1). Spatial linear stability predictions for parameters in figure 15 of Vellingiri et al. (2015): $Ka=2000$ (methanol and helium in table 1), $\phi =90^{\circ }$, $\underline {Re}_0=3Re_L/\sin (\phi )=10$, $H^\star =30$ mm, $\varPi _\rho =0$, (3.6a) truncated at ${O}(\epsilon )$. Quantities are scaled with $\underline {\mathcal {L}}=h_0^\star$ and $\underline {\mathcal {U}}=h_0^{\star 2}g\sin(\phi)/(2\nu_L)$. The counter-current gas shear stress is quantified via $\varTheta =\left|T^\star_{G 0}\right|\!/(\mu_L \underline{\mathcal{U}}/\underline{\mathcal{L}})$.

Figure 29

Figure 29. Validation of our WRIBL-OS (§ 4.1) and OS-OS (§ 4.2) approaches. Temporal linear stability predictions for a gas-sheared vertically falling liquid film. (a) Neutral stability curves for parameters according to figure 11 in Vellingiri et al. (2015): $Ka=2000$, $H^\star =300$ mm. Crosses indicate OS-OS; solid lines indicate WRIBL-OS; open circles indicate data from Vellingiri et al. (2015). Thin solid line, $\varTheta =0$; dashed line, $\varTheta =1$; dot-dashed line, $\varTheta =2$; dot-dot-dashed line, $\varTheta =3$; thick solid line, $\varTheta =3.5$. Same scaling as in figure 28. (b) Growth rate dispersion curves for parameters according to figure 4(e) in Schmidt et al. (2016): $H^\star =10$ mm, $\rho _{L}=1000$ kg m$^{-3}$, $\mu _{L}=0.5\times 10^{-3}$ Pa s, $\rho _{G}=1$ kg m$^{-3}$, $\mu _{G}=1\times 10^{-6}$ Pa s, $\sigma =1$ mN m$^{-1}$, $\delta _{L}=h_0^\star /H^\star =0.08$, $\widetilde {Fr}=\tilde {\mathcal {U}}/\sqrt {g\tilde {\mathcal {L}}}=3$, $Re_{L}=6166$, $Re_{G}=48\,322$. Tildes indicate scaling with $\tilde {\mathcal {L}}=H^\star$ and $\tilde {\mathcal {U}}=[\partial _{x^\star }P_{G 0}^\star H^\star /\rho _G]^{1/2}$. Solid blue line indicates long-wave Kapitza mode; dashed red line indicates short-wave Tollmien–Schlichting mode.

Figure 30

Figure 30. Accounting for temporal and spatial derivatives of $T_G$ and $P_G$ in (3.6a). Temporal linear stability predictions based on three approaches for conditions according to figure 24: $Ka=3174$ (water and air I in table 1), $H^\star =13$ mm, $\phi =5^{\circ }$, $Re_{L}=43.1$. Dot-dashed lines indicate WRIBL-OS (3.41); solid lines indicate OS-OS (4.20) and (4.21); dashed lines indicate WRIBL-OS, including derivatives of $T_G$ and $P_G$ in (3.6a). (a) Here, $Re_{G}=-4700$. Red lines indicate long-wave Kapitza mode, blue lines indicate short-wave mode.(b) Here, $Re_{G}=-6760$, merged mode.

Ishimura et al. Supplementary Movie 1

Gas-induced wave coalescence on a weakly-inclined falling liquid film subject to a counter-current turbulent gas flow. Parameters according to panel 18b: below the absolute instability limit.

Download Ishimura et al. Supplementary Movie 1(Video)
Video 2.7 MB

Ishimura et al. Supplementary Movie 2

Regular wave train produced by absolute instability (AI) on a weakly-inclined falling liquid film subject to a counter-current turbulent gas flow. Parameters according to panel 18c: beyond the AI limit.

Download Ishimura et al. Supplementary Movie 2(Video)
Video 2.6 MB

Ishimura et al. Supplementary Movie 3

Standing ripples generated by absolute instability on a vertically falling liquid film subject to an increasingly strong counter-current turbulent gas flow. Parameters according to figure 23.

Download Ishimura et al. Supplementary Movie 3(Video)
Video 44.6 MB