1 Introduction
Resonant phenomena are widely encountered in fluid systems, where they are underpinned by diverse flow physics. In flow-acoustic resonance, they may be exploited to produce pleasant, desired effects, as is the case with musical wind instruments (Howe Reference Howe1975; Coltman Reference Coltman1976; Fabre et al. Reference Fabre, Gilbert, Hirschberg and Pelorson2012). Or they may constitute an undesired behaviour that complicates the design of engineering systems. This can occur for flow in the presence of sharp edges (Richardson Reference Richardson1931; Curle Reference Curle1953; Powell Reference Powell1953a ) or cavities (Rossiter Reference Rossiter1964; Rowley, Colonius & Basu Reference Rowley, Colonius and Basu2002; Kegerise et al. Reference Kegerise, Spina, Garg and Cattafesta2004); it is the case for imperfectly expanded supersonic jets, that screech (Powell Reference Powell1953b ; Alkislar, Krothapalli & Lourenco Reference Alkislar, Krothapalli and Lourenco2003; Edgington-Mitchell et al. Reference Edgington-Mitchell, Oberleithner, Honnery and Soria2014), impinging jets (Powell Reference Powell1988; Krothapalli et al. Reference Krothapalli, Rajkuperan, Alvi and Lourenco1999; Henderson, Bridges & Wernet Reference Henderson, Bridges and Wernet2005) and globally unstable flows more generally (Huerre & Monkewitz Reference Huerre and Monkewitz1990; Monkewitz, Huerre & Chomaz Reference Monkewitz, Huerre and Chomaz1993).
Resonance is most often the result of an identifiable feedback that involves a disturbance, initiated at some point in the flow, and that triggers, at a distant point, a second disturbance that influences, or feeds back to, the inception point. Synchronisation occurs when the phases of the disturbances are appropriately matched at the inception and reflection points. In this long-range feedback scenario, the inception and reflection points may correspond to physical boundaries, as is the case in cavity flows, or they may arise due to other flow phenomena, such as shocks in underexpanded supersonic jets, or turning points in slowly spreading mean flows (Rienstra Reference Rienstra2003; Towne et al. Reference Towne, Cavalieri, Jordan, Colonius, Schmidt, Jaunet and Brès2017). In certain globally unstable flows, resonance may occur in the absence of solid boundaries, between disturbances of opposite generalised group velocity when their frequencies and wavenumbers become matched; this is the case for the saddle-point ringing that underpins absolute instability in wake flows or low-density jets for instance (Huerre & Monkewitz Reference Huerre and Monkewitz1990).
In many of the examples evoked above, the downstream-travelling disturbance is a convectively unstable Kelvin–Helmholtz wave, and the upstream-travelling disturbance a sound wave. But in the case of round jets there are other kinds of wave available for both upstream and downstream transport of fluctuation energy. Tam & Hu (Reference Tam and Hu1989) discuss one such upstream-travelling wave, originally observed by Michalke (Reference Michalke1970), who disregarded it as an artefact of the locally parallel framework of his analysis. It has been suggested by Tam & Ahuja (Reference Tam and Ahuja1990) that this wave may be important in explaining the tonal behaviour of impinging subsonic jets, and a recent numerical study by Bogey & Gojon (Reference Bogey and Gojon2017) shows that this may also be the case for resonance in impinging supersonic jets, although Weightman et al. (Reference Weightman, Amili, Honnery, Soria and Edgington-Mitchell2017) show that free-stream sound waves can also complete the feedback part of the cycle in such flows. Schmidt et al. (Reference Schmidt, Towne, Colonius, Cavalieri, Jordan and Brès2017) and Towne et al. (Reference Towne, Cavalieri, Jordan, Colonius, Schmidt, Jaunet and Brès2017) recently discovered that the round jet can support a number of additional waves. Resonance possibilities in jets are therefore more numerous than had previously been thought.
The present study was motivated by the new generation of ultra-high-bypass-ratio turbofan engines and potential problems posed by the closely coupled jet–flap configurations that such systems involve. With this in mind, we consider the problem of subsonic jets grazing a sharp edge. While the literature is relatively rich in terms of the study of jets impinging on flat surfaces (Ho & Nosseir Reference Ho and Nosseir1981; Landreth & Adrian Reference Landreth and Adrian1990; Tam & Ahuja Reference Tam and Ahuja1990; Krothapalli et al. Reference Krothapalli, Rajkuperan, Alvi and Lourenco1999; Henderson et al. Reference Henderson, Bridges and Wernet2005), or on cylinders, wedges and edges situated within the flow (Powell Reference Powell1961; Hussain & Zaman Reference Hussain and Zaman1978; Staubli & Rockwell Reference Staubli and Rockwell1987; Umeda, Maeda & Ishii Reference Umeda, Maeda and Ishii1987), there is relatively little work on the case where a jet grazes, rather than impinges on, an edge. Such configurations were considered in the 1970s (Neuwerth Reference Neuwerth1974; McKinzie & Burns Reference McKinzie and Burns1975) and more recently by Lawrence & Self (Reference Lawrence and Self2015), who observed a tonal behaviour that they attributed to a resonance involving downstream-travelling Kelvin–Helmholtz waves and upstream-travelling, free-stream sound waves. We perform similar experiments, involving a flat rectangular plate whose edge is positioned within the shear layer of a round turbulent jet. The nozzle is the same used in recent work (Cavalieri et al. Reference Cavalieri, Rodríguez, Jordan, Colonius and Gervais2013; Jordan et al. Reference Jordan, Zhang, Lehnasch and Cavalieri2017; Jaunet, Jordan & Cavalieri Reference Jaunet, Jordan and Cavalieri2017; Schmidt et al. Reference Schmidt, Towne, Colonius, Cavalieri, Jordan and Brès2017; Towne et al. Reference Towne, Cavalieri, Jordan, Colonius, Schmidt, Jaunet and Brès2017; Brès et al. Reference Brès, Jordan, Jaunet, Le Rallic, Cavalieri, Towne, Lele, Colonius and Schmidt2018) and among the exit conditions considered are those of the cited studies. Our objective is to establish if the strong hydrodynamic and acoustic tones that are observed in this closely coupled jet–edge configuration can be understood in the framework of the waves considered by Schmidt et al. (Reference Schmidt, Towne, Colonius, Cavalieri, Jordan and Brès2017) and Towne et al. (Reference Towne, Cavalieri, Jordan, Colonius, Schmidt, Jaunet and Brès2017).
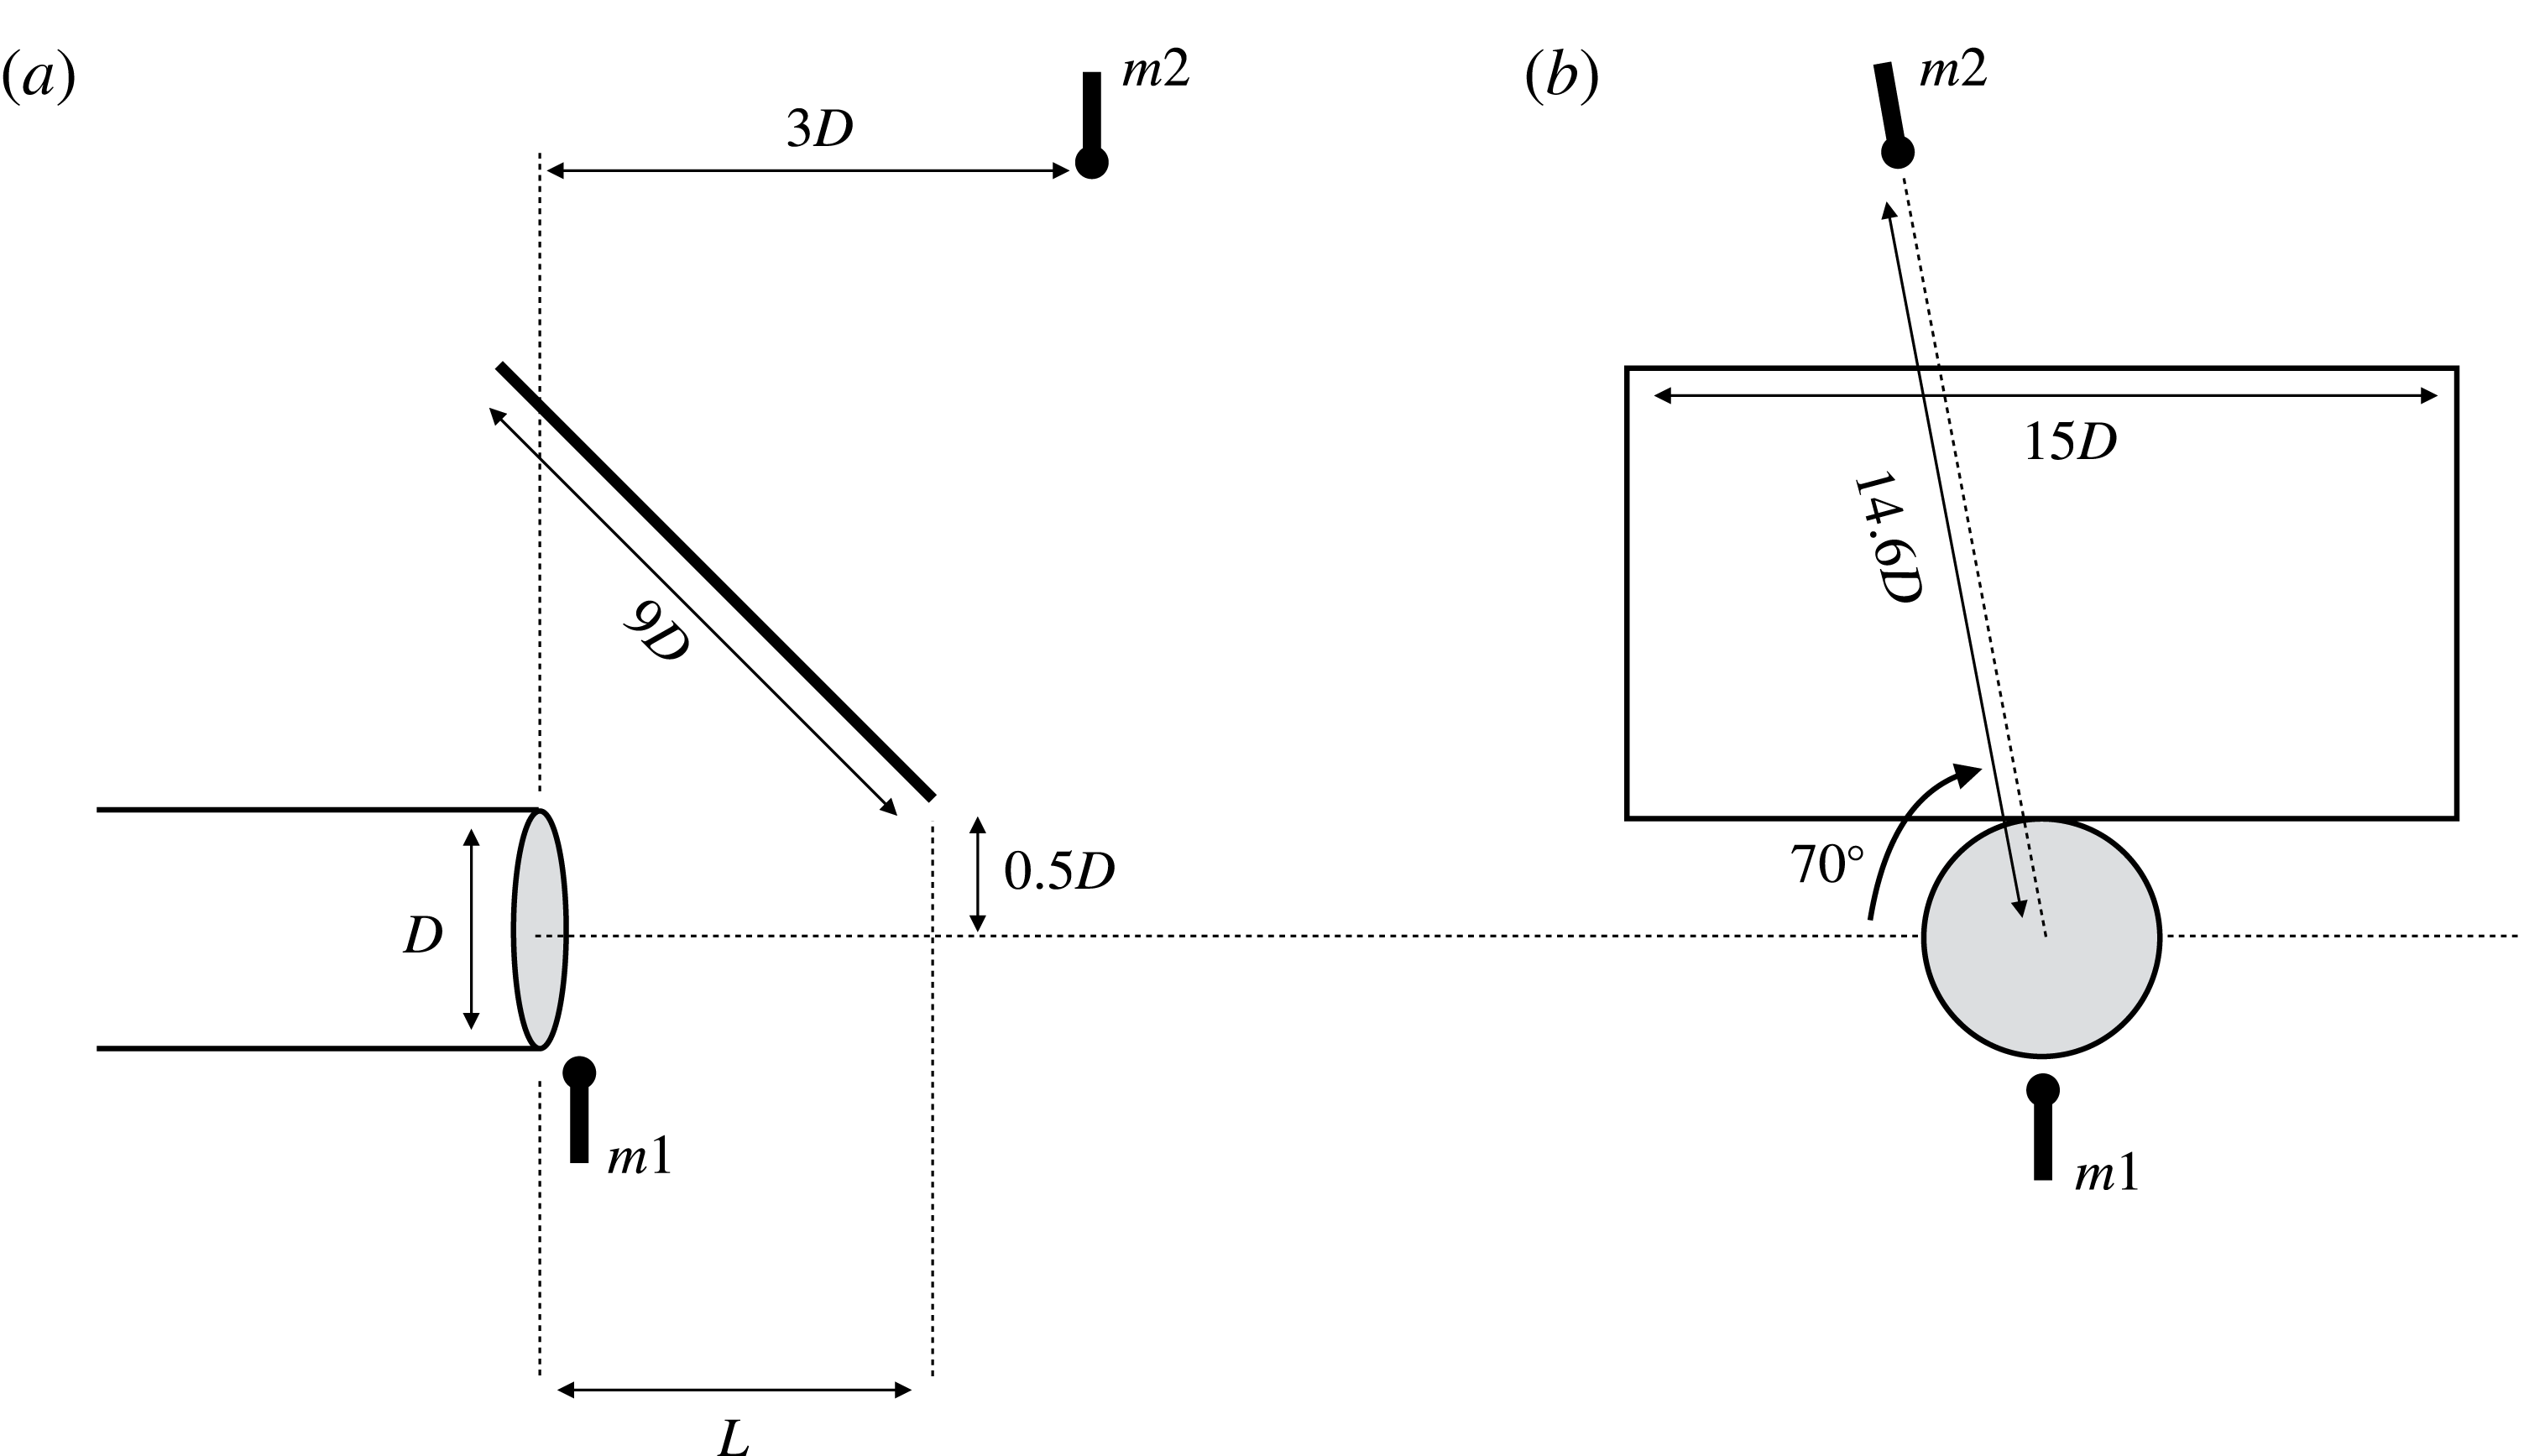
Figure 1. Schematic depiction of the experimental set-up. (a) Side view; (b) front view. Points
![]() $m1$
and
$m1$
and
![]() $m2$
are microphones situated, respectively, in the irrotational, hydrodynamic near field and in the acoustic field.
$m2$
are microphones situated, respectively, in the irrotational, hydrodynamic near field and in the acoustic field.
The remainder of the paper is organised as follows. We present the experimental set-up in § 2. This is followed, in § 3, by an overview of the hydrodynamic and acoustic pressure fields that result from interaction of the turbulent jet, whose Mach number is varied, with the plate edge, whose streamwise position is varied. In § 4 we recall briefly the theoretical framework established by Towne et al. (Reference Towne, Cavalieri, Jordan, Colonius, Schmidt, Jaunet and Brès2017) and then use this to explain the observed tones. Some concluding remarks are provided in § 5.
2 Experimental set-up
The experiments were performed at the Bruit et Vent jet-noise facility of the Institut Pprime, Poitiers, France. A schematic depiction of the set-up is shown in figure 1. This involved a round, isothermal jet of diameter
![]() $D=0.05~\text{m}$
and a rectangular aluminium plate, of dimensions
$D=0.05~\text{m}$
and a rectangular aluminium plate, of dimensions
![]() $9D\times 15D\times 0.06D$
, inclined at
$9D\times 15D\times 0.06D$
, inclined at
![]() $45^{\circ }$
to the upstream jet axis, positioned with one of its long edges on the jet lipline,
$45^{\circ }$
to the upstream jet axis, positioned with one of its long edges on the jet lipline,
![]() $r=0.5D$
, and at streamwise position,
$r=0.5D$
, and at streamwise position,
![]() $L$
, which was varied from
$L$
, which was varied from
![]() $2D$
to
$2D$
to
![]() $4D$
in increments of
$4D$
in increments of
![]() $1D$
. The Mach number of the jet was varied from
$1D$
. The Mach number of the jet was varied from
![]() $M=0.6$
to
$M=0.6$
to
![]() $M=1$
in increments of
$M=1$
in increments of
![]() $\unicode[STIX]{x0394}M=0.02$
. The boundary layer inside the nozzle was turbulent due to tripping by a carborundum strip situated 2.7
$\unicode[STIX]{x0394}M=0.02$
. The boundary layer inside the nozzle was turbulent due to tripping by a carborundum strip situated 2.7
![]() $D$
upstream of the exit plane (Cavalieri et al.
Reference Cavalieri, Rodríguez, Jordan, Colonius and Gervais2013).
$D$
upstream of the exit plane (Cavalieri et al.
Reference Cavalieri, Rodríguez, Jordan, Colonius and Gervais2013).

Figure 2. Power-spectral-density maps estimated from hydrodynamic, near-field pressure recordings (microphone
![]() $m1$
in figure 1) for three streamwise edge positions, (a), (b) and (c): respectively,
$m1$
in figure 1) for three streamwise edge positions, (a), (b) and (c): respectively,
![]() $L/D=2$
,
$L/D=2$
,
![]() $3$
and
$3$
and
![]() $4$
. Blue lines show the poor resonance predictions based on coupling between downstream-travelling Kelvin–Helmholtz waves and upstream-travelling free-stream sound waves.
$4$
. Blue lines show the poor resonance predictions based on coupling between downstream-travelling Kelvin–Helmholtz waves and upstream-travelling free-stream sound waves.
Measurements were performed for each configuration using a microphone located at
![]() $(x/D,r/D)=(0.08,0.55)$
(
$(x/D,r/D)=(0.08,0.55)$
(
![]() $m1$
in figure 1), in order to record the pressure signature in the irrotational hydrodynamic near field (Jordan & Colonius Reference Jordan and Colonius2013). All references to near-field data correspond to measurements provided by this microphone. A second microphone, situated on the shielded side of the plate (
$m1$
in figure 1), in order to record the pressure signature in the irrotational hydrodynamic near field (Jordan & Colonius Reference Jordan and Colonius2013). All references to near-field data correspond to measurements provided by this microphone. A second microphone, situated on the shielded side of the plate (
![]() $m2$
in figure 1), was used to perform measurements in the acoustic field. Twenty seconds of data were recorded at a sample rate of 200 kHz and power spectral densities estimated from this using Welch’s method. Frequency is expressed in non-dimensional form in terms of the Strouhal number,
$m2$
in figure 1), was used to perform measurements in the acoustic field. Twenty seconds of data were recorded at a sample rate of 200 kHz and power spectral densities estimated from this using Welch’s method. Frequency is expressed in non-dimensional form in terms of the Strouhal number,
![]() $St=fD/U_{j}$
, where
$St=fD/U_{j}$
, where
![]() $f$
is frequency in Hz, and
$f$
is frequency in Hz, and
![]() $U_{j}$
the jet exit velocity in
$U_{j}$
the jet exit velocity in
![]() $\text{m}~\text{s}^{-1}$
.
$\text{m}~\text{s}^{-1}$
.
3 Acoustic and hydrodynamic tones
The high sample rate and finely resolved Mach number variation allow us to obtain high-resolution power-spectral-density (PSD) maps (shown in figures 2 and 3 for the hydrodynamic and acoustic regions, respectively) that comprise a rich ensemble of spectral tones. Peak levels in the acoustic field are of the order of
![]() $170~\text{dB}/St$
, while levels in the hydrodynamic field are, naturally, considerably higher.
$170~\text{dB}/St$
, while levels in the hydrodynamic field are, naturally, considerably higher.
The strongest tones have a similar
![]() $St-M$
pattern in both acoustic and hydrodynamic regions, but this does not correspond to the usual edge-tone scenario, in which resonance occurs between downstream-travelling Kelvin–Helmholtz wavepackets and upstream-travelling sound waves – note that, following Towne et al. (Reference Towne, Cavalieri, Jordan, Colonius, Schmidt, Jaunet and Brès2017), we use the terms upstream- and downstream-travelling to refer to the sign of the generalised group velocity of a wave (Briggs Reference Briggs1964), rather than its phase velocity. The blue lines in figure 2 show what would be expected from such resonance, with predictions made using the methods that will be detailed in § 4.3; it is clear that neither the frequency spacing nor the Mach number trend of the observed peaks are captured by this model.
$St-M$
pattern in both acoustic and hydrodynamic regions, but this does not correspond to the usual edge-tone scenario, in which resonance occurs between downstream-travelling Kelvin–Helmholtz wavepackets and upstream-travelling sound waves – note that, following Towne et al. (Reference Towne, Cavalieri, Jordan, Colonius, Schmidt, Jaunet and Brès2017), we use the terms upstream- and downstream-travelling to refer to the sign of the generalised group velocity of a wave (Briggs Reference Briggs1964), rather than its phase velocity. The blue lines in figure 2 show what would be expected from such resonance, with predictions made using the methods that will be detailed in § 4.3; it is clear that neither the frequency spacing nor the Mach number trend of the observed peaks are captured by this model.
The broadband levels also exhibit an interesting behaviour. There exist Mach number ranges in which these are strongly suppressed (white regions in figure 2). Associated with this we see that the multiple low-frequency peaks (
![]() $St<0.7$
) are replaced by a single, stronger peak, of higher quality factor. Its harmonic also then appears clearly (e.g. at
$St<0.7$
) are replaced by a single, stronger peak, of higher quality factor. Its harmonic also then appears clearly (e.g. at
![]() $St=1.25$
for
$St=1.25$
for
![]() $M\approx 0.78$
,
$M\approx 0.78$
,
![]() $L=2D$
). This behaviour, which is repeatable and occurs whether the experiment is run from low to high Mach number or vice versa, likely corresponds to the onset of strong oscillator behaviour and an associated nonlinear limit cycle. Further evidence of nonlinear dynamics is manifest in mode switching, reported in appendix A. Such behaviour, namely switching between strong, nonlinear self-sustaining oscillations and a weaker, forced, lightly damped resonance, has also been observed in the cavity tone problem (Rowley et al.
Reference Rowley, Williams, Colonius, Murray and Macmynowski2006). In the present study, we restrict our attention to linear analysis in order to explain the feedback cycle and predict the oscillation frequencies.
$L=2D$
). This behaviour, which is repeatable and occurs whether the experiment is run from low to high Mach number or vice versa, likely corresponds to the onset of strong oscillator behaviour and an associated nonlinear limit cycle. Further evidence of nonlinear dynamics is manifest in mode switching, reported in appendix A. Such behaviour, namely switching between strong, nonlinear self-sustaining oscillations and a weaker, forced, lightly damped resonance, has also been observed in the cavity tone problem (Rowley et al.
Reference Rowley, Williams, Colonius, Murray and Macmynowski2006). In the present study, we restrict our attention to linear analysis in order to explain the feedback cycle and predict the oscillation frequencies.
The pattern of the strongest tones is characterised, for all plate-edge streamwise positions, by a progressively closer spacing between resonant peaks as either frequency or Mach number are increased. We refer to this effect as frequency squeezing. Our goal is to understand and model the flow dynamics responsible for this behaviour.
4 Understanding and predicting the tones
Exploration of the mechanisms responsible for the tonal behaviour discussed above requires consideration of the different kinds of wave that are supported by subsonic turbulent jets. These waves have been characterised in local and global frameworks by Schmidt et al. (Reference Schmidt, Towne, Colonius, Cavalieri, Jordan and Brès2017), and Towne et al. (Reference Towne, Cavalieri, Jordan, Colonius, Schmidt, Jaunet and Brès2017), respectively. The studies show that the turbulent jet in isolation can support diverse, weak, forced-resonance mechanisms, due to a rich variety of waves that is briefly summarised in what follows.
4.1 Overview of wave behaviour supported by turbulent jets
The resonance mechanisms studied by Schmidt et al. (Reference Schmidt, Towne, Colonius, Cavalieri, Jordan and Brès2017) and Towne et al. (Reference Towne, Cavalieri, Jordan, Colonius, Schmidt, Jaunet and Brès2017) in an isolated, isothermal, Mach 0.9 turbulent jet involve two kinds of downstream-travelling (
![]() $k^{+}$
) waves: (i) the well-known Kelvin–Helmholtz instability, that we denote
$k^{+}$
) waves: (i) the well-known Kelvin–Helmholtz instability, that we denote
![]() $k_{KH}^{+}$
(blue in figures 4 and 5); and (ii) a wave discovered by Towne et al. (Reference Towne, Cavalieri, Jordan, Colonius, Schmidt, Jaunet and Brès2017), denoted
$k_{KH}^{+}$
(blue in figures 4 and 5); and (ii) a wave discovered by Towne et al. (Reference Towne, Cavalieri, Jordan, Colonius, Schmidt, Jaunet and Brès2017), denoted
![]() $k_{T}^{+}$
(green in figures 4 and 5), that only exists in the Mach number range,
$k_{T}^{+}$
(green in figures 4 and 5), that only exists in the Mach number range,
![]() $0.82<M\leqslant 1$
, over a restricted range of frequencies, and whose physics vary within that range. At the low-frequency end the waves are largely trapped within and guided by the jet, behaving in the manner of acoustic waves propagating in a soft-walled cylindrical duct. At the high-frequency end, on the other hand, the waves have support in the shear layer and it is more appropriate to think of them as shear-layer modes.
$0.82<M\leqslant 1$
, over a restricted range of frequencies, and whose physics vary within that range. At the low-frequency end the waves are largely trapped within and guided by the jet, behaving in the manner of acoustic waves propagating in a soft-walled cylindrical duct. At the high-frequency end, on the other hand, the waves have support in the shear layer and it is more appropriate to think of them as shear-layer modes.
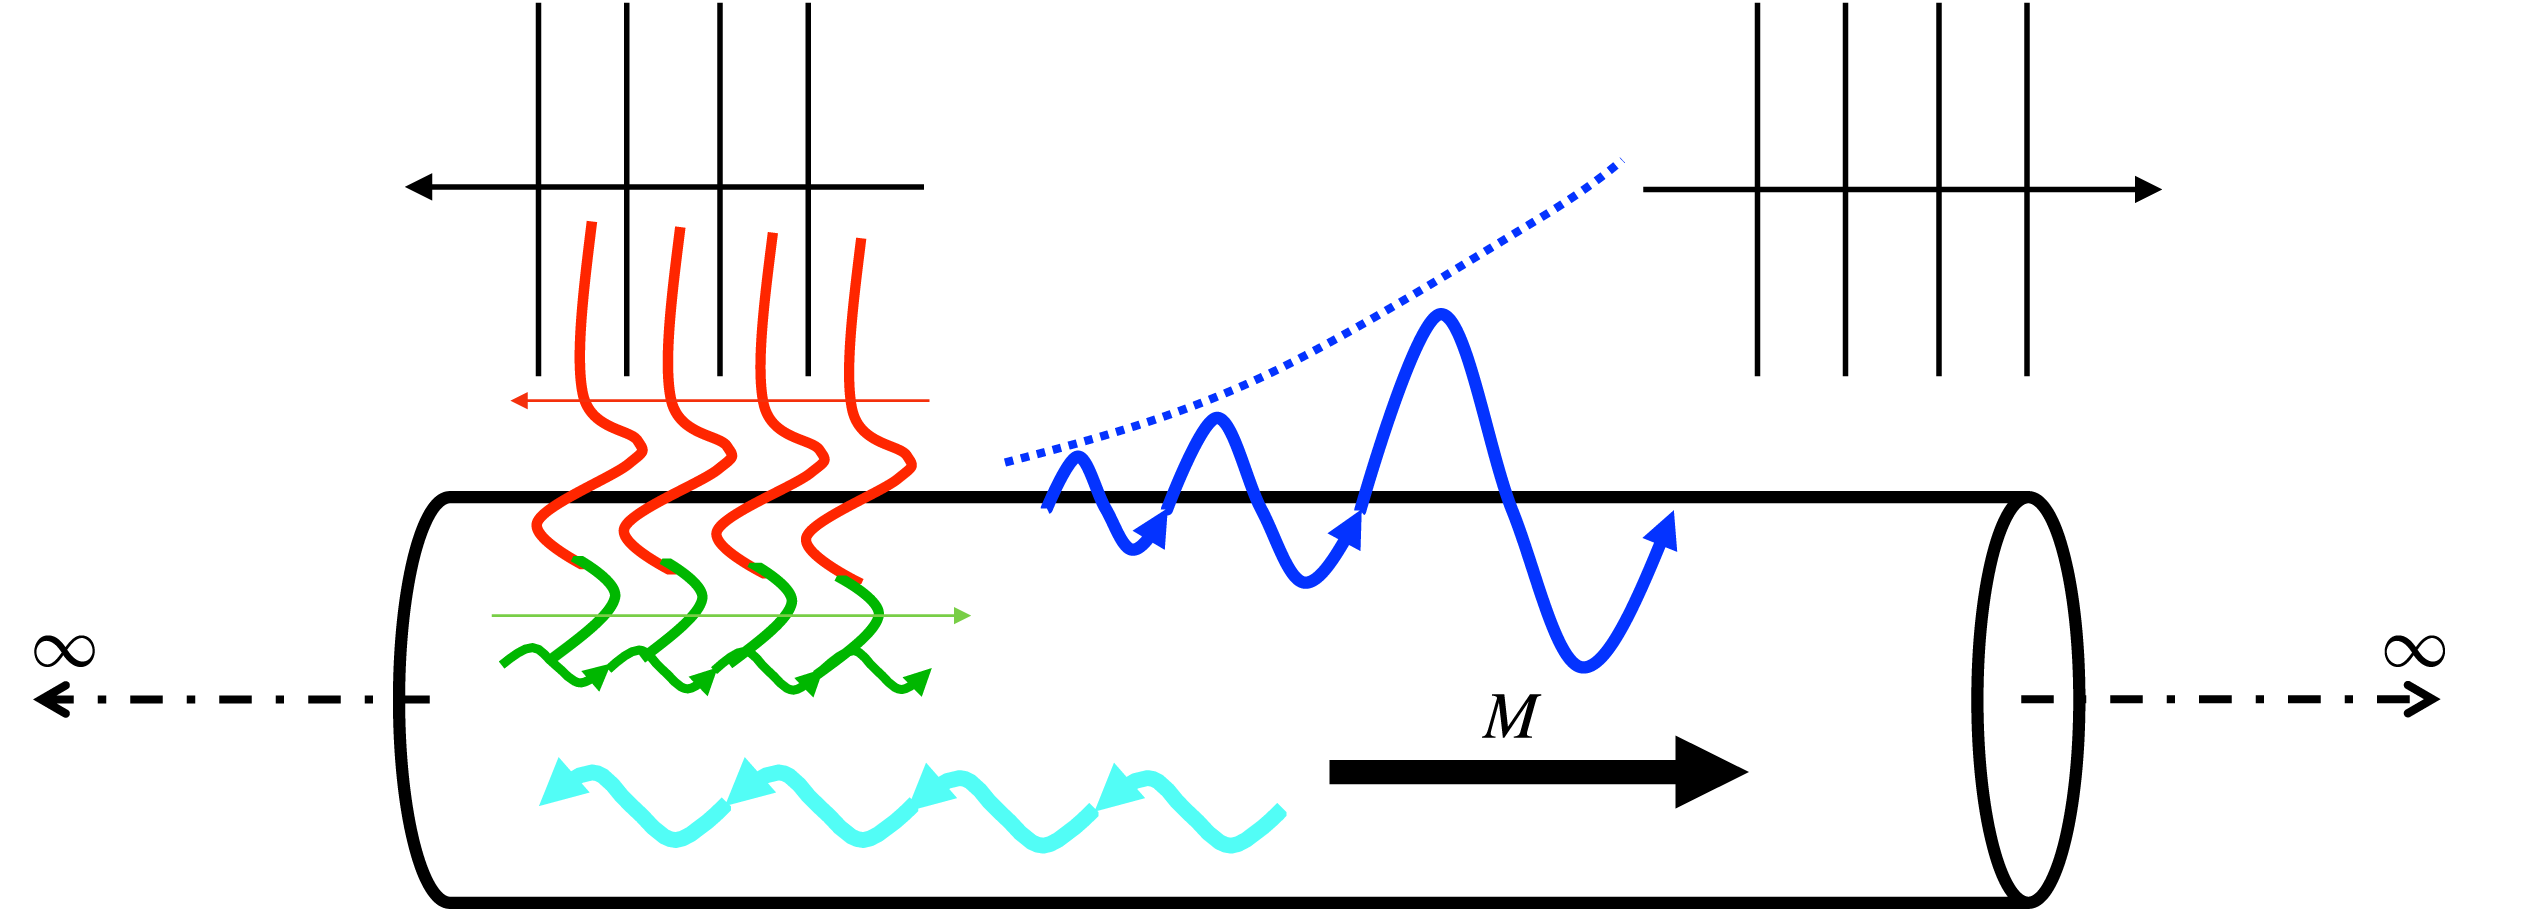
Figure 4. Schematic depiction of waves supported by cylindrical vortex sheet; colours correspond to those of figure 5.
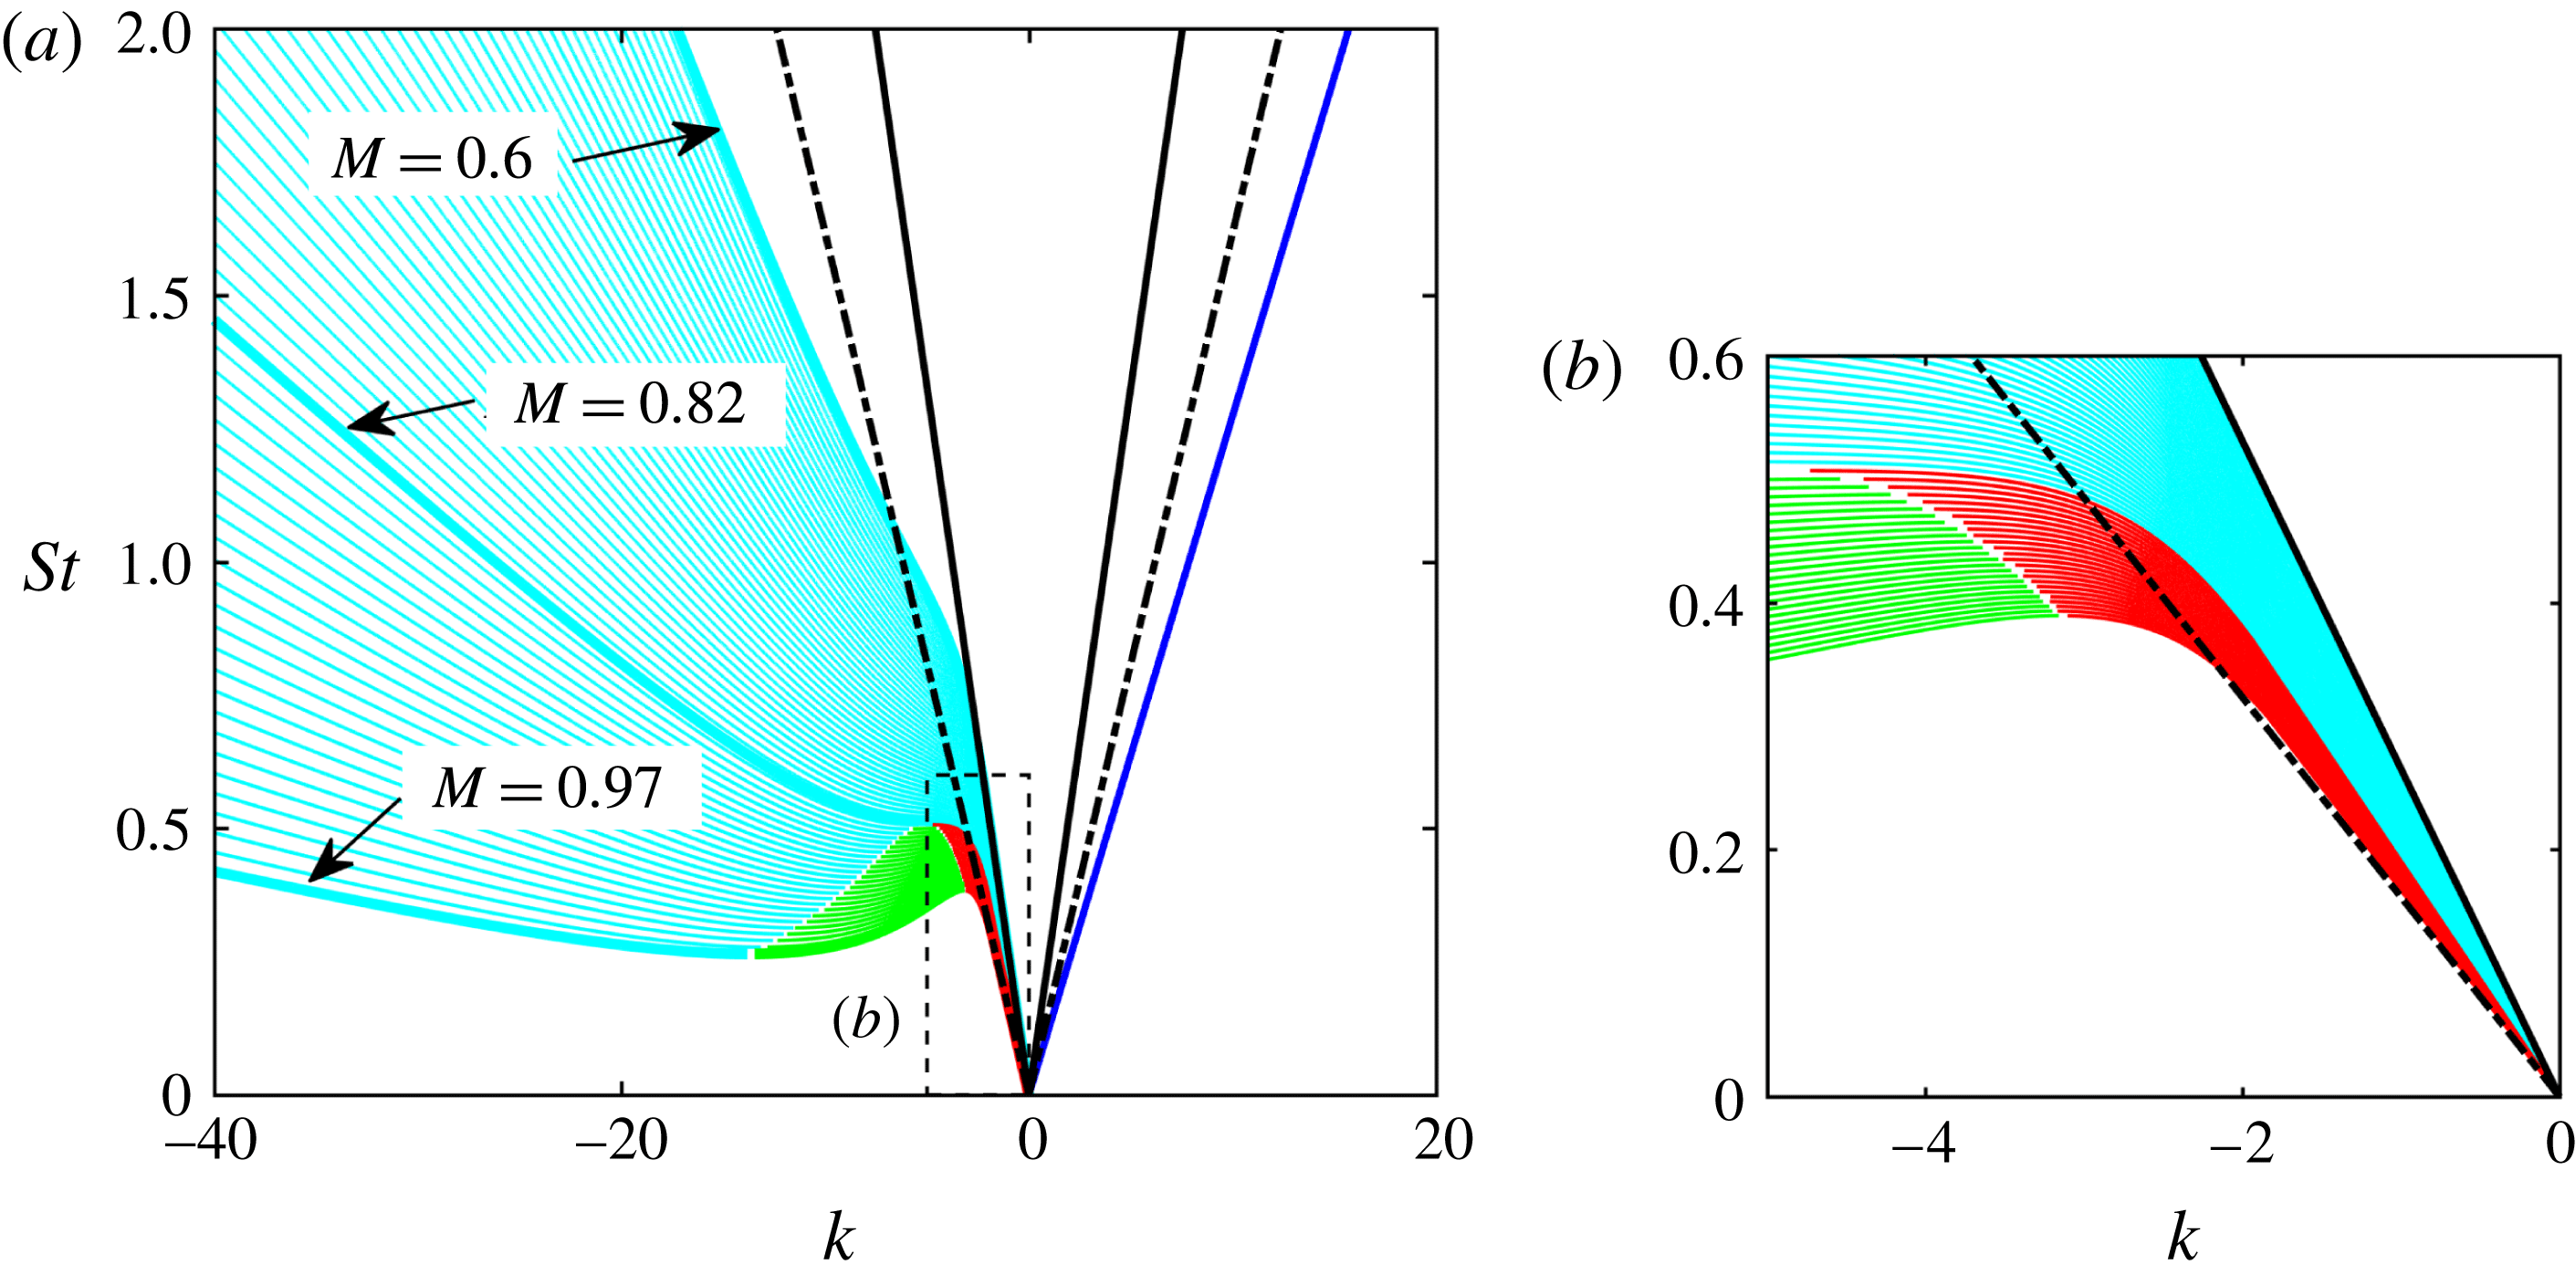
Figure 5. Vortex-sheet dispersion relations in the range
![]() $0.6\leqslant M\leqslant 0.97$
. Blue:
$0.6\leqslant M\leqslant 0.97$
. Blue:
![]() $k_{KH}^{+}$
Kelvin–Helmholtz modes; cyan in range
$k_{KH}^{+}$
Kelvin–Helmholtz modes; cyan in range
![]() $0.6\leqslant M\leqslant 0.82$
:
$0.6\leqslant M\leqslant 0.82$
:
![]() $k_{TH}^{-}$
modes (Tam & Hu Reference Tam and Hu1989); cyan in range
$k_{TH}^{-}$
modes (Tam & Hu Reference Tam and Hu1989); cyan in range
![]() $0.82<M\leqslant 0.97$
:
$0.82<M\leqslant 0.97$
:
![]() $k_{d}^{-}$
modes (Towne et al.
Reference Towne, Cavalieri, Jordan, Colonius, Schmidt, Jaunet and Brès2017); red and green, respectively:
$k_{d}^{-}$
modes (Towne et al.
Reference Towne, Cavalieri, Jordan, Colonius, Schmidt, Jaunet and Brès2017); red and green, respectively:
![]() $k_{p}^{-}$
and
$k_{p}^{-}$
and
![]() $k_{T}^{+}$
acoustic jet modes (Towne et al.
Reference Towne, Cavalieri, Jordan, Colonius, Schmidt, Jaunet and Brès2017); black:
$k_{T}^{+}$
acoustic jet modes (Towne et al.
Reference Towne, Cavalieri, Jordan, Colonius, Schmidt, Jaunet and Brès2017); black:
![]() $k^{+}$
and
$k^{+}$
and
![]() $k^{-}$
free-stream sound waves (solid:
$k^{-}$
free-stream sound waves (solid:
![]() $M=0.6$
; dash-dot:
$M=0.6$
; dash-dot:
![]() $M=0.97$
).
$M=0.97$
).
The downstream-travelling waves can undergo resonance with four kinds of upstream-travelling (
![]() $k^{-}$
) waves: free-stream sound waves and three kinds of acoustic jet wave. The first jet wave is that previously discussed by Tam & Hu (Reference Tam and Hu1989), and is denoted
$k^{-}$
) waves: free-stream sound waves and three kinds of acoustic jet wave. The first jet wave is that previously discussed by Tam & Hu (Reference Tam and Hu1989), and is denoted
![]() $k_{TH}^{-}$
in the present paper (cyan in figures 4 and 5). As shown by Towne et al. (Reference Towne, Cavalieri, Jordan, Colonius, Schmidt, Jaunet and Brès2017), this wave exists over the Mach number range,
$k_{TH}^{-}$
in the present paper (cyan in figures 4 and 5). As shown by Towne et al. (Reference Towne, Cavalieri, Jordan, Colonius, Schmidt, Jaunet and Brès2017), this wave exists over the Mach number range,
![]() $0<M\leqslant 0.82$
, and, like the
$0<M\leqslant 0.82$
, and, like the
![]() $k_{T}^{+}$
wave, its physics depend on the frequency considered. At sufficiently high frequency it is trapped within and guided by the jet, behaving in the manner of acoustic modes in a soft-walled duct. At lower frequencies, on the other hand, the mode has support in the shear layer and again must be thought of as a shear-layer mode. The second
$k_{T}^{+}$
wave, its physics depend on the frequency considered. At sufficiently high frequency it is trapped within and guided by the jet, behaving in the manner of acoustic modes in a soft-walled duct. At lower frequencies, on the other hand, the mode has support in the shear layer and again must be thought of as a shear-layer mode. The second
![]() $k^{-}$
wave, also discovered by Towne et al. (Reference Towne, Cavalieri, Jordan, Colonius, Schmidt, Jaunet and Brès2017), exists over the Mach number range,
$k^{-}$
wave, also discovered by Towne et al. (Reference Towne, Cavalieri, Jordan, Colonius, Schmidt, Jaunet and Brès2017), exists over the Mach number range,
![]() $0.82<M<1$
, and has the same soft-duct-like character as the high-frequency
$0.82<M<1$
, and has the same soft-duct-like character as the high-frequency
![]() $k_{TH}^{-}$
waves; it is therefore denoted,
$k_{TH}^{-}$
waves; it is therefore denoted,
![]() $k_{d}^{-}$
(cyan in figures 4 and 5). We distinguish it from the
$k_{d}^{-}$
(cyan in figures 4 and 5). We distinguish it from the
![]() $k_{TH}^{-}$
waves because, unlike these, it becomes evanescent below a well-defined frequency (at the transition from cyan to green in figure 5). We note that for Mach numbers close to
$k_{TH}^{-}$
waves because, unlike these, it becomes evanescent below a well-defined frequency (at the transition from cyan to green in figure 5). We note that for Mach numbers close to
![]() $M=0.82$
, in the close vicinity of the cutoff frequency, it also ceases to be duct-like, but the Strouhal and Mach number ranges over which it is duct-like are sufficiently large to justify the denomination. The third upstream-travelling wave behaves in a manner similar to the low-frequency end of the
$M=0.82$
, in the close vicinity of the cutoff frequency, it also ceases to be duct-like, but the Strouhal and Mach number ranges over which it is duct-like are sufficiently large to justify the denomination. The third upstream-travelling wave behaves in a manner similar to the low-frequency end of the
![]() $k_{TH}^{-}$
branch, i.e. it is a shear-layer mode, and is distinguished from the
$k_{TH}^{-}$
branch, i.e. it is a shear-layer mode, and is distinguished from the
![]() $k_{TH}^{-}$
wave by the fact that it becomes evanescent above a well-defined frequency (at the transition from red to green in figure 5). This wave is denoted
$k_{TH}^{-}$
wave by the fact that it becomes evanescent above a well-defined frequency (at the transition from red to green in figure 5). This wave is denoted
![]() $k_{p}^{-}$
(red in figures 4 and 5). We can add to this catalogue of waves, upstream- and downstream-travelling free-stream sound waves (black in figures 4 and 5), which are also potential candidates for the enabling of resonance.
$k_{p}^{-}$
(red in figures 4 and 5). We can add to this catalogue of waves, upstream- and downstream-travelling free-stream sound waves (black in figures 4 and 5), which are also potential candidates for the enabling of resonance.
The
![]() $k_{TH}^{-}$
,
$k_{TH}^{-}$
,
![]() $k_{T}^{+}$
,
$k_{T}^{+}$
,
![]() $k_{d}^{-}$
and
$k_{d}^{-}$
and
![]() $k_{p}^{-}$
waves are members of hierarchical families parameterised by two integers,
$k_{p}^{-}$
waves are members of hierarchical families parameterised by two integers,
![]() $(m,j)$
, corresponding to the azimuthal and radial orders of the waves. In what follows, we restrict attention to axisymmetric waves,
$(m,j)$
, corresponding to the azimuthal and radial orders of the waves. In what follows, we restrict attention to axisymmetric waves,
![]() $m=0$
, of radial order,
$m=0$
, of radial order,
![]() $j=1$
.
$j=1$
.
4.2 Dispersion relations
Our objective is to see if the tone patterns can be understood in terms of the waves described above. The linearised Euler equations provide the modelling framework. These are considered in a locally parallel setting, with normal-mode ansatz,
Here,
![]() $q$
is the dependent variable of interest,
$q$
is the dependent variable of interest,
![]() $k$
the streamwise wavenumber, non-dimensionalised by
$k$
the streamwise wavenumber, non-dimensionalised by
![]() $D$
, and
$D$
, and
![]() $\unicode[STIX]{x1D714}=2\unicode[STIX]{x03C0}StM$
, is the non-dimensional frequency. Two dispersion relations are obtained from these: that which is obtained by considering the jet to behave as a soft-walled cylindrical duct and that we refer to as DR1,
$\unicode[STIX]{x1D714}=2\unicode[STIX]{x03C0}StM$
, is the non-dimensional frequency. Two dispersion relations are obtained from these: that which is obtained by considering the jet to behave as a soft-walled cylindrical duct and that we refer to as DR1,
where
![]() $\unicode[STIX]{x1D6FD}=\text{i}\unicode[STIX]{x1D6FE}_{i}/2$
; and that which describes waves supported by a cylindrical vortex sheet (Lessen, Fox & Zien Reference Lessen, Fox and Zien1965; Michalke Reference Michalke1970), referred to as DR2,
$\unicode[STIX]{x1D6FD}=\text{i}\unicode[STIX]{x1D6FE}_{i}/2$
; and that which describes waves supported by a cylindrical vortex sheet (Lessen, Fox & Zien Reference Lessen, Fox and Zien1965; Michalke Reference Michalke1970), referred to as DR2,
 $$\begin{eqnarray}\displaystyle {\mathcal{D}}(\unicode[STIX]{x1D714},k;M,T)=\frac{1}{(\unicode[STIX]{x1D714}-kM)^{2}}+\frac{1}{T}\frac{\text{I}_{m}\left(\displaystyle \frac{\unicode[STIX]{x1D6FE}_{i}}{2}\right)\left[\displaystyle \frac{\unicode[STIX]{x1D6FE}_{o}}{2}\text{K}_{m-1}\left(\displaystyle \frac{\unicode[STIX]{x1D6FE}_{o}}{2}\right)+m\text{K}_{m}\left(\displaystyle \frac{\unicode[STIX]{x1D6FE}_{o}}{2}\right)\right]}{\text{K}_{m}\left(\displaystyle \frac{\unicode[STIX]{x1D6FE}_{o}}{2}\right)\left[\displaystyle \frac{\unicode[STIX]{x1D6FE}_{i}}{2}\text{I}_{m-1}\left(\displaystyle \frac{\unicode[STIX]{x1D6FE}_{i}}{2}\right)+m\text{I}_{m}\left(\displaystyle \frac{\unicode[STIX]{x1D6FE}_{i}}{2}\right)\right]}=0, & & \displaystyle\end{eqnarray}$$
where
and the branch cut is chosen such that the real parts of
![]() $\unicode[STIX]{x1D6FE}_{i,o}$
be positive.
$\unicode[STIX]{x1D6FE}_{i,o}$
be positive.
The models have been thoroughly discussed by Towne et al. (Reference Towne, Cavalieri, Jordan, Colonius, Schmidt, Jaunet and Brès2017). We make a preliminary tone prediction using phase-speed information from DR2; fine-tuning requires additional analysis using both DR1 and DR2.
Figure 5 shows vortex-sheet dispersion relations, DR2, in the Mach number range
![]() $0.6\leqslant M\leqslant 0.97$
. With the exception of the Kelvin–Helmholtz mode, which has non-zero imaginary part, the lines are loci of eigenvalues with zero imaginary part, i.e. neutrally stable, propagating waves (Towne et al.
Reference Towne, Cavalieri, Jordan, Colonius, Schmidt, Jaunet and Brès2017); only the real parts of the Kelvin–Helmholtz eigenvalues are shown. The waves discussed above have been colour coded. The downstream-travelling waves are shown in blue and green: respectively, the Kelvin–Helmholtz mode,
$0.6\leqslant M\leqslant 0.97$
. With the exception of the Kelvin–Helmholtz mode, which has non-zero imaginary part, the lines are loci of eigenvalues with zero imaginary part, i.e. neutrally stable, propagating waves (Towne et al.
Reference Towne, Cavalieri, Jordan, Colonius, Schmidt, Jaunet and Brès2017); only the real parts of the Kelvin–Helmholtz eigenvalues are shown. The waves discussed above have been colour coded. The downstream-travelling waves are shown in blue and green: respectively, the Kelvin–Helmholtz mode,
![]() $k_{KH}^{+}$
, and the
$k_{KH}^{+}$
, and the
![]() $k_{T}^{+}$
mode. Upstream-travelling waves are shown in cyan and red: respectively, [
$k_{T}^{+}$
mode. Upstream-travelling waves are shown in cyan and red: respectively, [
![]() $k_{TH}^{-}$
(
$k_{TH}^{-}$
(
![]() $0.6\leqslant M\leqslant 0.82$
);
$0.6\leqslant M\leqslant 0.82$
);
![]() $k_{d}^{-}$
(
$k_{d}^{-}$
(
![]() $0.82<M<1$
)] and
$0.82<M<1$
)] and
![]() $k_{p}^{-}$
(
$k_{p}^{-}$
(
![]() $0.82<M<1$
). The black lines show dispersion relations for upstream- and downstream-travelling free-stream sound waves at
$0.82<M<1$
). The black lines show dispersion relations for upstream- and downstream-travelling free-stream sound waves at
![]() $M=0.6$
(solid) and,
$M=0.6$
(solid) and,
![]() $M=0.97$
(dash-dot).
$M=0.97$
(dash-dot).
Resonance can potentially occur between any
![]() $k^{+}/k^{-}$
mode pair; there are therefore five different possibilities if we exclude resonance between upstream- and downstream-travelling sound waves. Given that the Kelvin–Helmholtz mode is the only unstable wave, all others being in reality either neutral or slightly damped, the most likely scenario is that in which
$k^{+}/k^{-}$
mode pair; there are therefore five different possibilities if we exclude resonance between upstream- and downstream-travelling sound waves. Given that the Kelvin–Helmholtz mode is the only unstable wave, all others being in reality either neutral or slightly damped, the most likely scenario is that in which
![]() $k_{KH}^{+}$
is coupled, via end conditions provided by the nozzle exit plane and the plate edge, to a
$k_{KH}^{+}$
is coupled, via end conditions provided by the nozzle exit plane and the plate edge, to a
![]() $k^{-}$
mode. A further argument for excluding the
$k^{-}$
mode. A further argument for excluding the
![]() $k_{T}^{+}$
wave is the continuity of the tones across the
$k_{T}^{+}$
wave is the continuity of the tones across the
![]() $M=0.82$
threshold, on the lower side of which these modes are evanescent.
$M=0.82$
threshold, on the lower side of which these modes are evanescent.
4.3 Tone-frequency prediction for the jet–plate system
The conditions that must be satisfied for resonance to occur between waves travelling upstream and downstream between the nozzle exit plane and the plate edge, where they are coupled by reflections characterised by complex coefficients,
![]() $R_{1}(M,St)$
and
$R_{1}(M,St)$
and
![]() $R_{2}(M,St,L)$
, can, as shown in appendix B, be separated into magnitude and phase components, respectively,
$R_{2}(M,St,L)$
, can, as shown in appendix B, be separated into magnitude and phase components, respectively,
where
![]() $\unicode[STIX]{x1D719}$
refers to the argument of
$\unicode[STIX]{x1D719}$
refers to the argument of
![]() $R_{1}R_{2}$
. In most previous studies of fluid-mechanics resonance phenomena only the phase component is considered. This amounts to assuming that the waves are neutrally stable, both spatially and temporally. A convenient consequence of this is that knowledge of the absolute value of the reflection-coefficient product,
$R_{1}R_{2}$
. In most previous studies of fluid-mechanics resonance phenomena only the phase component is considered. This amounts to assuming that the waves are neutrally stable, both spatially and temporally. A convenient consequence of this is that knowledge of the absolute value of the reflection-coefficient product,
![]() $|R_{1}R_{2}|$
, and its dependence on Mach number, frequency and edge position, is not necessary for resonance-frequency prediction. The main results presented in what follows are obtained under this assumption. In appendix D we drop the assumption, allowing wavenumber and frequency to be complex, and thereby involve the magnitude component of the resonance condition (4.6). While the results of that analysis do indicate a low-frequency resonance cutoff that we discuss later, resonance-frequency prediction is found to be fragile due to the treatment of
$|R_{1}R_{2}|$
, and its dependence on Mach number, frequency and edge position, is not necessary for resonance-frequency prediction. The main results presented in what follows are obtained under this assumption. In appendix D we drop the assumption, allowing wavenumber and frequency to be complex, and thereby involve the magnitude component of the resonance condition (4.6). While the results of that analysis do indicate a low-frequency resonance cutoff that we discuss later, resonance-frequency prediction is found to be fragile due to the treatment of
![]() $|R_{1}R_{2}|$
as a parameter independent of Mach number, frequency and edge position. Given a better understanding of the flow physics associated with upstream and downstream reflection, and an associated model for
$|R_{1}R_{2}|$
as a parameter independent of Mach number, frequency and edge position. Given a better understanding of the flow physics associated with upstream and downstream reflection, and an associated model for
![]() $R_{1}(M,St)R_{2}(M,St,L)$
, it is likely that more reliable resonance-frequency prediction would be possible using the complex-wave model. The upstream reflection physics may be accessible, for instance, by a Wiener–Hopf analysis involving boundary conditions that change at
$R_{1}(M,St)R_{2}(M,St,L)$
, it is likely that more reliable resonance-frequency prediction would be possible using the complex-wave model. The upstream reflection physics may be accessible, for instance, by a Wiener–Hopf analysis involving boundary conditions that change at
![]() $x=0$
between a hard-walled nozzle and a vortex sheet (Rienstra Reference Rienstra2007) or by detailed numerical analysis. In the absence of such analyses, the present model, while imperfect, is found to be sufficient to support the hypothesis that resonance between
$x=0$
between a hard-walled nozzle and a vortex sheet (Rienstra Reference Rienstra2007) or by detailed numerical analysis. In the absence of such analyses, the present model, while imperfect, is found to be sufficient to support the hypothesis that resonance between
![]() $k^{-}$
jet modes and Kelvin–Helmholtz wavepackets underpins the observed edge-tone behaviour.
$k^{-}$
jet modes and Kelvin–Helmholtz wavepackets underpins the observed edge-tone behaviour.
The phase function of the reflection-coefficient product is also unknown. We choose therefore to consider two extremes,
![]() $\unicode[STIX]{x1D719}=0$
and
$\unicode[STIX]{x1D719}=0$
and
![]() $\unicode[STIX]{x1D719}=\unicode[STIX]{x03C0}$
, making the simplifying assumption that this phase function is also independent of Mach number, frequency and edge position. This leads to resonance conditions that we refer to in what follows as in phase and out of phase, respectively,
$\unicode[STIX]{x1D719}=\unicode[STIX]{x03C0}$
, making the simplifying assumption that this phase function is also independent of Mach number, frequency and edge position. This leads to resonance conditions that we refer to in what follows as in phase and out of phase, respectively,
where
![]() $\unicode[STIX]{x0394}k$
is the difference between the real parts of the wavenumbers of the upstream- and downstream-travelling waves that participate in resonance.
$\unicode[STIX]{x0394}k$
is the difference between the real parts of the wavenumbers of the upstream- and downstream-travelling waves that participate in resonance.
The wavenumber difference,
![]() $\unicode[STIX]{x0394}k$
, can be easily computed for any
$\unicode[STIX]{x0394}k$
, can be easily computed for any
![]() $k^{+}/k^{-}$
pair as a function of Mach number and frequency, using the dispersion relations of the two waves. This is shown in figure 6(a) for the pairs
$k^{+}/k^{-}$
pair as a function of Mach number and frequency, using the dispersion relations of the two waves. This is shown in figure 6(a) for the pairs
![]() $k_{KH}^{+}/k_{TH}^{-}$
and
$k_{KH}^{+}/k_{TH}^{-}$
and
![]() $k_{KH}^{+}/k_{d}^{-}$
, both shown in cyan, and for
$k_{KH}^{+}/k_{d}^{-}$
, both shown in cyan, and for
![]() $k_{KH}^{+}/k_{p}^{-}$
, shown in red. Having calculated
$k_{KH}^{+}/k_{p}^{-}$
, shown in red. Having calculated
![]() $\unicode[STIX]{x0394}k$
, the resonance criteria of (4.8) and (4.9) can be superposed, as in figure 6(b), and the resonant frequencies are defined by the intersection of these with the lines
$\unicode[STIX]{x0394}k$
, the resonance criteria of (4.8) and (4.9) can be superposed, as in figure 6(b), and the resonant frequencies are defined by the intersection of these with the lines
![]() $\unicode[STIX]{x0394}k(M,St)$
. The example shown in figure 6(b) is for
$\unicode[STIX]{x0394}k(M,St)$
. The example shown in figure 6(b) is for
![]() $M=0.6$
,
$M=0.6$
,
![]() $L/D=3$
and out-of-phase reflection conditions, and it illustrates an interesting characteristic of this kind of resonance: a frequency squeezing, due to the dispersive nature of the
$L/D=3$
and out-of-phase reflection conditions, and it illustrates an interesting characteristic of this kind of resonance: a frequency squeezing, due to the dispersive nature of the
![]() $k^{-}$
waves. As the Mach number is increased this squeezing becomes more pronounced, due to the stronger variation of phase speed with frequency.
$k^{-}$
waves. As the Mach number is increased this squeezing becomes more pronounced, due to the stronger variation of phase speed with frequency.
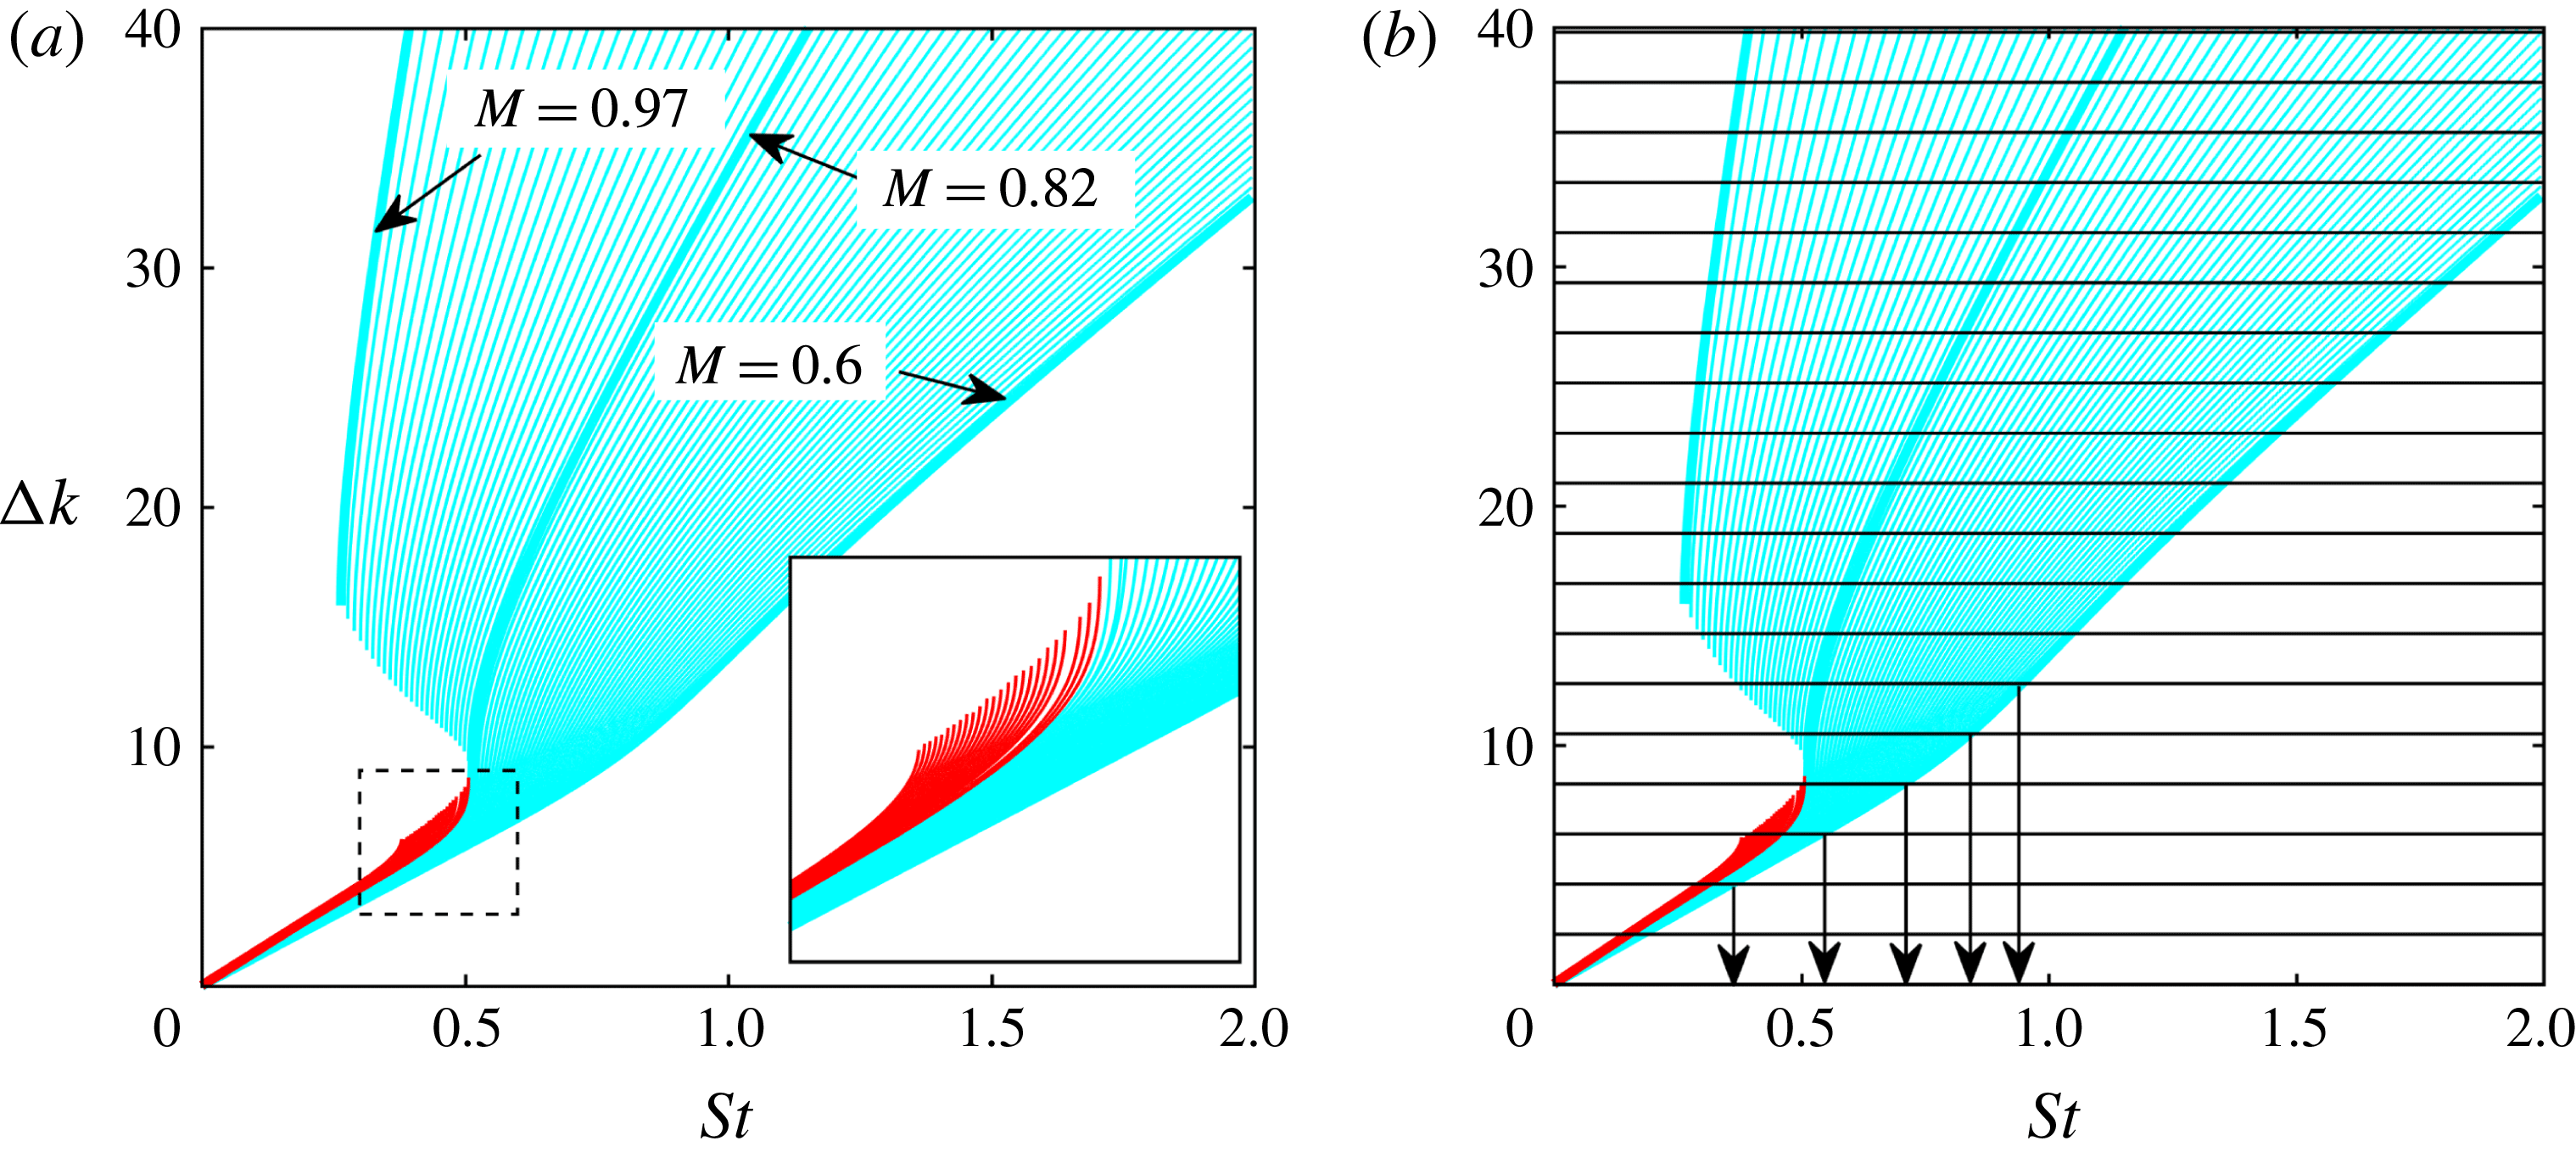
Figure 6. (a) Value of
![]() $\unicode[STIX]{x0394}k$
between
$\unicode[STIX]{x0394}k$
between
![]() $k_{KH}^{+}$
Kelvin–Helmholtz mode and all
$k_{KH}^{+}$
Kelvin–Helmholtz mode and all
![]() $k^{-}$
jet modes in range
$k^{-}$
jet modes in range
![]() $0.6\leqslant M\leqslant 0.97$
. (b) Illustration of resonance-frequency identification (showing frequency squeezing) for
$0.6\leqslant M\leqslant 0.97$
. (b) Illustration of resonance-frequency identification (showing frequency squeezing) for
![]() $L/D=3$
,
$L/D=3$
,
![]() $M=0.6$
and out-of-phase reflection conditions: horizontal lines show values of
$M=0.6$
and out-of-phase reflection conditions: horizontal lines show values of
![]() $\unicode[STIX]{x0394}k$
(4.8) for
$\unicode[STIX]{x0394}k$
(4.8) for
![]() $L/D=3$
.
$L/D=3$
.
Tone-frequency predictions are made for the Mach number range considered, using both reflection conditions, and these are compared with the observed behaviour in figure 7. Note that we do not show predictions obtained using the
![]() $k_{KH}^{+}/k_{d}^{-}$
as these were found not to match the data.
$k_{KH}^{+}/k_{d}^{-}$
as these were found not to match the data.
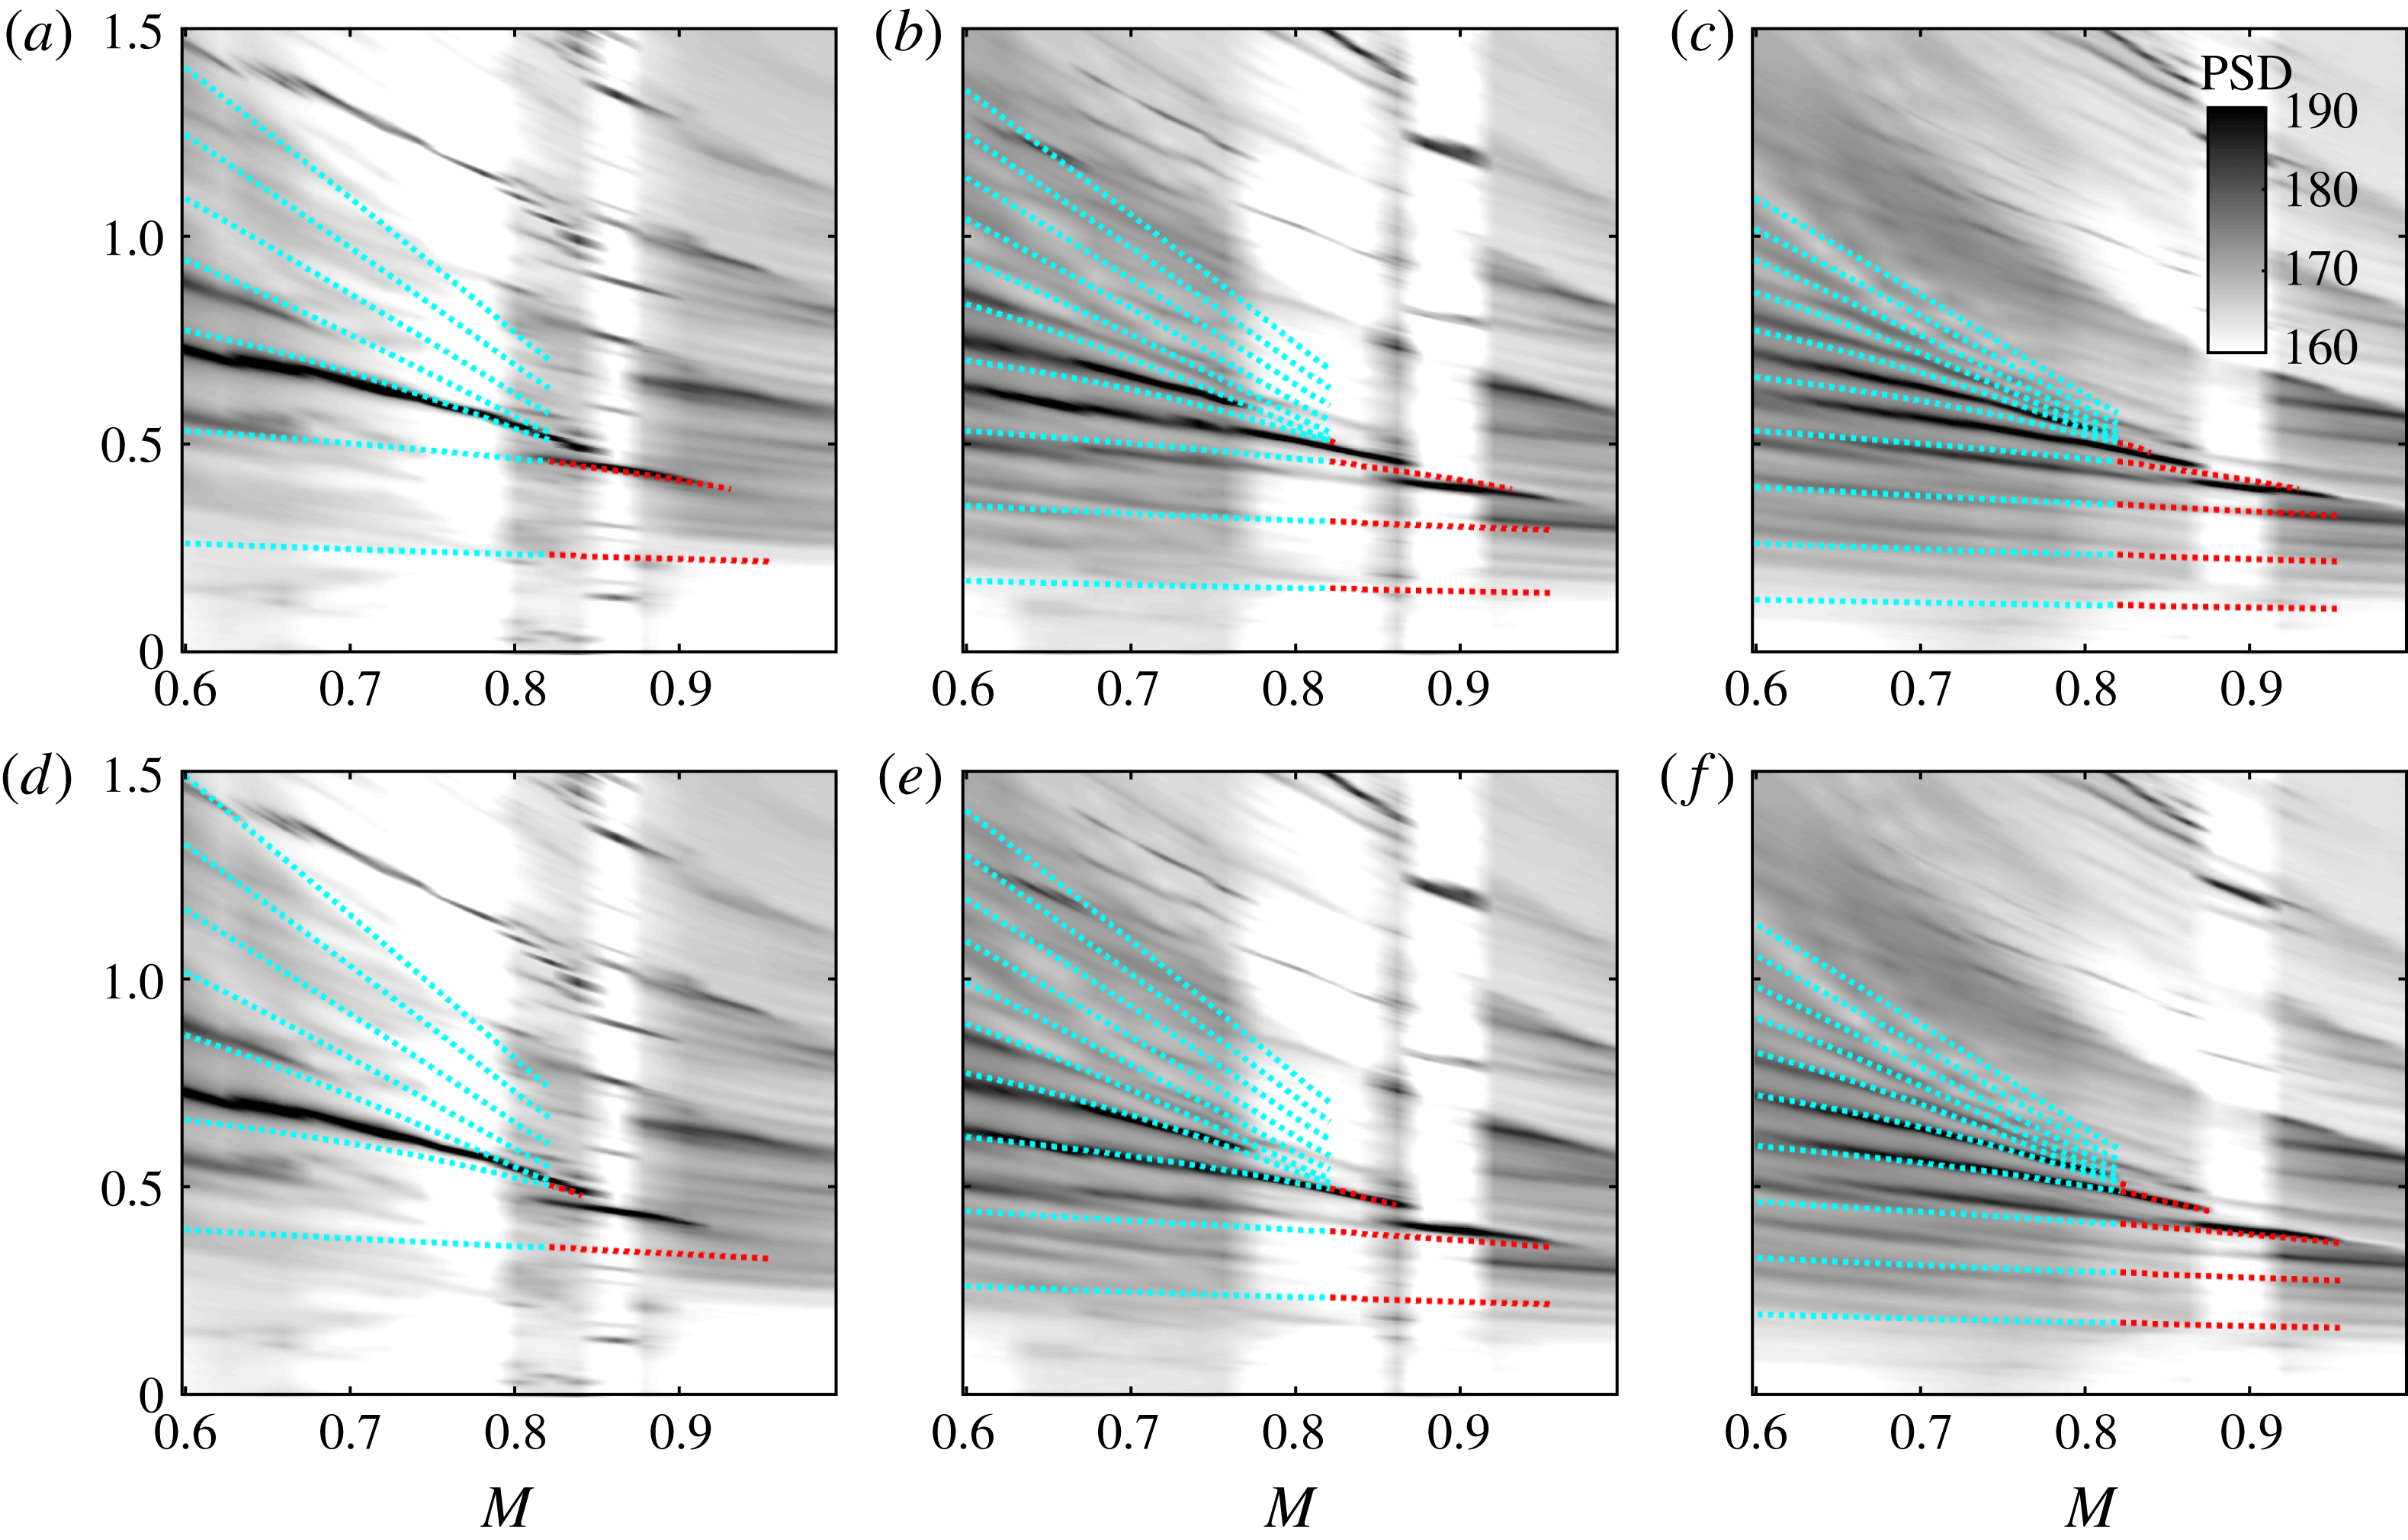
Figure 7. Tone-frequency predictions using vortex-sheet dispersion relations and assuming resonance between
![]() $k_{KH}^{+}$
and
$k_{KH}^{+}$
and
![]() $k^{-}$
jet modes, with out-of-phase (a–c) and in-phase (d–f) reflection conditions. From (a–c) to (d–f)
$k^{-}$
jet modes, with out-of-phase (a–c) and in-phase (d–f) reflection conditions. From (a–c) to (d–f)
![]() $L/D=2$
,
$L/D=2$
,
![]() $3$
and
$3$
and
![]() $4$
. Cyan: resonance between
$4$
. Cyan: resonance between
![]() $k_{KH}^{+}$
and
$k_{KH}^{+}$
and
![]() $k_{TH}^{-}$
; red: resonance between
$k_{TH}^{-}$
; red: resonance between
![]() $k_{KH}^{+}$
and
$k_{KH}^{+}$
and
![]() $k_{p}^{-}$
.
$k_{p}^{-}$
.
The general trend is satisfactorily captured, and in particular we observe the aforesaid frequency squeezing. But there remain three discrepancies: (i) the resonance models predict a continuation of the tones to infinitely high frequency, whereas the data show a clear cutoff; (ii) at low frequencies, the model predicts peaks that are not observed in the data; (iii) the best match is for some cases provided by the out-of-phase reflection condition, whereas for others the in-phase condition does better.
The third of these discrepancies is likely due to the simplified treatment of the reflection conditions, as discussed above, and further analysis is beyond the scope of the current study. Where the two other discrepancies are concerned, on the other hand, further explanation is possible. The high-frequency cutoff is considered in what follows.
4.4 High-frequency tone cutoff
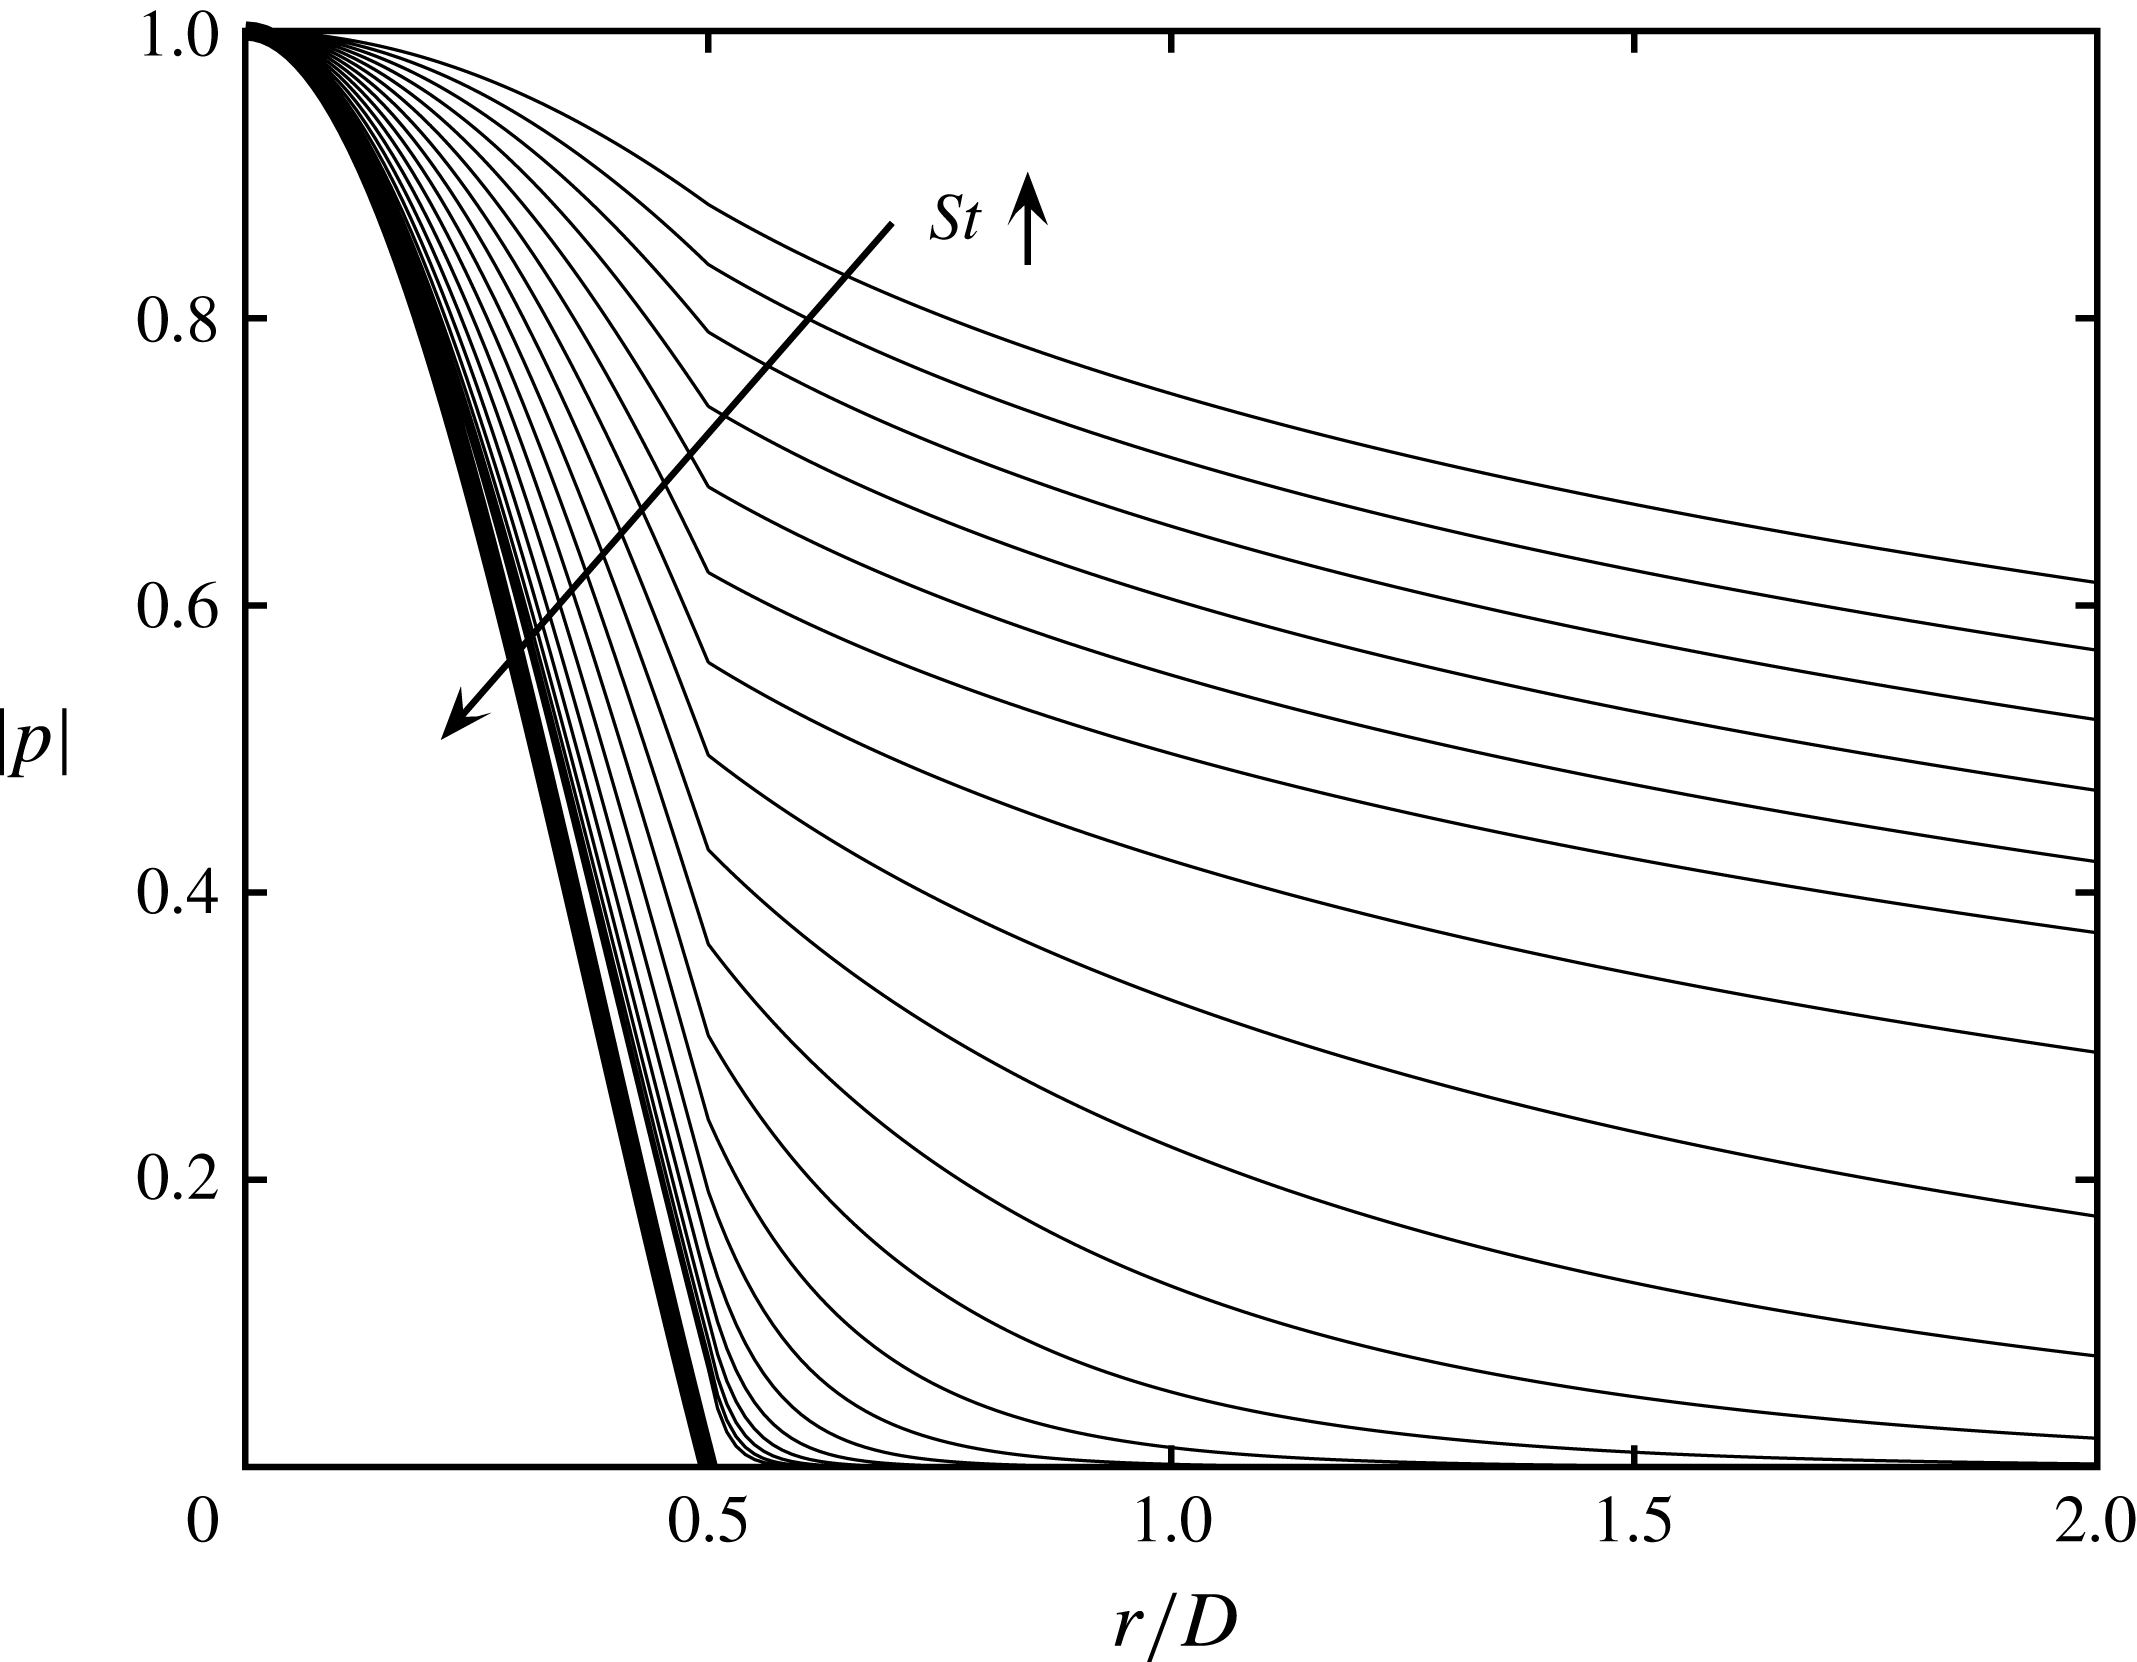
Figure 8. Thin lines: pressure eigenfunctions associated with
![]() $k_{TH}^{-}$
jet modes at
$k_{TH}^{-}$
jet modes at
![]() $M=0.6$
, in frequency range
$M=0.6$
, in frequency range
![]() $0.3\leqslant St\leqslant 1.1$
(top-most line:
$0.3\leqslant St\leqslant 1.1$
(top-most line:
![]() $St=0.3$
; bottom-most line:
$St=0.3$
; bottom-most line:
![]() $St=1.2$
). Thick line: soft-walled duct mode of radial order
$St=1.2$
). Thick line: soft-walled duct mode of radial order
![]() $1$
.
$1$
.
In the Mach number range
![]() $0.6\leqslant M\leqslant 0.82$
we explore the high-frequency cutoff using DR2 and DR1. The first illustrates a progressive trapping of the
$0.6\leqslant M\leqslant 0.82$
we explore the high-frequency cutoff using DR2 and DR1. The first illustrates a progressive trapping of the
![]() $k_{TH}^{-}$
wave by the jet with increasing frequency; once entirely trapped (duct-like) it is prevented from interacting with the nozzle lip. The second is used to show that, for frequencies at which the
$k_{TH}^{-}$
wave by the jet with increasing frequency; once entirely trapped (duct-like) it is prevented from interacting with the nozzle lip. The second is used to show that, for frequencies at which the
![]() $k_{TH}^{-}$
wave is truly duct-like (trapped), it cannot be reflected in the nozzle exit plane and is entirely transmitted into the nozzle. In the Mach number range,
$k_{TH}^{-}$
wave is truly duct-like (trapped), it cannot be reflected in the nozzle exit plane and is entirely transmitted into the nozzle. In the Mach number range,
![]() $0.82\leqslant M<1$
, on the other hand, the resonance cutoff condition is due simply to a cutting off of the
$0.82\leqslant M<1$
, on the other hand, the resonance cutoff condition is due simply to a cutting off of the
![]() $k_{p}^{-}$
waves: as discussed earlier, they are evanescent above a well-defined frequency. This can be seen in figure 5 by looking at the red lines, which only appear up to a given Strouhal number; beyond this value the waves become evanescent, which corresponds to the saddle point
$k_{p}^{-}$
waves: as discussed earlier, they are evanescent above a well-defined frequency. This can be seen in figure 5 by looking at the red lines, which only appear up to a given Strouhal number; beyond this value the waves become evanescent, which corresponds to the saddle point
![]() $S2$
discussed in Towne et al. (Reference Towne, Cavalieri, Jordan, Colonius, Schmidt, Jaunet and Brès2017). These three cases are discussed in more detail in the following sections.
$S2$
discussed in Towne et al. (Reference Towne, Cavalieri, Jordan, Colonius, Schmidt, Jaunet and Brès2017). These three cases are discussed in more detail in the following sections.
4.4.1 Trapped waves do not reach the nozzle lip
To understand the high-frequency cutoff in the range
![]() $0.6\leqslant M\leqslant 0.82$
we first consider the frequency dependence of the pressure eigenfunctions associated with the axisymmetric
$0.6\leqslant M\leqslant 0.82$
we first consider the frequency dependence of the pressure eigenfunctions associated with the axisymmetric
![]() $k_{TH}^{-}$
mode,
$k_{TH}^{-}$
mode,
where
![]() $\text{I}_{0}$
and
$\text{I}_{0}$
and
![]() $\text{K}_{0}$
are zeroth-order, modified Bessel functions of the first and second kind, respectively.
$\text{K}_{0}$
are zeroth-order, modified Bessel functions of the first and second kind, respectively.
The frequency dependence of the eigenfunctions is shown in figure 8 for
![]() $M=0.6$
. With increasing frequency these become progressively deformed/trapped. For frequencies greater than
$M=0.6$
. With increasing frequency these become progressively deformed/trapped. For frequencies greater than
![]() $St\approx 1$
, their radial support shows them to be almost entirely confined within the jet. As shown by Towne et al. (Reference Towne, Cavalieri, Jordan, Colonius, Schmidt, Jaunet and Brès2017), they here behave in the manner of waves propagating in a soft-walled duct, experiencing the shear layer as a pressure-release surface. This can be seen here in the similarity of the high-frequency, vortex-sheet eigenfunctions to those of soft-walled duct waves, which take the form of Bessel functions,
$St\approx 1$
, their radial support shows them to be almost entirely confined within the jet. As shown by Towne et al. (Reference Towne, Cavalieri, Jordan, Colonius, Schmidt, Jaunet and Brès2017), they here behave in the manner of waves propagating in a soft-walled duct, experiencing the shear layer as a pressure-release surface. This can be seen here in the similarity of the high-frequency, vortex-sheet eigenfunctions to those of soft-walled duct waves, which take the form of Bessel functions,
![]() $\text{J}_{o}(\unicode[STIX]{x1D6FC}_{j}r)$
. The implication for resonance is that at these high frequencies,
$\text{J}_{o}(\unicode[STIX]{x1D6FC}_{j}r)$
. The implication for resonance is that at these high frequencies,
![]() $k_{TH}^{-}$
waves impinging on the nozzle exit plane have negligible fluctuation levels in the radial vicinity of the nozzle lip, and are thus deprived of the possibility of being scattered into
$k_{TH}^{-}$
waves impinging on the nozzle exit plane have negligible fluctuation levels in the radial vicinity of the nozzle lip, and are thus deprived of the possibility of being scattered into
![]() $k^{+}$
waves. One of the possible reflection mechanisms necessary to sustain resonance is thereby disabled.
$k^{+}$
waves. One of the possible reflection mechanisms necessary to sustain resonance is thereby disabled.
4.4.2 Disabled nozzle-plane reflection in range $M\leqslant 0.82$
In addition to the scattering mechanism discussed in the previous section, the impedance mismatch in the nozzle exit plane may also contribute to the reflection of incident
![]() $k^{-}$
waves, particularly so as the
$k^{-}$
waves, particularly so as the
![]() $k_{TH}^{-}$
waves become more duct-like at these higher frequencies. We therefore consider the nozzle–jet system as a rigid-walled cylindrical duct connected to a soft-walled duct, the ensemble containing a plug flow of Mach number,
$k_{TH}^{-}$
waves become more duct-like at these higher frequencies. We therefore consider the nozzle–jet system as a rigid-walled cylindrical duct connected to a soft-walled duct, the ensemble containing a plug flow of Mach number,
![]() $M\leqslant 0.82$
. As discussed in appendix C, for the frequencies of interest, an incident
$M\leqslant 0.82$
. As discussed in appendix C, for the frequencies of interest, an incident
![]() $k_{TH}^{-}$
wave of amplitude
$k_{TH}^{-}$
wave of amplitude
![]() $I$
and radial order
$I$
and radial order
![]() $j=1$
is transmitted as a plane wave, and reflected as a
$j=1$
is transmitted as a plane wave, and reflected as a
![]() $k^{+}$
soft-walled duct mode of amplitude
$k^{+}$
soft-walled duct mode of amplitude
![]() $R$
and radial order
$R$
and radial order
![]() $j=1$
. The absolute value of the reflection coefficient,
$j=1$
. The absolute value of the reflection coefficient,
 $$\begin{eqnarray}\frac{R}{I}=\left(\frac{1-\displaystyle \frac{k_{j}^{+}M}{\unicode[STIX]{x1D714}}}{1-\displaystyle \frac{k_{j}^{-}M}{\unicode[STIX]{x1D714}}}\right)\left(\frac{k_{n}^{-}-k_{j}^{-}}{k_{j}^{+}-k_{n}^{-}}\right),\end{eqnarray}$$
derived in the appendix, is shown in figure 9 as a function of Mach and Strouhal numbers.
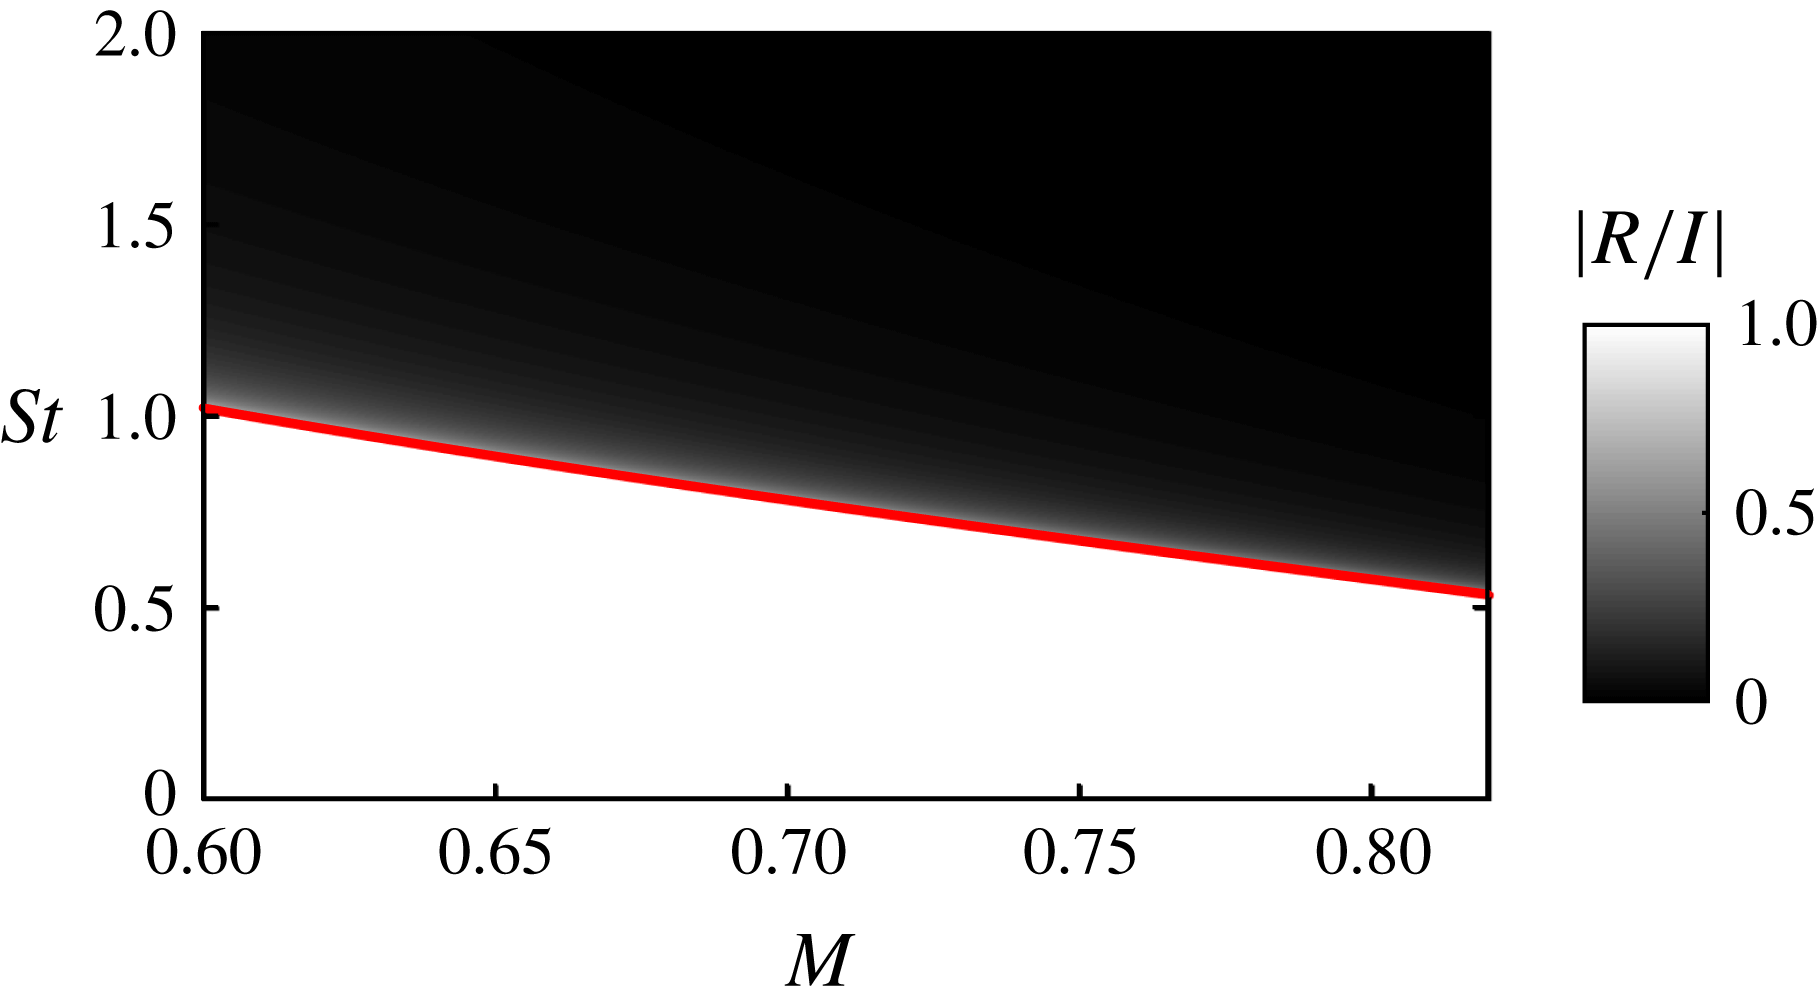
Figure 9. Reflection coefficient,
![]() $|R/I|$
, for a
$|R/I|$
, for a
![]() $k^{-}$
, soft-walled duct mode impinging on nozzle plane. The red line shows the cut-on frequency. At frequencies below this line, the incident wave is evanescent; above it is propagative, but has zero reflection coefficient: it is entirely transmitted into the nozzle as a rigid-walled duct
$k^{-}$
, soft-walled duct mode impinging on nozzle plane. The red line shows the cut-on frequency. At frequencies below this line, the incident wave is evanescent; above it is propagative, but has zero reflection coefficient: it is entirely transmitted into the nozzle as a rigid-walled duct
![]() $k^{-}$
plane wave.
$k^{-}$
plane wave.
Note that the red line corresponds to the cut-on condition for soft-walled duct modes: for frequencies below this line such modes are evanescent. But as we have already seen, the soft-walled duct is not a good model for
![]() $k^{-}$
jet modes in the low-frequency range; these are propagative in the vortex-sheet model, and have significant radial support across the shear layer. Above the soft-walled duct cut-on frequency, on the other hand, where the
$k^{-}$
jet modes in the low-frequency range; these are propagative in the vortex-sheet model, and have significant radial support across the shear layer. Above the soft-walled duct cut-on frequency, on the other hand, where the
![]() $k_{TH}^{-}$
jet modes have become trapped, as the eigenfunctions in figure 8 show, the soft-walled duct is a good approximation for the dynamics of these waves. We are therefore only interested in the reflection coefficient of (4.12) above this cut-on frequency, where, as shown in figure 9,
$k_{TH}^{-}$
jet modes have become trapped, as the eigenfunctions in figure 8 show, the soft-walled duct is a good approximation for the dynamics of these waves. We are therefore only interested in the reflection coefficient of (4.12) above this cut-on frequency, where, as shown in figure 9,
![]() $|R/I|\approx 0$
.
$|R/I|\approx 0$
.
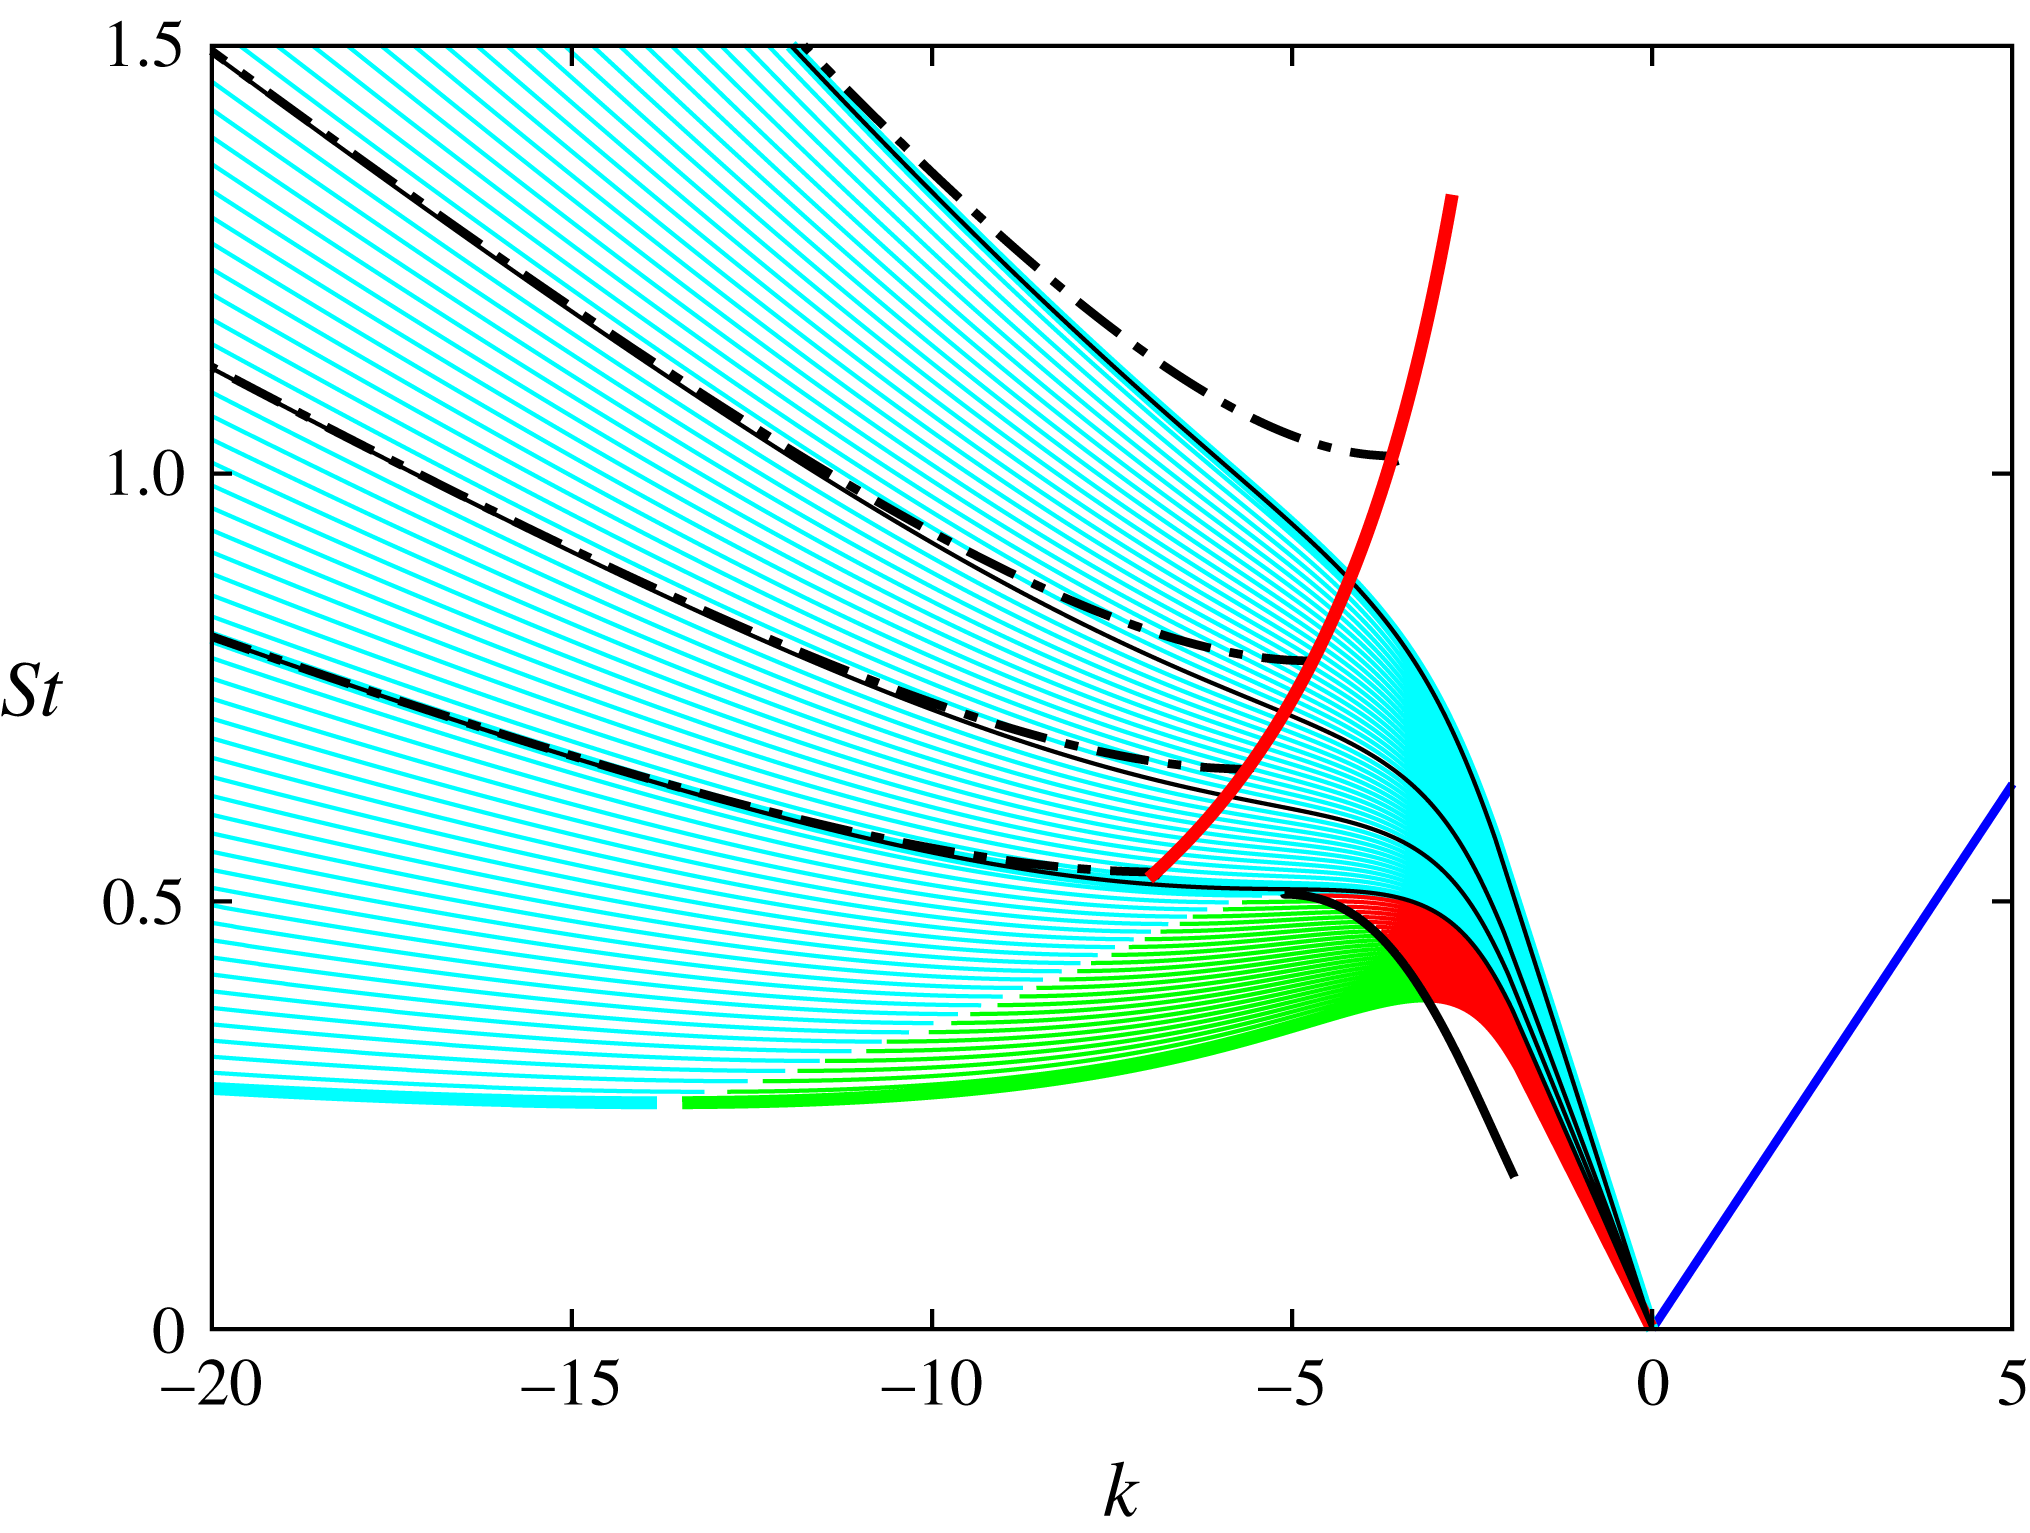
Figure 10. Truncation of dispersion relations: (i) to account for trapping of
![]() $k_{TH}^{-}$
waves, which occurs above the thick solid red line, the cut-on condition for soft-walled duct modes; and (ii) to account for saddle-point cutoff of
$k_{TH}^{-}$
waves, which occurs above the thick solid red line, the cut-on condition for soft-walled duct modes; and (ii) to account for saddle-point cutoff of
![]() $k_{p}^{-}$
waves, indicated by the thick black line. Final tone-frequency predictions, shown in figure 13, are made using eigenvalues to the right of the thick red and black lines. The dash-dotted black lines show dispersion relations for a soft-walled duct for four Mach numbers (
$k_{p}^{-}$
waves, indicated by the thick black line. Final tone-frequency predictions, shown in figure 13, are made using eigenvalues to the right of the thick red and black lines. The dash-dotted black lines show dispersion relations for a soft-walled duct for four Mach numbers (
![]() $M=0.6$
,
$M=0.6$
,
![]() $0.7$
,
$0.7$
,
![]() $0.75$
and
$0.75$
and
![]() $0.82$
), allowing comparison with the vortex-sheet dispersion relations.
$0.82$
), allowing comparison with the vortex-sheet dispersion relations.
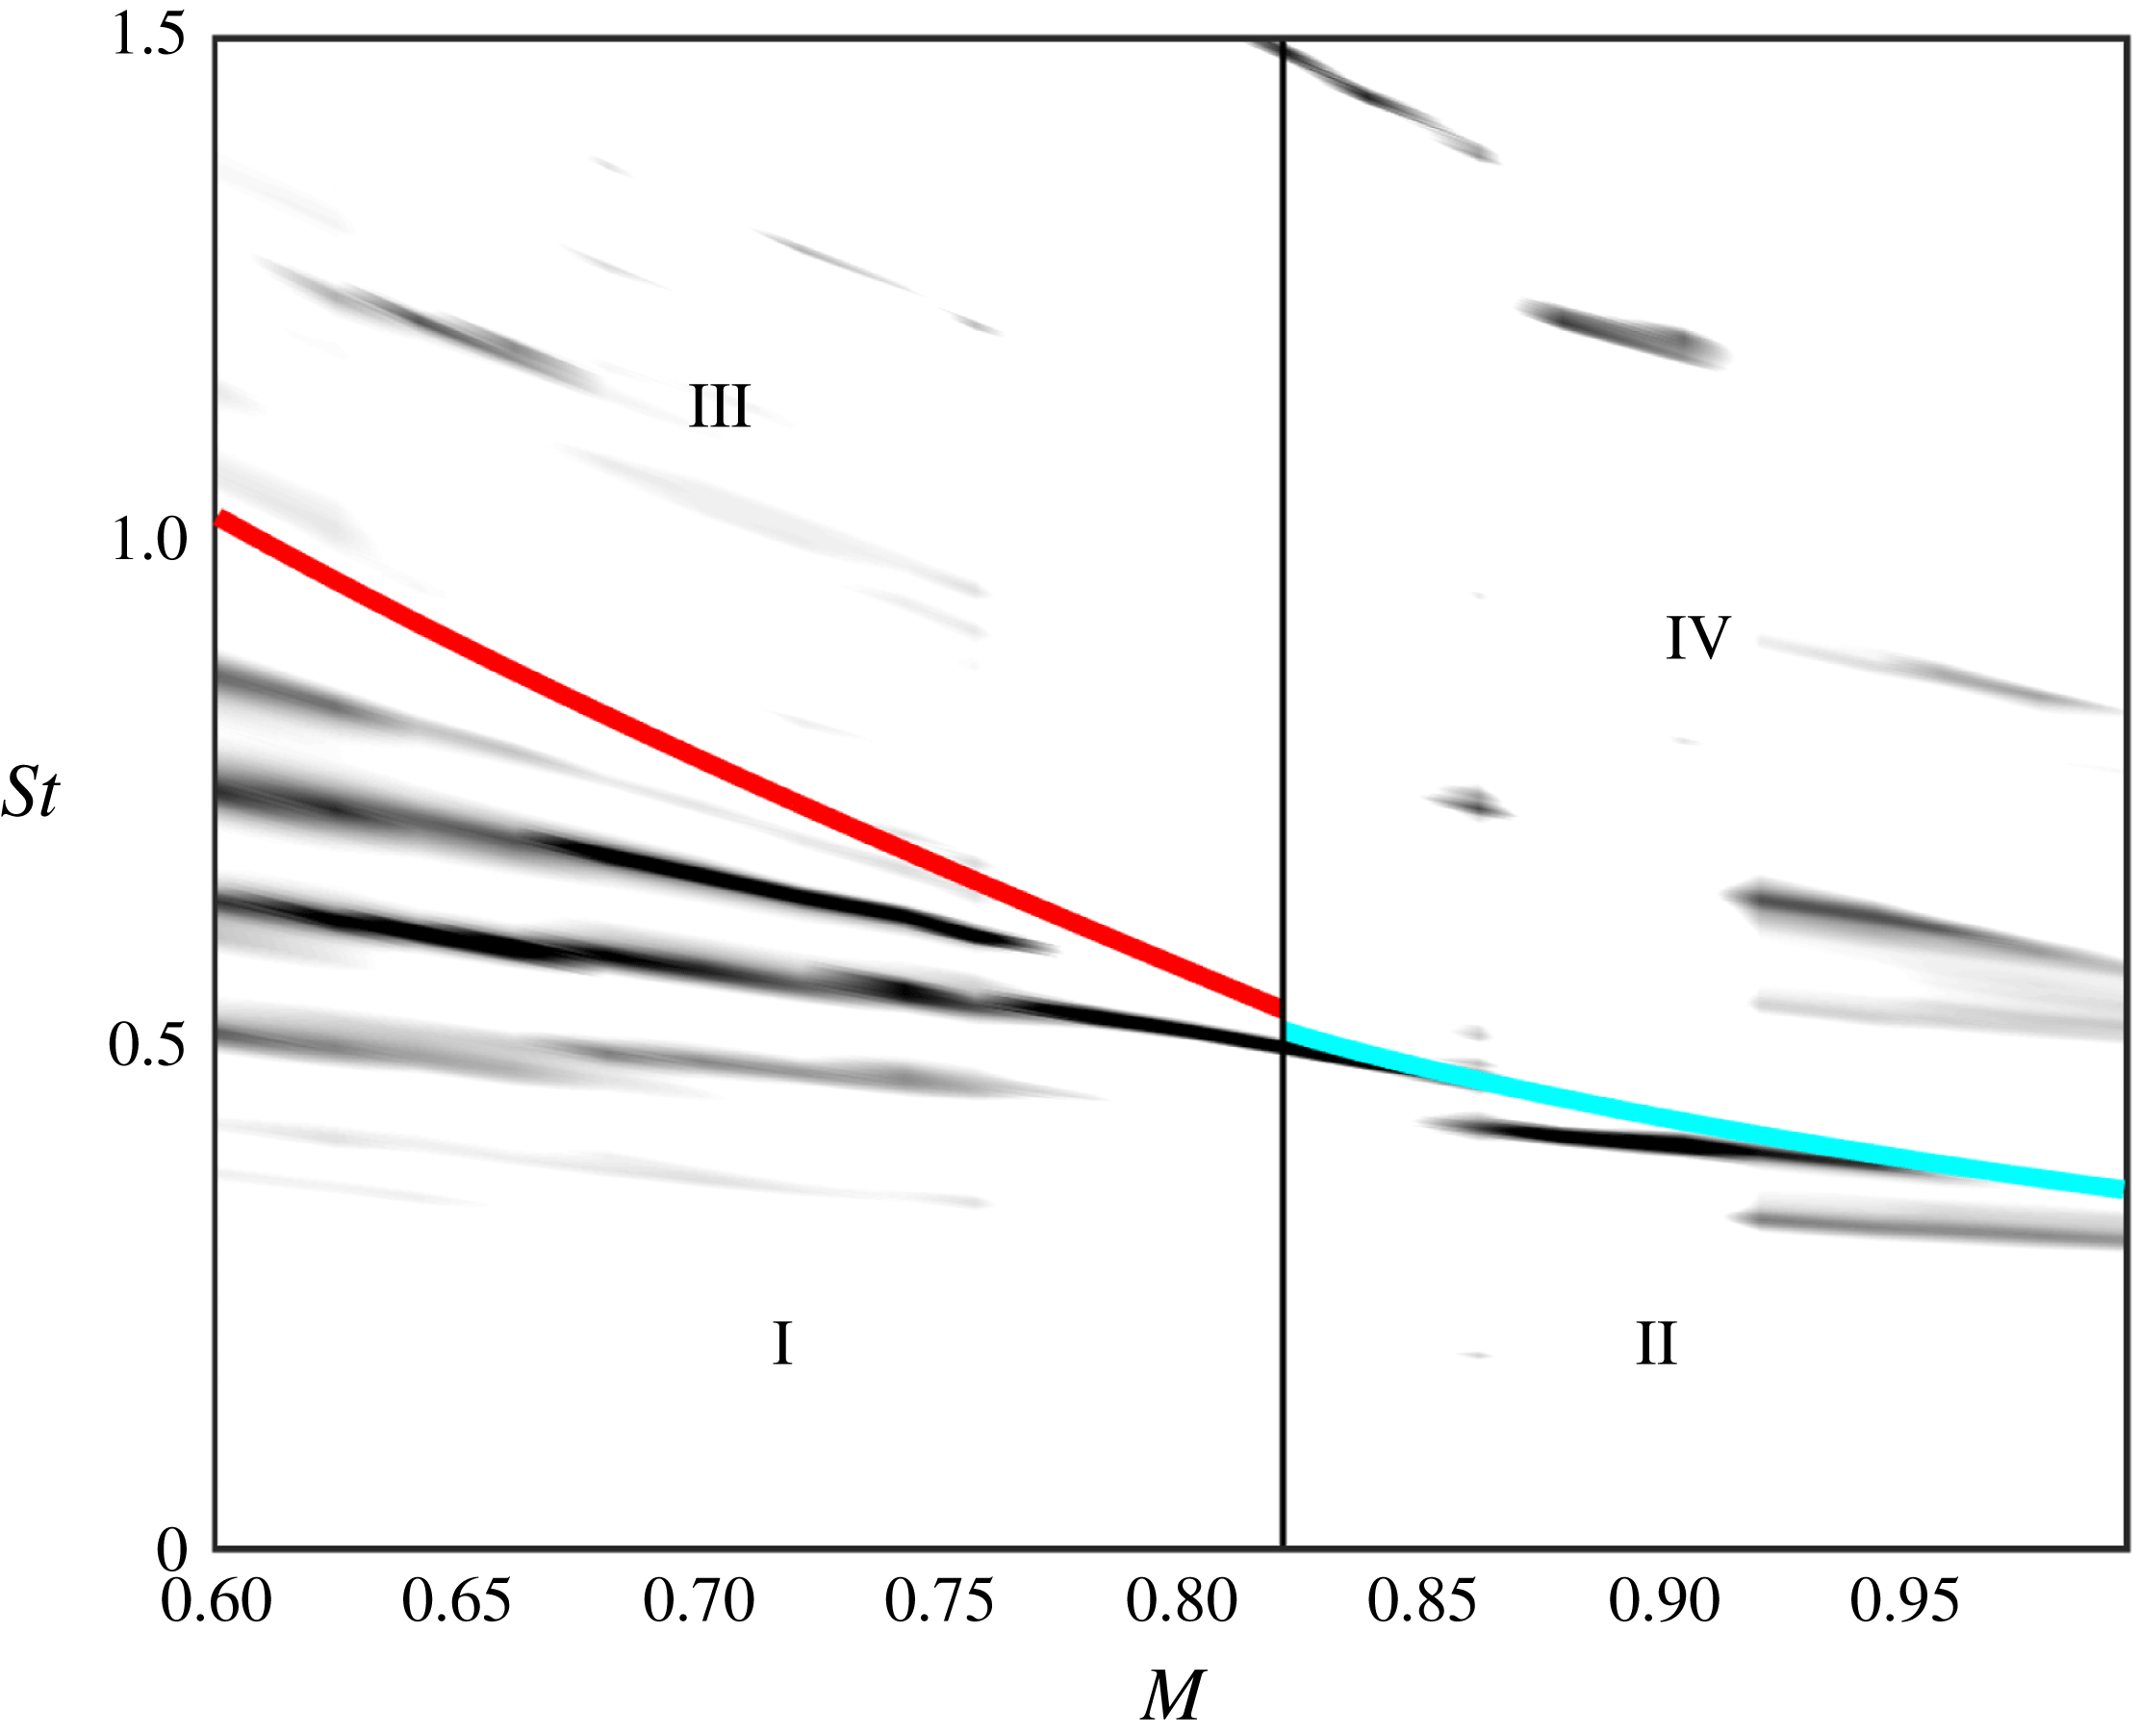
Figure 11. Partitioning of
![]() $St-M$
space in terms of
$St-M$
space in terms of
![]() $k^{-}$
mode behaviours.
$k^{-}$
mode behaviours.
![]() $L=3D$
data used for illustration purposes. Thick red and cyan lines correspond to the two cutoff criteria shown in figure 10 (there shown, respectively, in thick red and black). Zone I:
$L=3D$
data used for illustration purposes. Thick red and cyan lines correspond to the two cutoff criteria shown in figure 10 (there shown, respectively, in thick red and black). Zone I:
![]() $k_{TH}^{-}$
modes exist and are propagative; Zone II:
$k_{TH}^{-}$
modes exist and are propagative; Zone II:
![]() $k_{p}^{-}$
modes exist and are propagative; Zone III:
$k_{p}^{-}$
modes exist and are propagative; Zone III:
![]() $k_{TH}^{-}$
modes exist, are propagative, but trapped (cf. figure 8), such that they do not reach the nozzle lip, and with zero reflection coefficient in the nozzle plane (cf. figure 9); Zone IV:
$k_{TH}^{-}$
modes exist, are propagative, but trapped (cf. figure 8), such that they do not reach the nozzle lip, and with zero reflection coefficient in the nozzle plane (cf. figure 9); Zone IV:
![]() $k_{p}^{-}$
modes exist but are evanescent.
$k_{p}^{-}$
modes exist but are evanescent.
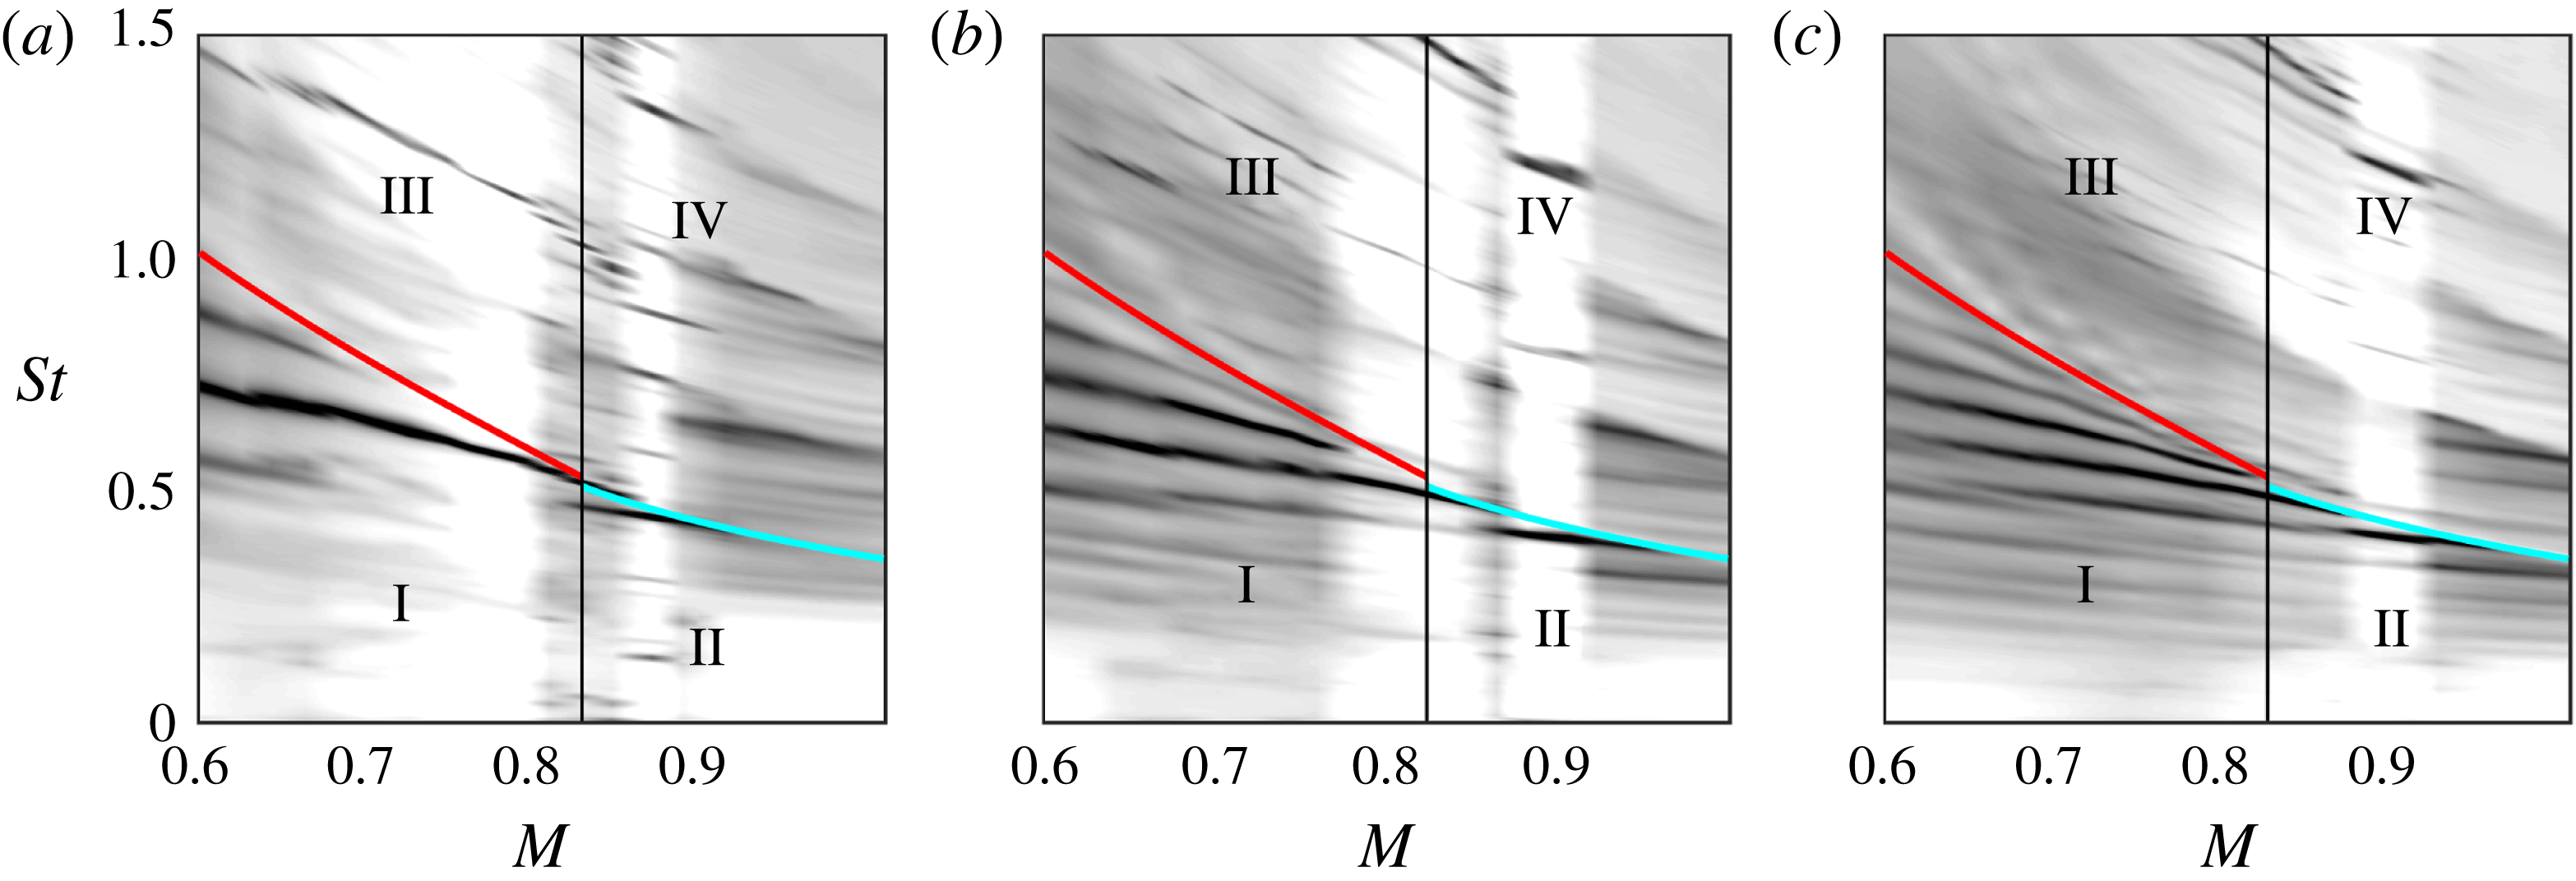
Figure 12. Comparison of hypothesised resonance cutoff with data. (a), (b) and (c), respectively,
![]() $L=2D$
,
$L=2D$
,
![]() $3D$
and
$3D$
and
![]() $4D$
. See legend of figure 11 for more details.
$4D$
. See legend of figure 11 for more details.
The
![]() $k_{TH}^{-}$
waves above this frequency impinging on the nozzle exit plane are thus not reflected in the nozzle plane, they are entirely transmitted into the nozzle where they propagate as plane waves. This result, combined with that of the previous section that shows how trapping of the
$k_{TH}^{-}$
waves above this frequency impinging on the nozzle exit plane are thus not reflected in the nozzle plane, they are entirely transmitted into the nozzle where they propagate as plane waves. This result, combined with that of the previous section that shows how trapping of the
![]() $k_{TH}^{-}$
waves leads to the absence of significant fluctuation levels in the vicinity of the nozzle lip, demonstrates how, for
$k_{TH}^{-}$
waves leads to the absence of significant fluctuation levels in the vicinity of the nozzle lip, demonstrates how, for
![]() $M\leqslant 0.82$
, upstream reflection conditions are disabled above the soft-walled duct cut-on frequency.
$M\leqslant 0.82$
, upstream reflection conditions are disabled above the soft-walled duct cut-on frequency.
This frequency is superposed on the vortex-sheet dispersion relations in figure 10 (solid red line), demarcating regions where the DR2 (coloured lines) and DR1 (black dash-dotted line, shown for four Mach numbers) become similar (above the red line) and where they are not (below). In the region above this line the
![]() $k_{TH}^{-}$
vortex-sheet modes behave essentially as propagative soft-walled duct modes, trapped such that they avoid the nozzle lip, and transmitted into the nozzle with zero reflection. Resonance will thus be disabled for frequencies above this line, which is superposed on the data in figures 11 and 12 and found to agree well with the observed resonance cutoff.
$k_{TH}^{-}$
vortex-sheet modes behave essentially as propagative soft-walled duct modes, trapped such that they avoid the nozzle lip, and transmitted into the nozzle with zero reflection. Resonance will thus be disabled for frequencies above this line, which is superposed on the data in figures 11 and 12 and found to agree well with the observed resonance cutoff.
4.4.3 Saddle-point cutoff of $k_{p}^{-}$
modes in range $0.82<M<1$
To complete the picture we consider the resonance cutoff condition in the Mach number range
![]() $0.82<M<1$
, where the
$0.82<M<1$
, where the
![]() $k_{p}^{-}$
modes, which never behave like soft-walled duct modes, are those that underpin resonance. This is straightforward: as shown by the solid black line in figure 10 these modes become evanescent above a certain Strouhal number. The cutoff Strouhal number is plotted on the data in figure 12 as a thick cyan line, where we see that it corresponds well with the observed resonance cutoff in this Mach number range.
$k_{p}^{-}$
modes, which never behave like soft-walled duct modes, are those that underpin resonance. This is straightforward: as shown by the solid black line in figure 10 these modes become evanescent above a certain Strouhal number. The cutoff Strouhal number is plotted on the data in figure 12 as a thick cyan line, where we see that it corresponds well with the observed resonance cutoff in this Mach number range.
4.5 Refined tone-frequency prediction
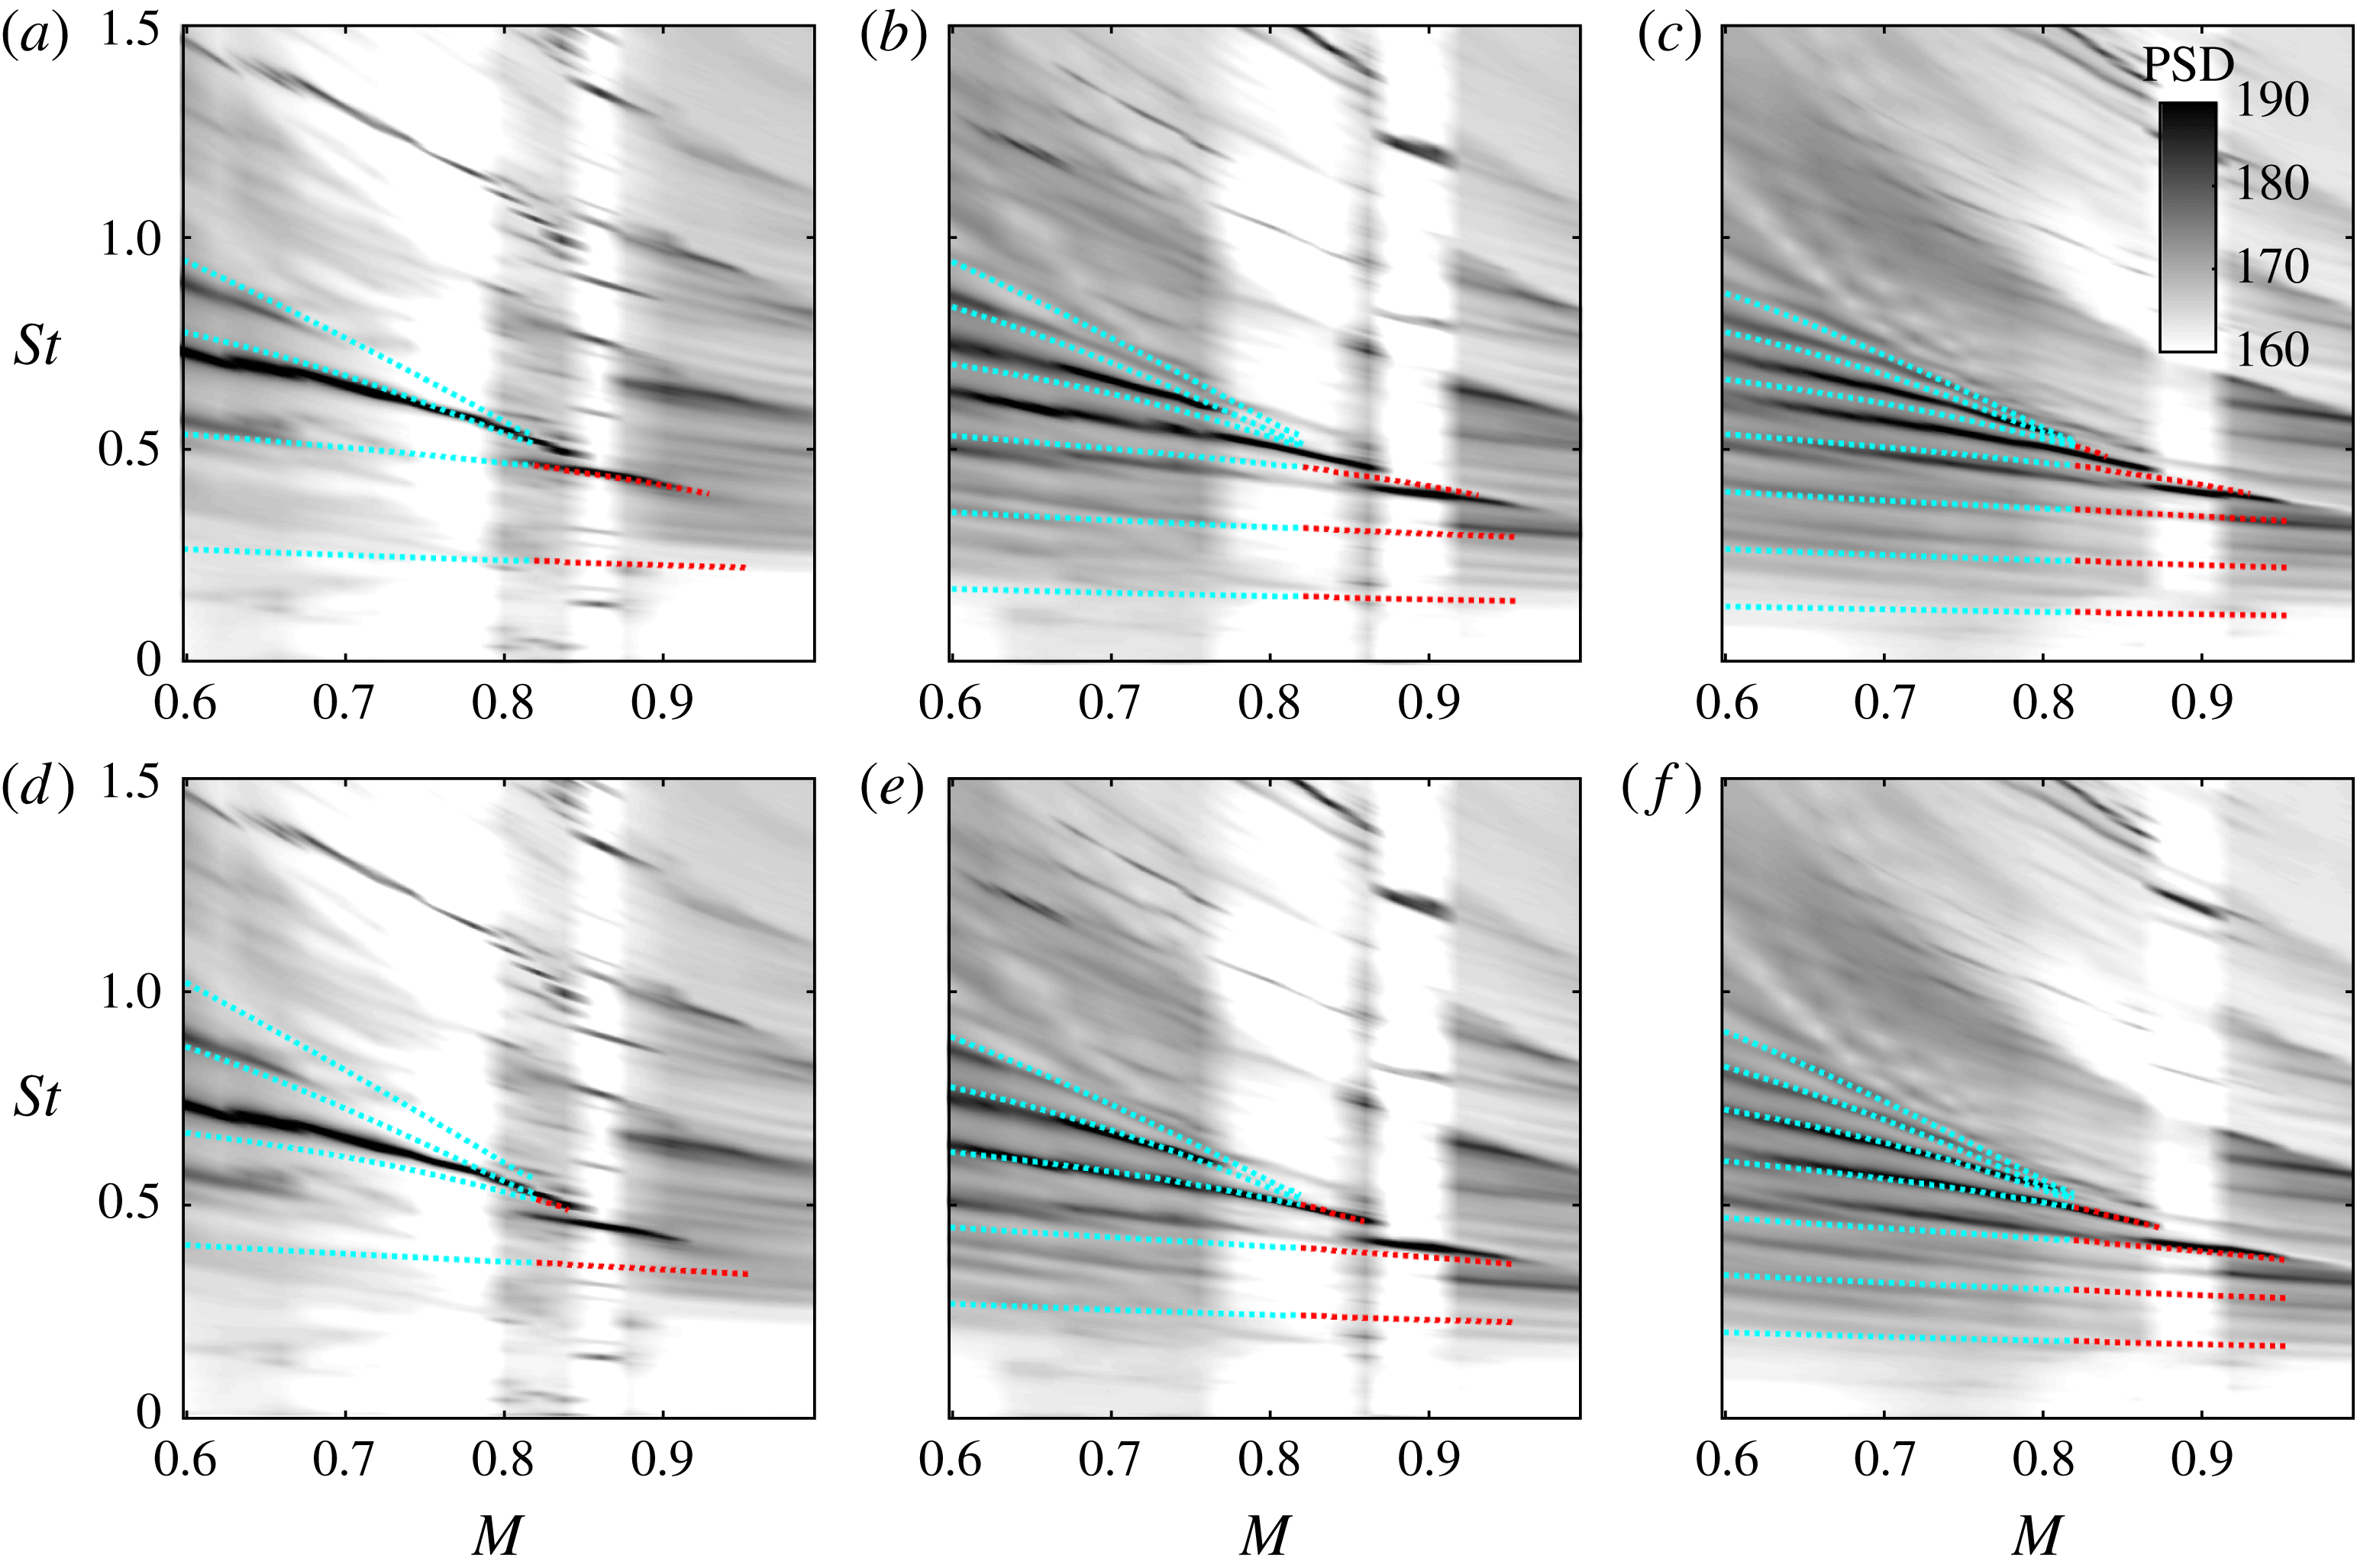
Figure 13. Refined tone-frequency predictions using vortex-sheet dispersion relations; assuming resonance between Kelvin–Helmholtz
![]() $k^{+}$
and
$k^{+}$
and
![]() $k^{-}$
jet modes, under out-of-phase reflection (a–c) and in-phase reflection (d–f) conditions; and assuming high-frequency cutoff due to trapped, non-reflecting
$k^{-}$
jet modes, under out-of-phase reflection (a–c) and in-phase reflection (d–f) conditions; and assuming high-frequency cutoff due to trapped, non-reflecting
![]() $k_{TH}^{-}$
jet modes in the range
$k_{TH}^{-}$
jet modes in the range
![]() $0.6\leqslant M\leqslant 0.82$
, and due to cutoff of
$0.6\leqslant M\leqslant 0.82$
, and due to cutoff of
![]() $k_{p}^{-}$
jet modes in the range
$k_{p}^{-}$
jet modes in the range
![]() $0.82<M\leqslant 1$
. From left to right:
$0.82<M\leqslant 1$
. From left to right:
![]() $L/D=2$
,
$L/D=2$
,
![]() $3$
and
$3$
and
![]() $4$
.
$4$
.
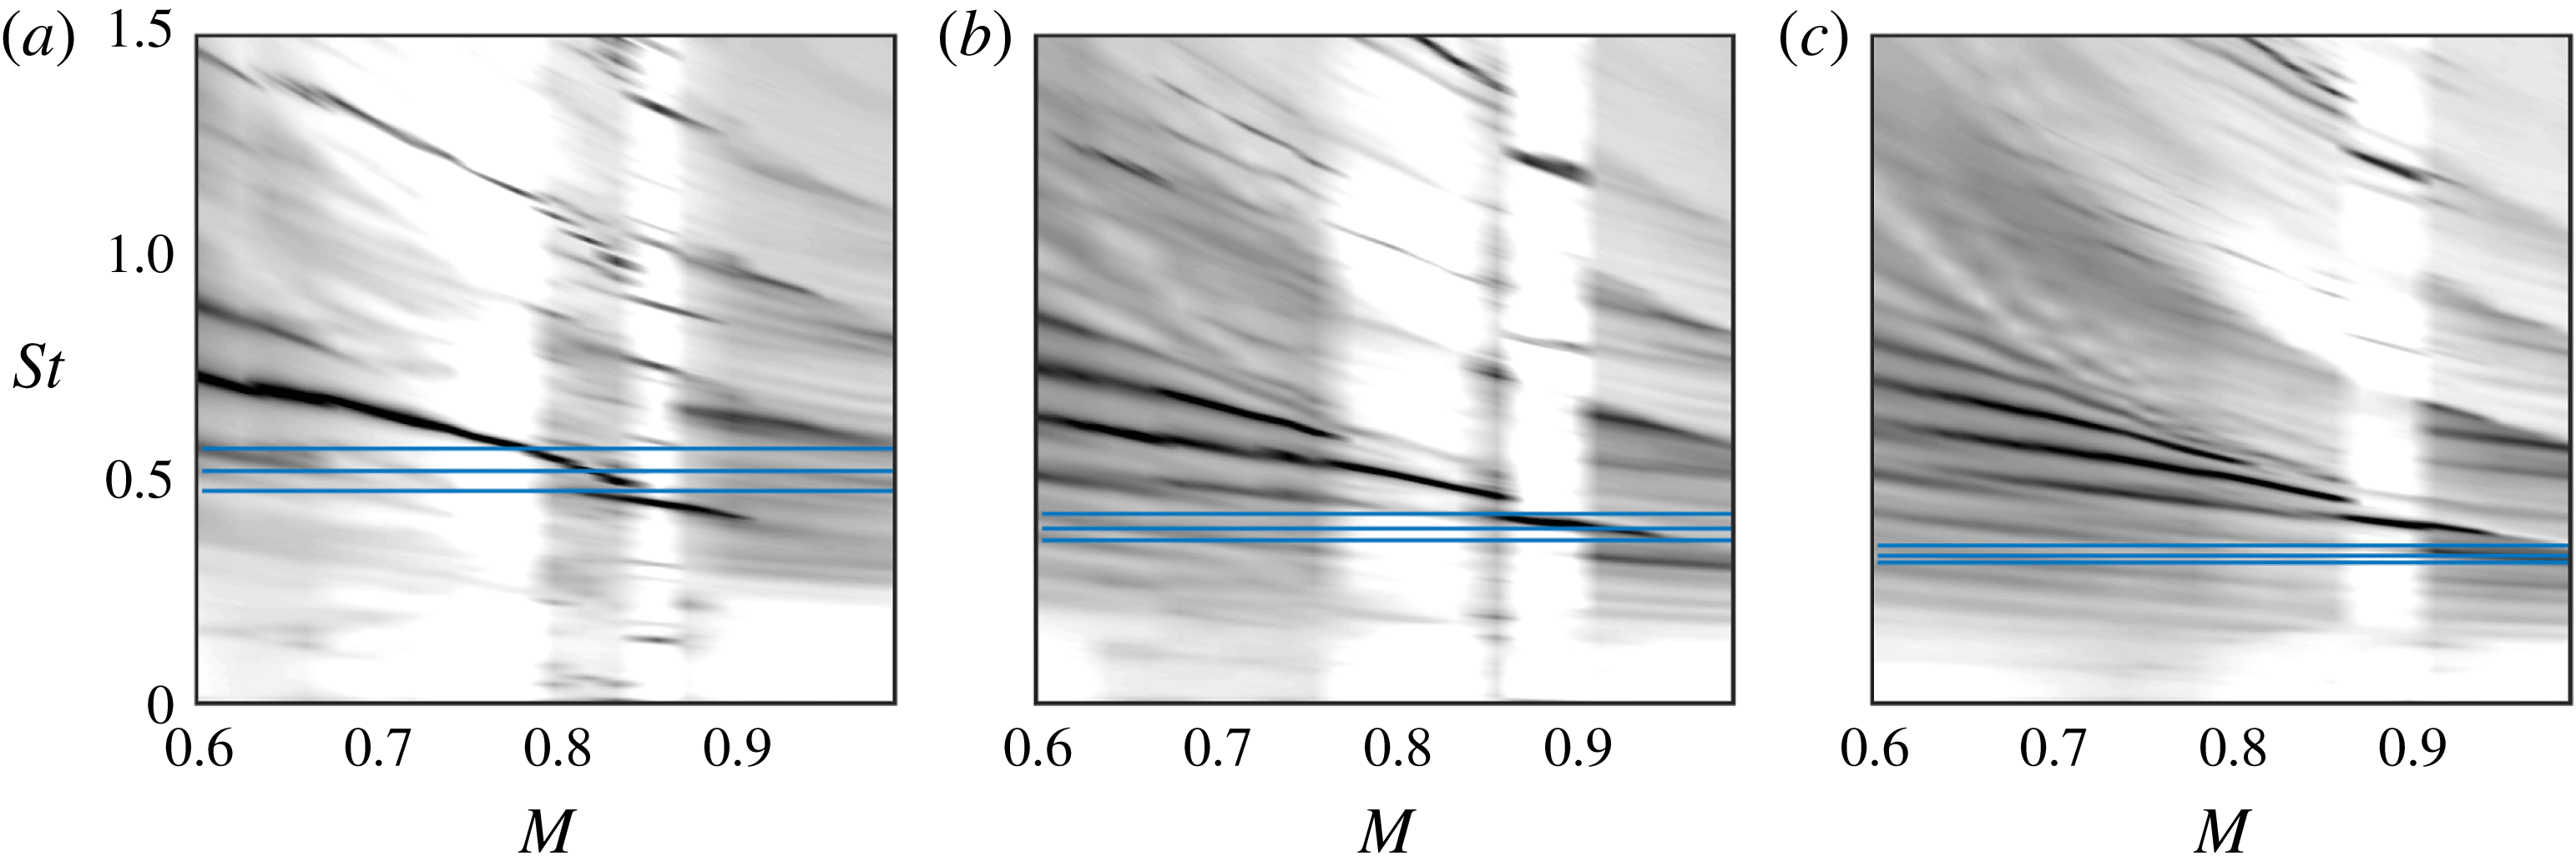
Figure 14. Low-frequency resonance cutoff, shown by horizontal blue lines, from (a) to (c)
![]() $|R_{1}R_{2}|=0.002$
,
$|R_{1}R_{2}|=0.002$
,
![]() $0.004$
and
$0.004$
and
![]() $0.008$
.
$0.008$
.
Tone-frequency predictions can now be made using the vortex-sheet dispersion relation, truncated such that only eigenvalues to the right of the solid red and black lines in figure 10 are used. The refined tone predictions are shown in figure 13.
Recall that throughout we have been exclusively modelling axisymmetric waves of radial order 1, which are responsible for the lowest-frequency band of peaks. The higher-frequency bands, which are generally clearest for
![]() $M>0.9$
, are due to higher radial and azimuthal wave orders (Schmidt et al.
Reference Schmidt, Towne, Colonius, Cavalieri, Jordan and Brès2017). We do not attempt to model these here because they do not show up with sufficient clarity in the single-point microphone measurements we consider.
$M>0.9$
, are due to higher radial and azimuthal wave orders (Schmidt et al.
Reference Schmidt, Towne, Colonius, Cavalieri, Jordan and Brès2017). We do not attempt to model these here because they do not show up with sufficient clarity in the single-point microphone measurements we consider.
In comparison to the predictions provided using the classical edge-tone scenario (figure 2), those shown in figure 13 can be considered satisfactory in the
![]() $St-M$
range where strong resonance is observed, especially given the crudeness of the end-condition modelling. But there remain discrepancies at low frequency, where a match is not clear between model and data. This is considered in what follows.
$St-M$
range where strong resonance is observed, especially given the crudeness of the end-condition modelling. But there remain discrepancies at low frequency, where a match is not clear between model and data. This is considered in what follows.
4.6 Why are tones not observed at low frequency?
As mentioned in § 4.3, a more complete resonance analysis can be performed by considering both wavenumber and frequency to be complex-valued variables. Resonance conditions then involve, in addition to that imposed by the vortex-sheet dispersion relation, phase and magnitude constraints, respectively, equations (4.7) and (4.6). The complex analysis involves finding triplets
![]() $[k^{+},k^{-},\unicode[STIX]{x1D714}]\in \mathbb{C}$
that simultaneously solve (4.7), (4.6) and (4.3). The result is a deformation of the
$[k^{+},k^{-},\unicode[STIX]{x1D714}]\in \mathbb{C}$
that simultaneously solve (4.7), (4.6) and (4.3). The result is a deformation of the
![]() $k^{+}(\unicode[STIX]{x1D714})$
and
$k^{+}(\unicode[STIX]{x1D714})$
and
![]() $k^{-}(\unicode[STIX]{x1D714})$
branches with respect to the neutral-mode model (cf. figures 18 and 21). The deformation is largely determined by (4.6), leading to associated modified values of
$k^{-}(\unicode[STIX]{x1D714})$
branches with respect to the neutral-mode model (cf. figures 18 and 21). The deformation is largely determined by (4.6), leading to associated modified values of
![]() $\unicode[STIX]{x0394}k_{r}(St)$
, whence modified values of the resonance frequency given by (4.7). Resonance-frequency predictions using this model are, as shown in appendix D, fragile due to the appearance of the unknown function
$\unicode[STIX]{x0394}k_{r}(St)$
, whence modified values of the resonance frequency given by (4.7). Resonance-frequency predictions using this model are, as shown in appendix D, fragile due to the appearance of the unknown function
![]() $|R_{1}R_{2}|$
, that we must, in our ignorance of its true form, treat as a parameter, independent of Mach number, frequency and edge position.
$|R_{1}R_{2}|$
, that we must, in our ignorance of its true form, treat as a parameter, independent of Mach number, frequency and edge position.
But the complex analysis also provides a threshold frequency,
![]() $\unicode[STIX]{x1D714}_{r}|_{\unicode[STIX]{x1D714}_{i}=0}$
, below which resonance is damped. This threshold also depends on
$\unicode[STIX]{x1D714}_{r}|_{\unicode[STIX]{x1D714}_{i}=0}$
, below which resonance is damped. This threshold also depends on
![]() $R_{1}R_{2}$
, and so we cannot be entirely satisfied with the accuracy of its prediction. However, as shown by figure 14 we see that it does roughly provide an upper bound for the low-frequency region of the PSD maps where tones are not observed. It appears reasonable then to consider that the absence of tones at low-frequency is explained by the complex-wave model. Whether or not resonance is sustained depends on the spatial growth and decay rates of the
$R_{1}R_{2}$
, and so we cannot be entirely satisfied with the accuracy of its prediction. However, as shown by figure 14 we see that it does roughly provide an upper bound for the low-frequency region of the PSD maps where tones are not observed. It appears reasonable then to consider that the absence of tones at low-frequency is explained by the complex-wave model. Whether or not resonance is sustained depends on the spatial growth and decay rates of the
![]() $k^{+}$
and
$k^{+}$
and
![]() $k^{-}$
waves, over the distance
$k^{-}$
waves, over the distance
![]() $L$
, and on how effectively the waves are reflected at the boundaries (i.e. the value of
$L$
, and on how effectively the waves are reflected at the boundaries (i.e. the value of
![]() $|R_{1}R_{2}|$
).
$|R_{1}R_{2}|$
).
Figure 14 suggests that the values of
![]() $|R_{1}R_{2}|$
considered are reasonable for the
$|R_{1}R_{2}|$
considered are reasonable for the
![]() $L=4$
plate position, but should be larger for
$L=4$
plate position, but should be larger for
![]() $L=2$
and
$L=2$
and
![]() $L=3$
. This is indicative of a change in the interaction between
$L=3$
. This is indicative of a change in the interaction between
![]() $k^{+}$
waves and the plate edge as the streamwise position of the latter is varied. As is the case where the Mach number and frequency dependence of
$k^{+}$
waves and the plate edge as the streamwise position of the latter is varied. As is the case where the Mach number and frequency dependence of
![]() $R_{1}R_{2}$
is concerned, further work will be necessary to better understand this behaviour.
$R_{1}R_{2}$
is concerned, further work will be necessary to better understand this behaviour.
5 Conclusion
Experiments have been performed involving an isothermal, round, turbulent jet that grazes a sharp edge whose streamwise position is varied. This leads to rich tonal dynamics and sound that cannot be explained by appealing to the usual edge-tone scenario. The observed behaviour has been analysed by the combined use of two locally parallel linear models. Vortex-sheet dispersion relations provide phase-speed information sufficient to show that the strongest peaks are underpinned by resonance between downstream-travelling Kelvin–Helmholtz wavepackets and two kinds of upstream-travelling trapped acoustic modes: those considered by Tam & Hu (Reference Tam and Hu1989) and those of Towne et al. (Reference Towne, Cavalieri, Jordan, Colonius, Schmidt, Jaunet and Brès2017) and Schmidt et al. (Reference Schmidt, Towne, Colonius, Cavalieri, Jordan and Brès2017). This model also explains a high-frequency resonance cutoff that occurs in the range,
![]() $0.82<M<1$
. Resonance cutoff in the range
$0.82<M<1$
. Resonance cutoff in the range
![]() $M\leqslant 0.82$
, on the other hand, requires consideration of two further effects. On one hand the upstream-travelling waves are shown to become progressively trapped with increasing frequency, leading to the disabling of their scattering by the nozzle lip. A soft-walled duct model is then used to show that the upstream-travelling waves, once trapped, are no longer reflected in the nozzle exit plane.
$M\leqslant 0.82$
, on the other hand, requires consideration of two further effects. On one hand the upstream-travelling waves are shown to become progressively trapped with increasing frequency, leading to the disabling of their scattering by the nozzle lip. A soft-walled duct model is then used to show that the upstream-travelling waves, once trapped, are no longer reflected in the nozzle exit plane.
Acknowledgements
Much of the analysis was performed by P.J. at Emmanuel College, Cambridge, during his stay there as 2017 Derek Brewer Fellow. He wishes to express his gratitude to the Fellows and staff of the college for their support and hospitality. We are also indebted to a reviewer who suggested the complex analysis and provided helpful guidance. May he or she live long and prosper.
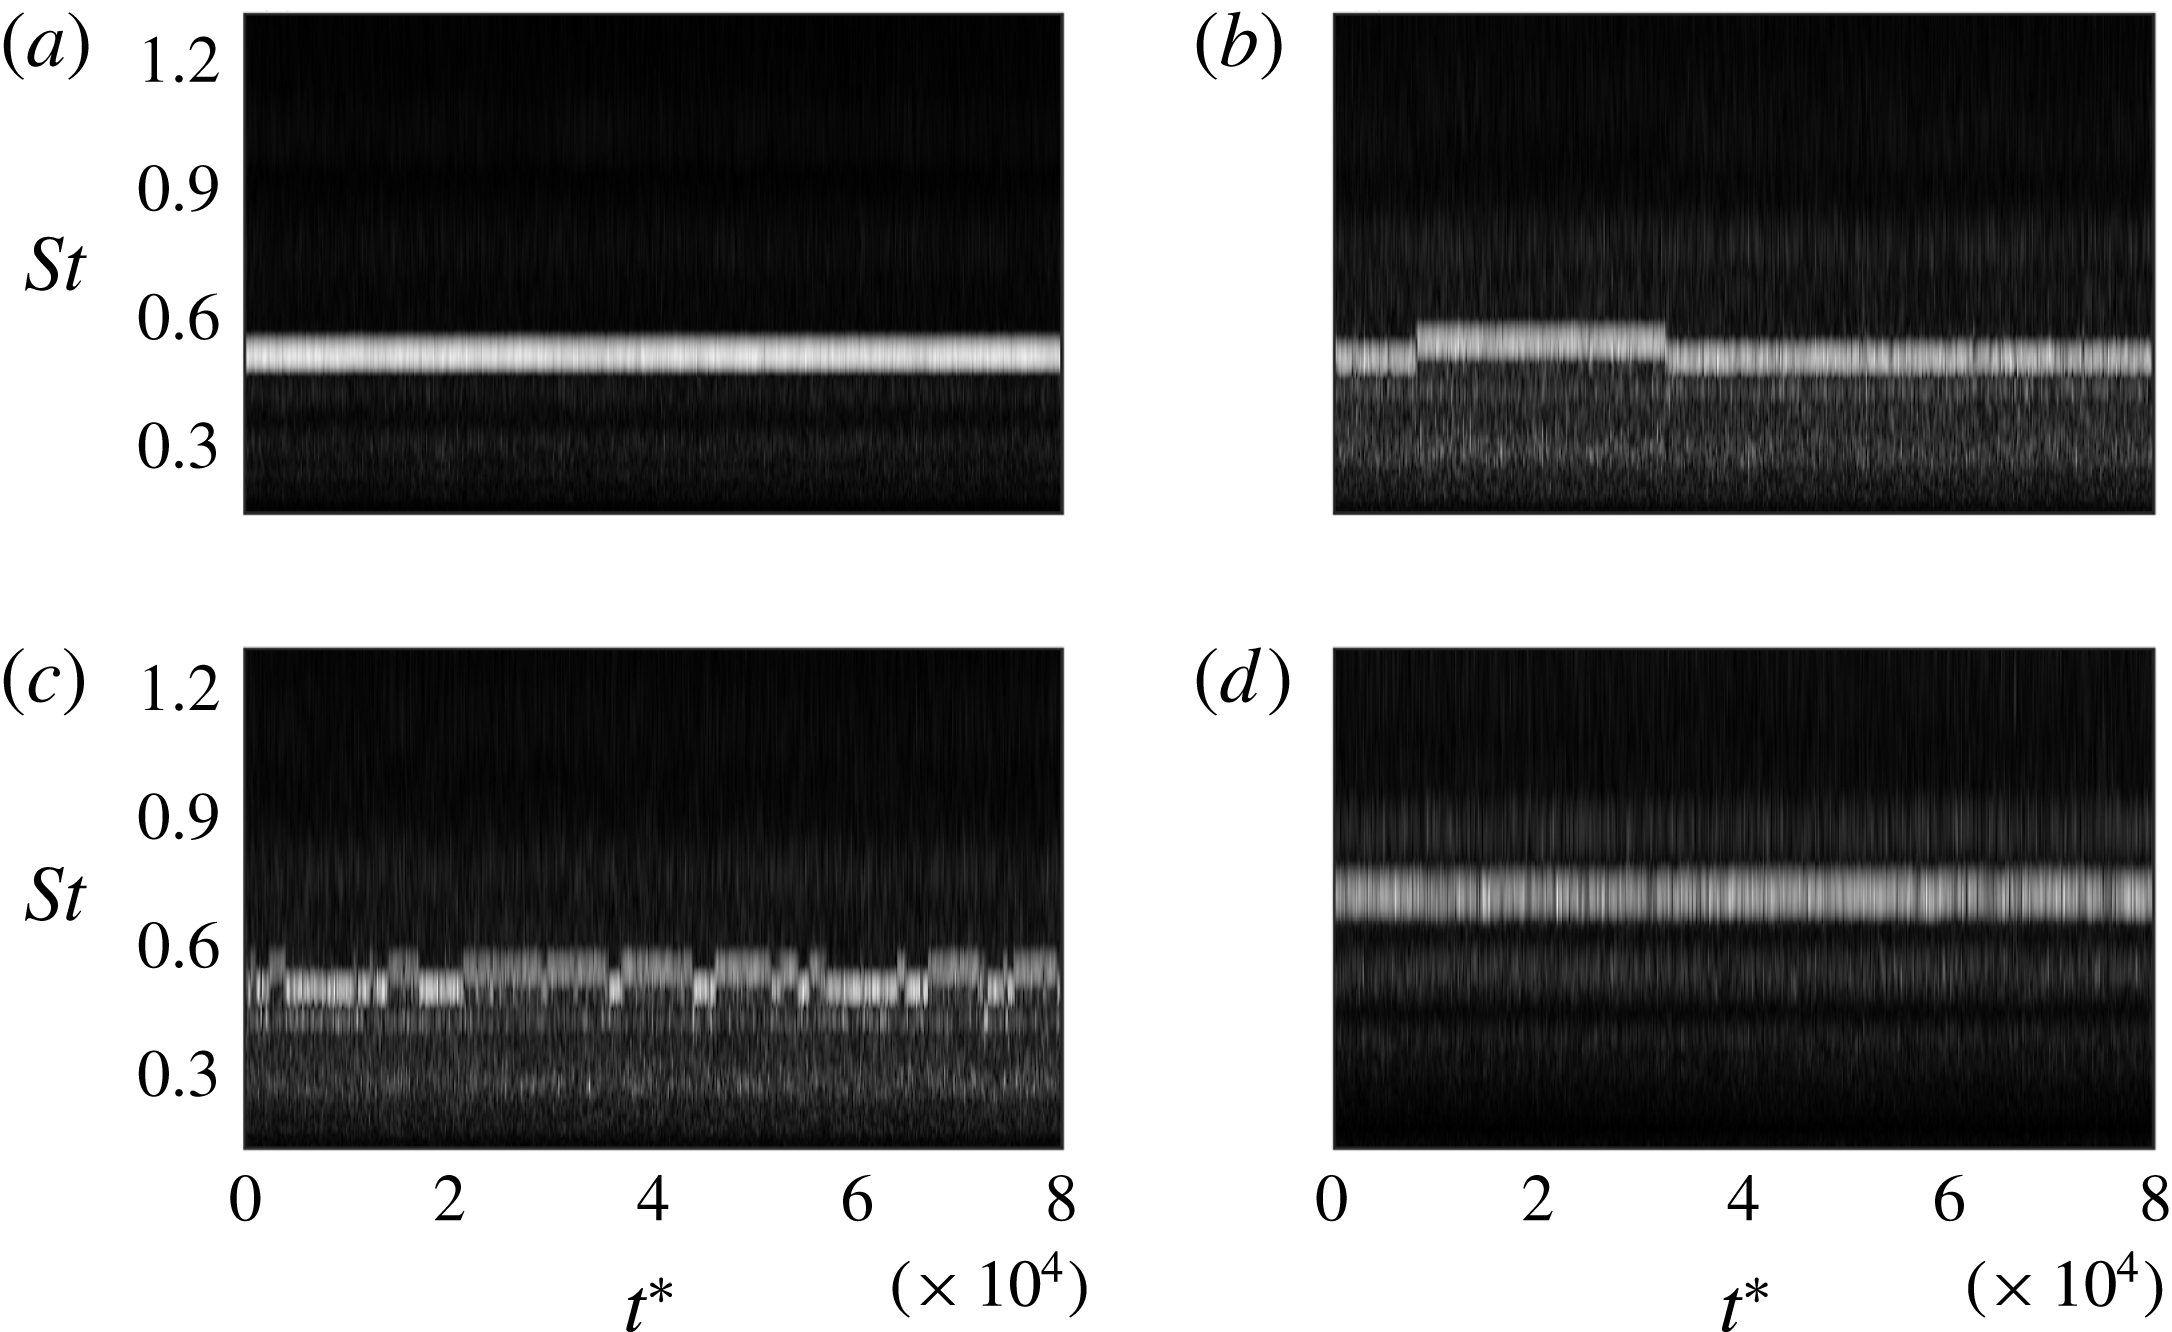
Figure 15. Time–frequency scalograms (grey scale shows wavelet-coefficient amplitudes) showing examples of four kinds of behaviour. (a)
![]() $(M,L/D)=(0.8,3)$
: dominance of a single resonance cycle, despite the existence of two nearby possibilities; (b)
$(M,L/D)=(0.8,3)$
: dominance of a single resonance cycle, despite the existence of two nearby possibilities; (b)
![]() $(M,L/D)=(0.8,4)$
: slow competition between neighbour resonance cycles; (c)
$(M,L/D)=(0.8,4)$
: slow competition between neighbour resonance cycles; (c)
![]() $(M,L/D)=(0.78,4)$
: fast competition between neighbour resonance cycles; (d)
$(M,L/D)=(0.78,4)$
: fast competition between neighbour resonance cycles; (d)
![]() $(M,L/D)=(0.6,2)$
: co-existence of neighbour resonance cycles.
$(M,L/D)=(0.6,2)$
: co-existence of neighbour resonance cycles.
Appendix A. Time–frequency analysis
A time–frequency analysis of the signal is performed via a continuous wavelet transform (Debauchies Reference Debauchies1990; Farge Reference Farge1992). The wavelet coefficient
![]() $C(t,s)$
at time
$C(t,s)$
at time
![]() $t$
and pseudo-pulsation
$t$
and pseudo-pulsation
![]() $s$
are calculated by convolving the pressure signal
$s$
are calculated by convolving the pressure signal
![]() $p(t)$
with a dilated and translated version of an analysing wavelet
$p(t)$
with a dilated and translated version of an analysing wavelet
![]() $\unicode[STIX]{x1D713}(t)$
:
$\unicode[STIX]{x1D713}(t)$
:
In order to obtain fine resolution in both time and frequency we chose a bump analysing wavelet whose Fourier transform at scale
![]() $s$
is given by,
$s$
is given by,
where
![]() $\unicode[STIX]{x1D707}$
is the peak pulsation of the unit scale wavelet spectrum and
$\unicode[STIX]{x1D707}$
is the peak pulsation of the unit scale wavelet spectrum and
![]() $\unicode[STIX]{x1D70E}$
is its width. Smaller values of
$\unicode[STIX]{x1D70E}$
is its width. Smaller values of
![]() $\text{sigma}$
lead to higher-frequency resolution with poorer time localisation. We chose
$\text{sigma}$
lead to higher-frequency resolution with poorer time localisation. We chose
![]() $\unicode[STIX]{x1D707}=5$
and
$\unicode[STIX]{x1D707}=5$
and
![]() $\unicode[STIX]{x1D70E}=0.6$
which provides localisation in both time and frequency sufficient to resolve the resonance peaks.
$\unicode[STIX]{x1D70E}=0.6$
which provides localisation in both time and frequency sufficient to resolve the resonance peaks.
The spectrograms shown in figure 15 reveal a rich and varied behaviour, providing additional insight not accessible from the PSD maps. Examples of the four kinds of behaviour typically observed. These include: (i) total dominance by a single resonance cycle, as, for example, at
![]() $(M,L/D)=(0.8,3)$
, where this occurs despite the existence of neighbour resonance possibilities; (ii) slow competition between neighbour resonance cycles, which occurs for
$(M,L/D)=(0.8,3)$
, where this occurs despite the existence of neighbour resonance possibilities; (ii) slow competition between neighbour resonance cycles, which occurs for
![]() $(M,L/D)=(0.8,4)$
; (iii) fast competition between neighbour resonance cycles, as seen for
$(M,L/D)=(0.8,4)$
; (iii) fast competition between neighbour resonance cycles, as seen for
![]() $(M,L/D)=(0.78,4)$
; and (iv) uncorrelated co-existence of multiple resonance cycles, as for example at
$(M,L/D)=(0.78,4)$
; and (iv) uncorrelated co-existence of multiple resonance cycles, as for example at
![]() $(M,L/D)=(0.6,2)$
.
$(M,L/D)=(0.6,2)$
.
Appendix B. Derivation of resonance conditions
Consider two waves travelling, respectively, upstream and downstream between two boundaries, situated at
![]() $x=0$
and
$x=0$
and
![]() $x=L$
. The waves are coupled via reflections at these boundaries, these being characterised by complex-valued coefficients,
$x=L$
. The waves are coupled via reflections at these boundaries, these being characterised by complex-valued coefficients,
![]() $R_{1}$
and
$R_{1}$
and
![]() $R_{2}$
.
$R_{2}$
.
The ansatz for a dependent variable of interest,
![]() $\hat{q}(x,\unicode[STIX]{x1D714})$
, is,
$\hat{q}(x,\unicode[STIX]{x1D714})$
, is,
At
![]() $x=0$
and
$x=0$
and
![]() $x=L$
we have, respectively,
$x=L$
we have, respectively,
Combining these equations leads to the resonance condition,
where
In terms of magnitude and phase, equation (B 4) is,
which leads to the following resonance constraints,
a similar derivation of which can be found in Landau & Lifshitz (Reference Landau and Lifshitz2013).
Appendix C. Nozzle-plane reflection conditions

Figure 16. Schematic depiction of simplified jet–nozzle system comprised of connected, solid- and soft-walled cylindrical ducts.
Consider the simplified problem depicted in figure 16, in which an incident
![]() $k^{-}$
wave of amplitude
$k^{-}$
wave of amplitude
![]() $I$
, impinging on the nozzle plane, produces a reflected wave of amplitude
$I$
, impinging on the nozzle plane, produces a reflected wave of amplitude
![]() $R$
, and a transmitted wave of amplitude
$R$
, and a transmitted wave of amplitude
![]() $T$
. Consider mass and momentum conservation in a thin disk (much smaller than a wavelength, meaning that the flow can be considered incompressible) containing the nozzle exit plane, respectively,
$T$
. Consider mass and momentum conservation in a thin disk (much smaller than a wavelength, meaning that the flow can be considered incompressible) containing the nozzle exit plane, respectively,
where the subscripts
![]() $1$
and
$1$
and
![]() $2$
refer, respectively, to the upstream and downstream faces of the disk.
$2$
refer, respectively, to the upstream and downstream faces of the disk.
The incident, reflected and transmitted waves all satisfy the dispersion relation,
where non-dimensionalisation has been performed using the jet diameter and speed of sound. The radial structures of the waves are given by the eigenfunctions
![]() $J_{0}(\unicode[STIX]{x1D6FC}r)$
where
$J_{0}(\unicode[STIX]{x1D6FC}r)$
where
![]() $\unicode[STIX]{x1D6FC}$
is the non-dimensional radial wavenumber.
$\unicode[STIX]{x1D6FC}$
is the non-dimensional radial wavenumber.
The
![]() $k_{d}^{-}$
wave behaves, as shown by Towne et al. (Reference Towne, Cavalieri, Jordan, Colonius, Schmidt, Jaunet and Brès2017), like a wave propagating in a soft-walled duct, and its first radial mode has therefore,
$k_{d}^{-}$
wave behaves, as shown by Towne et al. (Reference Towne, Cavalieri, Jordan, Colonius, Schmidt, Jaunet and Brès2017), like a wave propagating in a soft-walled duct, and its first radial mode has therefore,
![]() $\unicode[STIX]{x1D6FC}_{j}=2.4048$
. The transmitted wave propagates into the cylindrical, hard-walled nozzle, either as a plane wave,
$\unicode[STIX]{x1D6FC}_{j}=2.4048$
. The transmitted wave propagates into the cylindrical, hard-walled nozzle, either as a plane wave,
![]() $\unicode[STIX]{x1D6FC}_{n}=0$
, or as a wave with higher-order radial structure, characterised by
$\unicode[STIX]{x1D6FC}_{n}=0$
, or as a wave with higher-order radial structure, characterised by
![]() $\unicode[STIX]{x1D6FC}_{n}=3.8,\ldots$
.
$\unicode[STIX]{x1D6FC}_{n}=3.8,\ldots$
.
The cut-on condition for nozzle modes of radial order
![]() $\unicode[STIX]{x1D6FC}_{n}$
is,
$\unicode[STIX]{x1D6FC}_{n}$
is,
For the Mach number range of interest,
![]() $0.6\leqslant M\leqslant 0.82$
, the corresponding cut-on Strouhal number range for the first radial pipe mode,
$0.6\leqslant M\leqslant 0.82$
, the corresponding cut-on Strouhal number range for the first radial pipe mode,
![]() $\unicode[STIX]{x1D6FC}_{n}=3.8$
, is well above the frequencies of interest. The incident
$\unicode[STIX]{x1D6FC}_{n}=3.8$
, is well above the frequencies of interest. The incident
![]() $k^{-}$
waves will therefore be transmitted as plane waves.
$k^{-}$
waves will therefore be transmitted as plane waves.
Using the Fourier-transform convention,
the pressure fields inside and outside the nozzle that we are interested in are, therefore, respectively,
where the
![]() $\text{e}^{-\text{i}\unicode[STIX]{x1D714}t}$
has been dropped for convenience, and the momentum balance at the exit plane,
$\text{e}^{-\text{i}\unicode[STIX]{x1D714}t}$
has been dropped for convenience, and the momentum balance at the exit plane,
![]() $x=0$
, reads,
$x=0$
, reads,
In terms of the velocity fluctuation, upstream of the exit plane we have,
at the nozzle exit plane,
![]() $x=0$
,
$x=0$
,
and downstream, considering momentum balance separately for the
![]() $k^{+}$
and
$k^{+}$
and
![]() $k^{-}$
components of the fluctuations,
$k^{-}$
components of the fluctuations,
giving,
The mass balance at the nozzle exit plane is
giving for the amplitude of the transmitted wave,
Combining (C 9) and (C 18) to eliminate
![]() $T$
,
$T$
,
From which the reflection coefficient can be obtained,
 $$\begin{eqnarray}\displaystyle \frac{R}{I}=\left(\frac{1-{\displaystyle \frac{k_{j}^{+}M}{\unicode[STIX]{x1D714}}}}{1-{\displaystyle \frac{k_{j}^{-}M}{\unicode[STIX]{x1D714}}}}\right)\left(\frac{k_{n}^{-}-k_{j}^{-}}{k_{j}^{+}-k_{n}^{-}}\right). & & \displaystyle\end{eqnarray}$$
Appendix D. Complex resonance analysis
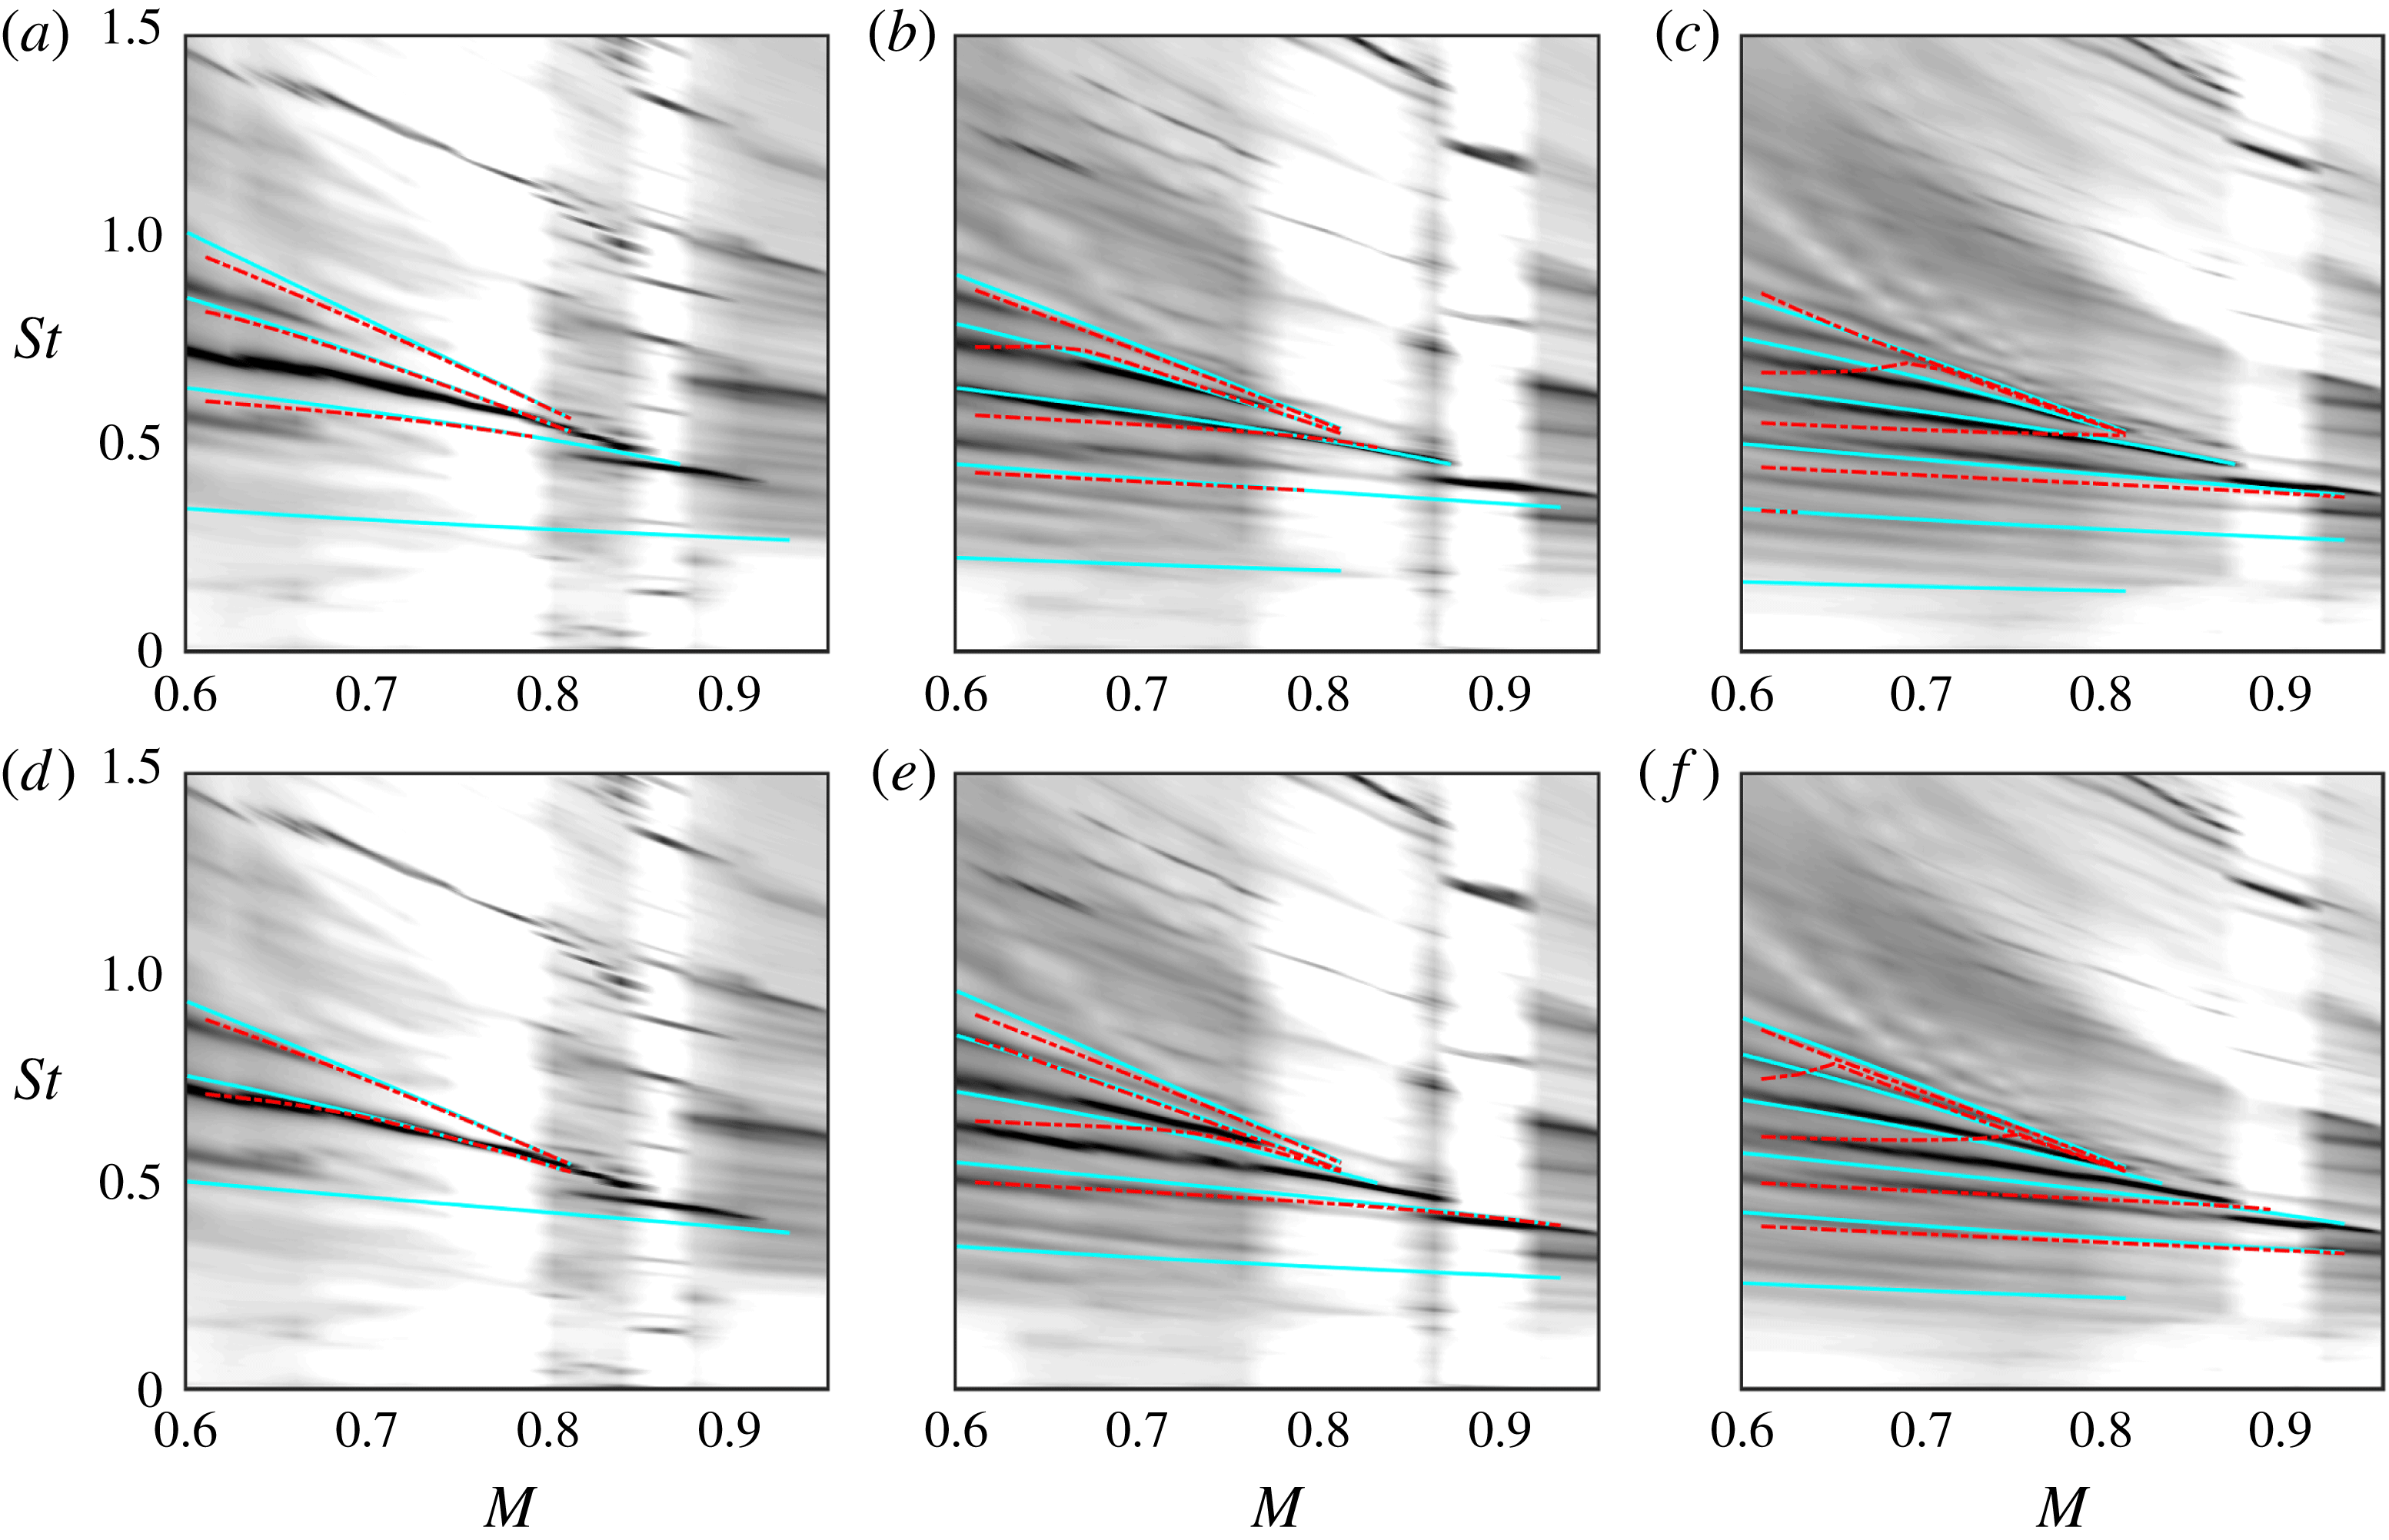
Figure 17. Comparison of resonance predictions with experimental data. Solid cyan lines: neutral-mode model; red dash-dotted lines: complex-mode model, with
![]() $R_{1}R_{2}=0.002$
. Top and bottom: respectively, assumption of in-phase and out-of-phase reflection conditions. From left to right: plate-edge positions
$R_{1}R_{2}=0.002$
. Top and bottom: respectively, assumption of in-phase and out-of-phase reflection conditions. From left to right: plate-edge positions
![]() $L=2$
,
$L=2$
,
![]() $3$
and
$3$
and
![]() $4$
.
$4$
.

Figure 18. Eigenvalue branch deformation in Mach number range,
![]() $0.61\leqslant M\leqslant 0.93$
. Cyan, red and blue lines (neutral-mode model): respectively,
$0.61\leqslant M\leqslant 0.93$
. Cyan, red and blue lines (neutral-mode model): respectively,
![]() $k_{TH}^{-}$
,
$k_{TH}^{-}$
,
![]() $k_{p}^{-}$
and
$k_{p}^{-}$
and
![]() $k_{KH}^{+}$
. Black dots: complex-mode model for
$k_{KH}^{+}$
. Black dots: complex-mode model for
![]() $R_{1}R_{2}=0.002$
.
$R_{1}R_{2}=0.002$
.

Figure 19. Resonance-frequency prediction with complex-mode model for
![]() $R_{1}R_{2}=0.002$
; resonance frequencies are given by intersection of horizontal red lines (solid and dash-dotted: respectively, in-phase and out-of-phase reflection conditions) and black-dotted lines. From (a) to (c)
$R_{1}R_{2}=0.002$
; resonance frequencies are given by intersection of horizontal red lines (solid and dash-dotted: respectively, in-phase and out-of-phase reflection conditions) and black-dotted lines. From (a) to (c)
![]() $L=2$
,
$L=2$
,
![]() $3$
and
$3$
and
![]() $4$
.
$4$
.
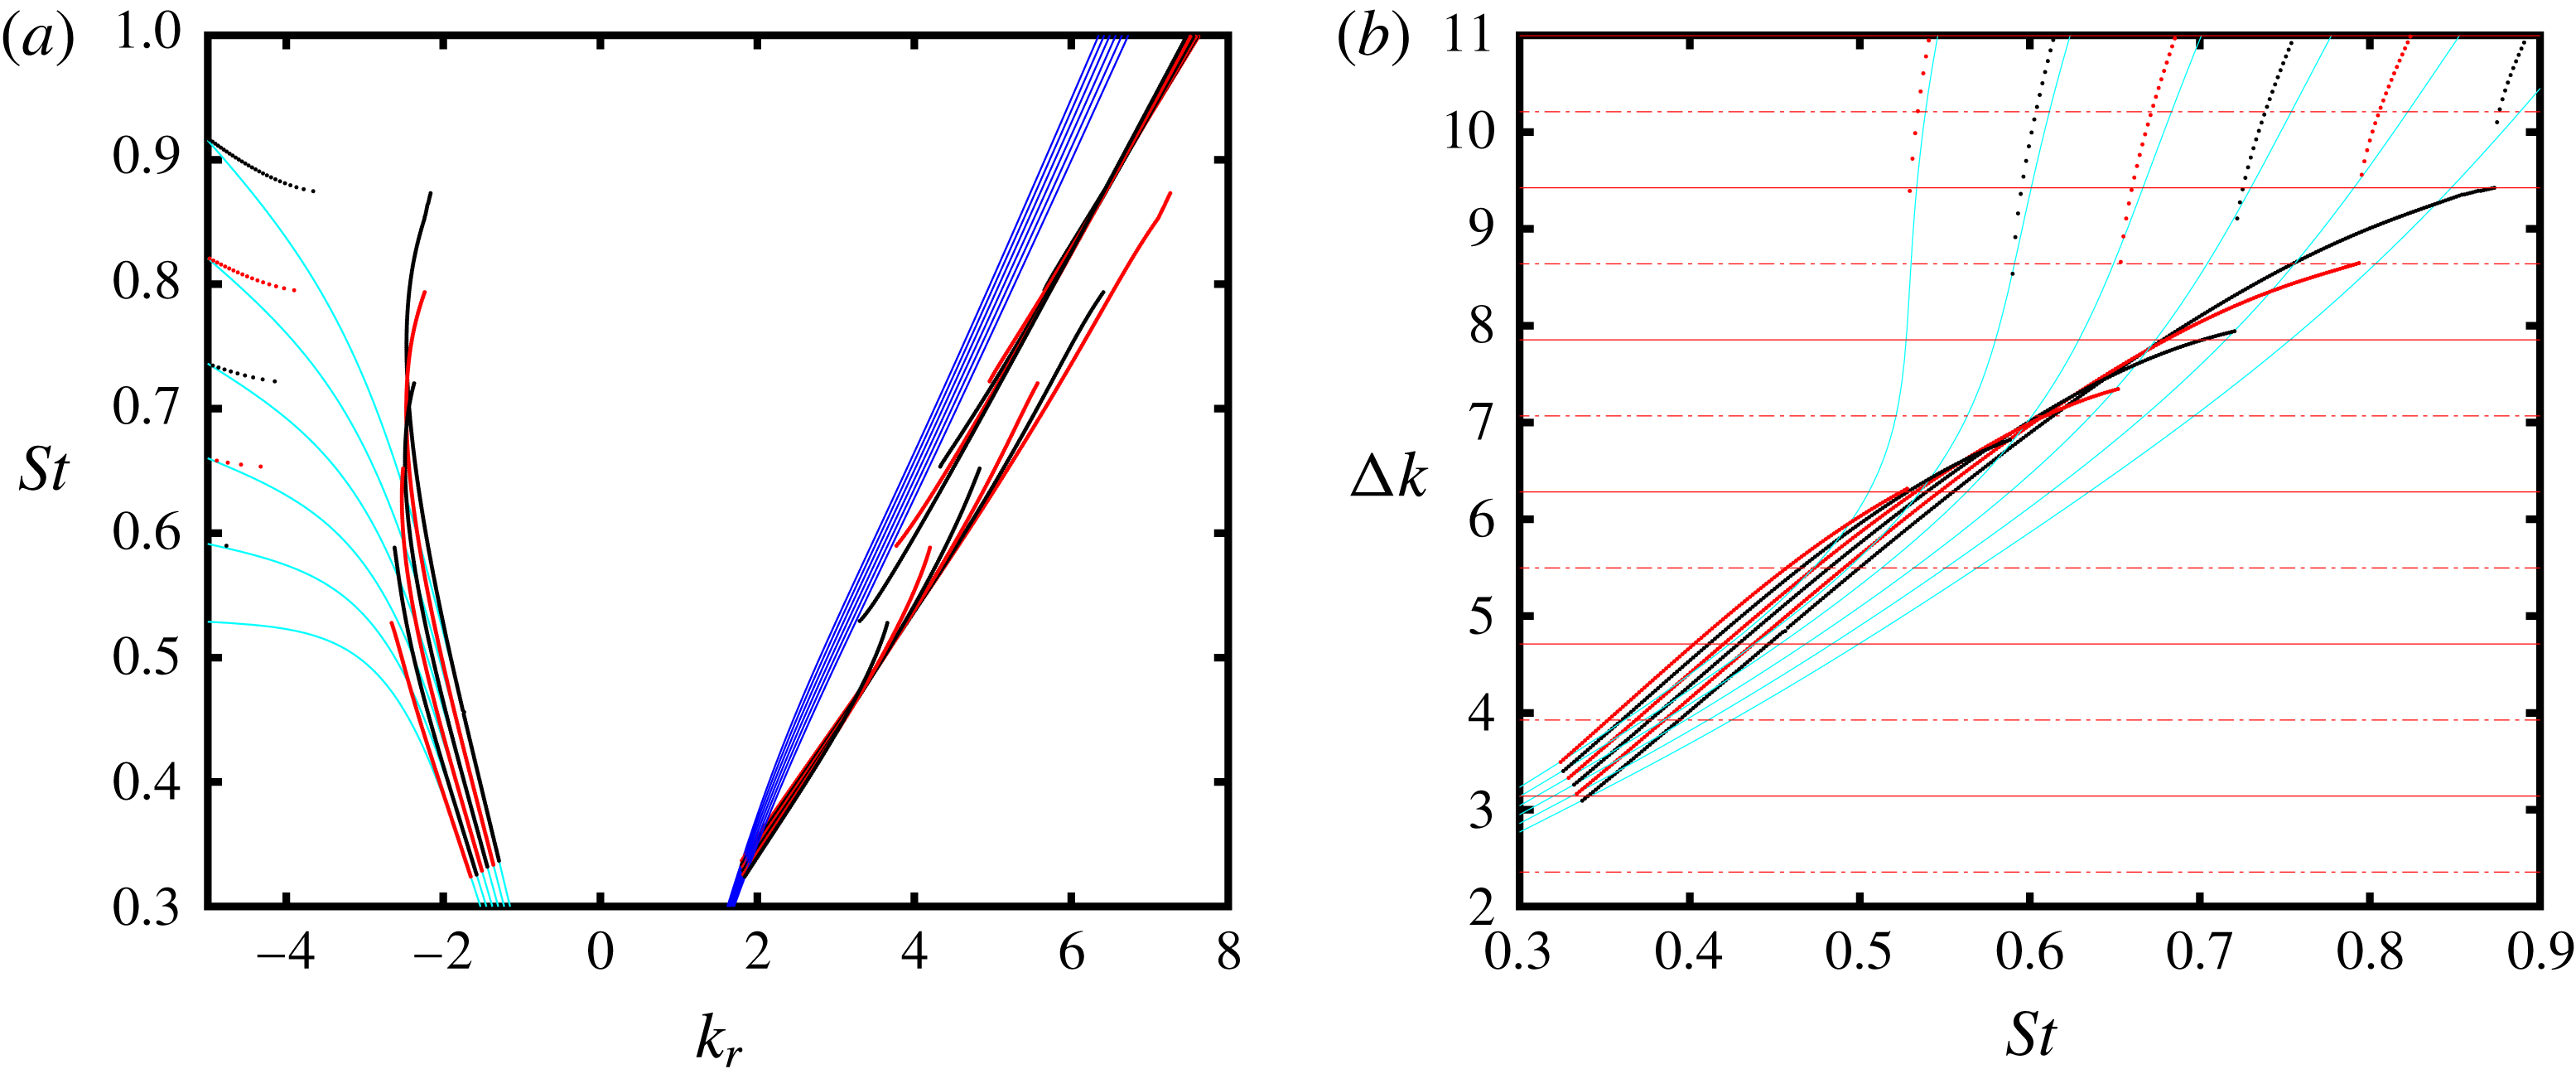
Figure 20. Zoom showing effect of the invalid saddle point discussed by Towne et al. (Reference Towne, Cavalieri, Jordan, Colonius, Schmidt, Jaunet and Brès2017) (cf. figure 12(d) in that paper) on: resonance-eigenvalue branch deformation (a) and frequency prediction (b) using complex-mode model with
![]() $R_{1}R_{2}=0.002$
and
$R_{1}R_{2}=0.002$
and
![]() $L=4$
. From left to right:
$L=4$
. From left to right:
![]() $L=2$
,
$L=2$
,
![]() $3$
and
$3$
and
![]() $4$
.
$4$
.
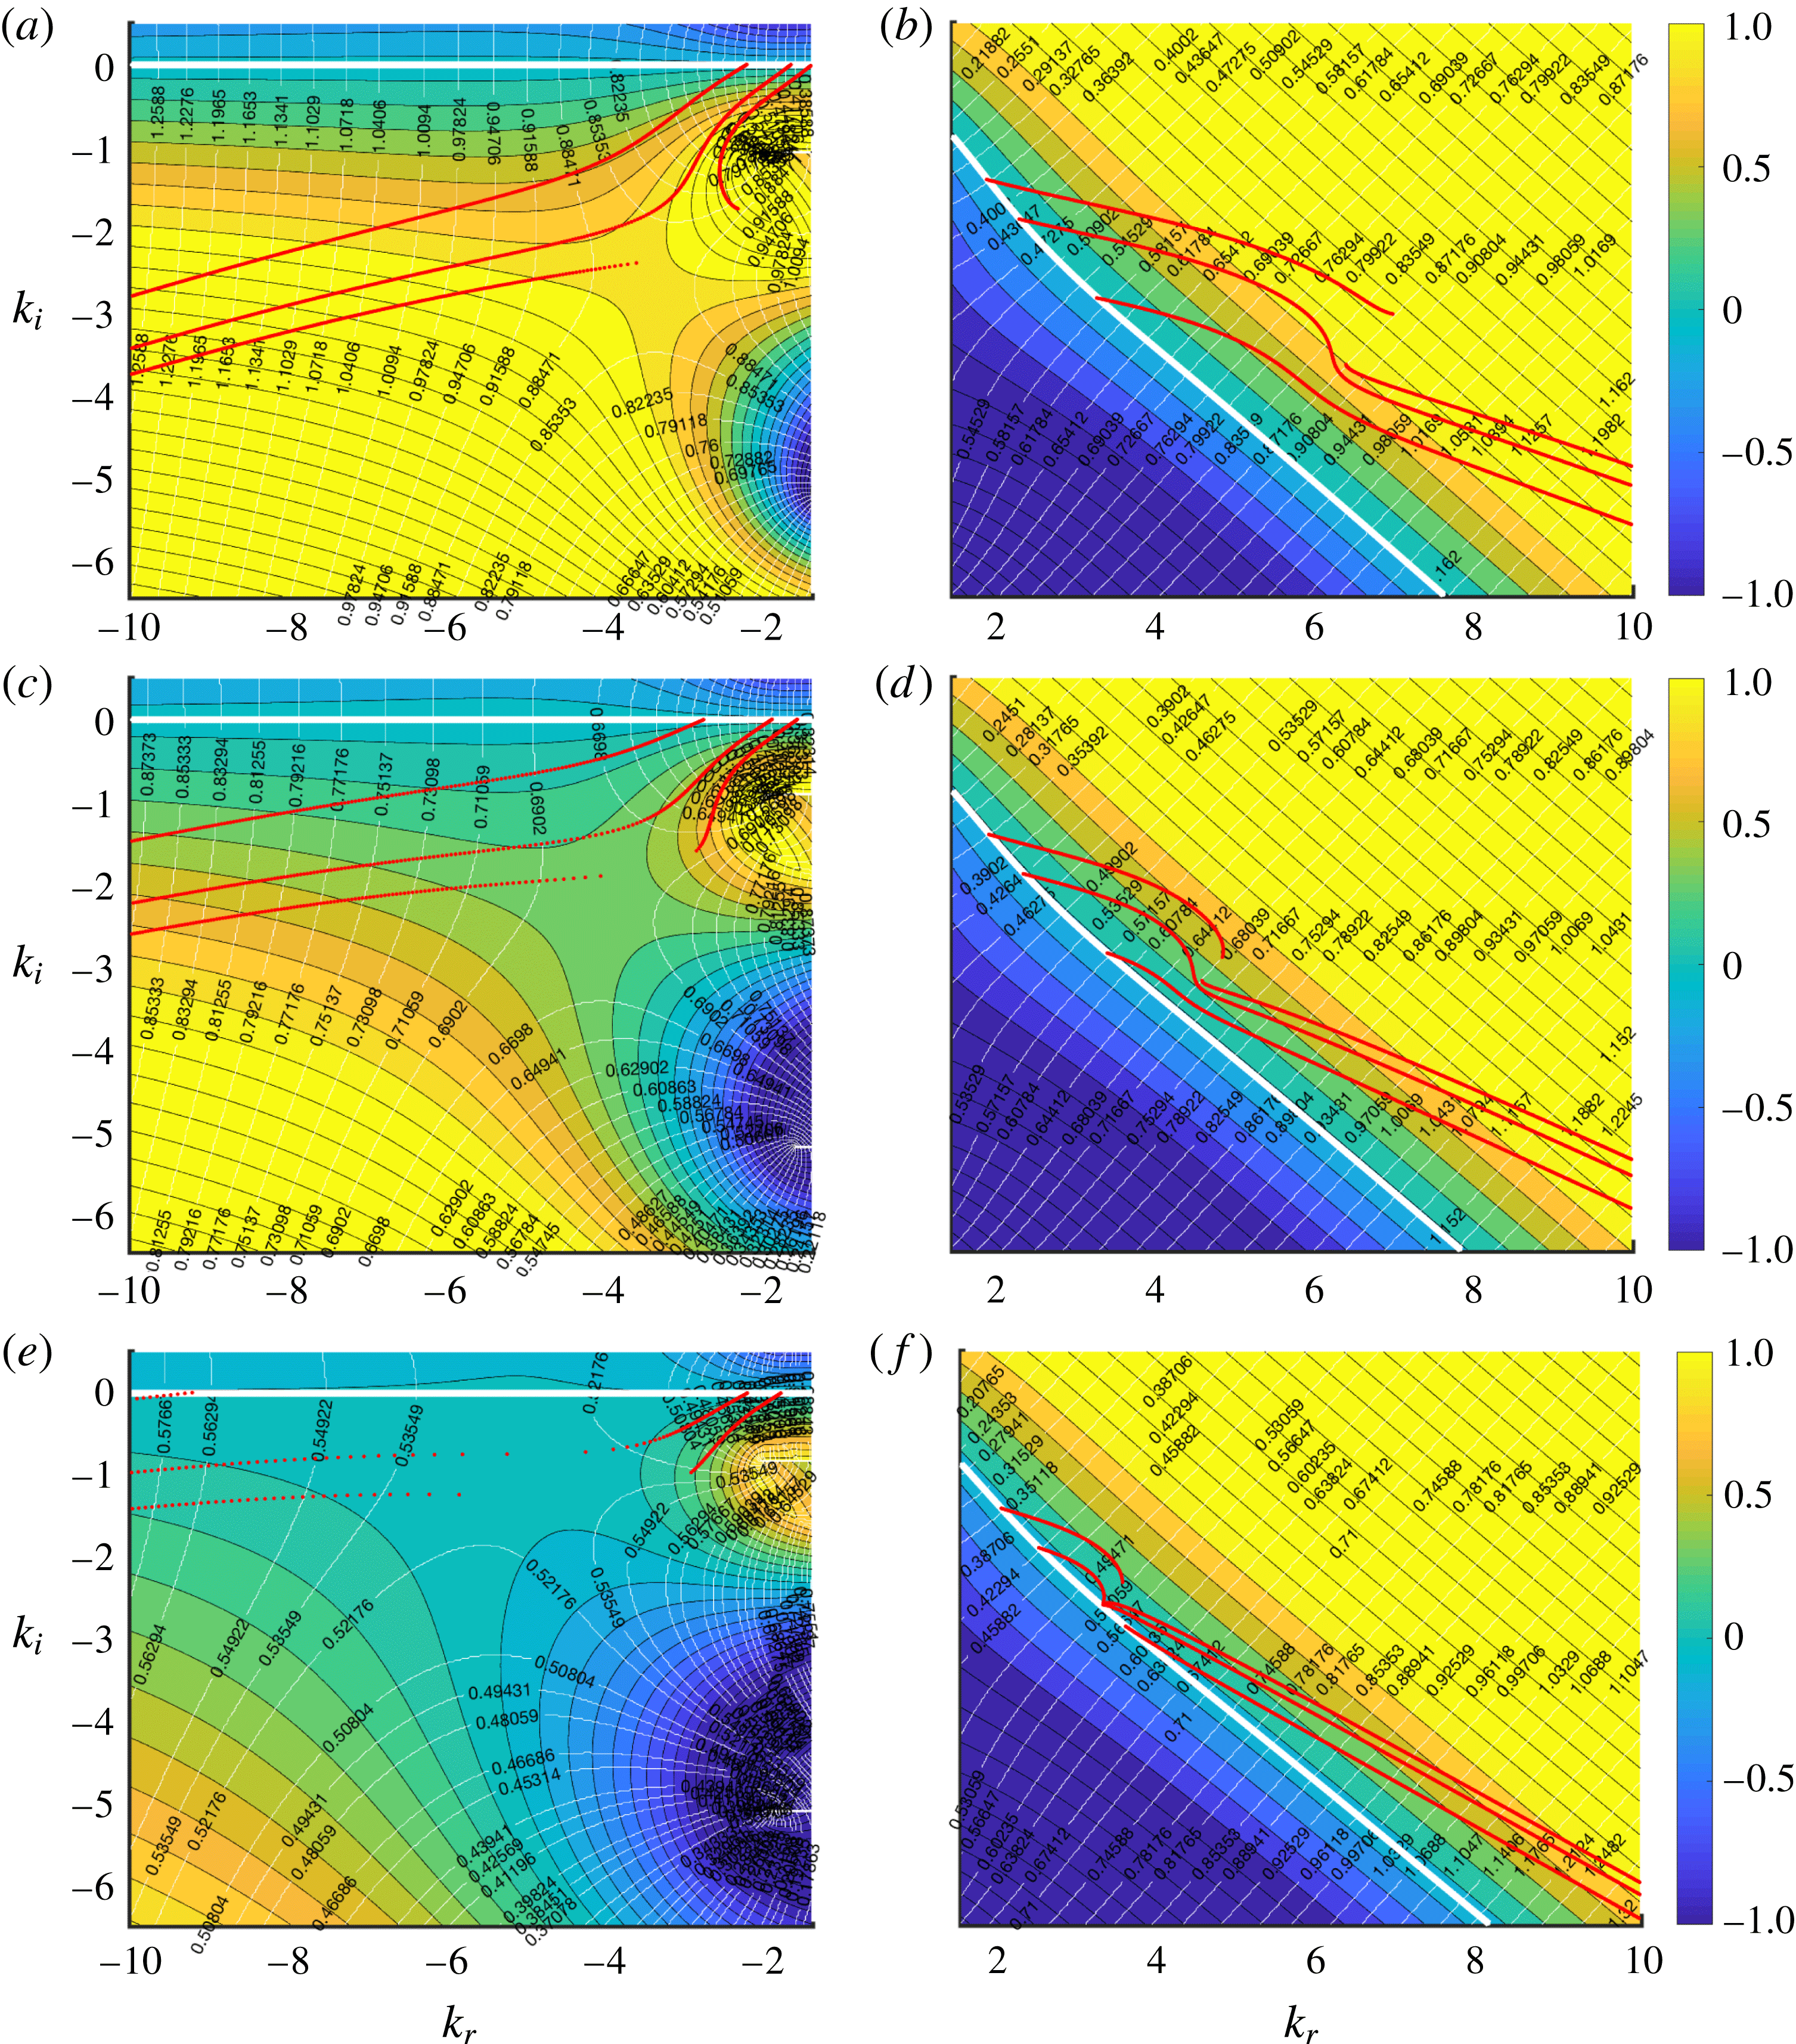
Figure 21. Vortex-sheet solutions,
![]() $\unicode[STIX]{x1D714}(k)$
. The colour map shows
$\unicode[STIX]{x1D714}(k)$
. The colour map shows
![]() $\unicode[STIX]{x1D714}_{i}$
; white isocontours show
$\unicode[STIX]{x1D714}_{i}$
; white isocontours show
![]() $St=\unicode[STIX]{x1D714}_{r}/2/\unicode[STIX]{x03C0}$
. Red dots indicate
$St=\unicode[STIX]{x1D714}_{r}/2/\unicode[STIX]{x03C0}$
. Red dots indicate
![]() $k^{-}$
(left plot) and
$k^{-}$
(left plot) and
![]() $k^{+}$
(right plot) modes satisfying the resonance amplitude constraint (B 8). From top to bottom:
$k^{+}$
(right plot) modes satisfying the resonance amplitude constraint (B 8). From top to bottom:
![]() $M=0.6$
,
$M=0.6$
,
![]() $0.7$
and
$0.7$
and
![]() $0.8$
. Solid white lines show neutral-mode model branches (
$0.8$
. Solid white lines show neutral-mode model branches (
![]() $\unicode[STIX]{x1D714}_{i}=0$
).
$\unicode[STIX]{x1D714}_{i}=0$
).
As described in § 4.6 we find triplets
![]() $[k^{+},k^{-},\unicode[STIX]{x1D714}]\in \mathbb{C}$
that simultaneously solve (4.7), (4.6) and (4.3). This provides the resonance-frequency predictions shown in figure 17, for
$[k^{+},k^{-},\unicode[STIX]{x1D714}]\in \mathbb{C}$
that simultaneously solve (4.7), (4.6) and (4.3). This provides the resonance-frequency predictions shown in figure 17, for
![]() $R_{1}R_{2}=0.002$
, where they are compared with the experimental data and predictions of the neutral-mode model. Similar trends are obtained for
$R_{1}R_{2}=0.002$
, where they are compared with the experimental data and predictions of the neutral-mode model. Similar trends are obtained for
![]() $|R_{1}R_{2}|=0.004$
and
$|R_{1}R_{2}|=0.004$
and
![]() $0.008$
, the main difference being the progressive lowering of the resonance cutoff frequency discussed in § 4.6. Top and bottom plots show model results obtained, respectively, with assumptions of in-phase and out-of-phase reflection conditions.
$0.008$
, the main difference being the progressive lowering of the resonance cutoff frequency discussed in § 4.6. Top and bottom plots show model results obtained, respectively, with assumptions of in-phase and out-of-phase reflection conditions.
For
![]() $L=2$
the neutral- and complex-mode model predictions, shown, respectively, in cyan and red, are globally similar at frequencies for which the complex-mode model predicts resonance. For plate-edge positions
$L=2$
the neutral- and complex-mode model predictions, shown, respectively, in cyan and red, are globally similar at frequencies for which the complex-mode model predicts resonance. For plate-edge positions
![]() $L=3$
and
$L=3$
and
![]() $4$
discrepancies are apparent, the complex analysis obtaining globally poorer agreement with the data. The discrepancies include: (i) resonance-frequency underprediction at low Mach number; (ii) resonance-frequency overprediction at high Mach number; (iii) a non-monotonic Mach number dependence of certain resonance-mode frequencies.
$4$
discrepancies are apparent, the complex analysis obtaining globally poorer agreement with the data. The discrepancies include: (i) resonance-frequency underprediction at low Mach number; (ii) resonance-frequency overprediction at high Mach number; (iii) a non-monotonic Mach number dependence of certain resonance-mode frequencies.
The discrepancies can be understood by looking at how and why the
![]() $k^{+}$
and
$k^{+}$
and
![]() $k^{-}$
branches are deformed with respect to the neutral-mode model. Figure 18 shows these in the
$k^{-}$
branches are deformed with respect to the neutral-mode model. Figure 18 shows these in the
![]() $St-k_{r}$
plane. The neutral-mode model branches are shown in cyan and red for the
$St-k_{r}$
plane. The neutral-mode model branches are shown in cyan and red for the
![]() $k^{-}$
waves, and in blue for the
$k^{-}$
waves, and in blue for the
![]() $k^{+}$
waves. The deformed branches of the complex-mode model are shown by the black dots. The left plot of figure 20 shows a sparsed zoom for
$k^{+}$
waves. The deformed branches of the complex-mode model are shown by the black dots. The left plot of figure 20 shows a sparsed zoom for
![]() $L=4$
, with successive complex-mode branches here shown, alternatingly, in red and black, for ease of visualisation.
$L=4$
, with successive complex-mode branches here shown, alternatingly, in red and black, for ease of visualisation.
At high frequency, where the upstream-travelling modes are trapped, propagative and duct-like in the neutral-mode model, there is little
![]() $k^{-}$
branch deformation in the
$k^{-}$
branch deformation in the
![]() $St-k_{r}$
plane. Note, on the other hand, that in the
$St-k_{r}$
plane. Note, on the other hand, that in the
![]() $k_{r}-k_{i}$
plane (cf. figure 21), branch deformation occurs, with the resonance-admissible
$k_{r}-k_{i}$
plane (cf. figure 21), branch deformation occurs, with the resonance-admissible
![]() $k^{-}$
waves becoming spatially evanescent, and the
$k^{-}$
waves becoming spatially evanescent, and the
![]() $k^{+}$
less spatially unstable. This trend is due to the constraint,
$k^{+}$
less spatially unstable. This trend is due to the constraint,
![]() $\text{e}^{\unicode[STIX]{x0394}k_{i}L}=R_{1}R_{2}$
, that requires the imaginary parts of the wavenumbers to approach one another as dictated by the reflection-coefficient product and the distance between the nozzle exit plane and the plate edge.
$\text{e}^{\unicode[STIX]{x0394}k_{i}L}=R_{1}R_{2}$
, that requires the imaginary parts of the wavenumbers to approach one another as dictated by the reflection-coefficient product and the distance between the nozzle exit plane and the plate edge.
As frequency decreases a more marked deformation occurs in the
![]() $St-k_{r}$
plane. This is greatest in the frequency range where phase and group velocities evolve from subsonic to sonic values. With further decrease in frequency the complex-mode
$St-k_{r}$
plane. This is greatest in the frequency range where phase and group velocities evolve from subsonic to sonic values. With further decrease in frequency the complex-mode
![]() $k^{-}$
branches realign with the neutral-mode branches; again, this is only seen in the
$k^{-}$
branches realign with the neutral-mode branches; again, this is only seen in the
![]() $St-k_{r}$
plane, as is clear from figure 21. The complex-mode branches are truncated at the threshold frequency
$St-k_{r}$
plane, as is clear from figure 21. The complex-mode branches are truncated at the threshold frequency
![]() $\unicode[STIX]{x1D714}_{r}|_{\unicode[STIX]{x1D714}_{i}=0}$
, providing a low-frequency resonance cutoff; for lower
$\unicode[STIX]{x1D714}_{r}|_{\unicode[STIX]{x1D714}_{i}=0}$
, providing a low-frequency resonance cutoff; for lower
![]() $\unicode[STIX]{x1D714}_{r}$
solutions satisfying (4.7) and (4.6) are only found for negative
$\unicode[STIX]{x1D714}_{r}$
solutions satisfying (4.7) and (4.6) are only found for negative
![]() $\unicode[STIX]{x1D714}_{i}$
, indicating a damped resonance which should not lead to significant tones in the power spectral density of flow fluctuations. The
$\unicode[STIX]{x1D714}_{i}$
, indicating a damped resonance which should not lead to significant tones in the power spectral density of flow fluctuations. The
![]() $St-k_{r}$
branch deformations become more pronounced as
$St-k_{r}$
branch deformations become more pronounced as
![]() $L$
is increased, and for
$L$
is increased, and for
![]() $L=4$
there is the appearance of what looks like a discontinuity. Figure 21 illustrates how this is due to the invalid (from an absolute stability point of view (Huerre & Monkewitz Reference Huerre and Monkewitz1990))
$L=4$
there is the appearance of what looks like a discontinuity. Figure 21 illustrates how this is due to the invalid (from an absolute stability point of view (Huerre & Monkewitz Reference Huerre and Monkewitz1990))
![]() $k^{-}/k^{-}$
saddle point discussed in Towne et al. (Reference Towne, Cavalieri, Jordan, Colonius, Schmidt, Jaunet and Brès2017) (cf. figure 12(d) in that paper).
$k^{-}/k^{-}$
saddle point discussed in Towne et al. (Reference Towne, Cavalieri, Jordan, Colonius, Schmidt, Jaunet and Brès2017) (cf. figure 12(d) in that paper).
The consequences of the above for resonance-frequency prediction is illustrated in figure 19, which shows
![]() $\unicode[STIX]{x0394}k_{r}(St)$
and the resonance criteria
$\unicode[STIX]{x0394}k_{r}(St)$
and the resonance criteria
![]() $2n\unicode[STIX]{x03C0}/L$
and
$2n\unicode[STIX]{x03C0}/L$
and
![]() $(2n+1)\unicode[STIX]{x03C0}/L$
, (solid and dash-dotted horizontal red lines, respectively). The right plot of figure 20 again shows a sparsed zoom for
$(2n+1)\unicode[STIX]{x03C0}/L$
, (solid and dash-dotted horizontal red lines, respectively). The right plot of figure 20 again shows a sparsed zoom for
![]() $L=4$
. The branch deformation produced by the saddle-point results, for a given Mach number, in low-frequency resonant modes that occur at lower frequency in comparison to the neutral-mode model, and higher-frequency modes that can potentially occur at equal or higher frequencies. The Mach number dependence of a given resonance mode is sensitive to the details of the Mach number dependence of the
$L=4$
. The branch deformation produced by the saddle-point results, for a given Mach number, in low-frequency resonant modes that occur at lower frequency in comparison to the neutral-mode model, and higher-frequency modes that can potentially occur at equal or higher frequencies. The Mach number dependence of a given resonance mode is sensitive to the details of the Mach number dependence of the
![]() $\unicode[STIX]{x1D714}(k)$
landscape (cf. figure 21), particularly so in the neighbourhood of the saddle point; and to the influence of this on the resonance amplitude constraint,
$\unicode[STIX]{x1D714}(k)$
landscape (cf. figure 21), particularly so in the neighbourhood of the saddle point; and to the influence of this on the resonance amplitude constraint,
![]() $\text{e}^{\unicode[STIX]{x0394}k_{i}L}=R_{1}R_{2}$
, that requires the imaginary parts of the
$\text{e}^{\unicode[STIX]{x0394}k_{i}L}=R_{1}R_{2}$
, that requires the imaginary parts of the
![]() $k^{+}$
and
$k^{+}$
and
![]() $k^{-}$
waves to be adjusted as discussed earlier.
$k^{-}$
waves to be adjusted as discussed earlier.
It is here that the fragility of the complex-mode model becomes apparent: in order to make accurate resonance-frequency predictions, we require not only an accurate knowledge of the Mach number dependence of
![]() $\unicode[STIX]{x1D714}(k)$
, but also an accurate knowledge of the Mach number and frequency dependence of
$\unicode[STIX]{x1D714}(k)$
, but also an accurate knowledge of the Mach number and frequency dependence of
![]() $R_{1}$
and
$R_{1}$
and
![]() $R_{2}$
and the further dependence of
$R_{2}$
and the further dependence of
![]() $R_{2}$
on the edge position,
$R_{2}$
on the edge position,
![]() $L$
. The assumption that
$L$
. The assumption that
![]() $R_{1}R_{2}$
be independent of these makes the model fragile when the branch of resonance-admissible
$R_{1}R_{2}$
be independent of these makes the model fragile when the branch of resonance-admissible
![]() $k^{-}$
eigenvalues enters the neighbourhood of the saddle point. Here, high gradients of
$k^{-}$
eigenvalues enters the neighbourhood of the saddle point. Here, high gradients of
![]() $\unicode[STIX]{x1D714}(k)$
lead to rapid variation in values of
$\unicode[STIX]{x1D714}(k)$
lead to rapid variation in values of
![]() $k_{r}$
associated with values of
$k_{r}$
associated with values of
![]() $k_{i}$
as constrained by
$k_{i}$
as constrained by
![]() $\text{e}^{\unicode[STIX]{x0394}k_{i}L}=R_{1}R_{2}$
.
$\text{e}^{\unicode[STIX]{x0394}k_{i}L}=R_{1}R_{2}$
.
The conclusion of the analysis is that the neutral-mode model, despite lacking certain aspects of the flow physics, can provide reasonable tone predictions over a limited frequency range, showing that in this range the resonance phenomenon is relatively insensitive to the missing physics. The complex model, on the other hand, despite its fragility in the absence of detailed information regarding the reflection conditions, provides an indication of where the neutral-mode model will fail, at low frequency for instance.


