1. Introduction
When a light fluid supports a heavy fluid under gravitation or external acceleration, the material interface between these two fluids is unstable. The penetration between the two fluids leads to fluid mixing. Any small disturbances at the initial material interface grow into finger-shaped large nonlinear structures. This instability is known as the Rayleigh–Taylor instability (RTI). It was first studied by Rayleigh (Reference Rayleigh1883) for gravity and later extended by Taylor (Reference Taylor1950) to fluids in acceleration. The research on the RTI has been continuously active over the past century due to its great importance and prevalence in both nature and industry. In particular, the ability to suppress and control the growth of fingers at the unstable interface is of immense merit due to its industrial applications in fluid mixing. In this paper we study a Rayleigh–Taylor (RT) unstable interface between two perfectly dielectric fluids in the presence of an electric field whose direction is parallel to the unperturbed interface (see figure 1). We investigate the mechanism of how such an electric field leads to the suppression of interfacial instability, a phenomenon discovered in Eldabe (Reference Eldabe1989). Our focus is on the nonlinear behaviour of fingers at the material interface.
Ever since the pioneering works by Rayleigh (Reference Rayleigh1883) and Taylor (Reference Taylor1950), the RTI has attracted substantial attention from mathematicians, physicists and engineers. Comprehensive reviews in this field can be found in Sharp (Reference Sharp1984), Zhou (Reference Zhou2017a,Reference Zhoub). In particular, theoretical research on the single-mode RTI is actively conducted due to its fundamental importance, not only in understanding the nature of the single-mode RTI dynamics but also in the bubble merger process and chaotic turbulent mixing at later times. Fingers at the material interface have the form of bubbles and spikes. A bubble is the portion of the light fluid penetrating into the heavy fluid, and a spike is the portion of the heavy fluid penetrating into the light fluid. They are the dominant features of the material interface. Linear theories of finger growth were first developed by Rayleigh (Reference Rayleigh1883) and Taylor (Reference Taylor1950). The linear theories can also be found in (Bernstein & Book Reference Bernstein and Book1983) for infinite domains and in Gardner et al. (Reference Gardner, Glimm, McBryan, Menikoff, Sharp and Zhang1988) for finite domains. A second-order weakly nonlinear theory was given by Haan (Reference Haan1991). For the nonlinear stage of finger development, Layzer (Reference Layzer1955) proposed a method to study the dynamics of bubbles in systems with an infinite density ratio, namely vacuum bubbles. This method was later extended by Mikaelian (Reference Mikaelian1998) to vacuum bubbles in cylindrical geometry, and by Zhang (Reference Zhang1998) to spikes in systems with an infinite density ratio. Layzer's approach was further extended to systems with a finite density ratio by several researchers (Goncharov Reference Goncharov2002; Sohn Reference Sohn2003; Zhang & Guo Reference Zhang and Guo2016).
In the classical RTI, namely in the absence of external electric fields, the material interface is always unstable if the gravity points from the heavy fluid to the light fluid. The finger growth at the unstable interface leads to the mixing of the two fluids. In the view of industrial applications, the ability to control the degree of fluid mixing is highly desirable. Therefore, using external effects, such as shear (Babchin et al. Reference Babchin, Frenkel, Levich and Sivashinsky1983), transverse oscillations (Halpern & Frenkel Reference Halpern and Frenkel2001), magnetic fields (Rudraiah et al. Reference Rudraiah, Krishnamurthy, Jalaja and Desai2004) and electric fields (Melcher & Warren Reference Melcher and Warren1966; Michael Reference Michael1968; Mohamed & El Shehawey Reference Mohamed and El Shehawey1983a,Reference Mohamed and El Shehaweyb; Eldabe Reference Eldabe1989; Korovin Reference Korovin2011; Barannyk, Papageorgiou & Petropoulos Reference Barannyk, Papageorgiou and Petropoulos2012), to control such an unstable interface has been extensively investigated. The effects of external electric fields on fluid dynamics were systematically reviewed by Melcher & Taylor (Reference Melcher and Taylor1969). They established the governing equations and boundary conditions in electrohydrodynamics. Linear stability analysis of a material interface between two fluids in the presence of electric fields was carried out in Melcher (Reference Melcher1961), Taylor & McEwan (Reference Taylor and McEwan1965), Eldabe (Reference Eldabe1989), and Barannyk et al. (Reference Barannyk, Papageorgiou and Petropoulos2012). Melcher (Reference Melcher1961) and Taylor & McEwan (Reference Taylor and McEwan1965) showed that an electric field that is perpendicular to the material interface can induce interfacial instability. On the other hand, an electric field tangential to the interface gives rise to a stabilizing effect and can suppress gravity-induced interfacial instability (Eldabe Reference Eldabe1989; Barannyk et al. Reference Barannyk, Papageorgiou and Petropoulos2012). Joshi, Radhakrishna & Rudraiah (Reference Joshi, Radhakrishna and Rudraiah2010) derived the dispersion relation for perturbation at RT unstable interfaces in several situations. Studies on the effects of the stability of the material interface were conducted for an alternating current (AC) time-dependent electric field in the horizontal direction by Moatimid & El-Bassiouny (Reference Moatimid and El-Bassiouny2007) and in the vertical direction by Roberts & Kumar (Reference Roberts and Kumar2009) and Bandopadhyay & Hardt (Reference Bandopadhyay and Hardt2017). Cimpeanu, Papageorgiou & Petropoulos (Reference Cimpeanu, Papageorgiou and Petropoulos2014) carried out numerical simulations on the RTI controlled and suppressed by a horizontal electric field, and focused on the effects of electric fields on the finger velocities. Yang et al. (Reference Yang, Li, Zhao, Shao and Xu2016) conducted a numerical analysis of an RT unstable interface in a horizontal/vertical electric field and investigated the effects on the interfacial morphology by electric fields. Yang, Li & Xu (Reference Yang, Li and Xu2017) later extended their numerical method to the leaky dielectric fluids (Taylor Reference Taylor1966; Saville Reference Saville1997) and studied the effects of the free charges at the material interface. The RTI in leaky dielectric fluids is also investigated numerically using an incompressible smoothed particle hydrodynamics method in Rahmat et al. (Reference Rahmat, Tofighi, Shadloo and Yildiz2014) and Tofighi et al. (Reference Tofighi, Ozbulut, Feng and Yildiz2016). Numerical simulations for a liquid–air interface destabilized by a vertical electric field and a gravitational field were conducted in Liu et al. (Reference Liu, Pérez, Selvakumar, Yang and Wu2021), in which the charge transport and the flow pattern were systematically investigated. Experimentally, the continuum feedback control of a stable RT-type interface was demonstrated by Melcher & Warren (Reference Melcher and Warren1966).
Several important research works are conducted on the nonlinear interfacial dynamics of thin fluid films under the effects of gravity and external electric fields (Tseluiko & Papageorgiou Reference Tseluiko and Papageorgiou2007; Roberts & Kumar Reference Roberts and Kumar2009; Barannyk et al. Reference Barannyk, Papageorgiou and Petropoulos2012, Reference Barannyk, Papageorgiou, Petropoulos and Vanden-Broeck2015; Anderson et al. Reference Anderson, Cimpeanu, Papageorgiou and Petropoulos2017; Pillai & Narayanan Reference Pillai and Narayanan2020; Broadley & Papageorgiou Reference Broadley and Papageorgiou2022). Anderson et al. (Reference Anderson, Cimpeanu, Papageorgiou and Petropoulos2017) investigated the electrostatic stabilization of a viscous thin film under a surface in the presence of a horizontal electric field. They carried out the long-wave asymptotic analysis and derived a nonlinear equation for the evolution of the material interface, which captures the effects of competing forces and bounding surfaces. The results are in good agreement with direct numerical simulations. Barannyk et al. (Reference Barannyk, Papageorgiou and Petropoulos2012) and Barannyk et al. (Reference Barannyk, Papageorgiou, Petropoulos and Vanden-Broeck2015) investigated the nonlinear dynamics and the wall touch-up phenomenon in thin fluid layers in a horizontal channel under the horizontal electric field theoretically and numerically. Tseluiko & Papageorgiou (Reference Tseluiko and Papageorgiou2007) investigated the nonlinear dynamics of a perfectly conducting viscous thin film under a vertical electric field. Roberts & Kumar (Reference Roberts and Kumar2009) applied the lubrication theory to the thin films under AC vertical electric fields to explore the possibilities of controlling the interfacial instability. By the linear analysis, they showed that the effects of the AC field can be understood by an effective direct current (DC) field. The nonlinear evolution of an interface between leaky dielectric fluids under a periodic or steady vertical electric field was analysed with the long-wave approximation by Pillai & Narayanan (Reference Pillai and Narayanan2020), who focused on the resonant instability due to the AC electric forcing and the long-time dynamics due to the DC electric forcing. Broadley & Papageorgiou (Reference Broadley and Papageorgiou2022) investigated nonlinear gravity electrocapillary waves and their stability in thin-film systems in a vertical electric field. The instability of thin films driven by electrical forcing in the absence of gravity is also studied in Chappell & O'Dea (Reference Chappell and O'Dea2020), Kochurin, Zubareva & Zubarev (Reference Kochurin, Zubareva and Zubarev2019), Thaokar & Kumaran (Reference Thaokar and Kumaran2005) and Shankar & Sharma (Reference Shankar and Sharma2004). In these works, the focus is on the dynamics of the thin fluid film, and the other fluid is often considered hydrodynamically passive (zero velocity and uniform pressure). Such settings are important in microfluidics and certain industrial applications. Extensive reviews on the dynamics and instabilities in thin films can be found in Craster & Matar (Reference Craster and Matar2009) and Papageorgiou (Reference Papageorgiou2019).
In this paper we consider the classical setting of RTI, in which both the light and heavy fluids have infinite thickness. For this setting of RTI in horizontal electric fields, only linear analysis is available in the literature (Eldabe Reference Eldabe1989). The linear theory only considers the linear mode at the material interface and provides good predictions for the behaviour of fingers when the amplitude of the finger is small. However, there are cases in which nonlinear effects are essential in the interfacial dynamics and nonlinear analysis leads to qualitatively different behaviours of the material interface from the linear theory. Here are two examples that will be discussed in the later sections. The first example is what happens if one switches the electric permittivities of the two fluids but keeps all other physical parameters the same. The linear theory predicts that the growth of the fingers will not be affected by the switching. However, the numerical simulations carried out by Yang et al. (Reference Yang, Li, Zhao, Shao and Xu2016) showed that the amplitudes of fingers grow at different rates before and after the switching of electric permittivities (see figure 9 in Yang et al. (Reference Yang, Li, Zhao, Shao and Xu2016) and figure 10 in this paper). Such a difference is absent in the linear theory. The second example is a case in which the linear theory predicts that the spike and the bubble have identically zero velocities for the entire time, but the numerical simulation shows that the bubble and the spike still have non-zero velocities and the material interface is in an oscillatory motion (see figure 8). This qualitative difference is due to the nonlinear effects, namely the contribution from the electric field and that from gravity exactly cancel in the linear theory, but their nonlinear contributions do not. Both examples show that it is necessary to develop a theory that can capture the nonlinear behaviour of fingers at the interface. In this paper we carry out such a study. We will perform theoretical analysis in the nonlinear regime for the classical RTI setting, and investigate the nonlinear behaviours of an RT interface between two perfectly dielectric fluids in the presence of an electric field parallel to the unperturbed material interface. We will analyse the effects of electric permittivities on the material interface and show how the interchange of electric permittivities affects the growth of fingers for our system. By analysing the analytical expressions for the electrical force along the material interface, we will identify the component of the force that leads to the stabilization of the interface and the nonlinear effects of electric permittivities.
This paper is structured as follows. In § 2 we describe the governing equations and the boundary conditions for an RT system in the framework of electrohydrodynamics and conduct the non-dimensionalisation of these equations and the physical parameters. In § 3 the general expressions for the nonlinear perturbation solutions are given, and the explicit expressions are displayed up to the third order in terms of the amplitude of initial perturbation at the material interface. Section 4 presents the analytical solutions for the amplitude and velocity of fingers. In § 5 we validate the derived nonlinear perturbation solution with numerical simulations by exploring various physical parameters in the phase space. We show the necessity of expanding the solution up to the third order to get an accurate prediction. In § 6 we analyse the effects of electric fields. In § 7 we study the nonlinear effects of electric permittivities of the fluids and provide an understanding of how a horizontal electric field suppresses interfacial instability for our system. In § 8 we summarise our findings. A detailed derivation for the perturbation procedure and solutions is given in the appendices.
2. Mathematical model
We consider a two-dimensional incompressible, irrotational and inviscid RT system comprised of two perfectly dielectric and immiscible fluids (see figure 1). Fluid $1$ is on top of fluid $2$, and in each phase $i$ ($i=1,2$) the fluid has a constant density $\hat {\rho }_i$ and a constant electrical permittivity $\hat {\epsilon }_i$. The circumflex symbol $\widehat {({\cdot })}$ on a variable denotes that the variable is dimensional. The physical domain is periodic in the horizontal direction and infinite in the vertical direction. The fluids are static at the vertical far field. A gravitational field $\hat {\boldsymbol {g}} = -\hat {g} \boldsymbol {j}$ and an external horizontal electric field with uniform strength $\boldsymbol {\hat {E}_x} = \hat {E}_h \boldsymbol {i}$ are applied in the entire physical domain. Here $\boldsymbol {i}$ and $\boldsymbol {j}$ are the unit vectors in the horizontal and vertical directions, respectively. Following the conventional setting for the RTI, gravity points downwards ($\hat {g} > 0$), the upper fluid is heavier than the lower fluid ($\hat {\rho }_1 > \hat {\rho }_2$) and surface tension is neglected.
2.1. Governing equations
In the interior regions of the fluids, the hydrodynamics of the system is governed by the Euler equations
where $\hat {\boldsymbol {\nabla }} \equiv ({\partial }/{\partial \hat {x}},{\partial }/{\partial \hat {z}})$ is the dimensional spatial differential operator, and $\boldsymbol {\hat {u}_i}$ and $\hat {p}_i$ are the velocity and pressure of the fluid in phase $i$ ($i=1,2$), respectively. Since both fluids are incompressible and irrotational, we have
For a perfectly dielectric fluid, the electrical conductivity is zero. This means that no free charges exist in the bulk of fluids and only polarized charges need to be counted. In this case, the dynamic current is very small and the induced magnetic fields are negligible. Consequently, Faraday's law reduces to
where $\boldsymbol {\hat {E}_i}$ is the electric field in fluid $i$ ($i=1,2$). Due to the absence of free charges, Gauss's law can be written as
At the vertical far fields, the velocities of the fluids are zero, i.e.
and the electric fields are constant in each fluid phase, i.e.
At the material interface, the fluid velocity is continuous in the normal direction, i.e.
where $\boldsymbol {\hat {X}} \equiv (\hat {x}, \hat {\eta }(\hat {t},\hat {x}))$ denotes the location of the material interface at time $\hat {t}$ and $\boldsymbol {n} = (-\partial \hat {\eta } / \partial \hat {x}, 1) / \sqrt {1+(\partial \hat {\eta } / \partial \hat {x})^2}$ denotes the normal unit vector at the material interface (see figure 1). Other than the bound charges due to polarization, there are no unbounded surface charges at the material interface. Therefore, the normal component of the electric displacement field $\hat {\epsilon } \boldsymbol {\hat {E}}$ is continuous across the material interface, and so is the tangential component of the electric field $\boldsymbol {\hat {E}}$. These conditions lead to
where $\boldsymbol {s} = (1, \partial \hat {\eta } / \partial \hat {x}) / \sqrt {1+(\partial \hat {\eta } / \partial \hat {x})^2}$ is the tangential unit vectors at the material interface (see figure 1). The normal stress at the material interface is also continuous, i.e.
where
is the stress tensor for fluid $i$ and $\boldsymbol{\mathsf{I}}$ is the identity matrix. We comment that, on the right-hand side of (2.12), the first term is the hydrodynamic component, and the second and third terms are the electrodynamic components. The expressions of the electrodynamic components come from the Maxwell stress tensor. Here we have used the condition of constant permittivity.
For our system, (2.1)–(2.5) are the governing equations in the interior regions of the fluids, (2.6) and (2.7) are the boundary conditions at the far fields and (2.8)–(2.11) are the boundary conditions at the material interface. We comment that (2.1)–(2.3), (2.6) and (2.8) do not involve electric fields and are identical to the equations for the classical RTI. Since our system contains electric fields, it requires additional equations, namely (2.4), (2.5), (2.7) and (2.9)–(2.11).
2.2. Non-dimensional parameters and equations
The governing equations for our system given by (2.1)–(2.11) are expressed in terms of dimensional variables. Here we non-dimensionalize these governing equations and all physical parameters. In the paper, all dimensionless quantities are denoted by notations without the circumflex symbol.
We introduce the Atwood number for the fluid density
Since in our setting the top fluid (fluid $1$) is always heavier than the bottom fluid (fluid $2$) and the gravity points downwards, $A > 0$ and gravity always acts as a destabilizing factor. Similarly, we introduce the ‘Atwood number’ for the electric permittivity, namely
Note that when $\hat {\epsilon }_1>\hat {\epsilon }_2$, i.e. $A_\epsilon > 0$, the top fluid (fluid $1$) has higher permittivity and, therefore, yields a higher degree of polarization in response to the external electric field than the bottom fluid (fluid $2$). When $\hat {\epsilon }_1<\hat {\epsilon }_2$, i.e. $A_\epsilon < 0$, the top fluid has lower permittivity and yields a lower degree of polarization in response to the external electric field than the bottom fluid.
The length is non-dimensionalised by the wavenumber $\hat {k}$, namely
It is easy to check that $\boldsymbol {n} = (-\partial {\eta } / \partial {x}, 1) / \sqrt {1+(\partial {\eta } / \partial {x})^2}$ and $\boldsymbol {s} = (1, \partial {\eta } / \partial {x}) / \sqrt {1+(\partial {\eta } / \partial {x})^2}$. There are two driving forces in the system: gravity $\hat {g}$ with $\hat {g}>0$, and the electrical force caused by the external electric field characterized by $\hat {f}_E = \hat {E}_h^2 \hat {k} ({\hat {\epsilon }_1+\hat {\epsilon }_2})/({\hat {\rho }_1+\hat {\rho }_2})$. The former generates the interfacial instability and the latter suppresses it (Eldabe Reference Eldabe1989). It is the competition between these two driving forces that governs the evolution of the material interface. To quantify the relative strength of these two driving forces, we introduce the dimensionless gravity
and the dimensionless horizontal electric field
where $\mathrm {sgn}({\cdot })$ is the sign function. We comment that $g$ denotes the fraction of the driving forces due to gravity, and $E_h^2$ denotes the fraction of the driving forces due to the electrical force. Hence, when the system is mostly driven by gravity and the electrical force is negligible, we have $g \to 1$ and $E_h^2 \to 0$. On the other hand, when the electrical force is dominating, we have $g \to 0$ and $E_h^2 \to 1$.
The presence of the two different driving forces gives two distinctive characteristic time scales: one is the time scale $(\hat {g} \hat {k})^{-1/2}$ due to gravity alone, and the other is the time scale $(\hat {f}_E \hat {k})^{-1/2}$ due to the electrical force alone. This complicates the non-dimensionalisation of time. We introduce a combined characteristic time $\hat {t}_c = (\hat {g} \hat {k} + \hat {f}_E \hat {k})^{-1/2}$, which includes both the gravitational and electrical force time scales. This combined form avoids the characteristic time becoming zero when one of the driving forces is absent, i.e. when $\hat {g} = 0$ or $\hat {E}_h = 0$. Therefore, $\hat {t}_c$ can serve as the characteristic time of our system for all cases. Then the time, the pressure, the velocity field and the electric field are non-dimensionalised as
The dimensionless stress tensors are expressed as
The dimensional governing equations and boundary conditions given by (2.1)–(2.11) can be expressed in terms of the non-dimensional quantities defined by (2.15a–c)–(2.18a–d) and the results are
where $\boldsymbol {\nabla } \equiv ({\partial }/{\partial x},{\partial }/{\partial z}) = {1}/{\hat {k}} ({\partial }/{\partial \hat {x}},{\partial }/{\partial \hat {z}})$ is the non-dimensional spatial differential operator and $\boldsymbol {{X}} \equiv ({x}, {\eta }({t},{x}))$ is the location of the material interface in terms of dimensionless length.
In the following sections all analyses and results are presented in terms of non-dimensional quantities unless explicitly stated.
3. General solution procedure by perturbation expansion
Here we derive the perturbation solutions for the single-mode RTI in the presence of a horizontal electric field. We consider a perturbed material interface with the initial shape given by $\eta (t=0,x) = a_0\cos (x)$ and the initial velocity given by $\dot {\eta }(t=0,x) = 0$, where $a_0 > 0$ is the dimensionless amplitude of the initial disturbance. The linear theory only considers the solutions up to the first order of $a_0$. To study the nonlinear behaviour of fingers, in §§ 3.1–3.3 we derive the general solution procedure in terms of the perturbation expansion of $a_0$. The explicit solutions up to the third order are presented in § 3.4.
3.1. Governing equations in terms of potentials
Since the fluids in our system are incompressible and irrotational (see (2.23) and (2.24)), there exists a velocity potential in each fluid phase. Furthermore, the electric fields in our system are both divergence free and rotation free in the interior of the fluids (see (2.25) and (2.26)), and there also exists a voltage potential for each fluid. In this subsection we rewrite the governing equations (2.21)–(2.32) in terms of these potentials. In terms of the dimensionless velocity potential $\phi _i$, the dimensionless velocity field in the interior of each fluid phase $i$ can be expressed as $\boldsymbol {{u}_i} = -\boldsymbol {\nabla } {\phi }_i$. Therefore, (2.23) can be rewritten as the Laplace equation for ${\phi }_i$,
Similarly, in terms of the dimensionless voltage potentials ${V}_i$, the dimensionless electric fields in the interior of the fluids can be expressed as $\boldsymbol {{E}_i} = -\boldsymbol {\nabla } {V}_i$. Then (2.25) leads to a Laplace equation for ${V}_i$,
The boundary conditions at the far fields, i.e. (2.27) and (2.28), are also rewritten in terms of dimensionless velocity potentials ${\phi }_i$ and dimensionless voltage potentials ${V}_i$ as
Since the dimensionless voltage potentials have been normalized by the strength of the external horizontal electric field $\hat {E}_h$, in (3.4) the boundary conditions no longer explicitly depend on the strength of the electric field.
At the material interface, after expressing $\boldsymbol {{u}_i}$ and $\boldsymbol {n}$ in terms of ${\phi }_i$ and ${\eta }$, the kinematic condition (2.29) becomes
Similarly, (2.30) and (2.31) are rewritten in terms of ${V}_i$ and ${\eta }$ as
Due to the incompressible and irrotational properties of the fluids, the Euler equations, i.e. (2.21) and (2.22), can be integrated into the Bernoulli's equation
where ${h}$ is a constant that only depends on the initial conditions. After expressing $\boldsymbol {{E}_i}$ and $\boldsymbol {n}$ in terms of ${V}_i$ and ${\eta }$, (2.32) becomes
Combining (3.8) and (3.9), we obtain
Therefore, in terms of the velocity potentials $\phi _i$ and the voltage potentials $V_i$, our system is governed by (3.1)–(3.7) and (3.10), the forms of which are more convenient for theoretical analysis.
3.2. Unperturbed solutions
We first show the solutions for an unperturbed system ($a_0=0$), which is the base for our expansion. The governing equations for the unperturbed system are
These equations give the unperturbed voltage potentials $V_1^{(0)}$ and $V_2^{(0)}$,
Due to $a_0=0$, the governing equations give a trivial solution for the velocity potentials, namely $\phi _i^{(0)}=0$ $(i=1,2)$.
3.3. General expansion solutions
For a material interface with a small initial perturbation, i.e. $a_0 \ll 1$, we expand all physical quantities in terms of powers of $a_0$. This means that, for a function $f$, we expand it as
where the term $f^{(n)}$ is proportional to $a_0^n$. In particular, the material interface is expanded as
The derivation for the perturbation expansion procedure is given in Appendix A. Here we show the general perturbation solutions up to any order.
The governing equations for the $n$th-order ($n \geqslant 1$) perturbation solutions are listed in Appendix A (see (A7)–(A13)). In terms of perturbation expansion, the solutions to these equations are in the form of
We define the following notations that will appear frequently in our expansion:
The coefficient $a_{j}^{(n)}(t)$ in (3.18) for the interface $\eta$ is
which is the solution for the governing equation
and $\sigma _j$ given by (3.25) is the eigenvalue of this equation. The source term $F_{j}^{(n)}$ is
The explicit expressions for $R_{j}^{(n)}$, $\tilde {R}_{j}^{(n)}$, $S_{j}^{\prime (n)}$, $T_{j}^{(n)}$ and $U_{j}^{(n)}$ can be determined from (A16)–(A20) given in Appendix A. We comment that the right-hand side of (3.28), namely $R_{j}^{(n)}$, $\tilde {R}_{j}^{(n)}$, $S_{j}^{\prime (n)}$, $T_{j}^{(n)}$ and $U_{j}^{(n)}$, only contains solutions of order lower than $n$ (see Appendix A). Therefore, starting from the first order, $a_{j}^{(n)}$ can be solved from (3.27) order by order.
The coefficients $b_{j}^{(n)}(t)$ in (3.19) and $\tilde {b}_{j}^{(n)}(t)$ in (3.20) for fluid velocity potentials can then be determined from $a_{j}^{(n)}(t)$, i.e.
The coefficients $d_{j}^{\prime (n)}(t)$ in (3.21) and $\tilde {d}_{j}^{\prime (n)}(t)$ in (3.22) for voltage potentials can also be determined from $a_{j}^{(n)}(t)$. The results are
The detailed derivation for the perturbation solutions shown in this subsection can be found in Appendix B.
3.4. Explicit expressions for perturbation solutions
Equations (3.26)–(3.32) provide us with a general procedure to obtain perturbed solutions up to any order. Here we show the expressions for the perturbed interface up to the third order in terms of $a_0$. As we will show later, to give an accurate prediction for the perturbed interface, one must include all terms up to the third order.
The shape of the interface at time $t$, up to the order of $a_0^3$, can be described by
where the $n$th-order component $\eta ^{(n)} (t, x)$ $(n=1,2,3)$ are given below.
The first-order component is
with
The second-order component is
with
The third-order component is
with
Here the constants $c_m$ ($m=1,2,\ldots,10$) in (3.37), (3.39) and (3.40) are given by the following expressions:
The terms that are not displayed in (3.36) and (3.38) vanish. More specifically,
The derivation of the governing equations and the corresponding perturbation solutions for the first, second and third orders are given in Appendices C, D and E, respectively.
Taking the derivative of (3.33) with respect to $t$ gives the explicit expression for the velocity of an arbitrary point on the material interface up to the order of $a_0^3$,
where the three leading-order components $\dot {\eta }^{(n)} (t, x)$ $(n=1,2,3)$ are as follows.
The first-order component is
with
The second-order component is
with
The third-order component is
with
Here the constants $c_m$ ($m=1,2,\ldots,10$) in (3.56), (3.58) and (3.59) are given by (3.41)–(3.50).
4. Main results
The velocities and amplitudes of fingers (spikes and bubbles) at the material interface are very important quantities in the RTI dynamics. They represent the dominant features of an RT interface. Therefore, accurate predictions for the behaviour of spikes and bubbles are highly desirable in the theoretical studies of RT instability. In this section we will provide theoretical formulas for predicting the nonlinear behaviours of RT-type fingers in the presence of a horizontal electric field. We will present examples in which the nonlinear solutions are essential for accurate predictions of finger dynamics.
In our system, $A>0$ ($\hat {\rho }_1>\hat {\rho }_2$), namely the fluid on top is heavier than the fluid at the bottom. The material interface is unstable if the external horizontal electric field is absent, since gravity provides a destabilizing factor to the system. Now we consider this system with a horizontal electric field. By putting $x={\rm \pi}$ (for spikes) and $x=0$ (for bubbles) into (3.33), we obtain the explicit expressions for the bubble amplitude $\text {amp}_{bb}$ and the spike amplitude $\text {amp}_{sp}$. Up to the third order, the results are
and
where
is the first-order (linear) component,
is the second-order component and
is the third-order component. In (4.3)–(4.5), for a complex number $\xi = p + q i$ (where $p$ and $q$ are real),
Particularly, when $\xi$ is real, we have $C(\xi ) = \cosh (\xi )$ and $S(\xi ) = \sinh (\xi )$; when $\xi = q i$ is imaginary, we have $C(\xi ) = \cos (q)$ and $S(\xi ) = i \sin (q)$. We comment that when an eigenvalue $\sigma _j$ is not real, the values of $C$ and $S$ will be complex. Then the corresponding coefficients $c_m$ will also be complex. This leads to $a^{(n)}(t)$ being real.
After taking the derivatives of (4.1) and (4.2) with respect to $t$, we obtain the explicit expression for the velocity of bubbles and that of spikes (up to the third order),
where
is the first-order (linear) component,
is the second-order component and
is the third-order component. In (4.10)–(4.12), the expression of $C(\xi )$ and that of $S(\xi )$ are given by (4.6) and (4.7), respectively. We comment that expressions (4.3) and (4.10) are the linear theory derived in Eldabe (Reference Eldabe1989). The additional contributions from (4.4), (4.5), (4.11) and (4.12) are the nonlinear effects, which play an important role in our study.
5. Validation studies
In this section we will provide a comparison between the predictions from the nonlinear perturbation solution derived above, the predictions from the linear theory and the results from numerical simulations. We describe briefly the numerical method used in the simulations first, and then present the results for validation studies.
5.1. Numerical method
To conduct validation studies, we need the numerical solution of the governing equations given by (2.21)–(2.26) with the boundary conditions given by (2.27)–(2.32). Solving these equations directly requires performing numerical computations in two dimensions. However, it is the evolution of the material interface that we are interested in, not the solution in the interior of the fluids. For our system, the evolution of the material interface can be formulated in terms of vortex dynamics that only needs to solve a one-dimensional vortex sheet that coincides with the material interface, and no computation in the interior regions is needed. This is possible because the fluids are inviscid, incompressible and perfect dielectric. Therefore, there is no vorticity or bulk charge in the interior regions of the fluids. We will take the vortex sheet method in our numerical simulations.
The vortex sheet method is one of the numerical methods designed to tackle the problems that involve multi-phase fluids (Moore Reference Moore1981; Baker, Meiron & Orszag Reference Baker, Meiron and Orszag1982; Shin, Sohn & Hwang Reference Shin, Sohn and Hwang2018). This method has been successfully adapted in the study of the classical RTI (Baker, Meiron & Orszag Reference Baker, Meiron and Orszag1980; Kerr Reference Kerr1988; Sohn Reference Sohn2004; Shin, Sohn & Hwang Reference Shin, Sohn and Hwang2022), which does not involve electric fields. For inviscid and incompressible fluids, based on the Biot–Savart law, the vortex sheet method formulates the dynamics of the entire system into the evolution of vorticity confined to the material interfaces between the fluids (Baker et al. Reference Baker, Meiron and Orszag1980; Moore Reference Moore1981; Kerr Reference Kerr1988; Sohn Reference Sohn2004). Then one can determine the evolution of the material interface by solving a boundary integral equation at the material interface.
Our system is more complicated. It involves two inviscid, incompressible and perfect dielectric fluids in the presence of both gravitational force and external electric fields. Even so, we are still able to extend the vortex method to our system. Such an extension can be achieved due to the fact that the fluid velocity field and the electric displacement field in our system share the following important properties: Both of them are rotation free and can be expressed in terms of potentials; they are both divergence free and governed by the Laplace equation in the interior of fluids; both fields are continuous in the normal direction at the material interface. Therefore, similar to the fluid velocity field, the electric displacement field in our system can also be formulated in terms of a ‘vortex sheet’ and determined from a boundary integral equation. In the case of the classical RTI, one only needs to solve the boundary integral equation for fluid vorticity. In our case, one needs to solve two coupled boundary integral equations, one for fluid vorticity and the other for ‘vorticity’ in the electric displacement field. Although two vortex sheets exist in our system (one for the fluid velocity and the other for the electric field), both vortex sheets are confined to the same material interface and, therefore, have the same location. In other words, all physical quantities are only evaluated and evolved at the one-dimensional material interface during the computation.
Here we provide the key steps for the vortex dynamics formulation of our system. The vortex strength, which is the jump in the dimensionless tangential velocity across the material interface, is defined as
Since the velocities of the two fluids are not identical at the material interface ($\boldsymbol {u_1} \ne \boldsymbol {u_2}$), the motion of the material interface follows the average velocity
Due to the incompressible and irrotational properties of the fluids, i.e. (2.23) and (2.24), the velocity of the material interface $\bar {\boldsymbol {U}}$ can be expressed in terms of the vortex strength $\gamma$ based on the Biot–Savart law,
Here $L$ denotes the whole material interface that contains an infinite number of periods, $\text {p.v.}$ denotes the Cauchy principal value of an integral, $s$ denotes the dimensionless arclength coordinate at the material interface and $\tilde {\boldsymbol {k}}$ is the unit vector perpendicular to the two-dimensional plane of the fluid system. Since the horizontal boundaries of the system are periodic, (5.3) can be simplified as
where $\xi = x+{\rm i}z$ is the complex notation of the interface location, $\bar {U}_x$ and $\bar {U}_z$ are the horizontal and vertical components of $\bar {\boldsymbol {U}}$, $l$ is one period of the material interface (due to the property of periodicity, it can be any period), and the notation $\widetilde {({\cdot })} \equiv ({\cdot })(\tilde {s})$ denotes the dummy variables in the integration along the interface. We comment that the velocity field given by (5.4) satisfies the far-field boundary condition given by (2.27).
The electric displacement field in our system can be formulated similarly. For the electric displacement field, we define the dimensionless electric displacement in fluid $1$ by
and the dimensionless electric displacement in fluid $2$ by
Similar to the velocity field, we define the ‘vortex strength’ for the dimensionless electric displacement field by
which is the jump in the tangential component of the dimensionless electric displacement field at the material interface. The electric displacement field at the material interface is defined by the average electric displacement of the two fluids
Due to (2.25) and (2.26) and the Biot–Savart law, we have
where $\boldsymbol {D^{ext}}$ is the contribution of the external electric field. Based on (5.5) and (5.6) and the boundary condition given by (2.28), the horizontal component of $\boldsymbol {D^{ext}}$ is ${D^{ext}_x} = \frac {1}{2}[{(1+A_\epsilon )}/{2} + ({1-A_\epsilon )}/{2}] = \frac {1}{2}$, namely the average electric displacement due to the external electric field, and the vertical component is $D^{ext}_z = 0$. Due to the periodicity of our system in the horizontal direction, (5.9) can then be simplified as
where $\bar {D}_x$ and $\bar {D}_z$ are the horizontal and vertical components of $\bar {\boldsymbol {D}}$, respectively.
Based on the vortex dynamics formulation for the velocity and electric displacement fields, the evolution of the material interface can then be represented by the following one-dimensional integral equations along the material interface in terms of dimensionless variables:
where
In (5.11), $\boldsymbol {X} = (x, z)$ is the location of the material interface. In (5.12) and (5.18), $s^-$ and $s^+$ denote the dimensionless arclength coordinates of the starting and ending points of an arbitrary segment at the material interface, and $\varGamma$ is the dimensionless vorticity residing in the segment. The Atwood number for fluid densities $A$ and that for electric permittivities $A_\epsilon$ in (5.12), (5.13), (5.19) and (5.20) are defined in (2.13) and (2.14).
We comment that the formulation given by (2.21)–(2.32) and the vortex sheet formulation given by (5.11)–(5.17) are equivalent. More specifically, (5.14) and (5.15) given by the Biot–Savart law for the velocity field satisfy (2.23), (2.24), (2.27) and (2.29); (5.16) and (5.17) given by the Biot–Savart law for the electric displacement field satisfy (2.25), (2.26), (2.28) and (2.30). Equation (5.13) corresponds to the boundary condition given by (2.31). Equation (5.12) can be obtained by taking the difference between (2.21) and (2.22) and simplifying the resulting equation by the boundary condition (2.32). Equation (5.11) simply comes from the definition. Therefore, although the two formulations are different, they both solve exactly the same system and have the same solution. There is no simplification between these two formulations. However, conducting numerical simulations based on the vortex sheet method has the following three distinct advantages for our system. (1) The vortex sheet method only needs to perform one-dimensional computation along the material interface, rather than two-dimensional computation based on solving (2.21)–(2.32). This leads to a saving in computing time. (2) The key issue for the RTI is to determine how fast the fingers at the material interface grow with time. Therefore, an accurate determination of the shape and location of the material interface is very important. In the vortex sheet method, its data structure directly represents the shape and location of the material interface. On the other hand, the usual numerical methods for solving (2.21)–(2.32) in the two-dimensional physical space need to construct or estimate these quantities from the two-dimensional grid-based data. Such constructions or estimations usually contain more numerical diffusion. Therefore, the vortex sheet method can compute the velocity of fingers more accurately. (3) The domain of our system is infinite in the vertical direction. However, the numerical simulation based on a two-dimensional computation of (2.21)–(2.32) can only be performed in a finite computational domain, and one must introduce the upper and lower boundaries for the finite computational domain and impose certain boundary conditions at these numerical boundaries. Such numerical boundaries are not needed in the vortex sheet method, since the computation is solely and directly performed at the material interface.
Evaluations of (5.14)–(5.17) encounter singularities when $(\tilde {x},\tilde {z})$ approaches $(x,z)$. Krasny introduced a desingularization parameter $\delta >0$ in the equations of the Biot–Savart law (Krasny Reference Krasny1986). Linear stability analysis showed that this desingularization method diminished the short wavelength instability and yielded numerically more tractable equations (Krasny Reference Krasny1986). Applying Krasny's method, we introduce the desingularization parameter $\delta$ in the Biot–Savart law for computing the average velocity and the average electric displacement at the material interface,
The introduction of the desingularization parameter $\delta ^2$ in Krasny's method removes the singularities in the Biot–Savart law, but it also reduces the numerical solution. We have used $\delta ^2=0.02$ in all our simulations. Although the error due to the desingularization parameter $\delta ^2$ is small, by applying the technique of repeated Richardson extrapolation we further reduce the error (Richardson Reference Richardson1910). More specifically, we applied the Richardson extrapolation technique twice. All results in our validation studies are obtained with this repeated Richardson extrapolation technique. We have implemented this vortex sheet method with the repeated Richardson extrapolation technique and conducted validation studies to verify the consistency and accuracy of this numerical method. Since the derivation and the implementation details of this numerical method are lengthy, the details will be presented in a separate paper focused on the numerical method.
5.2. Validation studies of the nonlinear perturbation solutions
The central issue in the study of the RTI is to predict how the overall mixing layer between the two fluids grows with time. The overall mixing layer is characterized by the vertical distance between the tip of the spike and that of the bubble. A half of this distance is known as the overall amplitude of the fingers. This is the most important and widely considered quantity for the RTI. Researchers are interested in how the overall amplitude changes with time and at what speed it changes, namely the overall velocity. Due to the symmetry in the functional form given by (3.18), all even-order terms in the perturbation solutions do not contribute to the overall amplitude or the overall velocity. Therefore, the first-order solution and the solution up to the second order give the same prediction for the overall amplitude/velocity. Similarly, the solution up to the third order and that up to the fourth order give the same prediction for the overall amplitude/velocity. From (4.8) and (4.9), we have the overall velocity
where $v^{(1)}(t)$ and $v^{(3)}(t)$ are given by (4.10) and (4.12), respectively. From these two equations, (5.25) can be rewritten as
where $\dot {a}_{1}^{(1)}(t)$, $\dot {a}_{1}^{(3)}(t)$ and $\dot {a}_{3}^{(3)}(t)$ are given by (3.54), (3.58) and (3.59), respectively. As we stated earlier, since the second-order solution does not enter $v_{ov}$, one needs to include at least the third-order solution to exploit the nonlinear effects of the overall velocity.
Now we compare the predictions for the overall velocity from the first-order solution (namely the linear theory) and those from the solution up to the fourth order given by (5.26) with the data from numerical simulations. Our system involves four fundamental physical parameters: the dimensionless initial amplitude $a_0$, the fraction of the driving forces due to the horizontal electric field $E_h^2$, the dielectric Atwood number $A_\epsilon$ and the Atwood number $A$. This is a four-dimensional phase space. We will set a base point in the phase space, and vary one parameter at a time in the phase space to conduct our validation studies. Since our solution is based on the perturbation expansion of the dimensionless initial amplitude $a_0$, $a_0$ should be small. We choose $a_0 = 0.1$ as the base point. In our system, two competing forces act on the material interface, the strengths of which are represented by the fraction of the driving forces due to gravity $g$ and the fraction of the driving forces due to the external horizontal electric field ${E_h}^2$. Since $g + {E_h}^2 = 1$, we choose $g = {E_h}^2 = 1/2$ as our base point. Both $|A|$ and $|A_{\epsilon }|$ vary from 0 to 1. Therefore, we choose $A = 0.5$ and $A_{\epsilon } = 0.5$ as our base point. In figures 2–5 we plot the normalized overall velocity of fingers $v_{ov}/a_0$ versus the dimensionless time $t$. In each figure we vary one of the four physical parameters aforementioned, namely $a_0$ in figure 2, ${E_h}^2$ in figure 3, $A_\epsilon$ in figure 4 and $A$ in figure 5. If we kept all three remaining parameters at the base point in each figure, there would be repeated subfigures among figures 2–5. To avoid such repetitions and maximize the information extracted from the phase space, we will choose one or two of the remaining parameters to deviate away from the base point. The rest of the remaining parameters are located at the base point.
In figure 2 we set $g = {E_h}^2 = 1/2$, $A = 0.6$ and $A_{\epsilon } = 0.5$ as the constant parameters, and vary $a_0$ from $0.1$ to $0.8$. For each subsequent subfigure, we double the dimensionless amplitude of the initial perturbation. In figure 2(a)–2(d), $a_0$ is $0.1, 0.2, 0.4$ and $0.8$, respectively. Figure 2 shows that the contributions from the nonlinear terms are important. By including the nonlinear correction terms, the nonlinear perturbation solution provides predictions that agree with the numerical data better than the linear theory and, thus, provides a larger range of validity for theoretical prediction. Particularly, in figure 2(d) where the dimensionless amplitude of the initial perturbation is large ($a_0=0.8$), the nonlinear effects are important even at early times. In this case, the prediction from the linear theory deviates from the numerical results early ($t \approx 0.6$), while the nonlinear perturbation solution provides a reasonable prediction up to three times longer time ($t \approx 2$). Figure 2 shows that the larger $a_0$ is, the earlier the nonlinear contribution occurs, as one expected.
In figure 3 we vary the dimensionless strength of the external horizontal electric field $E_h^2$ and plot the normalized overall velocity of fingers versus the dimensionless time. In figures 3(a)–3(d) we begin with a weak horizontal electric field and double its strength in each subsequent case until the horizontal electric field suppresses the interfacial instability. More precisely, we vary the ratio of the gravitational force to the electric-field force $g/E_h^2 = 64$, $16$, $4$ and $1$. These values correspond to the dimensionless electric-field strength $E_h^2$ being $1/{65}$, $1/{17}$, $1/{5}$ and $1/{2}$, respectively. This covers the cases from a situation in which the material interface is dominated by gravity-induced instability to that in which the interface is close to the stable state. The other parameters are $a_0 = 0.1$, $A = 0.4$ and $A_{\epsilon } =0.6$. Figure 3 shows that the regime of validity of the nonlinear perturbation solution is larger than that of the linear theory in all cases. Particularly, when $E_h^2=1/{2}$, the nonlinear perturbation solution provides much more accurate predictions than the linear theory. Figure 3 also shows that both the nonlinear perturbation solution and the linear theory are valid over a larger temporal domain as the strength of the horizontal electric field $E_h^2$ increases. This is because as $E_h^2$ increases, the material interface becomes less unstable. Therefore, the finger amplitude grows at a slower rate, which extends the regime of validity of both theories over a longer period of time.
In figure 4 we vary the dielectric Atwood number $A_\epsilon$. Since $A_\epsilon$ lies in the range $[ -1, 1 ]$ and we have presented the results for $A_\epsilon = 0.5$ and $0.6$ in figures 2 and 3, to explore more points in the phase space, we present the results for $A_\epsilon = -0.1$, $-0.3$, $-0.5$ and $-0.7$ in figures 4(a)–4(d), respectively. The other parameters are $a_0=0.2$, $A=0.5$ and $g = {E_h}^2 =1/{2}$. Figure 4 shows that the predictions of the nonlinear perturbation solution are valid in a larger regime than those of the linear theory in all cases. Particularly, when $A_\epsilon =-0.7$, the prediction of the linear theory deviates significantly from the numerical results as early as $t \approx 2$ (see figure 4d). The importance of the nonlinear behaviour is clearly shown by the numerical results and captured by the nonlinear perturbation solution in figure 4(d). As $A_\epsilon$ changes from $-0.1$ the $-0.7$, the material interface becomes less unstable, and the regime of validity of the nonlinear perturbation solution becomes larger consequently. For $A_\epsilon \leqslant -0.8$, the effects of the driving force due to the horizontal electric field become dominant such that the interface becomes stable.
In figure 5 we vary the Atwood number $A$ and present the validation study for $A = 0.3$, $0.5, 0.7$ and $1.0$ in figures 5(a)–5(d), respectively. The other parameters are $a_0=0.1$, $A_\epsilon =-0.5$ and $g = {E_h}^2 =1/{2}$. Similar to the previous comparisons, figure 5 also shows that the predictions of the nonlinear perturbation solution are valid in a larger regime than that of the linear theory. Since the increase of $A$ destabilizes the system, both the regime of validity of the nonlinear perturbation solution and that of the linear theory become smaller as $A$ increases. For $0 \leqslant A \leqslant 0.2$, the destabilizing effects from gravity are weak and the stabilizing effects from the horizontal electric field dominate, such that the material interface becomes stable.
The nonlinear theoretical prediction for the overall velocity given by (5.26) only contains the contributions up to $O(a_0^4)$. For an unstable material interface, the contributions from the terms of higher orders become important as time progresses. Then the predictions of the nonlinear perturbation solution given by (5.26) will also start to deviate from the numerical solutions. Such a deviation is a complicated function of the four parameters $a_0$, $E_h^2$, $A$ and $A_\epsilon$. Depending on where the system sits in the four-dimensional phase space, the deviation can be an overestimate or an underestimate. For example, in figure 3(c) the nonlinear perturbation solution starts to underestimate the overall velocity around $t=6$, while in figure 3(d) the nonlinear perturbation solution starts to overestimate the overall velocity around $t=18$. To verify that our solution for the overall velocity up to the fourth order, namely the terms $\dot {a}_1^{(1)}$, $\dot {a}_1^{(3)}$ and $\dot {a}_3^{(3)}$ in (5.26), is correct even in the time range in which the theoretical predictions deviate from the numerical results, we need a method for extracting the values of these terms from the data of numerical simulations. Then it allows us to compare the extracted numerical results with the theoretical predictions for $\dot {a}_1^{(1)}$, $\dot {a}_1^{(3)}$ and $\dot {a}_3^{(3)}$ given by (3.54), (3.58) and (3.59). A good agreement between these two will not only prove the correctness of our theoretical formula given by (5.26) but also confirm that the deviation between the numerical results and the theoretical predictions is indeed due to the contributions from the orders higher than those in (5.26). We achieve this by the following method.
From (3.17) and (3.18) the material interface can also be expressed in terms of Fourier modes
where
We first perform the cosine Fourier transform for $\cos (jx)$ ($j=1,3$) to the numerical data for the shape of the material interface $\eta (t,x)$ at time $t$ to obtain $\tilde {a}_j (t)$. Note that due to symmetry, the even modes $\cos (jx)$ ($j=0,2,4,\ldots$) do not contribute to the overall amplitude and, consequently, not to the overall velocity. By conducting several numerical simulations for different values of $a_0$ and applying the resulting data to (5.30), we obtain a set of linear equations for the coefficients $\tilde {c}_{j}^{(n)}(t)$ (see (F5) in Appendix F). By solving this set of linear equations, we obtain the corresponding $\tilde {c}_{j}^{(n)}(t)$ from the numerical simulations. Then from the relation $a_{j}^{(n)}(t) = \tilde {c}_{j}^{(n)} (t) a_0^n$ (see (5.30)), we can extract the information about $a_{j}^{(n)}(t)$ from the data of numerical simulations. The details of the theoretical derivation for this method can be found in Appendix F. Finally, by applying the central difference approximation to the value of $a_{j}^{(n)}(t)$, we obtain the results of $\dot {a}_{j}^{(n)}(t)$ from the data of numerical simulations and present the results in figures 6 and 7.
In figures 6 and 7 we investigate the material interfaces in figures 3(c) and 3(d). We compare the theoretical predictions for the normalized interface coefficients $\dot {a}_1^{(1)}/a_0$, $\dot {a}_1^{(3)}/a_0$ and $\dot {a}_3^{(3)}/a_0$ given by (3.54), (3.58) and (3.59) with the extracted results from numerical simulations obtained by the method we have explained above (see also (F7)–(F9)). Note that the coefficients $\dot {a}_1^{(2)}$ and $\dot {a}_2^{(3)}$ are not plotted since they are identically zero. Here $\dot {a}_2^{(2)}$ and the fourth-order coefficients are not plotted since they do not contribute to the overall velocity. Figure 6 corresponds to the system shown in figure 3(c), in which the nonlinear perturbation solution gives an underestimation at late times, and figure 7 corresponds to the system shown in figure 3(d), in which the nonlinear perturbation solution gives an overestimation at late times. In figures 6 and 7 the blue solid curves are the theoretical predictions and the blue ‘$\circ$’ symbols are the numerical results.
Figures 6 and 7 show that $\dot {a}_1^{(1)}/a_0$, $\dot {a}_1^{(3)}/a_0$ and $\dot {a}_3^{(3)}/a_0$ extracted from the data of numerical simulations are in good agreement with our theoretical results for the interface coefficients. This is true even at the late times of the simulations conducted in figures 3(c) and 3(d), at which the theoretical predictions for the overall velocity have already deviated from the numerical results. This is due to the fact that by the method that we discussed above, we are able to extract just the information about each individual coefficient $a_{j}^{(n)}(t)$ from the data of numerical simulations. One may notice that, at late times, the numerical results shown in figure 7(c) are slightly lower than the theoretical values. This is because in the numerical method one needs to introduce a numerical parameter $\delta$ to regularize the singularity on the vortex sheet (see (5.21)–(5.24) and also (12) and (13) in Sohn Reference Sohn2004). This desingularization parameter will slightly smoothen the interface. Such a reduction in the overall velocity is only noticeable for high-frequency modes and for large times. This is why it only appears at the late times of figure 7(c).
Figures 6 and 7 show good agreement between the nonlinear theoretical predictions and the numerical results for $\dot {a}_1^{(1)}$, $\dot {a}_1^{(3)}$ and $\dot {a}_3^{(3)}$ even in the time domain in which the nonlinear perturbation solution underestimates/overestimates (see figure 3c/3d). This confirms that the derived perturbation expansion coefficients given by (3.54), (3.58) and (3.59) are correct. It also confirms that the deviation between the nonlinear perturbation solution and the numerical data is due to the contributions from the higher-order terms since our solution for the overall velocity given by (5.26) is only up to the fourth order of $a_0$. Now we explain why our theoretical prediction given by (5.26) underestimates in figure 3(c) but overestimates in figure 3(d). In general, whether the nonlinear perturbation solution given by (5.26) provides an underestimation or overestimation for the overall velocity of fingers involves complicated interplay between $\dot {a}_1^{(1)}$, $\dot {a}_1^{(3)}$, $\dot {a}_3^{(3)}$ and the contributions from higher orders. Figure 6 shows that $\dot {a}_1^{(1)}$ is positive, but both $\dot {a}_1^{(3)}$ and $\dot {a}_3^{(3)}$ are negative. This is why the corresponding prediction from the nonlinear perturbation solution shown in figure 3(c) underestimates the overall velocity at late times. On the contrary, figure 7 shows that $\dot {a}_1^{(1)}$, $\dot {a}_1^{(3)}$ and $\dot {a}_3^{(3)}$ are all positive. This leads to an overestimate of the overall velocity by the nonlinear perturbation solution, as shown in the corresponding figure 3(d).
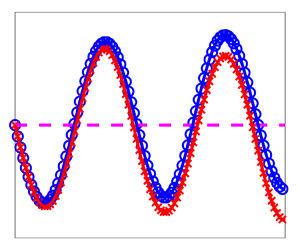
In figures 8 and 9 we present the validation study for the velocity of bubbles and that of spikes. Figure 8 is for the comparison of the normalized finger velocities, namely $v_{bb}/{a_0}$ and $v_{sp}/{a_0}$, between the numerical results (bubble:‘$\circ$’, spike: ‘$\times$’) and the theoretical predictions up to the first (magenta curve), second (black curve) and third (bubble: blue curve, spike: red curve) orders given by (4.10)–(4.12). The dimensionless physical parameters for figure 8 are $A = 1$, $A_\epsilon = 0.5$, $E_h^2 = 4/5$ and $a_0 = 0.01$. For this set of parameters, the system is linear neutral, i.e. $\sigma _1 = 0$, which is the turning point between the stable case and the unstable case in the linear analysis. In this case $F_1^{(1)}=0$ and (3.27) gives ${{\rm d}^2 a_{1}^{(1)}}/{{\rm d}t^2} = 0$. From the initial conditions $a_{1}^{(1)}(0) = a_0$ and $\dot {a}_{1}^{(1)}(0)=0$, one obtains $a_{1}^{(1)}(t) = a_0$ and $v^{(1)}(t) = \dot {a}_{1}^{(1)}(t) = 0$. Thus, the linear analysis predicts that the fingers do not grow at all. If we consider the solutions only up to the second order, the spike and the bubble exhibit oscillating motion, but grow at the same rate. Only when we expand the solutions up to the third order in terms of the initial perturbation amplitude, i.e. $a_0^3$, the theoretical prediction correctly shows that the spike grows faster than the bubble. Hence, to provide a qualitatively correct prediction for these fingers, one needs the solutions expanded up to the third order, which are displayed in (4.8) and (4.9).
In figure 9 we plot the normalized velocities of bubbles $v_{bb}/{a_0}$ and those of spikes $v_{sp}/{a_0}$ for various strengths $E_h^2 = 1/6, 1/3, 3/5$. The other dimensionless physical parameters are $A = 0.6$, $A_\epsilon = 0.5$, $a_0=0.1$. For all cases in this figure, the system is unstable. The blue solid curves are the predictions from the nonlinear perturbation solution given by (4.8) and (4.9), and the black solid curves are the predictions from the linear theory. The ‘$\circ$’ symbols are the data from numerical simulations. The figures in the left (right) column are for bubble (spike) velocities. Figure 9 shows that the nonlinear theoretical predictions are in good agreement with the numerical results and capture the nonlinear behaviour of bubbles and that of spikes. Figure 9 also shows that as the horizontal electric field becomes stronger, both bubbles and spikes grow more slowly due to the stronger stabilization effect.
6. Analysis of effects of horizontal electric fields
Now we study the effects of the horizontal electric field. When the electric permittivities of the two fluids are equal ($\hat {\epsilon }_1 = \hat {\epsilon }_2$), namely $A_\epsilon = 0$, it is easy to check that the electric field plays no role in the governing equations given by (2.21)–(2.26) and the boundary conditions given by (2.27)–(2.32). Then the problem reduces to the classical RTI problem. Since we are interested in the effects of external electric fields on the material interface, we assume that $A_\epsilon \ne 0$ in the rest of our discussions.
We investigate how the horizontal electric field affects the instability of the material interface. The amplitude of each mode $a_j^{(n)}$ is governed by (3.27) with its eigenvalue $\sigma _j$ given by (3.25). Equation (3.25) shows that the larger $E_h^2$ is, the smaller $\sigma _j^2$ is. Therefore, the horizontal electric field provides a stabilization factor to the fingers. We comment that the sign of $E_h$ does not affect the hydrodynamics of the material interface since (3.33)–(3.50) only depend on $E_h^2$. Therefore, whether the direction of the horizontal electric field points from left to right or from right to left, its effects on the evolution of the material interface are identically the same.
Let $j^*$ be the smallest $j$ such that $\sigma _{j^*}^2 = j^* (Ag - j^* A_\epsilon ^2 E_h^2) < 0$, namely $j^* = \text {ceil}({Ag}/{A_\epsilon ^2 E_h^2})$. Then (3.25) shows that all modes with $j \geqslant j^*$ are stable. The larger $j$ is, the smaller the value of $\sigma _j^2$, and the more stable that mode. Particularly, when $j^*=1$, i.e. when $E_h^2 > (E_h^*)^2 = Ag/A_\epsilon ^2$, all modes including the linear mode are stable. Therefore, if the linear analysis shows that the system is linearly stable, the system is stable for all modes, including the high-order nonlinear modes. However, if the linear analysis shows that the system is linearly unstable, the modes with $j < j^*$ are also unstable, but the modes with $j \geqslant j^*$ are stable.
7. Analysis of effects of electric permittivities
In the previous section we have shown that, if the direction of the horizontal electric field is reversed, the hydrodynamics of the system is not altered. One might wonder what happens if one switches the electric permittivities of the two fluids. Will this cause any effects on the motion of the material interface? The linear theory predicts that the amplitude of the material interface, namely $a_1^{(1)}(t)$, remains the same if the values of the electric permittivities $\hat {\epsilon }_1$ and $\hat {\epsilon }_2$ are switched. This is because the linear theory given by (3.35) and its growth rate $\sigma _1$ given by (3.25) only depend on $A_\epsilon ^2$ and interchanging $\hat {\epsilon }_1$ and $\hat {\epsilon }_2$ only changes the sign of $A_\epsilon$. However, the numerical simulations conducted by Yang et al. (Reference Yang, Li, Zhao, Shao and Xu2016) showed that the interfacial morphology evolves differently if the electric permittivities of the fluids are interchanged. Yang et al.'s study is for a complicated system, namely a system with viscosity and surface tension. In figure 10 we show that the same phenomenon still exists for a much simpler system, namely for inviscid fluids without surface tension. For all figures in this section, the dimensionless physical parameters are $A=0.5$, $A_\epsilon =\pm 0.5$, $E_h^2=1/5$ and $a_0=0.05$. In figure 10(a) we present the difference between the normalized bubble amplitude before switching the electric permittivities ($A_\epsilon =0.5$) and that after the switching ($A_\epsilon =-0.5$), namely $\varDelta |\mathrm {amp}_{bb}|/a_0 = (|\mathrm {amp}_{bb}(A_\epsilon =0.5)| - |\mathrm {amp}_{bb}(A_\epsilon =-0.5)|)/a_0$. Figure 10(b) is the corresponding difference for spikes, namely $\varDelta |\mathrm {amp}_{sp}|/a_0 = (|\mathrm {amp}_{sp}(A_\epsilon =0.5)| - |\mathrm {amp}_{sp}(A_\epsilon =-0.5)|)/a_0$. In figure 10 the red dashed lines are the predictions from the linear theory, which predicts that such a difference is zero since the theory only depends on $A_\epsilon ^2$; the curves marked by the ‘$\circ$’ symbols are the results from numerical simulations, which show that the difference is non-zero. This is because although the finger growth is suppressed by the horizontal electric field both in the system before the switching ($A_\epsilon =0.5$) and in the system after the switching ($A_\epsilon =-0.5$), the degree of suppression is different. The rising bubble for $A_\epsilon = 0.5$ grows more slowly than that for $A_\epsilon = -0.5$. Consequently, the vertical location of the rising bubble tip for $A_\epsilon = 0.5$ is lower than that for $A_\epsilon = -0.5$. Similarly, the falling spike for $A_\epsilon = 0.5$ grows faster than that for $A_\epsilon = -0.5$. Hence, the vertical location of the falling spike tip for $A_\epsilon = 0.5$ is also lower than that for $A_\epsilon = -0.5$. This confirms the phenomenon shown in figure 9 of Yang et al. (Reference Yang, Li, Zhao, Shao and Xu2016) that switching the electric permittivities of the fluids does have effects on the dynamics of fingers. Since the solution of the linear theory does not depend on the sign of $A_\epsilon$, the effects of switching electric permittivities shown in figure 10 are solely due to the nonlinear dynamics. To verify this, in figure 10 we also show the predictions from our nonlinear perturbation solution (blue solid curves), which are in good agreement with the results from numerical simulations. Next, we provide theoretical explanations about the nonlinear effects caused by switching the electric permittivities.
To shed more light on the effects of interchanging electric permittivities and to understand better how the electric field affects the dynamics of the fluids, we investigate the electrical force at the material interface. The dimensionless stress tensors at the material interface, i.e. $\boldsymbol{\mathsf{T}}_{\boldsymbol{\mathsf{1}}}$ for fluid $1$ and $\boldsymbol{\mathsf{T}}_{\boldsymbol{\mathsf{2}}}$ for fluid $2$, are given by (2.19) and (2.20). The components in these stress tensors attributed to electrodynamics are
These give the resulting normal stresses at the two sides of the material interface
Due to the difference in the electric field and the difference in the electric permittivity across the material interface, there exists a difference between $f_1^e$ and $f_2^e$. This leads to an electrical force exerted on the material interface, which is defined by
where $D_n = (1+A_\epsilon ) (\boldsymbol {{E}_1} \boldsymbol {\cdot } \boldsymbol {n}) /2 = (1-A_\epsilon ) (\boldsymbol {{E}_2} \boldsymbol {\cdot } \boldsymbol {n}) /2$ and $E_s = \boldsymbol {{E}_1} \boldsymbol {\cdot } \boldsymbol {s} = \boldsymbol {{E}_2} \boldsymbol {\cdot } \boldsymbol {s}$ are both continuous at the material interface (see (2.30) and (2.31)). Since $|A_\epsilon | < 1$, one can check from (7.6) that the electrical force points from the high-permittivity fluid to the low-permittivity fluid: when $A_\epsilon > 0$ ($\hat {\epsilon }_1>\hat {\epsilon }_2$), namely when the permittivity of the upper fluid is larger than that of the lower fluid, the electrical force points from the upper fluid to the lower fluid (${f}_e<0$); on the other hand, when $A_\epsilon < 0$ ($\hat {\epsilon }_1<\hat {\epsilon }_2$), namely when the permittivity of the upper fluid is smaller than that of the lower fluid, the electrical force points from the lower fluid to the upper fluid (${f}_e>0$).
The dimensionless electrical force along the material interface given by (7.5) can be expressed in terms of the voltage potentials
Here the voltage potentials $V_i$ ($i=1,2$) are given by
and the explicit expressions for the coefficients $d_{j}^{\prime (n)}$ and $\tilde {d}_{j}^{\prime (n)}$ in the three leading orders ($n = 1,2,3$) are given in Appendix G. We comment that $f_e$ given by (7.7) has a factor of $E_h^2$, namely the magnitude of the electrical force is proportional to the square of the strength of the external horizontal electric field. The remaining factors in (7.7) do not explicitly depend on $E_h$ and represent the distribution of the electrical force along the material interface. Substituting (3.17), (3.18), (7.8) and (7.9) into (7.7), one can obtain the expression for $f_e$ in terms of perturbation expansion. The following are the explicit expressions for the leading terms of the electrical force:
Here
The explicit expressions for the partial derivatives in (7.12)–(7.14) are given in Appendix H.
Figure 11 is an illustration of the electrical force at the material interface when a horizontal electric field is applied. It shows that the force in the case $A_\epsilon >0$ and the force in the case $A_\epsilon <0$ have opposite directions. This is because the electrical force points from the high-permittivity fluid to the low-permittivity one, as shown by (7.6). The electrical force causes the reduction in finger growth. However, such a cause is not so obvious when one inspects figure 11. This is because there are three factors that affect the electrical force on the material interface: (1) the dimensionless strength of the horizontal electric field $E_h$; (2) the difference in the electric permittivities of the two fluids, namely $A_\epsilon$; (3) the shape of the material interface. The contributions from the first and second factors exist even for an unperturbed flat interface ($a_0=0$), namely $f_0 = -E_h^2 A_\epsilon /2$, which is the dimensionless electrical force at the unperturbed interface. However, for an unperturbed material interface, the electric field in each fluid is uniform. Consequently, a dimensionless electrical force of magnitude $f_0$ is exerted uniformly on the interface. This force is balanced by the constraint of mass conservation since the fluids are incompressible. The situation is quite different once the interface is perturbed. The electric fields in the fluids evolve dynamically with the shape of the interface. Then the electrical force $f_e$ deviates from $f_0$ and is no longer uniform along the interface. It is the difference $f_e - f_0$ that provides the effective electrical force on the perturbed interface. Figure 12 is an illustration of $f_e - f_0$ along the material interface. Figure 12 shows that for both $A_\epsilon > 0$ and $A_\epsilon < 0$, the horizontal electric field provides an upward effective electrical force on the falling finger tip and a downward effective electrical force on the rising finger tip. Both effects lead to the suppression of finger growth. Therefore, both the bubbles and the spikes in the presence of a horizontal electric field grow more slowly than the bubbles and the spikes in the classical RTI, respectively. Figure 12 provides an intuitive understanding of the phenomenon observed in the numerical simulations conducted by Cimpeanu et al. (Reference Cimpeanu, Papageorgiou and Petropoulos2014) and Yang et al. (Reference Yang, Li, Zhao, Shao and Xu2016). Namely, a horizontal electric field always suppresses the instability of the material interface, as long as there is a difference in electric permittivities between the two fluids, no matter whether $A_\epsilon$ is positive or negative.
Figures 12(a) and 12(b) have the same physical parameters except that the values of $\hat {\epsilon }_1$ and $\hat {\epsilon }_2$ are switched, namely in these two figures $A_\epsilon$ has the same magnitude but opposite signs. Figure 12 contains two important properties. The first one is that the material interface is stabilized by the horizontal electric field as long as $A_\epsilon \ne 0$. This property is obvious in figure 12. The second one is not that obvious: Although figures 12(a) and 12(b) may look similar, they are quantitatively different. It is this difference that leads to the non-zero values in figure 10. To investigate this property, in figure 13 we plot the difference in the vertical component of the effective electrical force between figures 12(a) and 12(b), namely $\Delta f_z(A_\epsilon =0.5) - \Delta f_z(A_\epsilon =-0.5)$, where $\Delta f_z = n_z {\cdot } (f_e - f_0) / |f_0|$ is the vertical component of the normalized electrical force difference $f_e - f_0$. Here $f_e - f_0$ is the additionally induced electrical force when the interface shape deviates from the flat one. We comment that $n_z$ is the vertical component of the normal unit vector $\boldsymbol {n}$ at the interface, which points from the lower fluid to the upper fluid (see figure 1). Therefore, $n_z {\cdot } (f_e - f_0) >0$ indicates that the effective electrical force is pointing upward, and $n_z {\cdot } (f_e - f_0) <0$ indicates that the effective electrical force is pointing downward. In figure 13 the solid curve is the theoretical prediction from the nonlinear perturbation solution up to the third order, and the ‘$\circ$’ symbols are numerical results. Since $\Delta f_z$ is a force on the material interface, the difference $\Delta f_z(A_\epsilon =0.5) - \Delta f_z(A_\epsilon =-0.5)$ reflects the change in the force due to the interchange of electric permittivities of the two fluids. Figure 13 shows that the change $\Delta f_z(A_\epsilon =0.5) - \Delta f_z(A_\epsilon =-0.5)$ is negative, i.e. $\Delta f_z(A_\epsilon =0.5) < \Delta f_z(A_\epsilon =-0.5)$, at both the rising finger tip ($x=0$) and the falling finger tip ($x=\pm {\rm \pi}$). Since the horizontal electric field exerts a downward effect at the rising finger tip (see figure 12), $\Delta f_z(A_\epsilon =0.5) < \Delta f_z(A_\epsilon =-0.5)$ indicates that the rising finger tip for $A_\epsilon = 0.5$ is pushed down harder by the electrical force than that for $A_\epsilon = -0.5$. Therefore, the rising finger (i.e. bubble) grows more slowly for $A_\epsilon = 0.5$ than for $A_\epsilon = -0.5$. Conversely, the falling finger tip experiences an upward effect from the horizontal electric field, and figure 13 indicates that such an effect for $A_\epsilon = 0.5$ is smaller than that for $A_\epsilon = -0.5$. This leads to the falling finger (i.e. spike) growing faster for $A_\epsilon = 0.5$ than for $A_\epsilon = -0.5$. These differences in the electrical force at finger tips explain the differences in finger growth shown in figure 10 when the electric permittivities $\hat {\epsilon }_1$ and $\hat {\epsilon }_2$ are switched. We comment that such differences are due to the nonlinear interaction between the distribution of the electric fields and the shape of the material interface. Since the linear theory does not consider nonlinear factors, it predicts that switching the electric permittivities of the fluids has no effects and gives zero difference in the finger growth, as shown in figure 10. We also comment that the phenomenon shown in figure 13 does not depend on the sign of $A$, namely it does not depend on whether the upper fluid is heavier or lighter than the lower fluid. In the example shown in figure 13, the heavy fluid is on top of the light fluid ($A>0$), i.e. the rising finger is the bubble and the falling finger is the spike. The same phenomenon still occurs even when the light fluid is on top of the heavy fluid ($A>0$), i.e. the rising finger is the spike and the falling finger is the bubble. This is because such a phenomenon is solely caused by the electrical force from the external horizontal electric field and does not depend on gravity or the density difference between the fluids.
8. Summary
In this paper we study the nonlinear behaviour of an RT unstable interface between two inviscid, incompressible and perfect dielectric fluids in the presence of a horizontal electric field in two dimensions. We derive the nonlinear perturbation solutions for the velocity and the amplitude of fingers at the material interface, and explicitly display the analytical expressions for spikes and bubbles up to the third order and for the overall velocity of the interface up to the fourth order. An exploration of the four-parameter phase space (amplitude of the initial perturbation, strength of the horizontal electric field, fluid density ratio and electric permittivity ratio) shows that the nonlinear perturbation solution derived captures the nonlinear dynamics of the material interface and consistently provides a greater range of validity than the linear theory. As time further progresses, our theoretical predictions eventually deviate from the numerical solutions, since we only carried out the explicit solutions up to the third order but the contributions from the higher orders also become important. One needs to include these contributions in order to further extend the range of validity of the perturbation expansion series. However, the complexity of analytical expressions increases rapidly as one reaches higher orders. Researchers who are experts in symbolic computation may consider programming the general expansion procedure, derived in this paper, to obtain numerical solutions of higher orders. Fluids in experiments contain viscosity and surface tension. These effects are not included in our theory. The vortex sheet formulation in our numerical method is not applicable to systems with viscosity. Then it will lose certain advantages in numerical computation, namely, solving the governing equations along the material interface solely, representing the shape of the interface accurately, and eliminating the numerical boundaries.
The analytical expressions for the electrical force along the material interface are also derived. By analysing these expressions, we show that the electrical force $f_e$ can deposit into two parts, $f_0$ and $f_e-f_0$, where $f_0$ is the electrical force associated with a flat interface and $f_e-f_0$ is the additionally induced electrical force when the interface is non-flat. It is the part $f_e-f_0$ that leads to the suppression effects on the perturbed material interface. The nonlinear terms in the expression for the electrical force also explain the phenomenon that the growth of fingers is different before and after switching the electric permittivities of the two fluids, a phenomenon that was reported in the numerical simulations in the literature (Yang et al. Reference Yang, Li, Zhao, Shao and Xu2016).
Acknowledgements
The authors thank the referees for their constructive suggestions and helpful comments.
Funding
The work of Q.Z. was supported in part by the National Natural Science Foundation of China (grant number 12272054); the Research Grants Council of the HKSAR, China (project number CityU 11302919); Guangdong Provincial Key Laboratory of Interdisciplinary Research and Application for Data Science, BNU-HKBU United International College (project number 2022B1212010006); and Guangdong Higher Education Upgrading Plan (2021–2025) (project number UIC R0400024-21). The work of D.H. was supported by the Guangdong Basic and Applied Basic Research Foundation (grant number 2022A1515011784).
Declaration of interests
The authors report no conflict of interest.
Appendix A. Governing equations for the perturbation expansion procedure
In this appendix we derive the general expressions of the governing equations in the perturbation expansion up to any order.
For a material interface with a small initial perturbation, i.e. $a_0 \ll 1$, we expand the physical quantities $\phi _i, V_i$ and $\eta$ in terms of powers of $a_0$. After applying this expansion, the governing equations, namely (3.1), (3.2), (3.5)–(3.7) and (3.10), can be expressed as
Note that (A3)–(A6) are the expanded expressions of the boundary conditions (3.5)–(3.7) and (3.10) in terms of $a_0$. These conditions are evaluated at the material interface $z=\eta (t,x)$, which itself is a nonlinear function of $a_0$. We need to further expand $\eta (t,x)$ in terms of $a_0$, namely $\eta (t,x) = \sum _{n=1}^{\infty }\eta ^{(n)}(t,x)$, so that the boundary conditions can be evaluated at the unperturbed location $z=0$. Then, from the expansion of (A3)–(A6), the governing equations for the quantities of the $n$th order ($n \geqslant 1$) are
with the initial conditions given by
Here we have used the unperturbed solution given by (3.15), and the source terms on the right-hand sides of (A9)–(A13), i.e. $R_{j}^{(n)}$, $\tilde {R}_{j}^{(n)}$, $S_{j}^{\prime (n)}$, $T_{j}^{(n)}$ and $U_{j}^{(n)}$, are determined from the Fourier mode decomposition of the following expressions:
Here
We comment that the left-hand sides of (A9)–(A13) contain the $n$th-order unknowns. However, the terms on the right-hand sides, namely $R_{j}^{(n)}$, $\tilde {R}_{j}^{(n)}$, $S_{j}^{\prime (n)}$, $T_{j}^{(n)}$ and $U_{j}^{(n)}$, contain only quantities of orders lower than $n$. Since our perturbation expansion is a recursive procedure, at the time of solving the $n$th-order variables, all lower-order quantities are known. Consequently, all expressions on the right-hand sides of (A9)–(A13), i.e. the expressions of $R_{j}^{(n)}$, $\tilde {R}_{j}^{(n)}$, $S_{j}^{\prime (n)}$, $T_{j}^{(n)}$ and $U_{j}^{(n)}$, are also known. Therefore, (A7)–(A13) are linear partial differential equations for the $n$th-order unknowns.
Appendix B. Derivation of general perturbation solutions
In this appendix we derive the general procedure for obtaining the perturbation solutions up to arbitrary order.
Equations (A7)–(A13) are the governing equations for the $n$th-order perturbation solutions for a RT system in the presence of horizontal electric fields. The functional forms of the $n$th-order perturbation solutions are given by (3.18)–(3.22). Note that the ansatzes given by (3.19) and (3.20) automatically satisfy (A7), and those given by (3.21) and (3.22) satisfy (A8). After substituting (3.18)–(3.22) into (A9)–(A13) for order $n$ ($n \geqslant 1$), one obtains a group of equations that comprise Fourier modes of wavenumber $1, 2, \ldots, n$. Applying Fourier decomposition to the resulting equations, one can obtain the governing equations of the $n$th-order coefficients for any given mode $j$ ($1 \leqslant j \leqslant n$). Particularly, the kinetic equations at the material interface, namely (A9) and (A10), give
The electrodynamic boundary conditions at the material interface, i.e. (A11) and (A12), give
The Bernoulli equation at the material interface (A13) gives
The initial conditions can also be determined by Fourier decomposition of (A14) and (A15), i.e.
where the Kronecker delta $\delta _{1j} = 1$ when $j=1$ and $\delta _{1j} = 0$ when $j \ne 1$.
For the case of $j=0$, we have $a_{0}^{(n)}(t)=0$ from the incompressibility condition and the initial conditions. Note that the coefficients for $j=0$ in the velocity potentials ($b_{0}^{(n)}$ and $\tilde {b}_{0}^{(n)}$) do not contribute to the velocity fields in the fluids, and those in the voltage potentials ($d_{0}^{\prime (n)}$ and $\tilde {d}_{0}^{\prime (n)}$) do not contribute to the electric fields either. Moreover, all these terms do not appear explicitly on the right-hand sides of (A16)–(A20), since (A16)–(A20) involve differentiation with respect to $x$ or/and $z$. Consequently, these terms will not appear in the source terms $R_{j}^{(n)}$, $\tilde {R}_{j}^{(n)}$, $S_{j}^{\prime (n)}$, $T_{j}^{(n)}$ and $U_{j}^{(n)}$ in (B1)–(B5). Therefore, the functional forms of $b_{0}^{(n)}$, $\tilde {b}_{0}^{(n)}$, $d_{0}^{\prime (n)}$ and $\tilde {d}_{0}^{\prime (n)}$ do not play a role in the dynamics of the system. For this reason, we will not display the terms for $j=0$ explicitly.
Equations (B1) and (B2) are linear equations for $b_{j}^{(n)}$ and $\tilde {b}_{j}^{(n)}$, respectively. Hence, one can solve the expressions of $b_{j}^{(n)}$ and $\tilde {b}_{j}^{(n)}$ in terms of $a_{j}^{(n)}$. The solutions are given by (3.29) and (3.30). Similarly, (B3) and (B4) are a linear system of $d_{j}^{\prime (n)}$ and $\tilde {d}_{j}^{\prime (n)}$. Based on these equations, the solutions of $d_{j}^{\prime (n)}$ and $\tilde {d}_{j}^{\prime (n)}$ can be expressed in terms of $a_{j}^{(n)}$, which are given by (3.31) and (3.32). By substituting (3.29)–(3.32) into (B5), we obtain a linear ordinary differential equation (ODE) about $a_{j}^{(n)}(t)$, i.e. (3.27). Note that the source term on the right-hand side of (3.27) (i.e. $F_{j}^{(n)}$) only contains quantities of order lower than $n$, which are known at the time of solving the $n$th-order quantities (see Appendix A). Therefore, $a_{j}^{(n)}$ can be solved from (3.27). The solution is given by (3.26).
For a given order $n$, the solution of the interface $\eta ^{(n)}$ contains Fourier modes up to the wavenumber $n$ (see (3.18)). Hence, there are $n$ Fourier coefficients $a_{j}^{(n)}$ ($j = 1, 2, \ldots, n$) in $\eta ^{(n)}$. Each coefficient $a_{j}^{(n)}$ of mode $j$ satisfies a linear ODE given by (3.27). The source terms of (3.27) can be evaluated from (A16)–(A20) using Fourier decomposition.
Appendix C. Derivation of the first-order solution
In this appendix we derive the explicit expressions for the first-order solutions.
By selecting the $n=1$ and $j=1$ mode in Fourier analysis of (A16)–(A20), we obtain the following first-order source terms of (B1)–(B5):
From (3.27)–(3.28), the first-order governing equation of the material interface is
where the eigenvalue $\sigma _1$ is given by (3.25). Using the initial conditions given by (B6a,b) ($a_{1}^{(1)}=a_0, \dot {a}_{1}^{(1)} = 0$), one can solve $a_{1}^{(1)}$ from (C2). The solution is given by (3.35). This recovers the linear theory obtained in Eldabe (Reference Eldabe1989).
Appendix D. Derivation of the second-order solutions
In this appendix we derive the explicit expressions for the second-order solutions.
For the mode $n=2$ and $j=1$, the source terms of (B1)–(B5) can be obtained from the Fourier decomposition of (A16)–(A20), i.e.
Therefore, the governing equation for this mode is
Since the initial conditions for $a_{1}^{(2)}$ are zero (see (B6a,b)), it is easy to see that the solution for (D2) is
Similarly, by selecting the mode $n=2$ and $j=2$ in Fourier analysis of (A16)–(A20), we obtain the following source terms of (B1)–(B5) for this mode:
Substituting (D4)–(D8) into (3.27)–(3.28), we obtain the governing equation for $a_{2}^{(2)}$, i.e.
where $W^{+}$ is given by (3.24). The solution of $a_{2}^{(2)}$ is given by (3.37).
Appendix E. Derivation of the third-order solutions
In this appendix we derive the explicit expressions for the third-order solutions.
By conducting Fourier decomposition of (A16)–(A20), one can obtain the third-order source terms of (B1)–(B5). The resulting expressions of these source terms can be simplified by applying (D3). Then the source terms of (B1)–(B5) for the mode $n=3$ and $j=1$ are
These expressions give the following governing equation for $a_{1}^{(3)}$ (see (3.27)–(3.28)):
The solution for $a_{1}^{(3)}$ is given by (3.39).
Similarly, we have the following source terms of (B1)–(B5) for $n=3$ and $j=2$:
The resulting governing equation for $a_{2}^{(3)}$ given by (3.27)–(3.28) is
Since the initial conditions for $a_{2}^{(3)}(t)$ are also zero (see (B6a,b)), we obtain the solution
The expressions for the source terms of (B1)–(B5) for $n=3$ and $j=3$ are
The governing equation for $a_{3}^{(3)}$ can then be determined, i.e.
The solution for $a_{3}^{(3)}$ is given by (3.40).
Appendix F. Procedure for obtaining $\dot {a}_1^{(1)}$, $\dot {a}_1^{(3)}$ and $\dot {a}_3^{(3)}$ from numerical simulations
To verify that our analytical expressions for $\dot {a}_1^{(1)}$, $\dot {a}_1^{(3)}$ and $\dot {a}_3^{(3)}$ given by (3.54), (3.58) and (3.59) are still correct even in the time period in which the predictions of the nonlinear perturbation solution deviate from the results of numerical simulations, which is shown near the end of the simulations in figures 2–5, we need to extract the information of $\dot {a}_1^{(1)}$, $\dot {a}_1^{(3)}$ and $\dot {a}_3^{(3)}$ from the results of numerical simulations. In this appendix we provide the details of how to obtain these coefficients from the data of numerical simulations.
The dimensionless horizontal width of the physical domain in the numerical simulations is $2{\rm \pi}$. From the data of numerical simulations, one can obtain the Fourier coefficient for the $j$th harmonic mode of the interface shape
Equation (5.30) shows that each Fourier coefficient $\tilde {a}_j$ is a summation of the contributions from many high-order nonlinear terms $a_j^{(n)} (n \geqslant j)$ and, therefore, is a polynomial of $a_0$, where $a_0$ is the dimensionless amplitude of the initial perturbation. Up to the $N$th order, $\tilde {a}_j$ can then be expressed in terms of $a_0$ as
where $\tilde {c}_{j}^{(n)}(t)$ is independent of $a_0$. Once we extract $\tilde {c}_{j}^{(n)}(t)$ from the numerical data, $\tilde {c}_{j}^{(n)}(t) a_0^n$ gives the numerical result for $a_{j}^{(n)}(t)$. Therefore, by changing the dimensionless amplitude of the initial perturbation from $a_0$ to ${a_0}/{2^m}$ and keeping the other physical parameters the same, the resulting Fourier coefficient of the material interface becomes
where $\tilde {a}_j[{a_0}/{2^m}]$ denotes the Fourier coefficient obtained from a numerical simulation for the material interface whose initial amplitude is ${a_0}/{2^m}$. For a given $j$ and $n \in [j,N]$, to estimate the value of $\tilde {c}_{j}^{(n)}$ up to $O(a_0^N)$, we run a sequence of numerical simulations for the same system but with different initial amplitudes $a_0, a_0/2, \ldots, a_0/2^m$. Here $m$ is the integer part of $(N-j)/2$, and we have used the property of the interface shape that $\tilde {c}_{j}^{(n)} = 0$ when $n-j$ is odd. From the sequence of numerical simulations, we obtain the values of the Fourier coefficients $\tilde {a}_j[a_0], \tilde {a}_j[a_0/2], \ldots, \tilde {a}_j[a_0/2^{m}]$. The expressions of these Fourier coefficients constitute a group of linear equations for $\tilde {c}_{j}^{(n)}$ ($n = j, j+2, \ldots$) (see (F3)), i.e.
Here $N-j$ is even, otherwise $\tilde {c}_{j}^{(N)} = 0$ and it vanishes in (F5). Hence, from (F5) the values of $\tilde {c}_{j}^{(n)}$ ($n = j, j+2, \ldots$) can be solved in terms of a linear combination of $\tilde {a}_j[a_0], \tilde {a}_j[a_0/2], \ldots, \tilde {a}_j[a_0/2^{m}]$. Then the interface coefficient for a material interface with a dimensionless initial amplitude $a_0$ is given by
Since the explicit expression of our nonlinear perturbation solution for the overall velocity is up to the fourth order of $a_0$, which contains the coefficients ${a}_1^{(1)}$, ${a}_1^{(3)}$ and ${a}_3^{(3)}$, we need to determine the values of these coefficients ${a}_1^{(1)}[a_0]$, ${a}_1^{(3)}[a_0]$ and ${a}_3^{(3)}[a_0]$ from the numerical data. From (F5) and (F6), we have the following expressions. For the case $j=1$ and $n=1$ and $3$, by choosing $N=7$, we have $m=3$. Combining (F5) and (F6) we obtain the following expressions for determining ${a}_1^{(1)}$, ${a}_1^{(3)}$ and ${a}_3^{(3)}$:
Similarly, for $j=n=3$ and $m=3$, (F5) and (F6) give
We comment that the quantities on the right-hand side of (F7)–(F9) are obtained by applying (F1) to the interface shape in the numerical simulations with the initial perturbation amplitude of $a_0, a_0/2, a_0/4$ and $a_0/8$, and the expressions on the left-hand side of (F7)–(F9) denote the values of ${a}_1^{(1)}$, ${a}_1^{(3)}$ and ${a}_3^{(3)}$ estimated from the resulting numerical data. By applying the central difference approximation to ${a}_1^{(1)}[a_0]$, ${a}_1^{(3)}[a_0]$ and ${a}_3^{(3)}[a_0]$ in time variable, we numerically extract the values of $\dot {a}_1^{(1)}$, $\dot {a}_1^{(3)}$ and $\dot {a}_3^{(3)}$ from the data of numerical simulations.
Appendix G. Perturbation solutions of electric fields
In this appendix we derive the explicit expressions of the perturbation solutions for the voltage potentials up to the third order.
In order to investigate the electrical force at the material interface, one needs to determine the electric fields on both sides of the interface first. The perturbation solutions for the voltage potentials in fluids $1$ and $2$ are given by (3.21) and (3.22), respectively. The coefficients in these two equations, namely $d_{j}^{\prime (n)}$ and $\tilde {d}_{j}^{\prime (n)}$, can be determined recursively from (3.31) and (3.32). In (3.31) and (3.32) the explicit expression of $a_{j}^{(n)}$ can be determined from (3.26), and is given by (3.35), (3.37), (3.39), (3.40) and (3.51) explicitly up to the third order. The source terms ($S_{j}^{\prime (n)}$ and $T_{j}^{(n)}$) can be determined from (A18) and (A19) using Fourier decomposition. The explicit expressions of these terms are displayed in Appendices C, D and E up to the third order.
The coefficients of the first-order solutions for voltage potentials are
The coefficients of the second-order solutions for voltage potentials are
The coefficients of the third-order solutions for voltage potentials are
One can then use (7.7)–(7.9) to determine the electrical force on the material interface.
Appendix H. Explicit expressions for the terms in (7.12)–(7.14)
Equations (7.12)–(7.14) contain partial derivatives of $\eta$, $V_1$ and $V_2$ with respect to $x$ or $z$. In this appendix we display the explicit expressions of these partial derivatives up to the third order.
The partial derivatives of the interface shape $\eta$ with respect to $x$ are
where $a_{1}^{(1)}, a_{2}^{(2)}, a_{1}^{(3)}$ and $a_{3}^{(3)}$ are given by (3.35), (3.37), (3.39) and (3.40), respectively.
The partial derivatives of the voltage potential $V_1$ with respect to $x$ are
and those with respect to $z$ are
where $d_{1}^{\prime (1)}, d_{2}^{\prime (2)}, d_{1}^{\prime (3)}$ and $d_{3}^{\prime (3)}$ are given by (G1), (G4), (G6) and (G9), respectively.
The partial derivatives of the voltage potential $V_2$ with respect to $x$ are
and those with respect to $z$ are
where $\tilde {d}_{1}^{\prime (1)}, \tilde {d}_{2}^{\prime (2)}, \tilde {d}_{1}^{\prime (3)}$ and $\tilde {d}_{3}^{\prime (3)}$ are given by (G2), (G5), (G7) and (G10), respectively.