Hostname: page-component-78c5997874-fbnjt Total loading time: 0 Render date: 2024-11-13T06:47:09.750Z Has data issue: false hasContentIssue false

Particle motion in a bed under a rigid plate, submerged and oscillated over its surface, and bed morphologies induced by flexible plates

Published online by Cambridge University Press:  13 September 2024

Anna Prati*
Affiliation:
Faculty of Engineering, Free University of Bozen-Bolzano, 39100 Bolzano, Italy
Michele Larcher
Affiliation:
Faculty of Engineering, Free University of Bozen-Bolzano, 39100 Bolzano, Italy
James T. Jenkins
Affiliation:
School of Civil and Environmental Engineering, Cornell University, Ithaca, NY 14853, USA
Luigi La Ragione
Affiliation:
Dipartimento di Ingegneria Civile, Ambientale, del Territorio, Edile e di Chimica, Politecnico di Bari, 70125 Bari, Italy
*
Email address for correspondence: anna.prati@unibz.it

Abstract

We study the behaviour of a particle bed immersed in water when a flow generated by an oscillating plate is induced above it. We first consider a rigid plate submerged and oscillated over a particle bed. During upward motion of the plate, a portion of the bed fails, allowing particle displacement, and the bed surface to deform into a heap. We have already determined the flow of the fluid above and within the bed. This work describes the particle motion within the failed region of the bed: when the particles are mobile, they follow the fluid. We depth average the balance of mass and obtain an evolution equation for the displacement of the bed surface. We solve this equation and compare the predictions with the measurements of surface displacement in earlier experiments on rigid square plates. We carry out new experiments to measure the surface displacements under elongated plates. Elongated rigid plates behave similarly to the rigid square ones. Flexible plates produce multiple heaps. We determine that the peaks of these heaps are correlated with the flexural modes of the plates and occur at points along the bed at which the fluid pressure has its extreme values. Different plate flexural modes, resulting in different numbers of heaps, are produced by driving the plate at different frequencies. The particle motion within the bed and heap evolution under a flexible plate can be roughly described by regarding it as two or more rigid plates. We test the predictions of the theory against experiments.

Type
JFM Papers
Copyright
© The Author(s), 2024. Published by Cambridge University Press

1. Introduction

Geometric features on the surface of a submerged particle bed, such as ripples and dunes, are often due to shear forces applied by the fluid to the bed. Early studies by Shields (Shields Reference Shields1936) related the strength of a turbulent shearing flow to the onset of the particle motions that are responsible for such features. Charru, Andreotti & Claudin (Reference Charru, Andreotti and Claudin2013) review the mechanisms that control the emergence and development of such bedforms.

Less common are features that develop in the absence of shear (Houssais, Maldarelli & Morris Reference Houssais, Maldarelli and Morris2021). Johnson & Cowen (Reference Johnson and Cowen2020) describe the development of ripples on the surface of a particle bed that are provoked by an array of distant turbulent jets that fire randomly. La Ragione et al. (Reference La Ragione, Laurent, Jenkins and Bewley2019) and Laurent et al. (Reference Laurent, La Ragione, Jenkins and Bewley2022) consider a simpler system of a submerged rigid plate oscillating above a particle bed and observe the slow formation of a single heap beneath the plate. They relate the heap formation to the fluidization of a region of the bed below the plate during its upward motion and the resulting creep of particles being dragged by the fluid in each half-cycle.

Failure and fluidization of particle beds due to pressure gradients is associated with avalanche fronts (Louge, Carroll & Turnbull Reference Louge, Carroll and Turnbull2011; Carroll, Turnbull & Louge Reference Carroll, Turnbull and Louge2012; Carroll, Louge & Turnbull Reference Carroll, Louge and Turnbull2013), marine structures (Sumer Reference Sumer2014), surface waves (Liu & Lara Reference Liu and Lara2007) and internal waves (Rivera-Rosario, Diamessis & Jenkins Reference Rivera-Rosario, Diamessis and Jenkins2017). Vertical pressure gradients within a horizontal bed produce a vertical force on the particles in the bed. When this vertical force is large enough, it can lift the particles near the surface of the bed and so cause bed failure. This type of failure can lead to the development of bedforms.

Oscillatory forcing in the form of vibrations is also known to have a fluidizing influence in systems of dry grains (Marchal, Smirani & Choplin Reference Marchal, Smirani and Choplin2009; Marchal et al. Reference Marchal, Hanotin, Michot and de Richter2013) and particle suspensions (Hanotin et al. Reference Hanotin, Kiesgen de Richter, Marchal, Michot and Baravian2012Reference Hanotin, Kiesgen de Richter, Michot and Marchal2015). Oscillatory motion of the grains is analogous to thermal motions in Brownian or molecular systems, and it is possible to relate the macroscopic rheological properties and the diffusional properties of the medium at the grain scale (Hanotin et al. Reference Hanotin, Marchal, Michot, Baravian and Kiesgen De Richter2013). In our system, the grains, driven by oscillations in the fluid, experience small local rearrangements that permit the slow global deformation of the bed and the growth of the heap. This behaviour is similar to the creep deformation seen in aggregates of dense, dry, frictional grains (Dijksman et al. Reference Dijksman, Wortel, van Dellen, Dauchot and van Hecke2011; van Hecke Reference van Hecke2015), except it is driven by pressure, rather than shear forces. It is analogous to creep phenomena that are present in many natural systems (Houssais et al. Reference Houssais, Ortiz, Durian and Jerolmack2015; Ferdowsi, Ortiz & Jerolmack Reference Ferdowsi, Ortiz and Jerolmack2018; Jerolmack & Daniels Reference Jerolmack and Daniels2018; Deshpande et al. Reference Deshpande, Furbish, Arratia and Jerolmack2021; Deshpande, Arratia & Jerolmack Reference Deshpande, Arratia and Jerolmack2023).

The analysis of La Ragione et al. (Reference La Ragione, Laurent, Jenkins and Bewley2019) was based on the hypotheses that the flow in the clear fluid above the bed is approximately inviscid, the flow within the particle bed is described by Darcy's law and the amplitude of the heap is small with respect to the plate half-width. The flows above and below the bed surface are coupled by the pressure in excess of the hydrostatic distribution. The analysis was confined to the prediction of bed failure based upon the description of the fluid motion within the bed. Bed failure takes place when the vertical pressure gradient in the fluid is equal to the buoyant weight of the particles. This occurs during the upward motion of the plate. To determine the subsequent evolution of the heap, an analytical description of the particle motion within the bed is required.

A first attempt to characterize the heap evolution was made by Laurent et al. (Reference Laurent, La Ragione, Jenkins and Bewley2022) using dimensional analysis. In the present work, we undertake a more detailed description of the particle motion within the bed. The balance of momentum for the particles, used with a simple model of particle interaction, leads to the conclusion that the resistance of the particles is small and, when the particles are mobile, they follow the fluid. Given the fluid pressure distribution within the bed from previous work, the components of the fluid velocity can be calculated. This permits phrasing of the balance of mass for the particles and averaging it over the depth of the particle flow to obtain an equation of evolution for the displacement of the surface of the bed. We solve this equation and compare the predictions with the measurements of surface displacement in earlier experiments on a square plate. When normalized by the maximum height, the profiles collapse in the same way as those measured by Laurent et al. (Reference Laurent, La Ragione, Jenkins and Bewley2022).

We then describe experiments to measure the surface displacements under elongated rigid and flexible plates. We first investigate the possibility that a single heap under a long, rigid plate may become unstable and evolve into multiple heaps. However, we find that this does not occur. We explore the importance of the flexibility and aspect ratio of the plate on the pressure distribution and morphology of the bed beneath it. Long, flexible plates induce multiple heaps. We indicate how the length of the plate and its vibrational modes influence the number of heaps on the bed. We compare the evolution predicted by the model with that observed in the experiments. The evolution of the heaps, the maximum heap amplitudes and the number of oscillations required to reach such amplitudes in the experiments are rather well predicted by the model.

The theoretical model seems to catch the basic particle dynamics, which consists of a bed liquefaction phase while the plate moves upwards and the fluid/particle trajectories converge towards the place centre, and a compaction phase, where particles keep their position. In the context of a simple model that incorporates this, the particle-response time scale is identified. Because the plate transfers momentum to the particle bed through the fluid pressure, if the plate is flexible, it is possible to modulate the heap shape by varying the oscillation frequency; this, in turn, excites different flexural modes of the plate, creates different pressure profiles on the surface of the bed and provokes heaps in response to the different distributions. We compare the evolution predicted by the model with that observed in the experiments. We assume that the heap stops growing when a local value of the slope reaches the angle of repose of the material. The evolution of the heaps, the maximum heap amplitudes and the number of oscillations required to reach such amplitudes in the experiments are rather well predicted by the model.

2. Particle motion

Previous modelling of the mechanics of heap formation focused on the motion of the fluid above and within the bed under a two-dimensional periodic array of rigid plates of half-width $W$ oscillating with amplitude $A$ and frequency $f$ at a mean distance $H$ above a particle bed (La Ragione et al. Reference La Ragione, Laurent, Jenkins and Bewley2019). The origin of a Cartesian reference frame is placed at the bed surface elevation which is initially horizontal, see figure 1.

Figure 1. The experimental set-up with the Cartesian reference at the top of the bed under the plate.

The inviscid flow equations were solved above the bed for a fluid of mass density $\rho _f$ to provide the pressure distribution in the fluid at the surface of the bed. This pressure distribution was then employed as a boundary condition for Darcy's equation, assumed to govern the fluid flow within the bed.

The lowest Fourier component of the solution of this equation was taken to be the dynamic pressure, $p^{\prime }$, of the fluid above hydrostatic within the bed

(2.1)\begin{equation} p^{\prime} (x,y,t)= \frac{64}{\rm \pi} \rho_f AW f^2 \frac{W}{H} \exp\left({\left(\frac{\rm \pi}{2}\frac{y}{W}\right)}\right)\cos \left(\frac{\rm \pi}{2} \frac{x}{W}\right) \sin(2{\rm \pi} f t). \end{equation}

We focus here on the bed, $y \le 0$, and the region under the plate from its centre to its edge, $0 \le x \le W$. At positions and times at which the gradient exceeded the buoyant weight of the particles, the bed was considered to fail. Data on the initiation of heap formation in the experiments of La Ragione et al. (Reference La Ragione, Laurent, Jenkins and Bewley2019) and Laurent et al. (Reference Laurent, La Ragione, Jenkins and Bewley2022) confirmed this scaling. Also, the components of the fluid velocity are proportional to the spatial gradient of this pressure.

When the bed fails, the particles become mobile, experience the drag of the fluid and interact through the narrow layers of fluid that surround them. In this work, we focus on mobile particles, employ mass and momentum balances that include particle stresses due to the particle interactions and derive and solve an equation for the evolution of the height of the heap. As a further simplification, we assume that, while the particles are mobile, the fluid pressure is at its largest negative value

(2.2)\begin{equation} p^{\prime} =-\frac{64}{\rm \pi} \rho_f f^2 W A \frac{W}{H} \exp\left({\left(\frac{\rm \pi}{2}\frac{y}{W}\right)}\right)\cos \left(\frac{\rm \pi}{2} \frac{x}{W}\right). \end{equation}

In order to understand how particles move to create a heap, we consider first the particle mass balance

(2.3)\begin{equation} \frac{W}{Af\tau} \frac{\partial c}{\partial \tilde{t}} + \frac{\partial (c \tilde{U})}{\partial \tilde{x}} + \frac{\partial (c \tilde{V})}{\partial \tilde{y}} =0 ,\end{equation}

in which $c$ is the particle concentration, $\tilde {x}=x/W$ and $\tilde {y}=y/W$ are the dimensionless coordinates of a point in the bed, $\tau$ is the characteristic time used to create the dimensionless time $\tilde {t}$ and $\tilde {U}=U/(Af)$ and $\tilde {V}=V/(Af)$ are the dimensionless particle velocities along $x$ and $y$. We defer providing the definition of $\tau$ until after we depth average (2.3). During the upward motion of the plate there is a local expansion of the bed that permits particles to move inward and upward while, during the downward motion of the plate, particles do not move. That is, there is a reversible motion of the fluid associated with the oscillation of the plate that is not shared by the particles. In Appendix A, we show that, in the upward motion of the plate, the particle velocity and fluid velocity are essentially the same. The velocities become closer as the permeability of the bed, $\kappa$, decreases. Provided that, when the particles are mobile, the fluid and the particle velocities coincide, we can combine (2.1) with Darcy's law $U=-\kappa /(\rho _f\nu _f) \partial p^{\prime }/\partial x$ and $V=-\kappa /(\rho _f\nu _f) \partial p^{\prime }/\partial y$, in which $\nu _f$ is the kinematic viscosity of the water, and obtain

(2.4)\begin{equation} \tilde{U} =-32\frac{\kappa}{\nu_f} f\frac{W}{H} \exp\left({\frac{\rm \pi}{2}\tilde{y}}\right)\sin \left(\frac{\rm \pi}{2} \tilde{x}\right) \end{equation}

and

(2.5)\begin{equation} \tilde{V} = 32\frac{\kappa}{\nu_f} f \frac{W}{H} \exp\left({\frac{\rm \pi}{2}\tilde{y}}\right)\cos \left (\frac{\rm \pi}{2} \tilde{x}\right). \end{equation}

We are interested to the evolution of the height, $h$, of the evolving heap, so we integrate the particle mass balance over a rough estimate of the fluidized region

(2.6)\begin{equation} \int_{-1}^{\tilde{h}(\tilde{x},\tilde{y},\tilde{t})}\left[\frac{W}{Af\tau} \frac{\partial c}{\partial \tilde{t}} + \frac{\partial (c \tilde{U})}{\partial \tilde{x}} + \frac{\partial (c \tilde{V})}{\partial \tilde{y}} \right]{\rm d} \tilde{y}=0, \end{equation}

where $\tilde {h} = h/W$. We apply Leibniz's rule, ignore terms at $\tilde {y}=-1$ and use the kinematic boundary condition

(2.7)\begin{equation} \left(\frac{\partial \tilde{h} }{\partial \tilde{t}}\right)_{\tilde{h}}+ \left(\tilde{U} \frac{\partial \tilde{h} }{\partial \tilde{x}}\right)_{\tilde{h}}- (\tilde{V})_{\tilde{h}}=0, \end{equation}

to obtain

(2.8)\begin{equation} \frac{W}{Af\tau} \bar{c} \frac{\partial \tilde{h}}{\partial \tilde{t}} + (1+ \tilde{h})\bar{c}\frac{\partial \overline{\tilde{U}}}{\partial \tilde{x}} + \overline{c\tilde{U}} \frac{\partial \tilde{h}}{\partial \tilde{x}}=0, \end{equation}

where we have introduced the depth average of a typical quantity $\psi$

(2.9)\begin{equation} \bar{\psi}=\frac{1}{1+\tilde{h}}\int_{-1}^{\tilde{h}} \psi \,{\rm d} \tilde{y}, \end{equation}

and neglected the variation of the average concentration, $\bar {c}$, with time and space.

Upon taking the depth average of the velocity $\tilde {U}$ (see (2.4)), (2.8) becomes

(2.10)\begin{equation} \frac{\partial \tilde{h}}{\partial \tilde{t}} -\frac{2}{\rm \pi} \exp({({\rm \pi} \tilde{h}/2)})\sin\left(\frac{\rm \pi}{2} \tilde{x}\right) \frac{\partial \tilde{h}}{\partial \tilde{x}}=\exp({({\rm \pi} \tilde{h}/2)}) \cos\left(\frac{\rm \pi}{2} \tilde{x}\right), \end{equation}

where we have neglected $\tilde {h}$ compared with $1$ and taken the characteristic time

(2.11)\begin{equation} \tau= \frac{H\nu_f}{32\kappa f^2 A}. \end{equation}

With this definition of $\tau$, the prefactor of the first term in (2.8) is $\tilde {R}= 32(W/H)(\kappa /\mu _f)\rho _f f$. Because it also appears as a prefactor in (2.4) and (2.5) for the velocities, it is absent from (2.10). However, $\tilde {t}=t/\tau$; so $\tilde {t}=(A/W) \tilde {R}tf$. Consequently, $\tilde {t}$ and $\tilde {R}$ are related. The parameter (A/W)$\tilde {R}$ is the ratio of the flow forcing to the flow resistance. In the present study, it is of the order of 10$^{-5}$.

The solution of the partial differential in (2.10) is obtained using the method of characteristics, under the hypothesis that for small $\tilde {h}$, $\exp ({{\rm \pi} \tilde {h}/2})\sim 1$

(2.12)\begin{equation} \tilde{h} =\ln \left[\frac{ 2 \,{\rm e}^{\tilde{t}} }{ 1+{\rm e}^{2 \tilde{t}} + (1-{\rm e}^{2 \tilde{t}}) \cos \left(\dfrac{\rm \pi}{2}\tilde{x}\right)}\right]. \end{equation}

In figure 2(a), we show profiles of height vs distance from the centre, both normalized by the half-width of the plate, for equal intervals of dimensionless time. The calculation is stopped at a normalized height of approximately 0.1, based on the angle of repose. At this height, the slope at some point on the heap, calculated from (2.12), first exceeds the tangent of the angle of repose, when this angle is approximately $17^{\circ }$ (Zhou et al. Reference Zhou, Xu, Yu and Zulli2002). This defines a regime in which the evolution of the heap occurs without localized avalanches and the associated loss of material. In figure 2(b), we show these profiles, divided by the height at the centre; they collapse in a way similar to the data plotted by Laurent et al. (Reference Laurent, La Ragione, Jenkins and Bewley2022). We later compare the predictions of (2.12) with the results of experiments focusing on this part of the heap formation.

Figure 2. (a) The evolution of heap height at different dimensionless times; (b) the evolution normalized by the centre height.

3. Experiment

We next describe new experiments to study the variation of the bed morphology when a pressure distribution is induced by elongated plates. The experimental set-up is sketched in figure 1. It consists of a transparent tank that contains the particle bed, composed of glass beads with a mean diameter $d_p=0.71$ mm, with particle sizes between 0.4 and 0.8 mm, and density $\rho _s = 2.7$ gr cm$^{-3}$. Submerged above the bed, a plate, with a thickness $H_{plate}$, is connected by a steel rod to a Bruel and Kjaer Mini-shaker Type 4810 and oscillated. The maximum power of the shaker is 15 Watts and the maximum force provided ranges between 10 and 7 N, depending on the frequency. A Bruel and Kjaer Miniature Hydrophone, Type 8103 is used to measure the water pressure above the bed.

In figure 3(a), we show the two different laser sheets used to illuminate the profiles of the bedforms, with two IOI Flare 12M180 CoaXPress high-speed cameras to record the evolving phenomenon. The wavelengths of the lasers are 532 nm (green) and 635 nm (red). Two laser sources and two cameras are necessary because both the longitudinal and the transverse profiles of the bedforms are measured at different times. We do not show the transverse data because they do not vary. The maximum resolution of the cameras is $4095 \times 3072$ pixels and is adjusted for each experiment.

Figure 3. The experimental set-up: (a) a detail of an experiment with two perpendicular laser sheets, (b) and the hydrophone and the small white dots to monitor the plate displacements.

Two frame rates are employed, depending on the purpose of the recordings: a high frame rate, between 250 and 600 fps, when the displacement of the plate is measured; a low frame rate, between 0.1 and 10 fps, to track the slow bed evolution. The measurements are not simultaneous; the first is done in light, the second is done in darkness. We measure the displacement of points on the plate by marking them with small dots, see figure 3(b), tracking the positions of these dots in time, and reconstructing their vertical displacements.

As the plate oscillates, the bed fails and one or more heaps form. In each frame, the profiles of the heaps are identified using the contrast between the brightness of the laser sheets and the darkness of the background. The laser illuminates the heap's edge, allowing the reconstruction of its growth during the experiment. Grey-scale images, taken with the cameras, are analysed using Matlab image-processing methods. In table 1 we show the dimensions of the plates and the amplitude and frequencies of each test. Prior to each experiment, the bed is flattened with a metal tool designed for these tests; its lower part is a vertical plate of the same width of the tank, while its upper part is a metal rail that rests on the upper edge of the tank. The remaining perturbations on the bed surface are of the order of magnitude of the particle diameter.

Table 1. Experimental data.

At the beginning of the experiment, we set the frequency, adjust the input voltage and measure the resulting amplitude, expressed here in particle diameters. Amplitude is used to indicate the maximum vertical displacement experienced by the plate during each experiment and is measured for different experimental configurations; this maximum excursion has been found at different locations along the plate. In table 1 and in the results section, the amplitude is made dimensionless by the particle mean diameter $d_p$.

The flexible plate used in the experiments has a thickness of 3 mm, a width of 5 cm and a length of 15 cm. In all experiments, $W$ is always half of the longitudinal length of the plate. The plate is made of PMMA (Poly-Methil-Metacrylate): its Young's modulus is $E = 2.9$ GPa, its Poisson coefficient is $\nu = 0.2$ and its density is $\rho = 1180$ kg m$^{-3}$. The rigid plate, 3.5 cm wide and 17.5 cm long, was made stiffer by a bar glued on its upper surface.

In all experiments, the values of $H$ and $H_{water}$ are, respectively, 2.1 and 4.5 cm, see figure 1. We repeated the experiments varying these parameters, but it did not influence the number of generated heaps.

4. Results

4.1. Rigid plate

The results from the first set of tests for the long rigid plate, $3.5 \times 17.5$ cm, are shown in figure 4. The question here was whether the single heap under a long rigid plate was stable, or could be provoked into evolving into multiple heaps. However, despite the different input frequencies, the bed profiles were all of one heap. This is consistent with the deformation of the plate shown in the first row of panels in figure 4.

Figure 4. (ac) The dimensionless displacement, $Dz/d_p$, of the plate during the test; and (df) bed topography at the end of the test (coloured dots) for the $3.5\times 17.5$ cm plate at a shaker amplitude of 1.19 particle diameters and a frequency of 30 Hz (a,d), 0.61 particle diameters and a frequency of 40 Hz (b,e) and 0.31 particle diameters and a frequency of 50 Hz (c,f).

Each of these plots features eight lines that connect the position, at a specific time, of the dots drawn on the edge of the plate, as in figure 3(b). In all experiments, the measurements are acquired over a time equal to half the oscillation period $T$, those at $t=0$ are darkest, those at $t=T/2$ are brightest. The final bed morphology is attained within approximately two minutes. The last row of panels shows the surface of the bed at the end of the test. In the bottom row, $z = 0$ mm indicates the elevation of the bed before the plate is set in motion.

4.2. Flexible plate

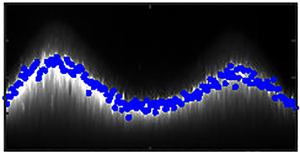
In the second set of tests, we investigate how the bed morphology changes with the frequency, using a plate with dimensions $5 \times 15$ cm. In figure 5 we show the bed evolution associated, respectively, with the frequencies of 30, 60 and 90 Hz. Again, the number of heaps is related to the pressure profiles induced by the oscillating, deformable plane.

Figure 5. (ac) The dimensionless displacement, $Dz/d_p$, of the plate during the test; maximum and minimum pressures measured above the bed, when the hydrophone is moved at a constant rate below the plate (df) and (gi) bed topography at the end of the test (coloured dots) for the $5\times 15$ cm plate at a shaker amplitude of 1.80 particle diameters and a frequency of 30 Hz (a,d,g), 0.89 particle diameters and a frequency of 60 Hz (b,e,h) and 1.83 particle diameters and a frequency of 90 Hz (c,f,i).

While the first and the last rows of panels in this figure provide the same information as in figure 4, the second row of panels in figure 5 shows, for each experiment, the maximum and minimum pressures measured above the bed, when the hydrophone is moved at a constant rate below the plate. The growth of the heaps under the flexible plates can be described using the solution for the rigid plate and the appropriate pressure distributions. That for two heaps beneath the plate employs the largest negative value

(4.1)\begin{equation} p^{\prime} =-\frac{64}{\rm \pi} \rho_f f^2 W^2 \frac{A}{H} \exp\left({\frac{{\rm \pi} y}{2W}}\right)\cos \left({\rm \pi} \frac{x}{W}-\frac{\rm \pi}{2}\right), \end{equation}

and results in

(4.2)\begin{equation} \tilde{h}= \ln \left[\frac{ 2 \,{\rm e}^{\tilde{t}} }{ 1+{\rm e}^{2 \tilde{t}} + (1-{\rm e}^{2 \tilde{t}} ) \cos ({\rm \pi} \tilde{x}-{\rm \pi}/2)}\right]. \end{equation}

The corresponding pressure distribution for three heaps is

(4.3)\begin{equation} p^{\prime} =\begin{cases} -\dfrac{64}{\rm \pi} \rho_f f^2 W^2 \dfrac{A}{H} \exp\left({\dfrac{{\rm \pi} y}{2W}}\right)\cos \left(\dfrac{3{\rm \pi}}{2} \dfrac{x}{W} \right), & 0\le x\le \dfrac{W}{3} \\ -\dfrac{64}{\rm \pi} \rho_f f^2 W^2 \dfrac{A}{H} \exp\left({\dfrac{{\rm \pi} y}{2W}}\right)\cos \left[\dfrac{3{\rm \pi}}{2} \left(\dfrac{x}{W}+\dfrac{2}{3}\right)\right], & \dfrac{W}{3}\le x \le W , \end{cases} \end{equation}

with the equation of evolution

(4.4)\begin{equation} \tilde{h}=\begin{cases} \dfrac{2}{3}\ln \left[\dfrac{2 \,{\rm e}^{\tilde{t}} }{ 1+{\rm e}^{2 \tilde{t}} + (1-{\rm e}^{2 \tilde{t}} ) \cos (3{\rm \pi}\tilde{x}/2)}\right], & 0\le \tilde{x} \le \dfrac{1}{3} \\ \dfrac{2}{3}\ln \left[\dfrac{2 \,{\rm e}^{\tilde{t}} }{ 1+{\rm e}^{2 \tilde{t}} + (1-{\rm e}^{2 \tilde{t}} ) \cos [3{\rm \pi} (\tilde{x}+2/3)/2]}\right], & \dfrac{1}{3}\le \tilde{x} \le 1 . \end{cases} \end{equation}

In figure 6 we show plots of the evolution of the heaps under the flexible plates. In Appendix B we include an analysis of the oscillatory motion of a submerged flexible plate.

Figure 6. Evolution of the heap under a flexible plate: (a) first mode of vibration; (b) second mode of vibration.

5. Comparison

In this section we compare experimental data with the theoretical prediction. We first focus on the rigid square plate, for which $W = 3.75$ cm. We present experimental data illustrating the evolution of the height of the heap, measured at centre, when the plate oscillates at $f = 15$ Hz with an amplitude $A = 1.15$ mm. In figure 7(a), we depict the dimensionless height, $\tilde {h}$, plotted against the dimensionless time, $\tilde {t}$, over an extended duration, assuming the bed permeability, $\kappa =5\times 10^{-8}$ cm$^2$. The evolution of the heap is characterized by two regimes: in the first, indicated by the shadowed area in figure 7(a), the heap forms without localized avalanches, reaching approximately 60 % of its final height, as the incline of the developing profile remains below the angle of repose; in the second, essentially nonlinear with $\tilde {t}$, there is a loss mass due to localized failures on the surface of the heap.

Figure 7. Evolution of normalized heap height over time: (a) long-term progression, with the initial regime as a shadowed area; (b) comparison between theoretical prediction (solid line) and experimental results (squares) with error bars.

According to the theory, for an angle of repose for glass beads submerged in water of approximately $17^{\circ }$, $\tilde {t} \approx 0.1$ is the onset of local failure. In this regime, the mass balance equation given by (2.3) remains valid, accounting for a tangential flux from the edges and a normal flux from the interior, without material loss. The corresponding value of the dimensionless height, $\tilde {h}$ given by (2.12), is compared with the experimental data in figure 7(b), where we have also indicated error bars representing variability across multiple tests conducted under identical conditions. We observe reasonable agreement, albeit with some limitations. That is, our current analysis reaches its limit as the mass balance equation fails to incorporate terms addressing mass loss.

We also compare the theory against the experimental data for an oscillating rectangular plate at both 60 Hz with amplitude $A = 0.63$ mm and 90 Hz with amplitude $A = 1.30$ mm, as shown in figure 8(a,b). In the former case, two distinct heaps form, see figure 5(h), and $W^{\ast }=W/2$ because we assume that the first mode of vibration of the plate is analogous to two rigid plates with a length $W$; in the latter, three heaps develop, illustrated in figure 5(i), and $W^{\ast }=W/3$ because the second mode of vibration of the plate is akin to three rigid plates, each with length $W/3$. The limit of the onset of local failure is $\tilde {t} = 0.09$, see figure 6(a,b). The comparison is based upon two different values of the permeability, $\kappa = 1.5 \times 10^{-8}$ cm$^2$ at $f = 60$ Hz and $\kappa = 8 \times 10^{-9}$ cm$^2$ at $f = 90$ Hz. This is consistent with previous findings showing that permeability decreases as the frequency increases (Johnson, Koplik & Dashen Reference Johnson, Koplik and Dashen1987).

Figure 8. Evolution of the normalized height of the heap under flexible rectangular plate, theory (solid line) and experimental data (squares): (a) oscillation at 60 Hz, two heaps; (b) oscillation at 90 Hz, three heaps.

6. Conclusion

We considered aspects of the development of heaps on the surface of a particle bed under oscillating plates. We first provided a description of particle motion within the part of the bed in which the particles are mobilized during the upward motion of the plate. The solution of the differential equation that results from the analysis captures at least some of the features of the growth of heaps under rigid, square plates. The comparison with experimental data supports what we define as the linear regime, in which there is no material loss during the evolution of the heap. We then reported on experiments on rectangular, rather than square, plates.

When rigid rectangular plates were oscillated at several frequencies over a bed, a single elongated heap occurred. Instead, the oscillation of rectangular, flexible plates resulted in multiple heaps, whose number increases with the frequency of oscillation. The shape of the heaps was correlated with the flexural modes of the plates and, as in the case of the rigid plates, the peaks of the heaps corresponded to the extreme values of the pressure profiles under the plates.

A rough prediction of the growth of the heaps under flexible plates was obtained by regarding the flexible plates as two or more rigid plates. The growth of these heaps was also tested against the experiments with a reasonable agreement in the linear regime. The results emphasize the importance of the distribution of negative pressure on the surface of the bed to the motion of the particles within the bed and to the evolution of the deformation of its surface.

Funding

L.L.R. and J.T.J. acknowledge financial support from the Visiting Professor Program of the Politecnico di Bari, Italy. L.L.R. is also grateful to the Gruppo Nazionale della Fisica Matematica (G.N.F.M.), Italy and CN-00000013 - National Centre for HPC, Big Data and Quantum Computing - Spoke 5 ‘Environment and Natural Disasters’ and to the US Office of Naval Research Global, grant VSP n. 23-12-001. M.L. and A.P. acknowledge financial support from the TN2806 Start Up fund of the Free University of Bolzano.

Declaration of interests

The authors report no conflict of interest.

Appendix A

We report the analysis of the fluid–particle interaction within the region of failed bed where particles become mobile each time the plate above the bed moves upwards. We start with fluid and particle momentum balances in which we indicate with lower case quantities associated with the fluid and upper case quantities associated with the particles. The kinematic viscosity of the fluid is $\nu _f$ while the permeability of the bed, whose concentration is $c$, is $\kappa$. For the fluid we have

(A1)\begin{equation} \rho_f \frac{\partial}{\partial t} (1-c)u_i +\rho_f \frac{\partial}{\partial x_k} (1-c)u_i u_k =-\frac{\partial}{\partial x_i} (1-c)p+ \frac{\partial t_{ik}}{\partial x_k}+\rho_f(1-c)g_i-m_i, \end{equation}

while for the particles

(A2)\begin{equation} \rho_p \frac{\partial}{\partial t} cU_i +\rho_p \frac{\partial}{\partial x_k} cU_i U_k =-\frac{\partial}{\partial x_i} cP+ \frac{\partial T_{ik}}{\partial x_k}+\rho_p c g_i+m_i, \end{equation}

in which the fluid–solid interaction is given in terms of $m=c \mu /\kappa (u_i-U_i)+p \partial c/\partial x_i$, $\rho _p$ and $\rho _f$ are, respectively, the density of the particle and the fluid and $t_{ik}$ is the stress for the fluid while $T_{ik}$ is the stress for the particles. Given the solution for the static case of (A1) and (A2) that results in a relation between the gradient of the average particle pressure and the buoyant gravity $\hat {g}=(1-1/\sigma )g$ with $\sigma =\rho _p/\rho _f$, and the gradient of the fluid pressure and gravity $g$, the $y$ component of the fluid and particle momentum balances reduce to

(A3)\begin{equation} \frac{\partial p}{\partial y} =-\rho_f g - \frac{c}{1-c}\frac{\mu}{\kappa} (v-V) \end{equation}

and

(A4)\begin{equation} 0=-\frac{\partial P_c}{\partial y} + \frac{\partial S}{\partial x} -\rho_p c \hat{g}+ \frac{c}{1-c}\frac{\mu}{\kappa} (v-V), \end{equation}

where $P_c$ is the collisional particle pressure. The corresponding $x$-component of the particle momentum balance is

(A5)\begin{equation} 0=-\frac{\partial P_c}{\partial x} + \frac{\partial S}{\partial y} + \frac{c}{1-c}\frac{\mu}{\kappa} (u-U). \end{equation}

We employ particle stress associated with impulsive particle interactions, analogous to those in dense kinetic theory (Jenkins & Larcher Reference Jenkins and Larcher2023), in which $A f$ corresponds to the square root of the granular temperature $T^{1/2}$. The dimensionless particle stress are then

(A6)\begin{equation} \tilde{P}_c = F(c) + F(c) \frac{A}{W} \left(\frac{\partial \tilde{U}}{\partial \tilde{x}}+ \frac{\partial \tilde{V}}{\partial \tilde{y}}\right) \end{equation}

and

(A7)\begin{equation} \tilde{S} = F(c) \frac{A}{W} \left(\frac{\partial \tilde{U}}{\partial \tilde{y}}+ \frac{\partial \tilde{V}}{\partial \tilde{x}}\right), \end{equation}

in which the transport coefficients are identical and the lengths, velocities and stresses, indicated by a tilde, are made dimensionless with $W$, $f A$ and $\rho _p (\,fA)^2$. The static gravitational balance between particle pressure and gravity is

(A8)\begin{equation} \frac{\partial}{\partial \tilde{y}} F(c) =- \frac{W\hat{g}}{(\,fA)^2}c, \end{equation}

so $F(c) =-W\hat {g}/(\,fA)^2 c \tilde {y}$ with $\tilde {P}_c (\kern0.09em \tilde {y}=0)=0$. From (A4) and (A5) the dimensionless particle velocities are

(A9)\begin{equation} \tilde{U} = \tilde{u} +(1-c)\epsilon \left[\tilde{y}\left(\frac{\partial^2 \tilde{U}}{\partial \tilde{x}^2}-\frac{\partial^2 \tilde{U}}{\partial \tilde{y}^2}\right)+ \left(\frac{\partial \tilde{U}}{\partial \tilde{y}}+\frac{\partial \tilde{V}}{\partial \tilde{x}} \right) \right] \end{equation}

and

(A10)\begin{equation} \tilde{V} = \tilde{v} +(1-c)\epsilon \left[\tilde{y}\left(\frac{\partial^2 \tilde{V}}{\partial \tilde{x}^2}-\frac{\partial^2 \tilde{V}}{\partial \tilde{y}^2}\right)+ \left(\frac{\partial \tilde{U}}{\partial \tilde{x}}+ \frac{\partial \tilde{V}}{\partial \tilde{y}} \right) \right], \end{equation}

in which

(A11)\begin{equation} \epsilon = \sigma \frac{\kappa \hat{g}}{W f \nu_f}. \end{equation}

For the typical values of the parameters in the experiment, (A11) leads to a negligible value for $\epsilon$. For example, $\kappa \approx 10^{-9}$ cm$^2$, $\sigma = 2.65$, $f = 40$ Hz, $A = 0.07$ cm, $W = 3.75$ cm and the water kinematic viscosity $\nu _f = 10^{-2}$ cm$^2$ s$^{-1}$. So $\epsilon \sim \times 10^{-6}$. This implies $\tilde {U}\sim \tilde {u}$ and $\tilde {V}\sim \tilde {v}$.

Appendix B

In this appendix, we present a simple analysis of the vibrational modes of a plate, considering the effect of water on its natural frequencies. We approximate half of the plate as a cantilever with a fixed edge. Due to symmetry, we assume no rotations occur at the centre where the steel rod is placed (see figure 3a,b). The angular frequency is (Song Reference Song1986)

(B1)\begin{equation} \omega_k =\lambda_k \sqrt{\frac{EJ}{\bar{m}W^4}}, \end{equation}

with $E$ is the Young's modulus, $W$ is half of the length of the plate, $\bar {m}=A \rho$ is the mass per unit length, $\lambda _k$ is the $k$th coefficient associated with the $k$th natural modes of vibration; it depends on the ratio $a/W$, in which $a$ is the width of the cross-section. The moment of inertia, $J$, for the rectangular plate is

(B2)\begin{equation} J=\frac{1}{12(1-\nu^2)}aH_{plate}^3, \end{equation}

in which $H_{plate}$ is the height, so $A=aH_{plate}$, and $\rho$ is the material density. Equation (B1) becomes

(B3)\begin{equation} \omega_k =\lambda_k \frac{H_{plate}}{2W^2}\sqrt{\frac{E}{3(1-\nu^2)\rho}}. \end{equation}

We use a flexible plate with thickness $H_{plate} = 3$ mm, length $2W = 15$ cm and width $a = 5$ cm. The material is PMMA with Young's modulus $E = 2.9$ GPa, Poisson's ration $\nu = 0.2$ and density $\rho = 1180\ {\rm kg}\ {\rm m}^{-3}$. So the natural frequencies, with $a/W \approx 0.67$ are $f_1 = 137$ Hz for the first mode and $f_2= 372$ Hz for the second mode, with $\lambda _1 = 3.5$, $\lambda _2 = 9.5$ (see table 2-1 in Song Reference Song1986), assuming a beam-like behaviour.

To include the contribution of the fluid to the vibration of the plate, we must take in account an added mass per unit length which is, according to Yadykin, Tenetov & Levin (Reference Yadykin, Tenetov and Levin2003),

(B4)\begin{equation} m^{{\ast}} =\rho_f \frac{\xi}{\rm \pi} W a , \end{equation}

where $\xi$ depends on the aspect ratio of the plate, $a/W$. For the rectangular plate, $a/W = 5/7.5$ and $\xi = 1.5$ for the first mode and $\xi = 1.0$ for the second mode (Yadykin et al. Reference Yadykin, Tenetov and Levin2003). The angular frequency becomes

(B5)\begin{equation} \omega_k =\lambda_k \sqrt{\frac{EJ}{(\bar{m}+m^*)W^4}} \end{equation}

or

(B6)\begin{equation} \omega_k =\lambda_k \frac{H_{plate}}{2W^2}\sqrt{\frac{E H_{plate}}{3(1-\nu^2) (\rho H_{plate} +\xi/{\rm \pi} \rho_f W )}}. \end{equation}

The new natural frequencies are $f_1^* = 41$ Hz for the first mode and $f_2^* = 111$ Hz for the second mode. Both are close to what is seen in the experiments.

References

Carroll, C.S., Louge, M.Y. & Turnbull, B. 2013 Frontal dynamics of powder snow avalanches. J. Geophys. Res. 118, 12.Google Scholar
Carroll, C.S., Turnbull, B. & Louge, M.Y. 2012 Role of fluid density in shaping suspension currents driven by frontal particle blow-out. Phys. Fluids 24, 066603.CrossRefGoogle Scholar
Charru, F., Andreotti, B. & Claudin, P. 2013 Sand ripples and dunes. Annu. Rev. Fluid Mech. 45, 469493.CrossRefGoogle Scholar
Deshpande, N.S., Arratia, P.E. & Jerolmack, D.J. 2023 The (in)sensitivity of granular creep to materials and boundaries. Geophys. Res. Lett. 50, e2023GL102938.CrossRefGoogle Scholar
Deshpande, N.S., Furbish, D.J., Arratia, P.E. & Jerolmack, D.J. 2021 The perpetual fragility of creeping hillslopes. Nat. Commun. 12, 3909.CrossRefGoogle ScholarPubMed
Dijksman, J.A., Wortel, G.H., van Dellen, L.T.H., Dauchot, O. & van Hecke, M. 2011 Jamming, yielding, and rheology of weakly vibrated granular media. Phys. Rev. Lett. 107 (10), 108303.CrossRefGoogle ScholarPubMed
Ferdowsi, B., Ortiz, C.P. & Jerolmack, D.J. 2018 Glassy dynamics of landscape evolution. Proc. Natl Acad. Sci. USA 115, 48274832.CrossRefGoogle ScholarPubMed
Hanotin, C., Kiesgen de Richter, S., Marchal, P., Michot, L.J. & Baravian, C. 2012 Vibration-induced liquefaction of granular suspensions. Phys. Rev. Lett. 108, 198301.CrossRefGoogle ScholarPubMed
Hanotin, C., Kiesgen de Richter, S., Michot, L.J. & Marchal, P. 2015 Viscoelasticity of vibrated granular suspensions. J. Rheol. 59, 253273.CrossRefGoogle Scholar
Hanotin, C., Marchal, P., Michot, L.J., Baravian, C. & Kiesgen De Richter, S. 2013 Dynamics of vibrated granular suspensions probed by mechanical spectroscopy and diffusing wave spectroscopy measurements. Soft Matt. 9 (39), 93529360.CrossRefGoogle Scholar
van Hecke, M. 2015 Slow granular flows: the dominant role of tiny fluctuations. C. R. Phys. 16, 3744.CrossRefGoogle Scholar
Houssais, M., Maldarelli, C. & Morris, J.F. 2021 Athermal sediment creep triggered by porous flow. Phys. Rev. Fluids 6, L012301.CrossRefGoogle Scholar
Houssais, M., Ortiz, C.P., Durian, D.J. & Jerolmack, D.J. 2015 Onset of sediment transport is a continuous transition driven by fluid shear and granular creep. Nat. Commun. 6, 18.CrossRefGoogle ScholarPubMed
Jenkins, J.T. & Larcher, M. 2023 Dense, steady, fully developed fluid-particle flows over inclined, erodible beds. Phys. Rev. Fluids 8, 024303.CrossRefGoogle Scholar
Jerolmack, D.J. & Daniels, K.E. 2018 Viewing earth's surface as a soft-matter landscape. Nat. Rev. Phys. 12, 716730.Google Scholar
Johnson, B.A. & Cowen, E.A. 2020 Sediment suspension and bed morphology in a mean shear free turbulent boundary layer. J. Fluid Mech. 894, A8.CrossRefGoogle Scholar
Johnson, L.D., Koplik, J. & Dashen, R. 1987 Theory of dynamic permeability and tortuosity in fluid-saturated porous media. J. Fluid Mech. 176, 379402.CrossRefGoogle Scholar
La Ragione, L., Laurent, K., Jenkins, J.T. & Bewley, G.P. 2019 Bedforms produced on a particle bed by vertical oscillations of a plate. Phys. Rev. Lett. 123 (5), 058501.CrossRefGoogle ScholarPubMed
Laurent, K., La Ragione, L., Jenkins, J.T. & Bewley, G.P. 2022 How vertical oscillatory motion above a saturated sand bed leads to heap formation. Phys. Rev. E 105, 054901.CrossRefGoogle ScholarPubMed
Liu, P.P.Y. & Lara, J. 2007 Long-wave-induced flows in an unsaturated permeable seabed. J. Fluid Mech. 586, 323345.CrossRefGoogle Scholar
Louge, M.Y., Carroll, C.S. & Turnbull, B. 2011 Role of pore pressure gradients in sustaining frontal particle entrainment in eruption currents: the case of powder snow avalanches. J. Geophys. Res. 116, F04030.Google Scholar
Marchal, P., Hanotin, C., Michot, L.J. & de Richter, S.K. 2013 Two-state model to describe the rheological behavior of vibrated granular matter. Phys. Rev. E 88 (1), 012207.CrossRefGoogle ScholarPubMed
Marchal, P., Smirani, N. & Choplin, L. 2009 Rheology of dense-phase vibrated powders and molecular analogies. J. Rheol. 53, 129.CrossRefGoogle Scholar
Rivera-Rosario, G.A., Diamessis, P.J. & Jenkins, J.T. 2017 Bed failure induced by internal solitary waves. J. Geophys. Res. 122, 122.CrossRefGoogle Scholar
Shields, A. 1936 Sand ripples and dunes. PhD thesis, Preußische Versuchsanstalt für Wasserbau und Schiffbau.Google Scholar
Song, O. 1986 Modal analysis of a cantilever plate. PhD thesis, New Jersey Institute of Technology.Google Scholar
Sumer, B.M. 2014 Liquefaction Around Marine Structures. World Scientific.CrossRefGoogle Scholar
Yadykin, Y., Tenetov, V. & Levin, D. 2003 The added mass of a flexible plate oscillating in a fluid. J. Fluids Struct. 17 (1), 115123.CrossRefGoogle Scholar
Zhou, Y.C., Xu, B.H., Yu, A.B. & Zulli, P. 2002 An experimental and numerical study of the angle of repose of coarse spheres. Powder Technol. 125, 4554.CrossRefGoogle Scholar
Figure 0

Figure 1. The experimental set-up with the Cartesian reference at the top of the bed under the plate.

Figure 1

Figure 2. (a) The evolution of heap height at different dimensionless times; (b) the evolution normalized by the centre height.

Figure 2

Figure 3. The experimental set-up: (a) a detail of an experiment with two perpendicular laser sheets, (b) and the hydrophone and the small white dots to monitor the plate displacements.

Figure 3

Table 1. Experimental data.

Figure 4

Figure 4. (ac) The dimensionless displacement, $Dz/d_p$, of the plate during the test; and (df) bed topography at the end of the test (coloured dots) for the $3.5\times 17.5$ cm plate at a shaker amplitude of 1.19 particle diameters and a frequency of 30 Hz (a,d), 0.61 particle diameters and a frequency of 40 Hz (b,e) and 0.31 particle diameters and a frequency of 50 Hz (c,f).

Figure 5

Figure 5. (ac) The dimensionless displacement, $Dz/d_p$, of the plate during the test; maximum and minimum pressures measured above the bed, when the hydrophone is moved at a constant rate below the plate (df) and (gi) bed topography at the end of the test (coloured dots) for the $5\times 15$ cm plate at a shaker amplitude of 1.80 particle diameters and a frequency of 30 Hz (a,d,g), 0.89 particle diameters and a frequency of 60 Hz (b,e,h) and 1.83 particle diameters and a frequency of 90 Hz (c,f,i).

Figure 6

Figure 6. Evolution of the heap under a flexible plate: (a) first mode of vibration; (b) second mode of vibration.

Figure 7

Figure 7. Evolution of normalized heap height over time: (a) long-term progression, with the initial regime as a shadowed area; (b) comparison between theoretical prediction (solid line) and experimental results (squares) with error bars.

Figure 8

Figure 8. Evolution of the normalized height of the heap under flexible rectangular plate, theory (solid line) and experimental data (squares): (a) oscillation at 60 Hz, two heaps; (b) oscillation at 90 Hz, three heaps.