


1. Introduction
Over the past half-century in particular, flow-induced vibration (FIV) of bluff bodies has been a subject of great interest due to its complex physics and its application to a wide range of engineering problems. These include the design of high-rise buildings, bridges, chimneys, overhead cables/wires subjected to winds, offshore platforms, oil risers subjected to ocean currents and many more. In terms of flow physics, there are two characteristic body-oscillator phenomena associated with FIV: vortex-induced vibration (VIV) and galloping. Vortex-induced vibration is driven by fluid forces resulting from the periodic shedding of vortices of alternating signs from alternate sides of a bluff body. On the other hand, galloping is driven by movement-induced aerodynamic forces and is characterised by large lateral body oscillations that increase with flow velocity. The present study focuses on VIV.
The non-dimensional governing parameters for the present problem of FIV are: mass ratio, $m^*$
, velocity ratio,
$m^*$
, velocity ratio, $U^*$
, damping ratio,
$U^*$
, damping ratio, $\zeta$
, and Reynolds number,
$\zeta$
, and Reynolds number, $Re$
. The mathematical definitions of these governing parameters are given by
$Re$
. The mathematical definitions of these governing parameters are given by
 \begin{equation} \ m^* = \frac {m}{\rho _f A_c L},\ \ U^* = \frac {U}{f_N D},\ \, \ \zeta = \frac {c}{2\sqrt {k(m+m_A)}}\ \ \textrm {and}\ Re = \frac {\rho _f U D}{\mu },\, \end{equation}
where $m$
,
$m$
, $A_c$
,
$A_c$
, $L$
and
$L$
and $f_N$
are the total mass, cross-sectional area, length and natural frequency of the cylinder, respectively;
$f_N$
are the total mass, cross-sectional area, length and natural frequency of the cylinder, respectively; $\rho _f$
,
$\rho _f$
, $\mu$
and
$\mu$
and $U$
are the density, dynamic viscosity and inlet velocity of the fluid, respectively;
$U$
are the density, dynamic viscosity and inlet velocity of the fluid, respectively; $k$
and
$k$
and $c$
are the spring stiffness and damping coefficient of the spring-damper system, respectively; and
$c$
are the spring stiffness and damping coefficient of the spring-damper system, respectively; and $m_A$
is the potential flow added mass.
$m_A$
is the potential flow added mass.
In the literature, VIV has been systematically and extensively studied for a circular cylinder. The associated vast literature is well summarised in the comprehensive reviews by Sarpkaya (Reference Sarpkaya1979), Bearman (Reference Bearman1984), Parkinson (Reference Parkinson1989), Williamson & Govardhan (Reference Williamson and Govardhan2004, Reference Williamson and Govardhan2008), Païdoussis et al. (Reference Païdoussis, Price and De Langre2010), Bearman (Reference Bearman2011) and Wu, Ge & Hong (Reference Wu, Ge and Hong2012), amongst others. In summary, the cylinder response is dependent on the Reynolds number, $Re$
, and the product of the mass ratio,
$Re$
, and the product of the mass ratio, $m^*$
, and damping ratio,
$m^*$
, and damping ratio, $\zeta$
, known as the mass-damping ratio. For low
$\zeta$
, known as the mass-damping ratio. For low $m^* \zeta$
and high
$m^* \zeta$
and high $Re$
, the response curve of the cylinder is categorised into three distinct branches: the initial, upper and lower branches, followed by a desynchronisation regime. As the name suggests, the maximum amplitude of transverse oscillations, of magnitude close to the diameter of the cylinder, occurs in the upper branch. Here, the fluid forces acts in the direction of cylinder lateral displacement to provide the total phase difference between the two of
$Re$
, the response curve of the cylinder is categorised into three distinct branches: the initial, upper and lower branches, followed by a desynchronisation regime. As the name suggests, the maximum amplitude of transverse oscillations, of magnitude close to the diameter of the cylinder, occurs in the upper branch. Here, the fluid forces acts in the direction of cylinder lateral displacement to provide the total phase difference between the two of $\phi \approx 0^\circ$
. The transition from the initial branch to the upper branch is due to a resonant phenomenon known as lock-in. While in this resonant state, the transition from the upper branch to the lower branch is due to jump in the total phase to
$\phi \approx 0^\circ$
. The transition from the initial branch to the upper branch is due to a resonant phenomenon known as lock-in. While in this resonant state, the transition from the upper branch to the lower branch is due to jump in the total phase to $\phi \approx 180^\circ$
. Actually, the definition of lock-in is somewhat ambiguous in the literature. Williamson & Govardhan (Reference Williamson and Govardhan2004) discuss this point in reasonable detail. Traditionally, lock-in refers to the matching of the vortex shedding frequency to the body or structural oscillation frequency, which leads to a clear resonant response – this typically occurs for the upper branch, if it exists. Lock-in can also be understood as the condition where the body frequency response remains close to the natural oscillation frequency, although for small mass ratios, the deviation may not be negligible. This phenomenon can occur over a wide range of reduced velocities, often extending well past the nominal natural resonance, typically around 5–6. This behaviour has been observed for both the upper and lower branches in the VIV of circular cylinders (e.g. Williamson & Govardhan Reference Williamson and Govardhan2004), as well as for the lower branch in the case of the
$\phi \approx 180^\circ$
. Actually, the definition of lock-in is somewhat ambiguous in the literature. Williamson & Govardhan (Reference Williamson and Govardhan2004) discuss this point in reasonable detail. Traditionally, lock-in refers to the matching of the vortex shedding frequency to the body or structural oscillation frequency, which leads to a clear resonant response – this typically occurs for the upper branch, if it exists. Lock-in can also be understood as the condition where the body frequency response remains close to the natural oscillation frequency, although for small mass ratios, the deviation may not be negligible. This phenomenon can occur over a wide range of reduced velocities, often extending well past the nominal natural resonance, typically around 5–6. This behaviour has been observed for both the upper and lower branches in the VIV of circular cylinders (e.g. Williamson & Govardhan Reference Williamson and Govardhan2004), as well as for the lower branch in the case of the $AR=5$
body, as shown in figure 3. Moreover, in terms of wake structure, the initial branch exhibits a 2S wake mode, the lower branch exhibits 2S or 2P wake modes and the upper branch shows greater complexity with transitions between 2S, 2Po and 2P wake modes (Williamson & Roshko Reference Williamson and Roshko1988; Morse & Williamson Reference Morse and Williamson2009; Zhao et al. Reference Zhao, Leontini, Lo Jacono and Sheridan2014a
; Dorogi & Baranyi Reference Dorogi and Baranyi2020).
$AR=5$
body, as shown in figure 3. Moreover, in terms of wake structure, the initial branch exhibits a 2S wake mode, the lower branch exhibits 2S or 2P wake modes and the upper branch shows greater complexity with transitions between 2S, 2Po and 2P wake modes (Williamson & Roshko Reference Williamson and Roshko1988; Morse & Williamson Reference Morse and Williamson2009; Zhao et al. Reference Zhao, Leontini, Lo Jacono and Sheridan2014a
; Dorogi & Baranyi Reference Dorogi and Baranyi2020).
The present work aims to understand the role of the afterbody on FIV of cylinders. The afterbody is defined as the region of the bluff body downstream of the point of separation and is considered an important component in generating the magnitude and phase of fluid forces responsible for FIV (Bearman Reference Bearman1984). This topic gained attention following the pioneering work by Brooks (Reference Brooks1960), who observed no transverse vibration motion for a reverse-D-shaped cylinder (curved surface upstream), other than random buffeting. He postulated two possible reasons behind this behaviour: (i) high and positive aerodynamic damping; (ii) absence of an afterbody. The latter reason was cited in various review articles and books (Parkinson Reference Parkinson1989; Meneghini et al. Reference Meneghini, Saltara, Fregonesi and Yamamoto2005; Naudascher Reference Naudascher2017), leading to the consensus that an afterbody is necessary for energising vibrations.
However, recent experiments by Zhao et al. (Reference Zhao, Hourigan and Thompson2018a
) contradicted this common conclusion. They observed significant transverse vibration, with a maximum amplitude close to 0.7 times the diameter, for a reverse-D cylinder in water-channel experiments, and thus argued that an afterbody is not essential for VIV. These experiments were conducted for a cylinder with $m^* = 6.0$
,
$m^* = 6.0$
, $\zeta =0.00151$
at
$\zeta =0.00151$
at $Re \approx 1080$
–
$Re \approx 1080$
– $9000$
. More recently, similar results of significant transverse vibrations were observed by Chen et al. (Reference Chen, Ji, Alam, Xu, An, Tong and Zhao2022) for a reverse-D cylinder at low
$9000$
. More recently, similar results of significant transverse vibrations were observed by Chen et al. (Reference Chen, Ji, Alam, Xu, An, Tong and Zhao2022) for a reverse-D cylinder at low $Re = 100$
using two-dimensional (2-D) numerical simulations. They concluded, through force decomposition, that viscous forces acting on the forebody are responsible for maintaining these transverse vibrations. Hence, they suggested that an afterbody is not essential for maintaining VIV at low
$Re = 100$
using two-dimensional (2-D) numerical simulations. They concluded, through force decomposition, that viscous forces acting on the forebody are responsible for maintaining these transverse vibrations. Hence, they suggested that an afterbody is not essential for maintaining VIV at low $Re$
. However, for high
$Re$
. However, for high $Re$
, they postulated that an afterbody is essential and the significant transverse vibration observed by Zhao et al. (Reference Zhao, Hourigan and Thompson2018a
) was probably due to presence of an afterbody. Their suggestion was based on the result of Jiang (Reference Jiang2020), who observed a separation angle smaller than
$Re$
, they postulated that an afterbody is essential and the significant transverse vibration observed by Zhao et al. (Reference Zhao, Hourigan and Thompson2018a
) was probably due to presence of an afterbody. Their suggestion was based on the result of Jiang (Reference Jiang2020), who observed a separation angle smaller than $90^\circ$
for
$90^\circ$
for $Re\gt 1700$
for a stationary circular cylinder.
$Re\gt 1700$
for a stationary circular cylinder.
Thus, it is apparent from the preceding discussion that the role of an afterbody, particularly at high $Re$
, remains unresolved in the literature. This study attempts to address this gap by analysing the FIV response of a slender reverse-D cylinder with an aspect ratio of
$Re$
, remains unresolved in the literature. This study attempts to address this gap by analysing the FIV response of a slender reverse-D cylinder with an aspect ratio of $AR=5$
. Here, the aspect ratio,
$AR=5$
. Here, the aspect ratio, $AR$
, is defined as the ratio of the cylinder dimensions in the transverse to streamwise direction, and the reverse-D cylinder is formed by slicing the circular cylinder at a streamwise distance measured from its leading edge, as depicted in figure 1. The rationale for examining this geometry is that the flow is less likely to separate before reaching the top and bottom edges. The study utilises both water-channel-based experiments and unsteady Reynolds-averaged Navier–Stokes equations (RANS) based 2-D numerical simulations, leveraging the strengths of both approaches. The experimental results will verify whether our RANS-based simulations accurately predict the cylinder response, while the numerical results will aid in confirming the presence of an afterbody and facilitate the decomposition of fluid forces acting on the cylinder more easily.
$AR$
, is defined as the ratio of the cylinder dimensions in the transverse to streamwise direction, and the reverse-D cylinder is formed by slicing the circular cylinder at a streamwise distance measured from its leading edge, as depicted in figure 1. The rationale for examining this geometry is that the flow is less likely to separate before reaching the top and bottom edges. The study utilises both water-channel-based experiments and unsteady Reynolds-averaged Navier–Stokes equations (RANS) based 2-D numerical simulations, leveraging the strengths of both approaches. The experimental results will verify whether our RANS-based simulations accurately predict the cylinder response, while the numerical results will aid in confirming the presence of an afterbody and facilitate the decomposition of fluid forces acting on the cylinder more easily.

Figure 1. (a) Experimental set-up and (b) computational domain (not to scale) used for the present study.
The layout of this paper is as follows. In § 2, we provide a detailed discussion of the experimental and numerical set-up employed to investigate FIV of a reverse-D cylinder with $AR=5$
. The results pertaining to FIV of the reverse-D cylinder with
$AR=5$
. The results pertaining to FIV of the reverse-D cylinder with $AR=5$
are presented in § 3. This section includes an examination of the cylinder response, an assessment of the presence or absence of an afterbody and a discussion of the mechanisms underlying the observed VIV. Subsequently, in § 3.4, a comprehensive analysis is conducted to evaluate the role of an afterbody in the VIV of cylinders. This analysis involves comparing the findings from the present investigation of the reverse-D cylinder with
$AR=5$
are presented in § 3. This section includes an examination of the cylinder response, an assessment of the presence or absence of an afterbody and a discussion of the mechanisms underlying the observed VIV. Subsequently, in § 3.4, a comprehensive analysis is conducted to evaluate the role of an afterbody in the VIV of cylinders. This analysis involves comparing the findings from the present investigation of the reverse-D cylinder with $AR=5$
to established cases involving reverse-D cylinders with
$AR=5$
to established cases involving reverse-D cylinders with $AR=2$
(semi-circular cylinder) and
$AR=2$
(semi-circular cylinder) and $AR=1$
(circular cylinder). Finally, our conclusions are summarised in § 4.
$AR=1$
(circular cylinder). Finally, our conclusions are summarised in § 4.
2. Methodology
The body dynamics of one degree-of-freedom (DoF) transverse vibration of a cylinder is governed by the linear second-order oscillator equation, given by
 \begin{equation} m \ddot y(t) + c \dot y(t) + ky(t) = F_y(t), \end{equation}
where $m$
is the total oscillating mass,
$m$
is the total oscillating mass, $y(t)$
is the cylinder displacement,
$y(t)$
is the cylinder displacement, $c$
is the structural damping of the system,
$c$
is the structural damping of the system, $k$
is the spring constant and
$k$
is the spring constant and $F_y(t)$
is the transverse fluid forcing.
$F_y(t)$
is the transverse fluid forcing.
2.1. Experimental set-up
The experiments described were conducted in the free-surface recirculating water channel situated within the Fluids Laboratory for Aeronautical and Industrial Research (FLAIR) at Monash University. The test section of the water channel measures 600 mm $\times$
800 mm
$\times$
800 mm $\times$
4000 mm in width, depth and length, respectively. A one DoF spring-mass system was modelled using a low-friction air-bearing rig, positioned atop the water channel; refer to figure 1(a). This air-bearing rig was restricted to movement only transverse to the direction of the free-stream flow. More details on the water-channel facility and air-bearing rig can be found in related studies of Wong et al. (Reference Wong, Zhao, Lo Jacono, Thompson and Sheridan2018) and Zhao, Hourigan & Thompson (Reference Zhao, Hourigan and Thompson2019). The test D-cross-section cylinder of
$\times$
4000 mm in width, depth and length, respectively. A one DoF spring-mass system was modelled using a low-friction air-bearing rig, positioned atop the water channel; refer to figure 1(a). This air-bearing rig was restricted to movement only transverse to the direction of the free-stream flow. More details on the water-channel facility and air-bearing rig can be found in related studies of Wong et al. (Reference Wong, Zhao, Lo Jacono, Thompson and Sheridan2018) and Zhao, Hourigan & Thompson (Reference Zhao, Hourigan and Thompson2019). The test D-cross-section cylinder of $AR=5$
was manufactured from aluminium plate via computer numerical control and electrical discharge machining and had streamwise and transverse dimensions of
$AR=5$
was manufactured from aluminium plate via computer numerical control and electrical discharge machining and had streamwise and transverse dimensions of $a = 6 \pm 0.01\,\rm mm$
and
$a = 6 \pm 0.01\,\rm mm$
and $D = 30 \pm 0.01\,\rm mm$
, respectively, giving an aspect ratio of
$D = 30 \pm 0.01\,\rm mm$
, respectively, giving an aspect ratio of $AR = D/a = 5$
. Additionally, the immersed length of the cylinder was
$AR = D/a = 5$
. Additionally, the immersed length of the cylinder was $450 \pm 0.5\,\rm mm$
, giving a minimum
$450 \pm 0.5\,\rm mm$
, giving a minimum $L/D = 15$
. To reduce end effects and promote parallel vortex shedding an end-conditioning platform of dimensions 595 mm
$L/D = 15$
. To reduce end effects and promote parallel vortex shedding an end-conditioning platform of dimensions 595 mm $\times$
600 mm
$\times$
600 mm $\times$
10 mm was positioned approximately 1 mm below the free end of the cylinder.
$\times$
10 mm was positioned approximately 1 mm below the free end of the cylinder.
During the experiments, the total oscillating mass was $m = 906.5\,\rm g$
and the mass of displaced water was
$m = 906.5\,\rm g$
and the mass of displaced water was $m_d =55.5\,\rm g$
, providing a mass ratio
$m_d =55.5\,\rm g$
, providing a mass ratio $m^* = m / m_d = 16.33$
. The velocity ratio was increased over the range
$m^* = m / m_d = 16.33$
. The velocity ratio was increased over the range $U^* = 2.5 - 10$
in steps of 0.1 corresponding to a Reynolds-number range of
$U^* = 2.5 - 10$
in steps of 0.1 corresponding to a Reynolds-number range of $Re = 1200 - 4700$
. The structural damping ratio, and the natural frequencies of the spring-mass system in water and air, were found to be
$Re = 1200 - 4700$
. The structural damping ratio, and the natural frequencies of the spring-mass system in water and air, were found to be $\zeta = 0.00377$
,
$\zeta = 0.00377$
, $f_{nw} = 0.532 \pm 0.01\,\rm Hz$
and
$f_{nw} = 0.532 \pm 0.01\,\rm Hz$
and $f_{na} = 0.540 \pm 0.01\,\rm Hz$
, respectively, based on free-decay tests in water and air. Here,
$f_{na} = 0.540 \pm 0.01\,\rm Hz$
, respectively, based on free-decay tests in water and air. Here, $m_A$
is the added mass, which can be related to these frequencies through the relationship
$m_A$
is the added mass, which can be related to these frequencies through the relationship $m_A = m((f_{na}/f_{nw})^2-1)$
.
$m_A = m((f_{na}/f_{nw})^2-1)$
.
For data acquisition and processing, the traverse displacement of the cylinder was measured by using a non-contact digital optical linear encoder (model RGH24; Renishaw, UK). This encoder has a range of $\pm$
200 mm with a resolution of 1
$\pm$
200 mm with a resolution of 1 $\unicode{x03BC}\rm m$
. The streamwise fluid force
$\unicode{x03BC}\rm m$
. The streamwise fluid force $(F_x)$
was measured directly by using a two-component force balance. While, the transverse lift force
$(F_x)$
was measured directly by using a two-component force balance. While, the transverse lift force $(F_y)$
was derived using (2.1). Successful validation of these calculations can be found in related studies of Zhao et al. (Reference Zhao, Leontini, Lo Jacono and Sheridan2014b
, Reference Zhao, Lo Jacono, Sheridan, Hourigan and Thompson2018b
). The signals for the cylinder displacement and fluid forces were sampled at a rate of 100 Hz for 300 s, which is equivalent to more than 100 oscillation cycles.
$(F_y)$
was derived using (2.1). Successful validation of these calculations can be found in related studies of Zhao et al. (Reference Zhao, Leontini, Lo Jacono and Sheridan2014b
, Reference Zhao, Lo Jacono, Sheridan, Hourigan and Thompson2018b
). The signals for the cylinder displacement and fluid forces were sampled at a rate of 100 Hz for 300 s, which is equivalent to more than 100 oscillation cycles.
2.2. Numerical set-up
For similar governing input parameters as those used in the experiments, we also conducted 2-D numerical simulations using version 10 of the open-source finite-volume computational fluid dynamics toolbox, OpenFOAM. The unsteady Reynolds-averaged NavierStokes (URANS) approach was employed with the two-equation shear-stress transport $k-\omega$
turbulence model to account for the effects of turbulence. Here, k and
$k-\omega$
turbulence model to account for the effects of turbulence. Here, k and $ \omega$
represent the turbulent kinetic energy and specific dissipation rate, respectively.
$ \omega$
represent the turbulent kinetic energy and specific dissipation rate, respectively.
Figure 1(b) shows the computational domain used for the present numerical investigation. The computational domain was non-dimensionalised by using the transverse dimension $D$
of the cylinder. The centre of the cylinder was located at the origin (0,0), and all of the four boundaries (front, rear, top and bottom) were set
$D$
of the cylinder. The centre of the cylinder was located at the origin (0,0), and all of the four boundaries (front, rear, top and bottom) were set $50D$
away from it. Consequently, the lateral blockage for the present numerical set-up was
$50D$
away from it. Consequently, the lateral blockage for the present numerical set-up was $1.2\,\%$
, ensuring minimum/negligible effect of the side boundaries on the flow field. The flow is moving from left to right with the curved side of the cylinder facing upstream/windward.
$1.2\,\%$
, ensuring minimum/negligible effect of the side boundaries on the flow field. The flow is moving from left to right with the curved side of the cylinder facing upstream/windward.
A uniform inlet velocity boundary condition was applied at the inlet, with constant static pressure maintained at the outlet. Zero-gradient boundary conditions were applied at the lateral sides. A no-slip boundary condition was enforced on the cylinder surface. The methodology described by Menter (Reference Menter1994) was adopted for applying the boundary conditions for turbulent kinetic energy $k$
and specific dissipation rate
$k$
and specific dissipation rate $\omega$
. Specifically, at the cylinder surface,
$\omega$
. Specifically, at the cylinder surface, $k=0$
and
$k=0$
and $\omega = 60\nu / 0.075y_1^2$
, while in the far field,
$\omega = 60\nu / 0.075y_1^2$
, while in the far field, $k=0.1U^2/Re$
and
$k=0.1U^2/Re$
and $\omega = 10U/\rm D$
. Here,
$\omega = 10U/\rm D$
. Here, $y_1$
is the normal dimension of the first cell next to the cylinder. Finally, the front and back patches were applied with empty constraint condition to enforce two-dimensional flow.
$y_1$
is the normal dimension of the first cell next to the cylinder. Finally, the front and back patches were applied with empty constraint condition to enforce two-dimensional flow.
The in-built morphing mesh method along with the explicit second-order accurate motion solver Symplectic was used to incorporate the temporal change of the fluid and cylinder boundaries. The solver uses the PIMPLE algorithm that performs two outer, one inner and three non-orthogonal corrector iterations. PIMPLE is an acronym merged from PISO (Pressure Implicit with Splitting of Operators) and SIMPLE (Semi-Implicit Method for Pressure-Linked Equations). The second-order implicit backward method was used to integrate forward in time, while the Gauss linear scheme was used for the gradient and divergence terms of the momentum equation, overall maintaining second-order accuracy. The Courant number was set to $C=0.9$
for the simulations.
$C=0.9$
for the simulations.
2.3. Grid independence and validation studies

Figure 2. Grid independence and validation studies. (a) Comparison of time histories of non-dimensional transverse displacement ( $Y$
) for a reverse-D cylinder of
$Y$
) for a reverse-D cylinder of $AR=5$
for
$AR=5$
for $m^*=16.33$
,
$m^*=16.33$
, $\zeta = 0.00377$
,
$\zeta = 0.00377$
, $U^* = 6.5$
and
$U^* = 6.5$
and $Re \approx 3000$
. Comparison of non-dimensional amplitude ratio
$Re \approx 3000$
. Comparison of non-dimensional amplitude ratio $A^*$
for reverse-D cylinder of
$A^*$
for reverse-D cylinder of $AR=2$
with (b) numerical predictions by Sharma, Garg & Bhardwaj (Reference Sharma, Garg and Bhardwaj2022) for
$AR=2$
with (b) numerical predictions by Sharma, Garg & Bhardwaj (Reference Sharma, Garg and Bhardwaj2022) for $m^*=12.73$
,
$m^*=12.73$
, $\zeta =0$
and
$\zeta =0$
and $Re = 100$
; and (c) experimental results by Zhao et al. (Reference Zhao, Hourigan and Thompson2018a
) for
$Re = 100$
; and (c) experimental results by Zhao et al. (Reference Zhao, Hourigan and Thompson2018a
) for $m^*=6.0$
,
$m^*=6.0$
, $\zeta =0.00151$
and
$\zeta =0.00151$
and $Re \approx 1080{-}2750$
. See text for further details.
$Re \approx 1080{-}2750$
. See text for further details.
A non-uniform body-fitted grid was used to discretise the computational domain. The grid was considerably finer in the vicinity of the cylinder and coarser in the far field. Three different grids of total cell counts 25 000, 42 000 and 60 000 were compared for capturing the time-varying displacement $Y$
of the reverse-D cylinder with
$Y$
of the reverse-D cylinder with $AR=5$
at
$AR=5$
at $U^*=6.5$
. This case leads to the maximum amplitude ratio (
$U^*=6.5$
. This case leads to the maximum amplitude ratio ( $A^* = A_{10,max}/D$
, where
$A^* = A_{10,max}/D$
, where $A_{10,max}$
is the mean of the top 10% of peaks observed for cylinder amplitude,
$A_{10,max}$
is the mean of the top 10% of peaks observed for cylinder amplitude, $Y$
) observed in the experiments and the corresponding comparison is presented in figure 2(a). The figure shows that the grid with a total cell grid count of 25 000 is unable to capture the oscillation response correctly. On increasing the total cell count to 42 000, the VIV response (
$Y$
) observed in the experiments and the corresponding comparison is presented in figure 2(a). The figure shows that the grid with a total cell grid count of 25 000 is unable to capture the oscillation response correctly. On increasing the total cell count to 42 000, the VIV response ( $Y$
) is captured properly and there is negligible change in VIV response with a further increase in the total cell count to 55 000. Furthermore, the
$Y$
) is captured properly and there is negligible change in VIV response with a further increase in the total cell count to 55 000. Furthermore, the $A^*$
value from this
$A^*$
value from this $Y$
matches well with that from experiments; refer to figure 3. Thus, the grid with a total cell count of 42 000 was used for all subsequent simulations unless otherwise stated.
$Y$
matches well with that from experiments; refer to figure 3. Thus, the grid with a total cell count of 42 000 was used for all subsequent simulations unless otherwise stated.
For validating the present numerical method against its ability to correctly predict the VIV response, we compared the non-dimensional amplitude ratio ( $A^*$
) against the numerical predictions of Sharma et al. (Reference Sharma, Garg and Bhardwaj2022) for low
$A^*$
) against the numerical predictions of Sharma et al. (Reference Sharma, Garg and Bhardwaj2022) for low $Re$
, and experimental results of Zhao et al. (Reference Zhao, Hourigan and Thompson2018a
) for high
$Re$
, and experimental results of Zhao et al. (Reference Zhao, Hourigan and Thompson2018a
) for high $Re$
. Both of studies were carried out for the reverse-D cylinder for
$Re$
. Both of studies were carried out for the reverse-D cylinder for $AR=2$
(semi-circular cylinder). For low
$AR=2$
(semi-circular cylinder). For low $Re$
, the validation was carried out for
$Re$
, the validation was carried out for $m^*=12.73$
,
$m^*=12.73$
, $\zeta =0$
and
$\zeta =0$
and $Re = 100$
, and the corresponding results are plotted in figure 2(b). The figure shows good agreement with the reference studies for the amplitude response as the reduced velocity is varied. These comparisons indicate good predictive performance of the present method. It is important to note that, for the low Reynolds validation study, we adopted the computational domain size used by Sharma et al. (Reference Sharma, Garg and Bhardwaj2022). The corresponding grid consisted of 25 000 cells.
$Re = 100$
, and the corresponding results are plotted in figure 2(b). The figure shows good agreement with the reference studies for the amplitude response as the reduced velocity is varied. These comparisons indicate good predictive performance of the present method. It is important to note that, for the low Reynolds validation study, we adopted the computational domain size used by Sharma et al. (Reference Sharma, Garg and Bhardwaj2022). The corresponding grid consisted of 25 000 cells.
For high $Re$
, the validations were carried out for
$Re$
, the validations were carried out for $m^*=6.0$
,
$m^*=6.0$
, $\zeta =0.00151$
and
$\zeta =0.00151$
and $Re \approx 1080$
–
$Re \approx 1080$
– $2750$
, corresponding to
$2750$
, corresponding to $U^* = 2.3$
–
$U^* = 2.3$
– $6.0$
. The corresponding results are plotted in figure 2(c). The figure shows good agreement between the present and published results for the initial and upper branches. However, for
$6.0$
. The corresponding results are plotted in figure 2(c). The figure shows good agreement between the present and published results for the initial and upper branches. However, for $U^* \gt 6.0$
(not presented in the figure), the 2-D URANS simulations overpredict the response relative to the experiments; however, they predict the upper branch response very well, which is the main focus of the paper.
$U^* \gt 6.0$
(not presented in the figure), the 2-D URANS simulations overpredict the response relative to the experiments; however, they predict the upper branch response very well, which is the main focus of the paper.
3. Results
In this section, we discuss the cylinder response along with the physical mechanism supporting the vibration for a reverse-D cylinder of $AR=5$
. The non-dimensional governing input parameters are: mass ratio
$AR=5$
. The non-dimensional governing input parameters are: mass ratio $m^*=16.33$
, damping ratio
$m^*=16.33$
, damping ratio $\zeta = 0.00377$
, added mass coefficient
$\zeta = 0.00377$
, added mass coefficient $C_A = 0.31$
, velocity ratio
$C_A = 0.31$
, velocity ratio $U^* = 2.6$
–
$U^* = 2.6$
– $10$
and
$10$
and $Re = 1200$
–
$Re = 1200$
– $4700$
.
$4700$
.
3.1. The vibration responses
We begin our investigation by checking whether there are any significant transverse oscillations for the present case of a reverse-D cylinder of $AR=5$
. This is done here by recording and analysing the cylinder response from the water-channel-based experiments. Following this, a quantitative comparison between the predictions of the 2-D simulations and the water-channel-based results is undertaken. The figures illustrating these cylinder responses are presented in figure 3.
$AR=5$
. This is done here by recording and analysing the cylinder response from the water-channel-based experiments. Following this, a quantitative comparison between the predictions of the 2-D simulations and the water-channel-based results is undertaken. The figures illustrating these cylinder responses are presented in figure 3.

Figure 3. Response curves. Variation of non-dimensional amplitude ratio ( $A^* = A_{10}/D$
, where
$A^* = A_{10}/D$
, where $A_{10}$
is the mean of the top 10 % peaks observed for cylinder amplitude), frequency ratio (
$A_{10}$
is the mean of the top 10 % peaks observed for cylinder amplitude), frequency ratio ( $f^* = f/f_{nw}$
) and the total phase difference between the lift force and displacement (
$f^* = f/f_{nw}$
) and the total phase difference between the lift force and displacement ( $\phi$
) with the reduced velocity ratio (
$\phi$
) with the reduced velocity ratio ( $U^*$
).
$U^*$
).
The experimental results of figure 3 show significant transverse oscillations of maximum amplitude $\approx 0.5D$
for the present case of the reverse-D cylinder. The response curve exhibits pure VIV features like those of a circular cylinder. At low values of velocity ratio
$\approx 0.5D$
for the present case of the reverse-D cylinder. The response curve exhibits pure VIV features like those of a circular cylinder. At low values of velocity ratio $U^* \leq 5.2$
, the figure shows negligible or no vibration, frequency ratio
$U^* \leq 5.2$
, the figure shows negligible or no vibration, frequency ratio $f^*$
equal to the shedding frequency of the stationary cylinder
$f^*$
equal to the shedding frequency of the stationary cylinder $f_s$
at the same Reynolds number (
$f_s$
at the same Reynolds number ( $Re$
) and a total phase difference
$Re$
) and a total phase difference $\phi \sim 0^\circ$
. This response closely resembles the pre-resonant behaviour observed in the circular cylinder case. As the velocity ratio is increased to
$\phi \sim 0^\circ$
. This response closely resembles the pre-resonant behaviour observed in the circular cylinder case. As the velocity ratio is increased to $U^* \sim 5.2$
, the onset of lock-in occurs with frequency ratio
$U^* \sim 5.2$
, the onset of lock-in occurs with frequency ratio $f^* \sim 1.0$
that leads to sudden jump in
$f^* \sim 1.0$
that leads to sudden jump in $A^*$
that remains almost constant until
$A^*$
that remains almost constant until $U^* \sim 7.5$
. This plateau branch is accompanied by a total phase difference of
$U^* \sim 7.5$
. This plateau branch is accompanied by a total phase difference of $\phi \sim 180^\circ$
, akin to the lower branch observed in the case of a circular cylinder (
$\phi \sim 180^\circ$
, akin to the lower branch observed in the case of a circular cylinder ( $AR=1$
). As the velocity ratio is further increased,
$AR=1$
). As the velocity ratio is further increased, $A^*$
drops sharply. In this branch, the frequency ratio
$A^*$
drops sharply. In this branch, the frequency ratio $f^*$
reverts back to the shedding frequency of the stationary cylinder
$f^*$
reverts back to the shedding frequency of the stationary cylinder $f_s$
at the same
$f_s$
at the same $Re$
, while the total phase difference remains
$Re$
, while the total phase difference remains $\phi \sim 180^\circ$
, reminiscent of the desynchronisation branch observed in the circular cylinder case.
$\phi \sim 180^\circ$
, reminiscent of the desynchronisation branch observed in the circular cylinder case.
The comparison between the numerical and experimental results in figure 3 shows a semi-quantitative agreement. This includes predominantly capturing the amplitude ratio $A^*$
, and frequency ratio
$A^*$
, and frequency ratio $f^*$
and total phase difference
$f^*$
and total phase difference $\phi$
. However, there are some differences. Compared with experiments, the numerical predictions show more a gradual increment and decrement in the amplitude ratio,
$\phi$
. However, there are some differences. Compared with experiments, the numerical predictions show more a gradual increment and decrement in the amplitude ratio, $A^*$
. Again, for the present study, we are interested only in the substantial transverse vibration present in the lower branch. This branch is well reproduced by the 2-D numerical simulations. Thus, the numerical results corresponding to the lower branch are used in the subsequent sections for further investigation to understand the underlying flow physics.
$A^*$
. Again, for the present study, we are interested only in the substantial transverse vibration present in the lower branch. This branch is well reproduced by the 2-D numerical simulations. Thus, the numerical results corresponding to the lower branch are used in the subsequent sections for further investigation to understand the underlying flow physics.
3.2. The presence of an afterbody
We focus now on answering the main question of this research: is an afterbody necessary for the FIV of a cylinder in high-Reynolds-number flows? Following the methodology outlined by Chen et al. (Reference Chen, Ji, Alam, Xu, An, Tong and Zhao2022), the presence or absence of an afterbody is determined by examining the position of the most upstream point of separation. The point of separation indicates the position at which the flow over a surface undergoes a transition from attached flow to separated flow. Consequently, if this point lies on the frontal curved surface of the cylinder, then the cylinder is considered to possess an afterbody. Conversely, if it does not lie on the frontal curved surface, the cylinder is deemed to lack an afterbody. In mathematical terms, the point of separation is identified by investigating the condition where the normal velocity gradient at the surface becomes zero (Schlichting & Gersten Reference Schlichting and Gersten2016). This definition implies that the local wall shear stress is zero at the point of separation, a criterion consistent with the works of Wu et al. (Reference Wu, Wen, Yen, Weng and Wang2004) and Jiang (Reference Jiang2020). The location of separation is determined in the present work where the shear stress is zero.

Figure 4. (a) Time histories of non-dimensional transverse displacement ( $Y$
), and (b) contours of wall shear-stress magnitude at the cylinder’s curved surface at various time instances for a reverse-D cylinder of
$Y$
), and (b) contours of wall shear-stress magnitude at the cylinder’s curved surface at various time instances for a reverse-D cylinder of $AR=2$
(semi-circular cylinder). Here,
$AR=2$
(semi-circular cylinder). Here, $m^*=6.0$
,
$m^*=6.0$
, $\zeta =0.00151$
and
$\zeta =0.00151$
and $U^* = 5.0$
at
$U^* = 5.0$
at $Re \approx 2300$
and S
$Re \approx 2300$
and S $_t$
and S
$_t$
and S $_e$
in (b) represents the stagnation and separation points, respectively.
$_e$
in (b) represents the stagnation and separation points, respectively.
Before determining the position of the separation point for the present case of a reverse-D cylinder with an aspect ratio of $5$
, we first discuss the case of a reverse-D cylinder with an aspect ratio of
$5$
, we first discuss the case of a reverse-D cylinder with an aspect ratio of $2.0$
(semi-circular cylinder). This case is extracted from the experimental work of Zhao et al. (Reference Zhao, Hourigan and Thompson2018a
), with non-dimensional governing parameters:
$2.0$
(semi-circular cylinder). This case is extracted from the experimental work of Zhao et al. (Reference Zhao, Hourigan and Thompson2018a
), with non-dimensional governing parameters: $m^*=6.0$
,
$m^*=6.0$
, $\zeta =0.00151$
and
$\zeta =0.00151$
and $U^* = 5.0$
at
$U^* = 5.0$
at $Re \approx 2300$
. Figure 4 illustrates the time series of vertical displacement of the cylinder along with the shear stress at its surface at various time instants. Figure 4(a) reveals that the maximum amplitude of oscillations from the present 2-D numerical simulations is
$Re \approx 2300$
. Figure 4 illustrates the time series of vertical displacement of the cylinder along with the shear stress at its surface at various time instants. Figure 4(a) reveals that the maximum amplitude of oscillations from the present 2-D numerical simulations is $A^* = 0.64$
, in good agreement with the value of
$A^* = 0.64$
, in good agreement with the value of $A^*=0.63$
reported in experiments by Zhao et al. (Reference Zhao, Hourigan and Thompson2018a
). Therefore, the present 2-D numerical simulations effectively capture the one-DoF FIV amplitude response of the reverse-D cylinder with an aspect ratio of
$A^*=0.63$
reported in experiments by Zhao et al. (Reference Zhao, Hourigan and Thompson2018a
). Therefore, the present 2-D numerical simulations effectively capture the one-DoF FIV amplitude response of the reverse-D cylinder with an aspect ratio of $2.0$
(semi-circular cylinder). Regarding the location of the separation point, the contour plots of wall shear stress of figure 4(b) demonstrate that the flow separates from the curved part of the cylinder even when the amplitude of vibration is negligible (refer to instant (i) of figure 4
b). This behaviour closely resembles that of a stationary circular cylinder, as reported by Jiang (Reference Jiang2020). At higher amplitudes, the point of separation moves further upstream of the stagnation point (refer to instants (ii)–(v) of figure 4
b). Thus, there exists a sustained small afterbody for the FIV of a reverse-D cylinder with an aspect ratio of
$2.0$
(semi-circular cylinder). Regarding the location of the separation point, the contour plots of wall shear stress of figure 4(b) demonstrate that the flow separates from the curved part of the cylinder even when the amplitude of vibration is negligible (refer to instant (i) of figure 4
b). This behaviour closely resembles that of a stationary circular cylinder, as reported by Jiang (Reference Jiang2020). At higher amplitudes, the point of separation moves further upstream of the stagnation point (refer to instants (ii)–(v) of figure 4
b). Thus, there exists a sustained small afterbody for the FIV of a reverse-D cylinder with an aspect ratio of $2.0$
(semi-circular), as suspected by Chen et al. (Reference Chen, Ji, Alam, Xu, An, Tong and Zhao2022).
$2.0$
(semi-circular), as suspected by Chen et al. (Reference Chen, Ji, Alam, Xu, An, Tong and Zhao2022).

Figure 5. (a,b) Time histories of non-dimensional transverse displacement ( $Y$
), and (c) contours of wall shear-stress magnitude at the cylinder’s curved surface at marked time instances for a reverse-D cylinder of
$Y$
), and (c) contours of wall shear-stress magnitude at the cylinder’s curved surface at marked time instances for a reverse-D cylinder of $AR=5$
. Here,
$AR=5$
. Here, $m^*=16.33$
,
$m^*=16.33$
, $\zeta =0.00377$
and
$\zeta =0.00377$
and $U^* = 6.5$
at
$U^* = 6.5$
at $Re \approx 3050$
and S
$Re \approx 3050$
and S $_t$
in (c) represents the stagnation point.
$_t$
in (c) represents the stagnation point.
Figure 5 shows similar time series of vertical displacement and wall shear stress on the cylinder’s surface at different time instances for the present case of reverse-D cylinder of $AR=5$
. The case corresponds to
$AR=5$
. The case corresponds to $U^*=6.50$
, where we observe the maximum oscillation amplitude in figure 3. In contrast to the reverse-D cylinder with an aspect ratio of
$U^*=6.50$
, where we observe the maximum oscillation amplitude in figure 3. In contrast to the reverse-D cylinder with an aspect ratio of $2.0$
, the distributions of the wall shear stress indicate that there is no flow separation from the curved cylinder surface, even at high amplitudes. Consequently, there is no afterbody for the reverse-D cylinder with
$2.0$
, the distributions of the wall shear stress indicate that there is no flow separation from the curved cylinder surface, even at high amplitudes. Consequently, there is no afterbody for the reverse-D cylinder with $AR=5$
, yet it clearly exhibits significant vibration at high Reynolds numbers. Therefore, contrary to the conclusion drawn by Chen et al. (Reference Chen, Ji, Alam, Xu, An, Tong and Zhao2022), the present results suggest that an afterbody is not necessary to maintain substantial vibration in high-Reynolds-number flows.
$AR=5$
, yet it clearly exhibits significant vibration at high Reynolds numbers. Therefore, contrary to the conclusion drawn by Chen et al. (Reference Chen, Ji, Alam, Xu, An, Tong and Zhao2022), the present results suggest that an afterbody is not necessary to maintain substantial vibration in high-Reynolds-number flows.
Now, the question remains as to why Brooks (Reference Brooks1960) observed minimal to no transverse vibration for a reverse-D-shaped cylinder with $AR=2.0$
. It is important to note that, in comparison with Zhao et al. (Reference Zhao, Hourigan and Thompson2018a
), there are two major differences in the experimental set-up used by Brooks (Reference Brooks1960). First, Brooks’ experimental set-up allowed for all six DoFs of vibration motion, whereas Zhao et al. (Reference Zhao, Hourigan and Thompson2018a
) only permitted transverse vibrations. Second, Brooks (Reference Brooks1960) conducted experiments in a wind tunnel, whereas Zhao et al. (Reference Zhao, Hourigan and Thompson2018a
) conducted theirs in a water channel. This suggests that the mass ratio
$AR=2.0$
. It is important to note that, in comparison with Zhao et al. (Reference Zhao, Hourigan and Thompson2018a
), there are two major differences in the experimental set-up used by Brooks (Reference Brooks1960). First, Brooks’ experimental set-up allowed for all six DoFs of vibration motion, whereas Zhao et al. (Reference Zhao, Hourigan and Thompson2018a
) only permitted transverse vibrations. Second, Brooks (Reference Brooks1960) conducted experiments in a wind tunnel, whereas Zhao et al. (Reference Zhao, Hourigan and Thompson2018a
) conducted theirs in a water channel. This suggests that the mass ratio $m^*$
was significantly higher for Brooks’ experiments compared with the water-channel experiments by Zhao et al. (Reference Zhao, Hourigan and Thompson2018a
). Using the present 2-D simulations, it is not possible to study the response of the cylinder while allowing all six DoFs. However, it is feasible to investigate the effect of mass ratio
$m^*$
was significantly higher for Brooks’ experiments compared with the water-channel experiments by Zhao et al. (Reference Zhao, Hourigan and Thompson2018a
). Using the present 2-D simulations, it is not possible to study the response of the cylinder while allowing all six DoFs. However, it is feasible to investigate the effect of mass ratio $m^*$
and damping ratio
$m^*$
and damping ratio $\zeta$
if the cylinder is restricted to transverse vibrations, akin to Zhao et al. (Reference Zhao, Hourigan and Thompson2018a
). This is pursued here by increasing the mass ratio
$\zeta$
if the cylinder is restricted to transverse vibrations, akin to Zhao et al. (Reference Zhao, Hourigan and Thompson2018a
). This is pursued here by increasing the mass ratio $m^*$
and damping ratio
$m^*$
and damping ratio $\zeta$
for a reverse-D cylinder with
$\zeta$
for a reverse-D cylinder with $AR=2.0$
, while maintaining all other governing parameters identical to those in the study by Zhao et al. (Reference Zhao, Hourigan and Thompson2018a
).
$AR=2.0$
, while maintaining all other governing parameters identical to those in the study by Zhao et al. (Reference Zhao, Hourigan and Thompson2018a
).

Figure 6. Effect of (a) mass ratio $m^*$
, (b) damping ratio
$m^*$
, (b) damping ratio $\zeta$
, (c) combined mass ratio and damping ratio
$\zeta$
, (c) combined mass ratio and damping ratio $m^* \zeta$
on the FIV response of a reverse-D cylinder of
$m^* \zeta$
on the FIV response of a reverse-D cylinder of $AR=2.0$
. The results labelled as ‘Present’ in panels (a) and (b) are from numerical simulations, while panel (c) shows only predictions from numerical simulations. The maximum reduced velocity is set at
$AR=2.0$
. The results labelled as ‘Present’ in panels (a) and (b) are from numerical simulations, while panel (c) shows only predictions from numerical simulations. The maximum reduced velocity is set at $U^* = 6.0$
for these simulations, as experiments indicate that significant transverse oscillations for a D-cylinder with
$U^* = 6.0$
for these simulations, as experiments indicate that significant transverse oscillations for a D-cylinder with $AR = 2.0$
typically occur within the range of
$AR = 2.0$
typically occur within the range of $U^* \approx 3.5$
–
$U^* \approx 3.5$
– $6.0$
(Zhao et al. Reference Zhao, Hourigan and Thompson2018a
).
$6.0$
(Zhao et al. Reference Zhao, Hourigan and Thompson2018a
).
The corresponding results showing the effect of $m^*$
and
$m^*$
and $\zeta$
are presented in figures 6(a) and 6(b), respectively. The figures show that increasing either of these governing parameters results in reduction in transverse vibration
$\zeta$
are presented in figures 6(a) and 6(b), respectively. The figures show that increasing either of these governing parameters results in reduction in transverse vibration $A^*$
. Further, with increasing
$A^*$
. Further, with increasing $m^*$
, (figure 6
a) shows that the lock-in range reduces considerably. For instance, the lock-in range reduces to
$m^*$
, (figure 6
a) shows that the lock-in range reduces considerably. For instance, the lock-in range reduces to $U^* \approx 4.25 {-} 5.0$
by increasing
$U^* \approx 4.25 {-} 5.0$
by increasing $m^*$
to 100. The lock-in range reduces further to a narrow region of
$m^*$
to 100. The lock-in range reduces further to a narrow region of $U^* \approx 4.25 {-} 4.75$
by increasing
$U^* \approx 4.25 {-} 4.75$
by increasing $m^*$
to 200. The present trend of reducing lock-in range with increasing
$m^*$
to 200. The present trend of reducing lock-in range with increasing $m^*$
for a reverse-D cylinder of
$m^*$
for a reverse-D cylinder of $AR=2.0$
is similar to what was observed for a circular cylinder by Khalak & Williamson (Reference Khalak and Williamson1999). On the other hand, with increasing
$AR=2.0$
is similar to what was observed for a circular cylinder by Khalak & Williamson (Reference Khalak and Williamson1999). On the other hand, with increasing $\zeta$
, figure 6(b) shows that
$\zeta$
, figure 6(b) shows that $A^*$
reduces, however, the VIV + galloping-like trend remains. Therefore, for low
$A^*$
reduces, however, the VIV + galloping-like trend remains. Therefore, for low $m^*$
, a reversed D-cylinder of AR = 2.0 performs substantial transverse vibrations, even at very high damping.
$m^*$
, a reversed D-cylinder of AR = 2.0 performs substantial transverse vibrations, even at very high damping.
The non-dimensional amplitude of transverse vibrations $A^*$
depends on the product of the mass ratio and damping ratio
$A^*$
depends on the product of the mass ratio and damping ratio $m^* \zeta$
(Khalak & Williamson Reference Khalak and Williamson1999). For high
$m^* \zeta$
(Khalak & Williamson Reference Khalak and Williamson1999). For high $m^*$
, the effect of increasing
$m^*$
, the effect of increasing $m^* \zeta$
on
$m^* \zeta$
on $A^*$
for a reverse-D cylinder of
$A^*$
for a reverse-D cylinder of $AR=2.0$
is shown in figure 6(c). The figure shows that the maximum
$AR=2.0$
is shown in figure 6(c). The figure shows that the maximum $A^*$
reduces to
$A^*$
reduces to $\approx 0.1$
by increasing
$\approx 0.1$
by increasing $m^* \zeta = 2.0$
, which is very small as compared with the low
$m^* \zeta = 2.0$
, which is very small as compared with the low $m^*$
cases discussed above. This maximum
$m^*$
cases discussed above. This maximum $A^*$
reduces further and becomes negligible at
$A^*$
reduces further and becomes negligible at $\approx 0.025$
by increasing
$\approx 0.025$
by increasing $m^* \zeta = 10.0$
. Thus, the present 2-D numerical study suggests that the observation of no transverse vibration motion by Brooks (Reference Brooks1960) was probably due to high
$m^* \zeta = 10.0$
. Thus, the present 2-D numerical study suggests that the observation of no transverse vibration motion by Brooks (Reference Brooks1960) was probably due to high $m^* \zeta$
.
$m^* \zeta$
.
3.3. Mechanism of FIV of cylinder without an afterbody
To better understand the physical mechanism contributing to the sustaining of the cylinder vibration, Menon & Mittal (Reference Menon and Mittal2021) employed the force partitioning method to segregate the total forces acting on the body into a kinematic force, vorticity-induced force and viscosity-related force. Their findings indicated that the vorticity-induced force originating from the shear layer on the transverse surfaces of the cylinder play a pivotal role in sustaining flow-induced transverse vibration. Subsequently, Chen et al. (Reference Chen, Ji, Alam, Xu, An, Tong and Zhao2022) arrived at a similar conclusion, attributing the vibration to viscous shearing on the forebody at low Reynolds numbers ( $Re$
). However, at high Reynolds numbers, they proposed that vibrations are sustained by vortex–afterbody interactions. Notably, both of these studies were conducted at a low Reynolds number of 100. In the preceding section (§ 3.2), we demonstrated that there is no afterbody for the present case of a reverse-D cylinder for
$Re$
). However, at high Reynolds numbers, they proposed that vibrations are sustained by vortex–afterbody interactions. Notably, both of these studies were conducted at a low Reynolds number of 100. In the preceding section (§ 3.2), we demonstrated that there is no afterbody for the present case of a reverse-D cylinder for $AR = 5$
. Consequently, in this section, we investigate whether the same mechanism is responsible for sustaining transverse vibration at higher Reynolds numbers.
$AR = 5$
. Consequently, in this section, we investigate whether the same mechanism is responsible for sustaining transverse vibration at higher Reynolds numbers.

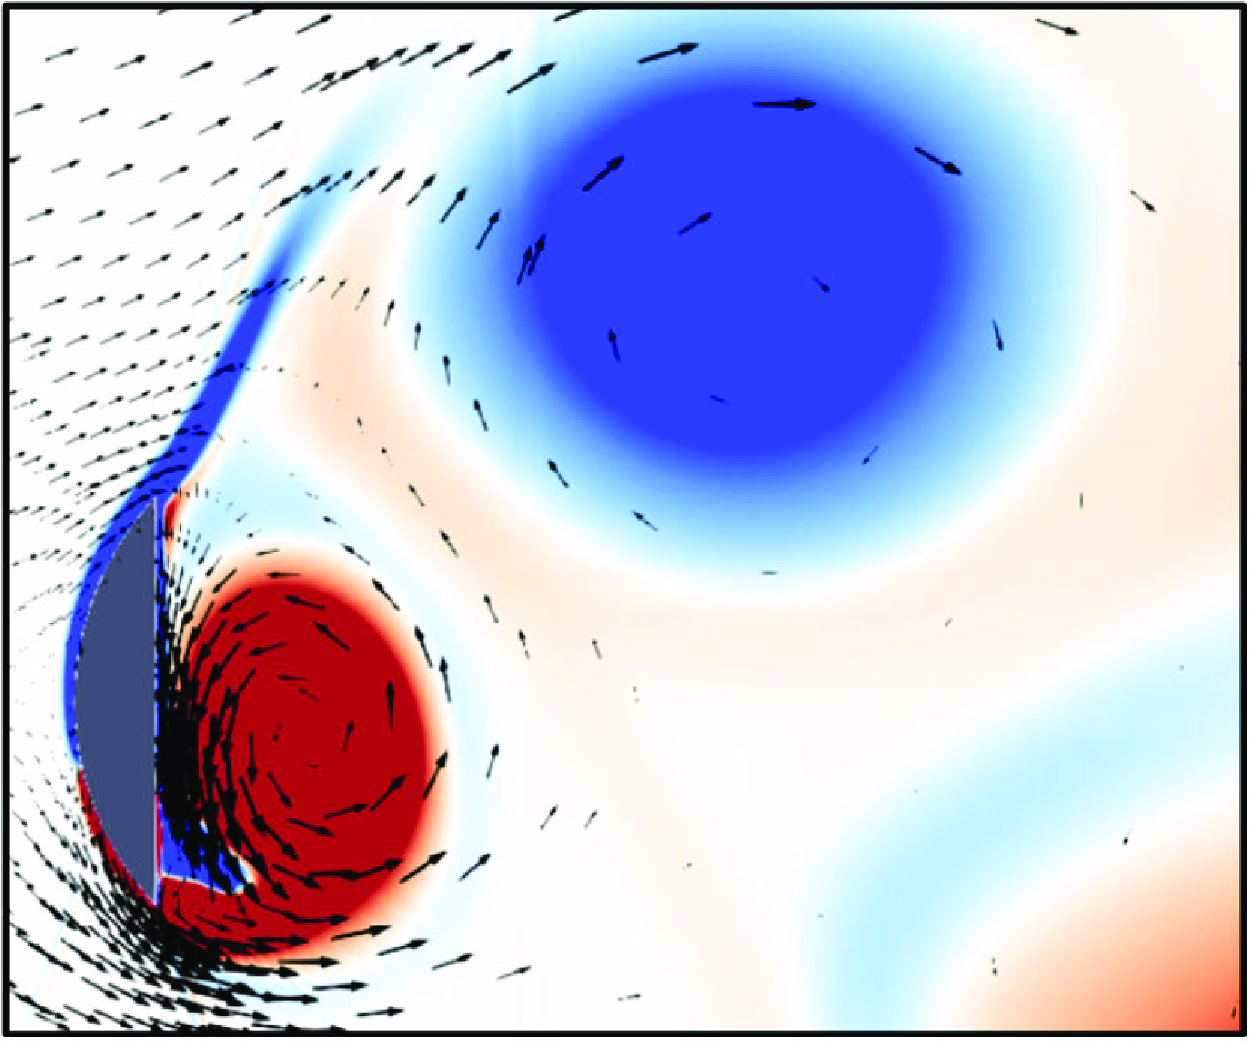
Figure 7. (a, c1, c2) Time histories of non-dimensional transverse displacement ( $Y$
), transverse velocity (
$Y$
), transverse velocity ( $V$
), transverse pressure component
$V$
), transverse pressure component $C_{L,P}$
and transverse viscous component
$C_{L,P}$
and transverse viscous component $C_{L,V}$
for one cycle of oscillation of the reverse-D cylinder of
$C_{L,V}$
for one cycle of oscillation of the reverse-D cylinder of $AR=5$
at
$AR=5$
at $U^*=6.50$
and
$U^*=6.50$
and $Re \approx 3050$
. (b) Time-instantaneous wake structures for different time instants highlighted in (a). The white solid arrow within the cylinder in (b) indicates the direction of cylinder motion and the jet acting upon it.
$Re \approx 3050$
. (b) Time-instantaneous wake structures for different time instants highlighted in (a). The white solid arrow within the cylinder in (b) indicates the direction of cylinder motion and the jet acting upon it.
To answer this, similar to Chen et al. (Reference Chen, Ji, Alam, Xu, An, Tong and Zhao2022), we decompose the lift coefficient in phase with the cylinder velocity $V$
into its pressure (
$V$
into its pressure ( $C_{L,V}^{pres}$
) and viscous components (
$C_{L,V}^{pres}$
) and viscous components ( $C_{L,V}^{visc}$
) and plot them with the time histories of the normalised transverse displacement and velocity of the cylinder in figure 7. Following Bourguet & Lo Jacono (Reference Bourguet and Lo Jacono2014), the mathematical definition of these components are given through
$C_{L,V}^{visc}$
) and plot them with the time histories of the normalised transverse displacement and velocity of the cylinder in figure 7. Following Bourguet & Lo Jacono (Reference Bourguet and Lo Jacono2014), the mathematical definition of these components are given through
 \begin{equation} {} C_{L,V}^{pres}= \frac {\sqrt {2} \ C_L^{pres} \ V}{\sqrt {\overline {V^2}}}, \quad C_{L,V}^{visc}= \frac {\sqrt {2} \ C_L^{vis} \ V}{\sqrt {\overline {V^2}}}. \end{equation}
These coefficients serve as metrics for gauging the exchange of energy between the cylinder and the fluid, with positive values indicating that the fluid imparts energy to the cylinder and vice versa. Figure 7(a) shows that the viscous coefficient $C_{L,V}^{visc}$
remains positive throughout the entire cycle, while the pressure coefficient
$C_{L,V}^{visc}$
remains positive throughout the entire cycle, while the pressure coefficient $C_{L,V}^{pres}$
predominantly remains negative. Consequently, the viscous component of the lift promotes, while the pressure component dampens, the cylinder vibration. This finding aligns with the observations for the reverse-D cylinder of
$C_{L,V}^{pres}$
predominantly remains negative. Consequently, the viscous component of the lift promotes, while the pressure component dampens, the cylinder vibration. This finding aligns with the observations for the reverse-D cylinder of $AR=2$
made by Chen et al. (Reference Chen, Ji, Alam, Xu, An, Tong and Zhao2022) at
$AR=2$
made by Chen et al. (Reference Chen, Ji, Alam, Xu, An, Tong and Zhao2022) at $Re=100$
.
$Re=100$
.
This shows that the viscous component of lift is responsible for sustaining vibration. However, it does not address whether the shear layer over the curved surface or vortex-induced viscous force on the rear surface drives vibration. When the shear layer separates and rolls up into a strong compact vortex close to the rear surface, it induces the formation of a local jet between the vortex and rear surface. The direction of this jet depends upon the sign of the vorticity while its magnitude depends on the proximity of the vortex to the surface and its strength. The presence of this jet will increase the viscous lift in the force decomposition as the viscous forces depend on the velocity gradient at the cylinder surface.
To illustrate this effect, figure 7(b) shows the instantaneous vorticity along with velocity vectors at various times within a vibration cycle, as indicated in figure 7(a). Instances (i) and (ii) of figure 7(b) reveal the presence of a strong counter-clockwise (CCW, red) vortex in close proximity to the cylinder during its downward motion, resulting in a local jet induced in the direction of the cylinder motion. Similarly, instances (iii) and (iv) show a clockwise (CW, blue) vortex near the cylinder during its upward motion, again inducing a local jet reinforcing the cylinder motion. Hence, for the present reverse-D cylinder, these shed vortices contribute energy supporting the cylinder motion throughout the cycle. However, this qualitative description does not verify whether this energy transfer is sufficient to sustain the vibrations.
To clarify this point, we further partitioned the total pressure ( $C_{L,V}^{pres}$
) and viscous (
$C_{L,V}^{pres}$
) and viscous ( $C_{L,V}^{visc}$
) components of the lift forces acting on the cylinder, as shown in figure 7(a), into analogous components acting on the windward curved surface and leeward vertical surface, presented in figure 7(c1) and figure 7(c2), respectively. For the windward curved surface, figure 7(c1) shows that the pressure component of the lift forces is dominant over the viscous component. However, over the cycle, it extracts energy from the system. Additionally, the contribution of the viscous component is negligible on this surface, and it also extracts energy from the system, albeit minimally. Thus, these results are in contrast to the conclusion presented by Chen et al. (Reference Chen, Ji, Alam, Xu, An, Tong and Zhao2022) for the
$C_{L,V}^{visc}$
) components of the lift forces acting on the cylinder, as shown in figure 7(a), into analogous components acting on the windward curved surface and leeward vertical surface, presented in figure 7(c1) and figure 7(c2), respectively. For the windward curved surface, figure 7(c1) shows that the pressure component of the lift forces is dominant over the viscous component. However, over the cycle, it extracts energy from the system. Additionally, the contribution of the viscous component is negligible on this surface, and it also extracts energy from the system, albeit minimally. Thus, these results are in contrast to the conclusion presented by Chen et al. (Reference Chen, Ji, Alam, Xu, An, Tong and Zhao2022) for the $AR=2$
case. For the leeward vertical surface, figure 7(c2) demonstrates that the pressure component of the lift force remains zero over the cycle. This is expected as pressure acts in the normal direction, contributing no energy in the lift direction of this vertical surface. Furthermore, the figure indicates that
$AR=2$
case. For the leeward vertical surface, figure 7(c2) demonstrates that the pressure component of the lift force remains zero over the cycle. This is expected as pressure acts in the normal direction, contributing no energy in the lift direction of this vertical surface. Furthermore, the figure indicates that $C_{L,V}^{visc}$
is positive throughout the cycle, signifying that it adds energy to the system. Consequently, the present case of the reverse-D cylinder is a pure case of VIV where the force sustaining transverse vibration originates from a momentum exchange between the shed vortex and the cylinder.
$C_{L,V}^{visc}$
is positive throughout the cycle, signifying that it adds energy to the system. Consequently, the present case of the reverse-D cylinder is a pure case of VIV where the force sustaining transverse vibration originates from a momentum exchange between the shed vortex and the cylinder.
3.4. Mechanisms of FIV of cylinders with different aspect ratios
The preceding subsection has elucidated the significant role played by leeward viscous forces engendered by vortex-induced jets in maintaining transverse oscillations of an $AR = 5$
reverse-D cylinder. Traditionally, transverse oscillations have been attributed mostly to pressure forces possibly assisted by the interaction between the afterbody and separated shear layers. Thus, in an effort to bridge this conceptual gap, we meticulously compare the discrete contributions of pressure and viscous lift forces with the transverse oscillations of reverse-D cylinders as
$AR = 5$
reverse-D cylinder. Traditionally, transverse oscillations have been attributed mostly to pressure forces possibly assisted by the interaction between the afterbody and separated shear layers. Thus, in an effort to bridge this conceptual gap, we meticulously compare the discrete contributions of pressure and viscous lift forces with the transverse oscillations of reverse-D cylinders as $AR$
is varied, encompassing both low and moderate Reynolds numbers cases. This encompasses reverse-D cylinders of
$AR$
is varied, encompassing both low and moderate Reynolds numbers cases. This encompasses reverse-D cylinders of $AR=5$
(the present case),
$AR=5$
(the present case), $AR=2$
(semi-circular) and
$AR=2$
(semi-circular) and $AR=1$
(circular cylinder). The particular cases are extracted from experimental and numerical investigations conducted by Zhao et al. (Reference Zhao, Hourigan and Thompson2018a
) and Chen et al. (Reference Chen, Ji, Alam, Xu, An, Tong and Zhao2022) for reverse-D cylinders of
$AR=1$
(circular cylinder). The particular cases are extracted from experimental and numerical investigations conducted by Zhao et al. (Reference Zhao, Hourigan and Thompson2018a
) and Chen et al. (Reference Chen, Ji, Alam, Xu, An, Tong and Zhao2022) for reverse-D cylinders of $AR=2$
, and by Khalak & Williamson (Reference Khalak and Williamson1996) and Leontini, Thompson & Hourigan (Reference Leontini, Thompson and Hourigan2006) for circular cylinders. Furthermore, they are representive of the highest amplitude responses for their respective geometries. The non-dimensional governing parameters and cylinder responses are presented in figure 8, while wake vorticity and velocity vectors are shown in figure 9.
$AR=2$
, and by Khalak & Williamson (Reference Khalak and Williamson1996) and Leontini, Thompson & Hourigan (Reference Leontini, Thompson and Hourigan2006) for circular cylinders. Furthermore, they are representive of the highest amplitude responses for their respective geometries. The non-dimensional governing parameters and cylinder responses are presented in figure 8, while wake vorticity and velocity vectors are shown in figure 9.

Figure 8. Time histories (line plots) and time-averaged (bar plots, averaged over 10 cycles) values of non-dimensional transverse displacement ( $Y$
), transverse velocity (
$Y$
), transverse velocity ( $V$
), transverse pressure component
$V$
), transverse pressure component $C_{L,P}$
and transverse viscous component
$C_{L,P}$
and transverse viscous component $C_{L,V}$
at different non-dimensional governing parameters for reverse-D cylinder of
$C_{L,V}$
at different non-dimensional governing parameters for reverse-D cylinder of $AR=5$
in column 1 (a1–a4),
$AR=5$
in column 1 (a1–a4), $AR=2$
in column 2 (b1–b4) and
$AR=2$
in column 2 (b1–b4) and $AR=1$
in column 3 (c1–c4).
$AR=1$
in column 3 (c1–c4).
Before discussing the contributions of each component of the lift force, it is useful to compare the present 2-D numerical results with those reported previously in the literature. This is done here by comparing the maximum oscillation amplitude, $A^*$
, and the wake structures. The time history plots of figures 8(bi) and 8(biii) show that the maximum oscillation amplitude obtained from the present simulations for the reverse-D cylinder of
$A^*$
, and the wake structures. The time history plots of figures 8(bi) and 8(biii) show that the maximum oscillation amplitude obtained from the present simulations for the reverse-D cylinder of $AR=2$
is
$AR=2$
is $A^* = 0.71$
for
$A^* = 0.71$
for $m^*=6.0$
,
$m^*=6.0$
, $\zeta =0.0015$
,
$\zeta =0.0015$
, $U^*=5.5$
and
$U^*=5.5$
and $Re \sim 2500$
, while it is
$Re \sim 2500$
, while it is $A^* = 0.54$
for
$A^* = 0.54$
for $m^*=2.0$
,
$m^*=2.0$
, $\zeta =0.0$
,
$\zeta =0.0$
, $U^*=6.0$
and
$U^*=6.0$
and $Re = 100$
. These values are in good agreement with the values of
$Re = 100$
. These values are in good agreement with the values of $A^*=0.69$
and
$A^*=0.69$
and $A^*=0.56$
reported in the experiments of Zhao et al. (Reference Zhao, Hourigan and Thompson2018a
) and numerical simulations of Chen et al. (Reference Chen, Ji, Alam, Xu, An, Tong and Zhao2022), respectively. Similarly, for the
$A^*=0.56$
reported in the experiments of Zhao et al. (Reference Zhao, Hourigan and Thompson2018a
) and numerical simulations of Chen et al. (Reference Chen, Ji, Alam, Xu, An, Tong and Zhao2022), respectively. Similarly, for the $AR=1$
(circular cylinder), figures 8(ci) and 8(ciii) show
$AR=1$
(circular cylinder), figures 8(ci) and 8(ciii) show $A^* = 0.6$
for
$A^* = 0.6$
for $m^*=2.4$
,
$m^*=2.4$
, $\zeta =0.0054$
,
$\zeta =0.0054$
, $U^*=6.0$
, and
$U^*=6.0$
, and $Re \sim 5200$
, and
$Re \sim 5200$
, and $A^* = 0.48$
for
$A^* = 0.48$
for $m^*=10.0$
,
$m^*=10.0$
, $\zeta =0.01$
,
$\zeta =0.01$
, $U^*=5$
, and
$U^*=5$
, and $Re = 200$
, aligning well with the experimental results of
$Re = 200$
, aligning well with the experimental results of $A^*=0.94$
and numerical predictions of
$A^*=0.94$
and numerical predictions of $A^*=0.48$
reported by Khalak & Williamson (Reference Khalak and Williamson1996) and Leontini et al. (Reference Leontini, Thompson and Hourigan2006), respectively. Consequently, the present 2-D simulations are able to capture transverse vibration for cylinders of different
$A^*=0.48$
reported by Khalak & Williamson (Reference Khalak and Williamson1996) and Leontini et al. (Reference Leontini, Thompson and Hourigan2006), respectively. Consequently, the present 2-D simulations are able to capture transverse vibration for cylinders of different $AR$
, as well as for both moderate and low-Reynolds-number flows.
$AR$
, as well as for both moderate and low-Reynolds-number flows.

Figure 9. Time-instantaneous wake structures for different cases considered in figure 8. The time instant corresponds to the centre-line location of the cylinder during its travel from top-most to bottom-most lateral position.
With regard to the individual contributions from the pressure and viscous lift forces, figure 8(aiii) illustrates that viscous forces provide the energy for transverse oscillations of the $AR=5$
reverse-D cylinder at low Reynolds numbers. Furthermore, the energy input originates from the leeward side of the cylinder, as depicted in figure 8(aiv). This observation parallels the findings discussed in § 3.3 for high Reynolds numbers, as also illustrated in figure 8(ai)–(aii). The rationale behind this correspondence is discernible in the contour plots depicted in figure 9. Similar to the high-Reynolds-number scenario discussed earlier in § 3.3, figure 9(aii) exhibits a strong shed vortex in close proximity to the cylinder, inducing a jet in the direction of the cylinder’s motion even at low Reynolds numbers. Consequently, the mechanism governing transverse vibration remains consistent for both high- and low-Reynolds-number flows for
$AR=5$
reverse-D cylinder at low Reynolds numbers. Furthermore, the energy input originates from the leeward side of the cylinder, as depicted in figure 8(aiv). This observation parallels the findings discussed in § 3.3 for high Reynolds numbers, as also illustrated in figure 8(ai)–(aii). The rationale behind this correspondence is discernible in the contour plots depicted in figure 9. Similar to the high-Reynolds-number scenario discussed earlier in § 3.3, figure 9(aii) exhibits a strong shed vortex in close proximity to the cylinder, inducing a jet in the direction of the cylinder’s motion even at low Reynolds numbers. Consequently, the mechanism governing transverse vibration remains consistent for both high- and low-Reynolds-number flows for $AR=5$
.
$AR=5$
.
For $AR=2$
(a semi-circular cylinder), figure 8(bi–biv) exhibits a similar contribution of lift forces to that of
$AR=2$
(a semi-circular cylinder), figure 8(bi–biv) exhibits a similar contribution of lift forces to that of $AR=5$
, whereby viscous forces on the leeward side provide the energy to sustain the transverse vibration, while pressure and viscous forces from the windward curved surface exhance or dampen motion. This holds true for both low and high Reynolds numbers, notwithstanding the presence of flow separation and a small afterbody at high Reynolds numbers, as indicated by the wall shear-stress magnitude in figure 4. The impact of these flow separations is evident in figure 8(bi) through significant fluctuations in
$AR=5$
, whereby viscous forces on the leeward side provide the energy to sustain the transverse vibration, while pressure and viscous forces from the windward curved surface exhance or dampen motion. This holds true for both low and high Reynolds numbers, notwithstanding the presence of flow separation and a small afterbody at high Reynolds numbers, as indicated by the wall shear-stress magnitude in figure 4. The impact of these flow separations is evident in figure 8(bi) through significant fluctuations in $C_{L,V}^{pres}$
. Consequently, contrary to the conjecture of Chen et al. (Reference Chen, Ji, Alam, Xu, An, Tong and Zhao2022), the present results demonstrate that the mere presence of an afterbody does not necessarily dictate that the transverse vibration motion of the cylinder is governed by the pressure-induced lift generated by the interaction of the afterbody with the separated shear layer.
$C_{L,V}^{pres}$
. Consequently, contrary to the conjecture of Chen et al. (Reference Chen, Ji, Alam, Xu, An, Tong and Zhao2022), the present results demonstrate that the mere presence of an afterbody does not necessarily dictate that the transverse vibration motion of the cylinder is governed by the pressure-induced lift generated by the interaction of the afterbody with the separated shear layer.
For $AR=1$
(circular cylinder), figure 8(ci–civ) demonstrates that the individual lift force components are inverted compared with those discussed for
$AR=1$
(circular cylinder), figure 8(ci–civ) demonstrates that the individual lift force components are inverted compared with those discussed for $AR=5$
and
$AR=5$
and $AR=2$
above. Here, the pressure component of the lift force provides the energy, while the viscous component of the lift force extracts energy from the system. This aligns with the conclusion drawn by Menon & Mittal (Reference Menon and Mittal2021). Upon dividing the lift forces acting on the windward and leeward sides, it is evident from figures 8(cii) and 8(civ) that
$AR=2$
above. Here, the pressure component of the lift force provides the energy, while the viscous component of the lift force extracts energy from the system. This aligns with the conclusion drawn by Menon & Mittal (Reference Menon and Mittal2021). Upon dividing the lift forces acting on the windward and leeward sides, it is evident from figures 8(cii) and 8(civ) that $C_{L,V}^{visc}$
is negative on the windward side, whereas it is positive on the leeward side at both high and low Reynolds numbers. Thus, for
$C_{L,V}^{visc}$
is negative on the windward side, whereas it is positive on the leeward side at both high and low Reynolds numbers. Thus, for $AR=1.0$
, the jet formed by the proximity of vortices imparts energy to the system (refer to figure 9(ci,cii)). However, this energy is insufficient to generate or sustain the transverse motion.
$AR=1.0$
, the jet formed by the proximity of vortices imparts energy to the system (refer to figure 9(ci,cii)). However, this energy is insufficient to generate or sustain the transverse motion.
4. Conclusions
The present study documents and contributes towards understanding the role of an afterbody on the FIV response of cylinders. This is done by conducting experimental and numerical investigations for FIV of a reverse-D $AR=5$
cylinder, followed by comparison with previous established cases for other more elongated reverse-D cylinder cross-sectional shapes with decreasing
$AR=5$
cylinder, followed by comparison with previous established cases for other more elongated reverse-D cylinder cross-sectional shapes with decreasing $AR$
:
$AR$
: $AR=2$
(semi-circular cylinder), and
$AR=2$
(semi-circular cylinder), and $AR=1$
(circular cylinder), for both moderate and low
$AR=1$
(circular cylinder), for both moderate and low $Re$
.
$Re$
.
The response curve for a reverse-D $AR=5$
cylinder exhibits pure VIV features with significant transverse oscillations of maximum non-dimensional amplitude
$AR=5$
cylinder exhibits pure VIV features with significant transverse oscillations of maximum non-dimensional amplitude $A^* \approx 0.45$
, 45 % of that of an
$A^* \approx 0.45$
, 45 % of that of an $AR=1$
cylinder (circular cylinder). Further, it was found that the amplitude response for
$AR=1$
cylinder (circular cylinder). Further, it was found that the amplitude response for $AR=5$
consists of only initial and lower branches, i.e. it lacks the upper branch. Of most significance, it was shown that separation does not occur before reaching the top and bottom edges – so there is no afterbody – yet it still undergoes significant transverse oscillation in the resonance case. Thus, it is shown that an afterbody is not necessary to sustain significant transverse oscillations for cylinders at moderate
$AR=5$
consists of only initial and lower branches, i.e. it lacks the upper branch. Of most significance, it was shown that separation does not occur before reaching the top and bottom edges – so there is no afterbody – yet it still undergoes significant transverse oscillation in the resonance case. Thus, it is shown that an afterbody is not necessary to sustain significant transverse oscillations for cylinders at moderate $Re$
.
$Re$
.
To understand the mechanism behind these transverse oscillations, we decompose the total lift fluid forces acting on the windward and leeward sides of the cylinder into their viscous and pressure components. It was found that the viscous force generated by the vortex-induced jet on the leeward side of the cylinder was responsible for providing the energy to sustain these transverse oscillations. Later, we use the same force decomposition on previously examined cases of a reverse-D cylinder of $AR=2$
and a circular cylinder (
$AR=2$
and a circular cylinder ( $AR=1$
) at both moderate and low
$AR=1$
) at both moderate and low $Re$
. It was found that for both moderate and low
$Re$
. It was found that for both moderate and low $Re$
cylinders lacking an afterbody, the transverse vibration is primarily driven by viscous lift forces generated by vortex-induced jets from the presence of compact shed vorticity close to the downstream face. Conversely, for cylinders featuring an afterbody, the controlling forces can be either viscous or pressure lift forces contingent upon the size of the afterbody and location/sign of the shed vortices.
$Re$
cylinders lacking an afterbody, the transverse vibration is primarily driven by viscous lift forces generated by vortex-induced jets from the presence of compact shed vorticity close to the downstream face. Conversely, for cylinders featuring an afterbody, the controlling forces can be either viscous or pressure lift forces contingent upon the size of the afterbody and location/sign of the shed vortices.
Funding
The support from the Australian Government through the Australian Research Council’s Discovery Projects funding scheme, Discovery Early Career Researcher Award (projects DP190103388, DP210100990, J.Z., DE200101650), and computational resources from the National Computational Infrastructure (NCI) and Pawsey Supercomputer Centre (Merit Grants n67 and d71) under the National Computational Merit Allocation Scheme are gratefully acknowledged.
Declaration of interests
The authors report no conflict of interest.


 Open access