Hostname: page-component-78c5997874-j824f Total loading time: 0 Render date: 2024-11-12T20:04:17.594Z Has data issue: false hasContentIssue false

Scale dependence of local shearing motion in decaying turbulence generated by multiple-jet interaction

Published online by Cambridge University Press:  08 October 2024

Tomoaki Watanabe*
Affiliation:
Department of Mechanical Engineering and Science, Kyoto University, Kyoto 615-8540, Japan Education and Research Center for Flight Engineering, Nagoya University, Nagoya 464-8603, Japan
Takahiro Mori
Affiliation:
Department of Aerospace Engineering, Nagoya University, Nagoya 464-8603, Japan
Kirari Ishizawa
Affiliation:
Undergraduate Department of Mechanical and Aerospace Engineering, Nagoya University, Nagoya 464-8603, Japan
Koji Nagata
Affiliation:
Department of Mechanical Engineering and Science, Kyoto University, Kyoto 615-8540, Japan
*
Email address for correspondence: watanabe.tomoaki.8x@kyoto-u.ac.jp

Abstract

Scale dependence of local shearing motion is investigated experimentally in decaying homogeneous isotropic turbulence generated through multiple-jet interaction. The turbulent Reynolds number, based on the Taylor microscale, is between approximately 900 and 400. Velocity fields, measured using particle image velocimetry, are analysed through the triple decomposition of a low-pass filtered velocity gradient tensor, which quantifies the intensities of shear and rigid-body rotation at a given scale. These motions manifest predominantly as layer and tubular vortical structures, respectively. The scale dependence of the moments of velocity increments, associated with shear and rigid-body rotation, exhibits power-law behaviours. The scaling exponents for shear are in quantitative alignment with the anomalous scaling of the velocity structure functions, suggesting that velocity increments are influenced predominantly by shearing motion. In contrast, the exponents for rigid-body rotation are markedly smaller than those predicted by Kolmogorov scaling, reflecting the high intermittency of rigid-body rotation. The mean flow structure associated with shear at intermediate scales is investigated with conditional averages around locally intense shear regions in the filtered velocity field. The averaged flow field exhibits a shear layer structure with aspect ratio approximately 4.5, surrounded by rotating motion. The analysis at different scales reveals the existence of self-similar structures of shearing motion across various scales. The mean velocity jump across the shear layer increases with the layer thickness. This relationship is well predicted by Kolmogorov's second similarity hypothesis, which is useful in predicting the mean characteristics of shear layers across a wide range of scales.

Type
JFM Papers
Copyright
© The Author(s), 2024. Published by Cambridge University Press

1. Introduction

Fundamental turbulence research explores the scale dependence of turbulent motion in relation to classical turbulence theories (Davidson Reference Davidson2004). The scale dependence is often discussed with the velocity difference $\Delta v$ between two points separated by a distance $r$. According to Kolmogorov's second similarity hypothesis, the scaling of velocity structure functions in the inertial subrange is expressed as $\overline {|\Delta v|^{n}}=\beta _n (\varepsilon r)^{n/3}$, where $\beta _n$ is a universal constant, and $\varepsilon$ is the averaged turbulent kinetic energy dissipation rate (Kolmogorov Reference Kolmogorov1941). The notation $\bar {f}$ represents the averaging procedure for a variable $f$. However, discrepancies in this scaling have been reported, with the scaling exponent $p$ of $\overline {|\Delta v|^{n}}\sim r^p$ becoming progressively smaller than $n/3$ for larger values of $n$ (Castaing, Gagne & Hopfinger Reference Castaing, Gagne and Hopfinger1990; Kailasnath, Sreenivasan & Stolovitzky Reference Kailasnath, Sreenivasan and Stolovitzky1992; Benzi et al. Reference Benzi, Ciliberto, Tripiccione, Baudet, Massaioli and Succi1993; Iyer, Sreenivasan & Yeung Reference Iyer, Sreenivasan and Yeung2020; Gauding et al. Reference Gauding, Bode, Brahami, Varea and Danaila2021; Buaria & Sreenivasan Reference Buaria and Sreenivasan2023). This anomaly in the scaling exponent is attributed to the intermittency at small scales, where eddies at a given scale become less space-filling as the scale decreases. Various corrections to Kolmogorov's original theory have been proposed to account for small-scale intermittency effects (Kolmogorov Reference Kolmogorov1962; Frisch, Sulem & Nelkin Reference Frisch, Sulem and Nelkin1978; She & Leveque Reference She and Leveque1994). A comprehensive overview of small-scale intermittency has been provided in Sreenivasan & Antonia (Reference Sreenivasan and Antonia1997) and the references therein.

The velocity gradient tensor $\boldsymbol {\nabla } {\boldsymbol {u}}$ that describes local fluid motion around a point in space is often used to define turbulent structures, manifesting as coherent patterns in the spatial distribution of physical variables. The symmetric and anti-symmetric parts of $\boldsymbol {\nabla } {\boldsymbol {u}}$ are the rate-of-strain tensor ${\mathsf{S}}_{ij}$ and the rate-of-rotation tensor ${\textsf{$\mathit{\Omega}$} }_{ij}$, respectively, defined as ${\mathsf{S}}_{ij}=[(\boldsymbol {\nabla } {\boldsymbol {u}})_{ij}+(\boldsymbol {\nabla } {\boldsymbol {u}})_{ji}]/2$ and ${\textsf{$\mathit{\Omega}$} }_{ij}=[(\boldsymbol {\nabla } {\boldsymbol {u}})_{ij}-(\boldsymbol {\nabla } {\boldsymbol {u}})_{ji}]/2$. A component of tensors and vectors is specified using subscripts: for example, $(\boldsymbol {\nabla } {\boldsymbol {u}})_{ij}=\partial {u}_i/\partial x_j$. At the smallest scale of turbulence characterised by the Kolmogorov scale, vortical structures are often identified using enstrophy, defined as $\omega ^2/2=\textsf{$\mathit{\Omega}$} _{ij}\textsf{$\mathit{\Omega}$} _{ij}$. Regions with high $\omega ^2/2$ typically concentrate in tubular or sheet-like structures, known respectively as vortex tubes and sheets (Jiménez et al. Reference Jiménez, Wray, Saffman and Rogallo1993; Vincent & Meneguzzi Reference Vincent and Meneguzzi1994). Vortex sheets are characterised by local shearing motion, with their defining feature being shear rather than vorticity $\omega$. Consequently, this study calls the sheet-like vortices shear layers, following Eisma et al. (Reference Eisma, Westerweel, Ooms and Elsinga2015) and Nagata et al. (Reference Nagata, Watanabe, Nagata and da Silva2020b). Numerous identification methods have been developed for vortex tubes, and their properties have been explored in various flow conditions (Jiménez et al. Reference Jiménez, Wray, Saffman and Rogallo1993; Kang, Tanahashi & Miyauchi Reference Kang, Tanahashi and Miyauchi2007; Mouri, Hori & Kawashima Reference Mouri, Hori and Kawashima2007; Ganapathisubramani, Lakshminarasimhan & Clemens Reference Ganapathisubramani, Lakshminarasimhan and Clemens2008; da Silva, Dos Reis & Pereira Reference da Silva, Dos Reis and Pereira2011; Ghira, Elsinga & da Silva Reference Ghira, Elsinga and da Silva2022). Various turbulence phenomena have been examined in the context of flow associated with vortex tubes, such as turbulent entrainment (Watanabe et al. Reference Watanabe, Jaulino, Taveira, da Silva, Nagata and Sakai2017; Neamtu-Halic et al. Reference Neamtu-Halic, Mollicone, Van Reeuwijk and Holzner2021) and particle transport (Matsuda, Schneider & Yoshimatsu Reference Matsuda, Schneider and Yoshimatsu2021).

Recent advancements in the identification of shear layers have been made by adopting the triple decomposition, which separates the velocity gradient tensor into components representing shear (S), rigid-body rotation (R) and elongation (E, or irrotational strain) as $\boldsymbol {\nabla } \boldsymbol {u}=\boldsymbol {\nabla } \boldsymbol {u}_S+\boldsymbol {\nabla } \boldsymbol {u}_R+\boldsymbol {\nabla } \boldsymbol {u}_E$ (Kolář Reference Kolář2007). The triple decomposition is related to the Rortex-based decomposition (Liu et al. Reference Liu, Gao, Tian and Dong2018) and Schur decomposition (Kronborg & Hoffman Reference Kronborg and Hoffman2023), although their numerical algorithms were developed independently. Kronborg & Hoffman (Reference Kronborg and Hoffman2023) demonstrated that triple decomposition is equivalent to the real Schur form of the velocity gradient tensor. The mathematical properties of these decompositions, including Galilean invariance, have been explored extensively in prior research, as well as the theory of Schur decomposition (Keylock Reference Keylock2018; Wang, Gao & Liu Reference Wang, Gao and Liu2018). The second and third invariants of $\boldsymbol {\nabla } \boldsymbol {u}$, defined as $Q_{\boldsymbol {\nabla } {\boldsymbol u}}=-(\boldsymbol {\nabla } \boldsymbol {u})_{ij}(\boldsymbol {\nabla } \boldsymbol {u})_{ji}/2$ and $R_{\boldsymbol {\nabla } {\boldsymbol u}}=-(\boldsymbol {\nabla } \boldsymbol {u})_{ij}(\boldsymbol {\nabla } \boldsymbol {u})_{jk}(\boldsymbol {\nabla } \boldsymbol {u})_{ki}/3$, are commonly used to diagnose local flow patterns. The three motions in the triple decomposition can also be identified with $Q_{\boldsymbol {\nabla } {\boldsymbol u}}$ and $R_{\boldsymbol {\nabla } {\boldsymbol u}}$ normalised by the Frobenius norm of $\boldsymbol {\nabla } \boldsymbol {u}$ (Das & Girimaji Reference Das and Girimaji2020).

The characteristics of shear layers have been explored by analysing the shear component of the velocity gradient tensor, $\boldsymbol {\nabla } \boldsymbol {u}_S$. The intensity of local shearing motion can be quantified by the norm of $\boldsymbol {\nabla } \boldsymbol {u}_S$ or the shear component of vorticity vector ${\boldsymbol {\omega }}_{Si}=\epsilon _{ijk}(\boldsymbol {\nabla } \boldsymbol {u}_S)_{jk}$, where $\epsilon _{ijk}$ is the Levi–Civita symbol (Eisma et al. Reference Eisma, Westerweel, Ooms and Elsinga2015; Nagata et al. Reference Nagata, Watanabe, Nagata and da Silva2020b). By identifying the location and orientation of shear layers using components of $\boldsymbol {\nabla } \boldsymbol {u}_S$, the mean flow field around these layers can be evaluated through a conditional averaging procedure commonly used to investigate coherent structures in turbulence. Previous studies have investigated the mean velocity profiles near shear layers (Eisma et al. Reference Eisma, Westerweel, Ooms and Elsinga2015; Watanabe, Tanaka & Nagata Reference Watanabe, Tanaka and Nagata2020; Fiscaletti, Buxton & Attili Reference Fiscaletti, Buxton and Attili2021; Hayashi, Watanabe & Nagata Reference Hayashi, Watanabe and Nagata2021a,Reference Hayashi, Watanabe and Nagatab). A distinct mean velocity jump is observed across the shear layer, with the Kolmogorov scales characterising this jump and the layer thickness in freely evolving turbulence. Recent research highlights the pivotal role of shear layers in turbulent flows. These layers, embedded in a biaxial strain field, contribute significantly to enstrophy production and strain amplification (Watanabe et al. Reference Watanabe, Tanaka and Nagata2020). Enoki, Watanabe & Nagata (Reference Enoki, Watanabe and Nagata2023) examined the velocity fields of shear and rigid-body rotation, and demonstrated that shearing motion, compared to rigid-body rotation, has a greater impact on the transport of turbulent kinetic energy and energy cascade across scales. The prominence of shear layers over vortex tubes was also confirmed by their contribution to the global enstrophy and mean momentum budget, as shown by the analysis of a reconstructed velocity field from a truncated vorticity field for these structures (Pirozzoli, Bernardini & Grasso Reference Pirozzoli, Bernardini and Grasso2010). Additionally, the mean flow observed in a strain eigenframe, defined by the eigenvectors of ${\mathsf{S}}_{ij}$, also exhibits a shear layer pattern even though the average is not taken specifically for the shear layers (Elsinga & Marusic Reference Elsinga and Marusic2010; Elsinga et al. Reference Elsinga, Ishihara, Goudar, da Silva and Hunt2017; Sakurai & Ishihara Reference Sakurai and Ishihara2018). These studies have successfully predicted important properties, including the $-5/3$ law of the energy spectrum and particle transport by turbulence, from the flow observed around shear layers (Elsinga & Marusic Reference Elsinga and Marusic2016; Goudar & Elsinga Reference Goudar and Elsinga2018).

Turbulent structures of various sizes exist, although these studies of vortex tubes and shear layers focus on small scales. These structures at intermediate scales, larger than the Kolmogorov scale, can be extracted by applying the vortex identification schemes mentioned earlier to a filtered velocity field $\tilde {\boldsymbol {u}}$, where small-scale velocity fluctuations are removed. In this paper, $\tilde {*}$ denotes a quantity derived from a filtered velocity field. The vortex identification in filtered velocity fields has been conducted with enstrophy $\tilde {\omega }^2/2$ (Leung, Swaminathan & Davidson Reference Leung, Swaminathan and Davidson2012; Goto, Saito & Kawahara Reference Goto, Saito and Kawahara2017) and the second invariant $\tilde{Q}_{\nabla\boldsymbol{u}}$ of filtered-velocity gradient tensors (Hirota et al. Reference Hirota, Nishio, Izawa and Fukunishi2017). Leung et al. (Reference Leung, Swaminathan and Davidson2012) investigated the morphology of enstrophy isosurfaces in a filtered velocity field using Minkowski functionals. Additionally, tubular vortices have been observed for the isosurfaces of enstrophy of the filtered velocity field (Goto et al. Reference Goto, Saito and Kawahara2017). As is the case for vortex tubes and shear layers at the smallest scale, $\tilde {\omega }^2/2$ and $\tilde{Q}_{\nabla\boldsymbol{u}}$ encounter challenges in distinguishing between vortical structures arising from rigid-body rotation and shear, which are expected to manifest as tubular and sheet-like structures at intermediate scales. Exceptionally, Bermejo-Moreno, Pullin & Horiuti (Reference Bermejo-Moreno, Pullin and Horiuti2009) adapted two local criteria to identify tube and sheet structures at various length scales, although their discussion is confined primarily to the geometry and configuration of these structures.

This study investigates the scale dependence of shearing motion in turbulent flows, leveraging recent advancements in identifying small-scale shear layers. ‘Small-scale shear layers’ in this context refer to the Kolmogorov-scale shear layers identified with fully resolved velocity gradients. Similar to these small-scale layers, shear layers at intermediate scales may significantly influence the statistical properties of turbulence. The present analysis employs velocity datasets measured using two-component, two-dimensional particle image velocimetry (PIV) in a multiple-jet wind tunnel (Mori, Watanabe & Nagata Reference Mori, Watanabe and Nagata2024). This facility generates decaying homogeneous isotropic turbulence with the interaction of high-speed jets. The original PIV data presented in Mori et al. (Reference Mori, Watanabe and Nagata2024) detailed homogeneity, isotropy, stationarity and decay properties using fundamental velocity statistics. A turbulent Reynolds number based on the Taylor microscale ranges from approximately 900 to 400 in the decay region. This study focuses on two key aspects of scale dependence: the scaling of shear intensity moments, and the flow structure associated with shearing motion. The first aspect relates to the anomalous scaling in the inertial subrange. We demonstrate that the moment of shear intensity exhibits anomalous scaling similar to that observed in the velocity structure functions, contrasting with the distinct scaling associated with rigid-body rotation found in vortex tubes. For the second aspect, we evaluate conditional averages of shearing motion within the reference frame defined with the shear orientation. Our findings indicate the existence of self-similar structures with shearing motion at intermediate scales, and we show that their mean characteristics align well with Kolmogorov scaling for the inertial subrange. The models of turbulence frequently depict the flow as comprising spatially distributed simple structures (Townsend Reference Townsend1976; Lundgren Reference Lundgren1993; Marusic & Monty Reference Marusic and Monty2019). The current findings related to the self-similarity of shearing motion are anticipated to be valuable in future efforts to model turbulent flows.

The structure of the paper is as follows. Section 2 describes the experimental facility and the PIV measurements. Section 3 details the post-processing techniques applied to the PIV data, involving scale separation via a low-pass filter, the triple decomposition of the velocity gradient tensor, and conditional analysis in the local shear coordinate system. The results are presented in § 4, providing the statistics of shearing motion. The paper concludes in § 5, where the findings are summarised succinctly.

2. Experiments of decaying turbulence generated by high-speed jet interaction

2.1. Multiple-jet wind tunnel

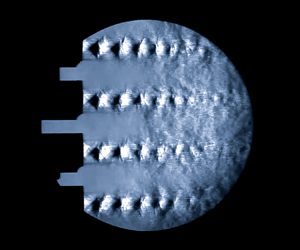
The current study analyses velocity data obtained through two-dimensional, two-component PIV in a multiple-jet wind tunnel. The experiments are described briefly here as comprehensive details are available in Mori et al. (Reference Mori, Watanabe and Nagata2024). Figure 1 illustrates the wind tunnel schematic, comprising a plenum chamber and a test section. The plenum chamber features a tubular design with internal diameter 330 mm and length 180 mm. Its front chamber plate is fitted with 36 Laval nozzles, each having nozzle outlet diameter 4.31 mm and throat diameter 4.12 mm, with centre-to-centre distance 12 mm between adjacent nozzles. Experiments were conducted under plenum pressure 200 kPaG, generating ideally expanded supersonic jets with Mach number 1.36. This actual Mach number was verified using the Prandtl formula for shock-cell structures visualised in Schlieren images (Pack Reference Pack1950), confirming alignment with the design Mach number. The flow in the nozzle becomes choked at plenum pressures exceeding 38.8 kPaG, above which the jet Mach number is not sensitive to the plenum pressure. The back surface of the plenum chamber connects to two air tanks, each with capacity 220 l. Dry air is supplied by moisture separators and compressors, and stored in these tanks. Each tank is linked to the plenum chamber via a moisture separator, a pressure regulator and a pilot kick 2-port solenoid valve. The pressure regulator is adjusted to maintain plenum pressure 200 kPaG.

Figure 1. A schematic of a multiple-jet wind tunnel (Mori et al. Reference Mori, Watanabe and Nagata2024). All dimensions are in mm.

Compressed air enters the plenum chamber when the valves are opened, initiating the jet flows in the test section. The test section of the wind tunnel is designed with length 1000 mm and a square cross-section, each side measuring 100 mm. Optical-grade acrylic plates of thickness 1.5 mm are used as the side and bottom walls of the test section. Homogeneous isotropic turbulence is generated through the interaction of jets, and subsequently decays along the streamwise direction. The streamwise, vertical and spanwise directions are denoted by $x$, $y$ and $z$, respectively, with corresponding velocities $u$, $v$ and $w$. The coordinate origin is the centre of the 36 nozzle outlets. The wind tunnel is capable of sustaining a statistically steady turbulent flow for approximately 3 s. This duration is significantly longer than the integral time scale of turbulence, which is typically approximately $10^{-3}$ s. Here, the integral time scale of turbulence is defined as the ratio of the integral length scale to the root-mean-square velocity fluctuations.

2.2. Measurements

Velocity measurements were performed using the DANTEC PIV system, which includes a double-pulse Nd:YAG laser (Dantec Dynamics, Dual Power 65-15) and a high-speed camera (Dantec Dynamics, SpeedSense 9070). The camera was equipped with a 105 mm focal length lens (Nikkon, AI AF Micro Nikkor 105 mm F2.8D). Light sheet optics attached to the laser generated a thin light sheet with thickness less than 1 mm. Both the laser unit and the camera were synchronised and controlled using a synchroniser (Dantec Dynamics, 80N77) and PIV software (Dantec Dynamics, Dynamic Studio). The tracer particles used for PIV were condensed ethanol droplets. In each experiment, 70 ml of liquid ethanol was sprayed into the air tanks, where it evaporated. Air was then compressed and supplied to the tanks. As the ethanol–air mixture passes through the Laval nozzles, the temperature drops due to fluid expansion in the diverging sections, resulting in the ethanol condensation and creating the tracer droplets for the test section. Even in cases of supersaturation, the ethanol mass fraction remains below 1 %, ensuring that the condensation has a negligible impact on the turbulent flow in the test section (Clemens & Mungal Reference Clemens and Mungal1991; Pizzaia & Rossmann Reference Pizzaia and Rossmann2018). This seeding technique is commonly used in supersonic wind tunnels, employing divergent nozzles to produce supersonic flows. Previous studies have validated the efficacy of this seeding technique, confirming that the generated particles are smaller than 1 $\mathrm {\mu }$m in diameter. Pizzaia & Rossmann (Reference Pizzaia and Rossmann2018) reported that the diameter of ethanol droplets was approximately 0.05–0.2 $\mathrm {\mu }$m, and Kouchi et al. (Reference Kouchi, Fukuda, Miyai, Nagata and Yanase2019) used acetone droplets produced by a Laval nozzle for PIV measurement, estimating the droplet diameter at approximately 160 nm.

The camera, positioned at the side of the test section, captured images of tracer particles illuminated by the laser sheet on the $x$$y$ planes at $z=0$. Particle-pair images were captured at frequency 15 Hz and processed using an adaptive PIV algorithm (Theunissen Reference Theunissen2010) and universal outlier detection (Westerweel & Scarano Reference Westerweel and Scarano2005), as implemented in Dynamic Studio. The interrogation area for the adaptive PIV algorithm ranges from a minimum of $16 \times 16$ pixels to a maximum of $32 \times 32$ pixels. Our previous study reported PIV measurements conducted at six different streamwise locations, centred at $x=0.150$ m, 0.267 m, 0.360 m, 0.465 m, 0.605 m and 0.746 m (Mori et al. Reference Mori, Watanabe and Nagata2024). The flow is highly inhomogeneous in the cross-section at the first two measurement stations. Homogeneous isotropic turbulence decays from the measurement station at $x=0.360$ m. Therefore, the present study analyses velocity fields measured at $x=0.360$ m, 0.465 m, 0.605 m and 0.746 m. The time interval between two laser pulses was set at 4 $\mathrm {\mu }$s. The measurement area covered approximately 70 mm in the streamwise direction, and 40 mm in the vertical direction, with spatial resolution (vector spacing) approximately 1 mm in both directions. Figure 2(a) illustrates the measurement locations and the field of view in the homogeneous and isotropic region. In each wind tunnel run, an average of 30 velocity vector snapshots were captured by the PIV. The experiments were repeated until approximately 600 velocity vector profiles were obtained at each measurement location. Velocity statistics are calculated using ensemble averages and averages in the $y$ direction as functions of $x$. The average of any variable $f$ is denoted by $\bar {f}$, with the fluctuations represented as $f'=f-\bar {f}$. Figure 2(b) visualises the flow field with velocity fluctuation vectors $(u', v')$ measured at approximately $x=0.360$ m. At this location, the mean flow from the jet nozzles leaves no imprints due to the interaction of multiple jets.

Figure 2. (a) Measurement locations for PIV. (b) An example of velocity fluctuation vectors $\boldsymbol {u}'=(u',v')$ measured by PIV. The colour represents the magnitude of the vectors, $|\boldsymbol {u}'|$.

Our previous study presented fundamental velocity statistics of turbulence, such as mean velocity, root-mean-square velocity fluctuations, autocorrelation functions and energy spectra (Mori et al. Reference Mori, Watanabe and Nagata2024). The accuracy of the PIV measurements was validated by comparing the energy spectra, autocorrelation functions and non-dimensional energy dissipation rate with those of other incompressible turbulence, and by comparing the turbulence-induced Pitot pressure (Bailey et al. Reference Bailey2013) with velocity variances measured by the PIV. The spatial resolution of the PIV is close to the Taylor microscale, and spectral analysis has confirmed that scales larger than the small-scale end of the inertial subrange are well resolved by the PIV. The scale dependence of velocity fluctuations in these resolved scales is considered accurately measured, as suggested by comparisons of energy spectra with other turbulent flows (Mori et al. Reference Mori, Watanabe and Nagata2024). Similar approaches to investigating turbulent structures at intermediate scales using under-resolved PIV have been reported in other studies, such as Coriton, Steinberg & Frank (Reference Coriton, Steinberg and Frank2014). Spatial distributions of various velocity statistics indicate that the flow is statistically homogeneous and isotropic for $x\gtrsim 0.35$ m. Additionally, mean static pressure and temperature were measured along the centreline of the test section.

Although the jets emanating from the nozzles are supersonic, they mix rapidly with the low-speed ambient fluid, leading to a rapid decay in mean velocity before homogeneous isotropic turbulence develops due to jet interaction. Consequently, the flow transitions to a subsonic regime before turbulence begins to decay. Beyond $x=0.35$ m, the mean flow Mach number $M=\bar {u}/a$ is approximately 0.1, with the turbulent Mach number $M_T=\sqrt {\overline {{u'}^{2}}+2\overline {{v'}^{2}}}/a$ being even lower, under 0.1, where $a$ is the speed of sound. Additionally, the mean temperature and density in the decay region remain constant at $T=303$ K and $\rho =1.16\ {\rm kg}\ {\rm m}^{-3}$, respectively, without streamwise variations. As a result of these conditions, compressibility effects are locally negligible in the decay region of homogeneous isotropic turbulence. However, it is important to note that the findings of this study may not be restricted to incompressible turbulence alone, as both compressible and incompressible turbulences share the same dynamical properties described by the Navier–Stokes equations.

2.3. Decay properties

Some fundamental velocity statistics in turbulence generated by jet interaction are presented here, with further details on flow characteristics available in Mori et al. (Reference Mori, Watanabe and Nagata2024). Figure 3(a) shows the vertical profiles of mean velocity, $\bar {u}$ and $\bar {v}$, in the streamwise and vertical directions at two measurement locations. The mean streamwise velocity is approximately 39 m s$^{-1}$, consistent across the vertical direction. The vertical mean velocity is negligibly small, indicating a uniform mean flow in the wind tunnel. Figure 3(b) presents the turbulence intensity, defined by the root-mean-square (r.m.s.) velocity fluctuations, $u_{rms}=\sqrt {\overline {{u'}^{2}}}$ and $v_{rms}=\sqrt {\overline {{v'}^{2}}}$, normalised by the mean velocity $\bar {u}$. The turbulence intensity decreases in the streamwise direction, reflecting the decay of the turbulence, yet remains uniformly distributed in the vertical direction for both velocity components. The turbulence intensity at these two streamwise locations exceeds 0.2, a value higher than that typically observed in grid turbulence, where turbulence intensity is usually less than 0.05 (Melina, Bruce & Vassilicos Reference Melina, Bruce and Vassilicos2016; Nagata et al. Reference Nagata, Saiki, Sakai, Ito and Iwano2017). The high turbulence intensity in this experiment is attributed to the nature of the turbulence generated by jet interaction (Tan et al. Reference Tan, Xu, Qi and Ni2023). The ratio of the root-mean-square velocity fluctuations, $u_{rms}/v_{rms}$, is approximately 1.1, aligning with values reported for turbulence generated by grids and multiple-jet interactions (Krogstad & Davidson Reference Krogstad and Davidson2012; Isaza, Salazar & Warhaft Reference Isaza, Salazar and Warhaft2014; Kitamura et al. Reference Kitamura, Nagata, Sakai, Sasoh, Terashima, Saito and Harasaki2014; Watanabe & Nagata Reference Watanabe and Nagata2018; Tan et al. Reference Tan, Xu, Qi and Ni2023). Consequently, the nearly homogeneous and isotropic turbulence generated by the jets decays in the test section.

Figure 3. Vertical profiles of (a) mean velocity and (b) turbulence intensity at $x=0.465$ m and $x=0.605$ m.

Figure 4(a) illustrates the streamwise decay of turbulent kinetic energy per unit mass $k_T$, within the homogeneous isotropic region, calculated as $k_T=(\overline {{u'}^2}+2\overline {{v'}^2})/2$. In decaying isotropic turbulence, such as that observed in grid turbulence, the decay of $k_T$ is commonly approximated by a power law $k_T=a_k(x-x_0)^{-n_k}$ with a coefficient $a_k$, a virtual origin $x_0$, and a decay exponent $n_k$ (Mohamed & Larue Reference Mohamed and Larue1990; Davidson Reference Davidson2004). The Levenberg–Marquardt method was employed to simultaneously determine these three parameters from the measured $k_T$ values (Mori et al. Reference Mori, Watanabe and Nagata2024). The analysis yielded $a_k=21.0\ {\rm m}^2\ {\rm s}^{-2}$, $x_0=0.12$ m and $n_k=2.1$. The power law effectively approximates the decay of $k_T$ in figure 4(a). Notably, the exponent $n_k$ is higher than the typical values observed in grid turbulence.

Figure 4. The decay properties of turbulence generated by the jet interaction measured in Mori et al. (Reference Mori, Watanabe and Nagata2024): (a) turbulent kinetic energy per unit mass, $k_T=(\overline {{u'}^2}+2\overline {{v'}^2})/2$; and (b) Taylor microscale, Kolmogorov scale and turbulent Reynolds number. A power law $k_T=a_k(x-x_0)^{-n_k}$ is compared with the measured data in (a).

Since the turbulence is statistically homogeneous within the cross-sectional plane, the decay of the turbulent kinetic energy per unit mass, $k_T$, is related directly to its dissipation rate $\varepsilon$. This relationship can be expressed mathematically as

(2.1)\begin{equation} \varepsilon={-}\bar{u}\,\frac{\partial k_T}{\partial x} =\bar{u} a_k n_k(x-x_0)^{{-}n_k-1}. \end{equation}

This formula is frequently employed to evaluate the dissipation rate in grid turbulence, as the mean velocity $\bar {u}$ and $k_T$ are typically more straightforward to measure than the dissipation rate $\varepsilon$ itself (Kistler & Vrebalovich Reference Kistler and Vrebalovich1966; Thormann & Meneveau Reference Thormann and Meneveau2014). The energy spectrum within the inertial subrange, when normalised by the dissipation rate estimated using (2.1), has been shown to agree with results from other incompressible turbulent flows (Mori et al. Reference Mori, Watanabe and Nagata2024).

The turbulent Reynolds number $Re_\lambda$ and Kolmogorov scale $\eta$ are evaluated as $Re_\lambda =\sqrt {2k_T/3}\,\lambda /\nu$ and $\eta =\nu ^{3/4}\varepsilon ^{-1/4}$. Here, $\lambda =\sqrt {10\nu k_T/\varepsilon }$ is the Taylor microscale, and $\nu =\mu /\rho$ is the kinematic viscosity (where $\mu$ is the viscosity coefficient). Figure 4(b) displays the streamwise variations of $\lambda$, $\eta$ and $Re_\lambda$. The Reynolds number varies approximately between 900 and 400. The Taylor microscale is estimated to be approximately 1 mm, which is close to the spatial resolution of the PIV. In addition, the Kolmogorov velocity and time scales are defined respectively as $u_\eta =(\nu \varepsilon )^{1/4}$ and $\tau _\eta =(\nu /\varepsilon )^{1/2}$. These scales are utilised to normalise the statistics of shearing motions.

Figure 5 presents the longitudinal energy spectra of streamwise and vertical velocities, $E_u(k_x)$ and $E_v(k_y)$, at $x=0.605$ m, where $k_x$ and $k_y$ represent the wavenumbers in the $x$ and $y$ directions, respectively. The spectra and wavenumbers are normalised using $\varepsilon$, $\nu$ and $\eta$ to facilitate comparison with other turbulent flows. The measurement area and spatial resolution of the PIV determine the lowest and highest wavenumbers. Within the available range, the spectra follow $E_u \sim k_x^{-5/3}$ and $E_v \sim k_y^{-5/3}$, as expected for the inertial subrange. Additionally, the normalised spectra align quantitatively with those from other studies, further confirming the full development of turbulence. An inset in the figure displays the ratio of energy spectra $E_u/E_v$, providing a scale-dependent measure of statistical isotropy. The ratio is approximately 1.08 across all wavenumbers, indicating that the velocity fluctuations at each scale are approximately statistically isotropic.

Figure 5. Normalised longitudinal energy spectra of streamwise and vertical velocities, $E_u(k_x)$ and $E_v(k_y)$, measured at $x=0.605$m, where $k_x$ and $k_y$ represent the wavenumbers in the $x$ and $y$ directions, respectively. For comparison, the figure also includes energy spectra from direct numerical simulations (DNS) of homogeneous isotropic turbulence (HIT) with $Re_\lambda =202$ (Watanabe & Nagata Reference Watanabe and Nagata2023) and from experiments of passive-grid turbulence with $Re_\lambda =520$ (Kistler & Vrebalovich Reference Kistler and Vrebalovich1966), a boundary layer with $Re_\lambda =1450$ (Saddoughi & Veeravalli Reference Saddoughi and Veeravalli1994; Nieuwstadt, Westerweel & Boersma Reference Nieuwstadt, Westerweel and Boersma2016), and active-grid turbulence with $Re_\lambda =241$ (Zheng, Nagata & Watanabe Reference Zheng, Nagata and Watanabe2021).

Table 1 summarises the turbulence characteristics at the centre of each PIV measurement area. Here, ${\mathcal {U}} = \sqrt {2k_T/3}$ represents the characteristic velocity scale of large-scale motions, $L_u$ is the integral scale evaluated using the longitudinal autocorrelation function of streamwise velocity, and $T = L_u/{\mathcal {U}}$ is the integral time scale.

Table 1. Summary of turbulence characteristics: the turbulent Reynolds number $Re_\lambda$, the characteristic velocity scale of large-scale motions ${\mathcal {U}}=\sqrt {2k_T/3}$, the Kolmogorov velocity scale $u_\eta$, the integral scale $L_u$, the Taylor microscale $\lambda$, the Kolmogorov scale $\eta$, the spatial resolution of PIV $\varDelta$, the integral time scale $T=L_u/{\mathcal {U}}$, and the Kolmogorov time scale $\tau _\eta$.

3. Scale-dependent analysis of shearing motion

3.1. Low-pass filtered velocity field

The scale dependence of shearing motion is explored with the PIV data. The present approach involves examining local fluid motion through a coarse-grained velocity gradient, defined as the gradient of a low-pass filtered velocity field. The low-pass filter applied to the two-dimensional components of the velocity vector $(u,v)$ measured on an $x$$y$ plane is characterised by a filter Kernel function $G(r)$:

(3.1)$$\begin{gather} \tilde{u}(x,y)=\iint u(x',y')\,G(r, L_f)\,{{\rm d}\kern0.06em x}'\,{{\rm d} y}', \end{gather}$$
(3.2)$$\begin{gather}\tilde{v}(x,y)=\iint v(x',y')\,G(r, L_f)\,{{\rm d}\kern0.06em x}'\,{{\rm d} y}', \end{gather}$$
(3.3)$$\begin{gather}r=\sqrt{(x'-x)^2+(y'-y)^2}, \end{gather}$$

where the integration is calculated over the entire field of view, and $L_f$ is the cutoff length scale of the filter. We utilise the Gaussian filter (Pope Reference Pope2000), with $G(r)$ given by

(3.4)\begin{equation} G(r, L_f)=\sqrt{\frac{6}{{\rm \pi} L_f^2}} \exp \left(\frac{-6r^2}{L_f^2}\right). \end{equation}

The integral ranges of $x'$ and $y'$ in (3.1) and (3.2) extend over a length $2L_f$, specifically defined as $-C_{f}L_f \leq x'-x \leq C_{f}L_f$ and $-C_{f}L_f \leq y'-y \leq C_{f}L_f$, with $C_f=1$. At the distance $r=L_f$, the Gaussian function $G$ is less than 0.25 % of its peak value at $r=0$. Extending the integral ranges beyond this does not influence the results. This has been verified by performing the analyses described in this paper with $C_f = 1, 2, 3$. In this paper, $\tilde {f}$ denotes a quantity $f$ defined with the filtered velocity field of (3.1) and (3.2). For instance, the vorticity of the filtered velocity field is $\tilde {\omega }=\partial \tilde {v}/\partial x - \partial \tilde {u}/\partial y$. The analysis described below has also been conducted using DNS databases of incompressible isotropic turbulence (Watanabe & Nagata Reference Watanabe and Nagata2023), where different filters are tested. It has been confirmed that similar results are obtained with both the Gaussian filter and a sharp spectral filter (described by a top-hat transfer function in Fourier space) (Pope Reference Pope2000). However, a box filter, defined as a top-hat function of $G(r)$, has led to unphysical results due to oscillations in the transfer function in wavenumber space (Pope Reference Pope2000).

The statistics of the filtered velocity are evaluated for a range of the filter length $L_f$. This filter length is determined relative to the spatial resolution of the PIV, $\varDelta$, as $L_f=C_L\varDelta$. The coefficient $C_L$ varies in the range 4.8–9.2. The maximum value of $L_f$ is less than a half of the integral scale of the turbulence. Conversely, the minimum value of $L_f$ is greater than $140\eta$. Using the same PIV data, Mori et al. (Reference Mori, Watanabe and Nagata2024) have demonstrated that the energy spectra follow the $-5/3$ law across the wavenumber range corresponding to $L_f/\eta$ examined in this study.

3.2. The triple decomposition of the coarse-grained velocity gradient tensor

The triple decomposition of the velocity gradient tensor is applied to the filtered velocity $(\tilde {u}, \tilde {v})$. This approach follows the methodology outlined in Eisma et al. (Reference Eisma, Westerweel, Ooms and Elsinga2015), where the triple decomposition was similarly applied to two-dimensional and two-component PIV data of a turbulent boundary layer. Three-dimensional turbulent motions are described on two-dimensional planes, where out-of-plane motions are not accurately captured. This limitation is anticipated based on previous studies of flow topology (Perry & Chong Reference Perry and Chong1994; Rabey, Wynn & Buxton Reference Rabey, Wynn and Buxton2015). The disparity between the triple decompositions of two- and three-dimensional velocity gradient tensors is examined with DNS of homogeneous isotropic turbulence in Appendix A. The present experimental analysis is also conducted on nearly homogeneous isotropic turbulence generated by jet interaction. It is demonstrated that the intensities of the motions considered in the triple decomposition are underestimated on two-dimensional planes due to the absence of out-of-plane motions. However, the scale dependence of the intensities of decomposed motions is similar for both two- and three-dimensional decompositions. Thus the analysis using the triple decomposition on two-dimensional planes still offers valuable insights into local turbulent motions.

The velocity gradient of $(\tilde {u}, \tilde {v})$ characterises local fluid motion at a specific point $(x,y)$ and a scale determined by the filter length $L_f$. The two-dimensional velocity gradient tensor $\boldsymbol {\nabla } \tilde {\boldsymbol {u}}$ is represented as

(3.5)\begin{equation} \boldsymbol{\nabla} \tilde{\boldsymbol{u}}= \begin{pmatrix} \partial \tilde{u}/\partial x & \partial \tilde{u}/\partial y \\ \partial \tilde{v}/\partial x & \partial \tilde{v}/\partial y \end{pmatrix}. \end{equation}

As introduced earlier, the triple decomposition splits the velocity gradient tensor into three components: shear (S), rigid-body rotation (R) and elongation (E), formulated as $\boldsymbol {\nabla } \tilde {\boldsymbol {u}}=\boldsymbol {\nabla } \tilde {\boldsymbol {u}}_S+\boldsymbol {\nabla } \tilde {\boldsymbol {u}}_R+\boldsymbol {\nabla } \tilde {\boldsymbol {u}}_E$. The decomposition algorithm is the same as in Kolář (Reference Kolář2007) and Eisma et al. (Reference Eisma, Westerweel, Ooms and Elsinga2015), and is explained briefly herein. For a deeper understanding of the physical meaning and mathematical properties of this decomposition, readers can refer to the previous studies on the triple decomposition, as discussed in § 1.

The application of the triple decomposition begins with searching for a basic reference frame, which is defined at each position. This reference frame is determined by the eigenvectors of the rate-of-strain tensor $\tilde {{\mathsf{S}}}_{ij}=[(\boldsymbol {\nabla } \tilde {\boldsymbol {u}})_{ij} + (\boldsymbol {\nabla } \tilde {\boldsymbol {u}})_{ji}]/2$. The eigenvalues of $\tilde {{\mathsf{S}}}_{ij}$ are denoted as $s_1$ and $s_2$, where $s_1\geq s_2$. The corresponding eigenvectors are $\boldsymbol {e}_1=(e_{1x}, e_{1y})$ and $\boldsymbol {e}_2=(e_{2x}, e_{2y})$, respectively. Here, $e_{nx}$ and $e_{ny}$ represent the $x$ and $y$ components of $\boldsymbol {e}_n$ for $n=1$ or 2. The transformation matrix $\boldsymbol{\mathsf{Q}}_e$ that converts coordinates from the laboratory coordinates $\boldsymbol {x}=(x,y)$ to the reference frame $\boldsymbol {x}_e$ of the principal axes, defined by the eigenvectors $\boldsymbol {e}_1$ and $\boldsymbol {e}_2$, is expressed as

(3.6)\begin{equation} \boldsymbol{\mathsf{Q}}_e= \begin{pmatrix} e_{1x} & e_{1y} \\ e_{2x} & e_{2y} \end{pmatrix}. \end{equation}

The basic reference frame is obtained by rotating the coordinate system $\boldsymbol {x}_e=\boldsymbol{\mathsf{Q}}_e\boldsymbol {x}$ by $\theta =45^{\circ }$. The rotational transformation matrix $\boldsymbol{\mathsf{Q}}_r(\theta )$ is given by

(3.7)\begin{equation} \boldsymbol{\mathsf{Q}}_r(\theta)= \begin{pmatrix} \cos \theta & \sin \theta \\ -\sin \theta & \cos \theta \end{pmatrix}. \end{equation}

Consequently, the coordinate transformation from the laboratory coordinates to the basic reference frame is expressed as $\boldsymbol{\mathsf{Q}}_b=\boldsymbol{\mathsf{Q}}_r(45^\circ )\boldsymbol{\mathsf{Q}}_e$. The filtered velocity gradient tensor in the basic reference frame, denoted as $\boldsymbol {\nabla } \tilde {\boldsymbol {u}}^{(b)}$, is calculated as $\boldsymbol {\nabla } \tilde {\boldsymbol {u}}^{(b)}=\boldsymbol{\mathsf{Q}}_b\, \boldsymbol {\nabla } \tilde {\boldsymbol {u}}\, \boldsymbol{\mathsf{Q}}_b^{\rm T}$, where the superscript $(b)$ indicates quantities evaluated in the basic reference frame, and $\boldsymbol{\mathsf{Q}}_b^{\rm T}$ is the transposed matrix of $\boldsymbol{\mathsf{Q}}_b$. Subsequently, $\boldsymbol {\nabla } \tilde {\boldsymbol {u}}^{(b)}$ is decomposed into three components, $\boldsymbol {\nabla } \tilde {\boldsymbol {u}}^{(b)}_S$, $\boldsymbol {\nabla } \tilde {\boldsymbol {u}}^{(b)}_R$ and $\boldsymbol {\nabla } \tilde {\boldsymbol {u}}^{(b)}_E$, in the basic reference frame, as follows:

(3.8)$$\begin{gather} (\boldsymbol{\nabla} \tilde{\boldsymbol{u}}_{RES}^{(b)})_{ij}= \mathrm{sgn}[(\boldsymbol{\nabla} \tilde{\boldsymbol{u}}^{(b)})_{ij}] \min [|(\boldsymbol{\nabla} \tilde{\boldsymbol{u}}^{(b)})_{ij}|, |(\boldsymbol{\nabla} \tilde{\boldsymbol{u}}^{(b)})_{ji}|], \end{gather}$$
(3.9)$$\begin{gather}(\boldsymbol{\nabla} \tilde{\boldsymbol{u}}_{S}^{(b)})_{ij}= (\boldsymbol{\nabla}\tilde{\boldsymbol{u}}^{(b)})_{ij}-(\boldsymbol{\nabla} \tilde{\boldsymbol{u}}_{RES}^{(b)})_{ij}, \end{gather}$$
(3.10)$$\begin{gather}(\boldsymbol{\nabla} \tilde{\boldsymbol{u}}_{R}^{(b)})_{ij}=[(\boldsymbol{\nabla} \tilde{\boldsymbol{u}}_{RES}^{(b)})_{ij}-(\boldsymbol{\nabla} \tilde{\boldsymbol{u}}_{RES}^{(b)})_{ji}]/2, \end{gather}$$
(3.11)$$\begin{gather}(\boldsymbol{\nabla} \tilde{\boldsymbol{u}}_{E}^{(b)})_{ij}= [(\boldsymbol{\nabla} \tilde{\boldsymbol{u}}_{RES}^{(b)})_{ij}+(\boldsymbol{\nabla} \tilde{\boldsymbol{u}}_{RES}^{(b)})_{ji}]/2, \end{gather}$$

for $i,j=1, 2$, where sgn is the sign function. Here, $\boldsymbol {\nabla } \tilde {\boldsymbol {u}}_{RES}$, referred to as the residual tensor, is the remnant from $\boldsymbol {\nabla } \tilde {\boldsymbol {u}}$ after extracting shear $\boldsymbol {\nabla } \tilde {\boldsymbol {u}}_{S}$. Finally, the components of shear, rigid-body rotation and elongation in the original coordinate system are obtained by applying the inverse transformation of $\boldsymbol{\mathsf{Q}}_b$, i.e. $\boldsymbol{\mathsf{Q}}_b^{-1}=\boldsymbol{\mathsf{Q}}_b^{\rm T}$, as $\boldsymbol {\nabla } \tilde {\boldsymbol {u}}_\alpha =\boldsymbol{\mathsf{Q}}_b^{\rm T} \boldsymbol {\nabla } \tilde {\boldsymbol {u}}_\alpha ^{(b)}\, \boldsymbol{\mathsf{Q}}_b$ for $\alpha =S, R, E$.

The intensities of shear and rigid-body rotation are defined using the norm of the decomposed velocity gradient tensors as $\tilde {I}_S=\sqrt {2(\boldsymbol {\nabla } \tilde {\boldsymbol {u}}_S)_{ij} (\boldsymbol {\nabla } \tilde {\boldsymbol {u}}_S)_{ij}}$ and $\tilde {I}_R=\sqrt {2(\boldsymbol {\nabla } \tilde {\boldsymbol {u}}_R)_{ij} (\boldsymbol {\nabla } \tilde {\boldsymbol {u}}_R)_{ij}}$ (Hayashi et al. Reference Hayashi, Watanabe and Nagata2021a). The vorticity vector of filtered velocity, $\tilde {\omega }=\partial \tilde {v}/\partial x - \partial \tilde {u}/\partial y$, is decomposed into two components corresponding to shear and rigid-body rotation: $\tilde {\omega }=\tilde {\omega }_S+\tilde {\omega }_R$. The shear vorticity $\tilde {\omega }_S$ and the vorticity of rigid-body rotation $\tilde {\omega }_R$ are defined as $\tilde {\omega }_S=(\boldsymbol {\nabla } \tilde {\boldsymbol {u}}_{S})_{21}-(\boldsymbol {\nabla } \tilde {\boldsymbol {u}}_{S})_{12}$ and $\tilde {\omega }_R=(\boldsymbol {\nabla } \tilde {\boldsymbol {u}}_{R})_{21}-(\boldsymbol {\nabla } \tilde {\boldsymbol {u}}_{R})_{12}$. The magnitudes of $\tilde {\omega }_S$ and $\tilde {\omega }_R$ are related to the intensity of the corresponding motion as $\sqrt {2}\,|\tilde {\omega }_S|=\tilde {I}_S$ and $|\tilde {\omega }_R|=\tilde {I}_R$. For the fully resolved velocity gradient tensor $\boldsymbol {\nabla } \boldsymbol {u}$, $I_S$ and $I_R$ are associated with shear layers (vortex sheets) and vortex tubes with sizes of the Kolmogorov scale, respectively. For this reason, the present study focuses on these two motions, for which the statistics of $\tilde {I}_S$ and $\tilde {I}_R$ are evaluated at various length scales.

3.3. The analysis of flow structures associated with shearing motion

The flow structure associated with shearing motion in the filtered velocity fields is explored using a conditional averaging procedure. This method involves taking averages around regions exhibiting locally intense shear within a local reference frame that is oriented according to the direction of the shear. This approach aligns with the methodologies employed previously for investigating small-scale shear layers identified with the fully resolved velocity gradient tensor (Eisma et al. Reference Eisma, Westerweel, Ooms and Elsinga2015; Watanabe et al. Reference Watanabe, Tanaka and Nagata2020; Fiscaletti et al. Reference Fiscaletti, Buxton and Attili2021; Hayashi et al. Reference Hayashi, Watanabe and Nagata2021a; Watanabe & Nagata Reference Watanabe and Nagata2022). As such, the techniques used previously to study small-scale shear layers are adapted and applied to the filtered velocity field.

The initial step is to identify locations of locally intense shear within the filtered velocity field. Following Hayashi et al. (Reference Hayashi, Watanabe and Nagata2021a) and Fiscaletti et al. (Reference Fiscaletti, Buxton and Attili2021), the present study analyses flow around points where two conditions are met: first, the shear intensity $\tilde {I}_S$ reaches a local maximum, and second, $\tilde {I}_S$ exceeds a threshold, denoted as $I_{Sth}$. The shear layer exhibits a high shear intensity at its centre, as observed in the spatial distribution of shear intensity, and this central location can be identified as the local maximum of shear intensity (Fiscaletti et al. Reference Fiscaletti, Buxton and Attili2021; Hayashi et al. Reference Hayashi, Watanabe and Nagata2021a). Additionally, the local maximum of shear intensity can be detected even in regions of very weak shear, which may be partially attributed to measurement errors. To mitigate this issue, these regions of weak shear are excluded by applying a threshold. This threshold to analyse small-scale shear layers was implemented previously in Fiscaletti et al. (Reference Fiscaletti, Buxton and Attili2021), where the threshold dependence was also addressed. In the present study, the threshold is defined as $I_{Sth}=C_{th}\overline {\tilde {I}_S}$, where $C_{th}$ is a constant. We adopt $C_{th}=1.5, 2.0, 2.5, 3.0, 3.5$ to examine $C_{th}$ dependence.

The second step is identifying a local reference frame that characterises the shear orientation. This frame is referred to as a shear coordinate, denoted by ${\boldsymbol {x}}_s=(\zeta _1, \zeta _2)$, where quantities are represented with a superscript $(s)$. The shear coordinate is defined such that the shear component $\boldsymbol {\nabla } \tilde {\boldsymbol {u}}_{S}$ in this coordinate system takes the form

(3.12)\begin{equation} \boldsymbol{\nabla} \tilde{\boldsymbol{u}}_{S}^{(s)}= \begin{pmatrix} 0 & |\omega_S| \\ 0 & 0 \end{pmatrix}. \end{equation}

To establish the transformation matrix $\boldsymbol{\mathsf{Q}}_s$ from the laboratory coordinate to the shear coordinate, we utilise the matrix $\boldsymbol{\mathsf{Q}}_b$ for the basic reference frame. The matrix $\boldsymbol{\mathsf{Q}}_s$ is defined as $\boldsymbol{\mathsf{Q}}_s=\boldsymbol{\mathsf{Q}}_2\boldsymbol{\mathsf{Q}}_1\boldsymbol{\mathsf{Q}}_b$, where $\boldsymbol{\mathsf{Q}}_1$ and $\boldsymbol{\mathsf{Q}}_2$ are given by

(3.13) \begin{equation} \boldsymbol{\mathsf{Q}}_1= \begin{cases} \boldsymbol{\mathsf{Q}}_r(90^{{\circ}}) & \mathrm{when}\ |(\boldsymbol{\nabla} \tilde{\boldsymbol{u}}_{S}^{(b)})_{12}|=0, \\ \boldsymbol{\mathsf{I}} & \mathrm{otherwise}, \end{cases} \end{equation}

and

(3.14) \begin{equation} \boldsymbol{\mathsf{Q}}_2= \begin{cases} \boldsymbol{\mathsf{Q}}_{sym} & \mathrm{when}\ |(\boldsymbol{\mathsf{Q}}_1\boldsymbol{\nabla} \tilde{\boldsymbol{u}}_{S}^{(b)})_{12}|<0,\\ \boldsymbol{\mathsf{I}} & \mathrm{otherwise}, \end{cases} \end{equation}

where $\boldsymbol{\mathsf{I}}$ is the identity tensor, and $\boldsymbol{\mathsf{Q}}_{sym}$ is a symmetric transformation matrix written as

(3.15)\begin{equation} \boldsymbol{\mathsf{Q}}_{sym}= \begin{pmatrix} 1 & 0 \\ 0 & -1 \end{pmatrix}. \end{equation}

This derivation of $\boldsymbol{\mathsf{Q}}_s$ is based on the characteristics of $\boldsymbol {\nabla } \tilde {\boldsymbol {u}}_{S}$, which has only one non-zero component in the basic reference frame, either $(\boldsymbol {\nabla } \tilde {\boldsymbol {u}}_{S}^{(b)})_{12}$ or $(\boldsymbol {\nabla } \tilde {\boldsymbol {u}}_{S}^{(b)})_{21}$ (Kolář Reference Kolář2007). In the shear coordinate, the shear relates to flows in the $-\zeta _1$ direction for $\zeta _2>0$ and in the $\zeta _1$ direction for $\zeta _2<0$.

Finally, ensemble averages of all local maxima of $\tilde {I}_S$ are evaluated in the shear coordinate. At each local maximum of $\tilde {I}_S$, the shear coordinate ${\boldsymbol {x}}_s=(\zeta _1, \zeta _2)$ is given by ${\boldsymbol {x}}_s=\boldsymbol{\mathsf{Q}}_s\boldsymbol {x}$. The shear coordinate is discretised using the function

(3.16)\begin{equation} \zeta_i(n)={-} \frac{\zeta_{max}}{\alpha_\zeta}\, \mathrm{atanh}\left[ \mathrm{tanh}(\alpha_\zeta) \left(1- \frac{n+N_\zeta}{N_\zeta}\right)\right],\end{equation}

where $n = -N_\zeta, \ldots, N_\zeta$ is an integer specifying discrete points, $N_\zeta =60$ determines the resolution, $\alpha _\zeta =2.5$ is a stretching parameter, and $\zeta _{max}=7.5L_f$ defines the range of $\zeta _i$ as $-\zeta _{max} \leq \zeta _i \leq \zeta _{max}$. The spacing between discrete points decreases as $|\zeta _i|$ approaches zero, providing enhanced spatial resolution near the shear layer where the velocity gradient is large. This function has also been employed for spatial discretisation in DNS, and the distribution of discrete points has been detailed in previous studies (Watanabe et al. Reference Watanabe, Riley, Nagata, Onishi and Matsuda2018; Akao, Watanabe & Nagata Reference Akao, Watanabe and Nagata2022). The velocity vector in the shear coordinate, $\tilde {\boldsymbol {u}}^{(s)}=(\tilde {u}_1^{(s)}, \tilde {u}_2^{(s)})$, is calculated as $\tilde {\boldsymbol {u}}^{(s)}=\boldsymbol{\mathsf{Q}}_s\tilde {\boldsymbol {u}}$. Furthermore, the shear vorticity in the shear coordinate, $\tilde {\omega }_S^{(s)},$ is determined using the shear tensor in the shear coordinate, $\boldsymbol {\nabla } \tilde {\boldsymbol {u}}_S^{(s)}=\boldsymbol{\mathsf{Q}}_s\, \boldsymbol {\nabla } \tilde {\boldsymbol {u}}_S\, \boldsymbol{\mathsf{Q}}_s^{\rm T}$. Other vectors and tensors in the shear coordinate are evaluated in this manner using $\boldsymbol{\mathsf{Q}}_s$. For the velocity vectors, the relative velocity with respect to $(\zeta _1, \zeta _2)=(0,0)$ is analysed to reveal the local flow pattern around shearing motion. These quantities are evaluated on the discrete shear coordinate by interpolating the PIV data in the laboratory coordinate system. The present study employs a third-order Lagrange polynomial interpolation scheme. For each local maximum of $\tilde {I}_S$, this procedure computes the variable $f$ as a function of $(\zeta _1, \zeta _2)$, where the range of $(\zeta _1, \zeta _2)$ is confined within the measurement area of PIV. Consequently, no extrapolation of the PIV data is utilised in the analysis of the shear layer. Thus the number of statistical samples varies depending on the location of $(\zeta _1, \zeta _2)$. The ensemble average of $f$ is then computed as a function of $(\zeta _1, \zeta _2)$ with all local maxima of $\tilde {I}_S$. This average is denoted by $\langle\;f \rangle$.

4. Results and discussion

4.1. Intensities of shearing motion and rigid-body rotation

Figure 6 visualises the instantaneous intensities of rigid-body rotation $\tilde {I}_R$ and shear $\tilde {I}_S$ in the filtered velocity field at the PIV measurement centred at $x=0.360$ m. The filter length is set at $L_f/\eta =343$. The distribution of $\tilde {I}_R$ is highly intermittent in space. Most parts of the flow exhibit $\tilde {I}_R\approx 0$, with large $\tilde {I}_R$ values concentrated in small, discrete spots. These large values of $\tilde {I}_R$, often circular in shape, are indicative of vortex tubes with axes perpendicular to the measurement plane. Smaller but non-zero values of $\tilde {I}_R$ do not always have a circular shape but exhibit an elliptic shape elongated in one direction. These regions possibly indicate vortex tubes with axes nearly parallel to the measurement planes. As the out-of-plane component of rigid-body rotation is not captured on the two-dimensional plane, $\tilde {I}_R$ for these vortices can be underestimated by the analysis of two-dimensional velocity fields, as confirmed in Appendix A. Shearing motion, represented by $\tilde {I}_S>0$, is almost everywhere throughout the flow. Consequently, turbulent motion at intermediate scales is predominantly governed by shear. While $\tilde {I}_R$ and $\tilde {I}_S$ are related to turbulent motions at intermediate scales, their spatial distributions are consistent with rigid-body rotation and shear at the smallest scales, where the former is intermittently present at the smallest scales, while the latter is more pervasive than rigid-body rotation (Hayashi et al. Reference Hayashi, Watanabe and Nagata2021a). The predominance of shearing motion at the smallest scales has been reported consistently for various turbulent flows in analyses employing the three-dimensional triple decomposition, and this observation is unlikely to be influenced by the two-dimensional triple decomposition (Das & Girimaji Reference Das and Girimaji2020; Nagata et al. Reference Nagata, Watanabe, Nagata and da Silva2020b; Hayashi et al. Reference Hayashi, Watanabe and Nagata2021a). This tendency persists even in random velocity fields that are not solutions to the Navier–Stokes equations (Watanabe & Nagata Reference Watanabe and Nagata2022). Thus the highly intermittent nature of rigid-body rotation is considered a kinematic characteristic of fluctuating velocity fields.

Figure 6. Distributions of the intensities of (a) rigid-body rotation $\tilde {I}_R$, and (b) shear $\tilde {I}_S$ in a filtered velocity field with filter length $L_f/\eta =343$.

Figure 7 displays the mean intensities of shear and rigid-body rotation, $\overline {\tilde {I}_S}$ and $\overline {\tilde {I}_R}$, as functions of the filter length $L_f$. The mean intensities and $L_f$ are normalised by the Kolmogorov time and length scales, respectively. These experimental results are presented with data from a DNS database of statistically steady, homogeneous and isotropic turbulence with $Re_\lambda =202$ in Watanabe & Nagata (Reference Watanabe and Nagata2023). The graph reveals a decrease in the mean intensities of both motions with an increase in scale. While the maximum $L_f/\eta$ value available in the DNS is smaller than the experimental range, an extrapolation of the DNS results shows alignment with the experimental data. According to Kolmogorov's second similarity hypothesis, the first moment of the filtered velocity gradient, such as the mean vorticity magnitude $\overline{|\tilde{\omega}|}$, varies as $L_f^{-2/3}$ when $L_f$ is in the inertial subrange (Naso & Pumir Reference Naso and Pumir2005). Figure 7 also compares $\overline {\tilde {I}_S}$ and $\overline {\tilde {I}_R}$ with the Kolmogorov scaling of $L_f^{-2/3}$. Both $\overline {\tilde {I}_S}$ and $\overline {\tilde {I}_R}$ in the experiments conform to this power-law decay, with exponents close to that predicted by Kolmogorov scaling. The exact values of these exponents, determined using a least squares method, are further discussed in relation to higher-order moments below.

Figure 7. Scale dependence of the mean intensities of shear and rigid-body rotation, $\overline {\tilde {I}_S}$ and $\overline {\tilde {I}_R}$. The DNS results of isotropic turbulence are shown for comparison (Watanabe & Nagata Reference Watanabe and Nagata2023).

Figure 8 compares the probability density functions (PDFs) of $\tilde {I}_S$ and $\tilde {I}_R$ for three different values of the filter length $L_f$. In this comparison, the mean vorticity magnitude of the filtered velocity, $\overline {|\tilde {\omega }|}$, is utilised to normalise $\tilde {I}_S$ and $\tilde {I}_R$. The PDFs are displayed using linear and logarithmic scales in figures 8(a) and 8(b), respectively. The distribution of the PDFs remains consistent across different scales. The PDF of $\tilde{I}_R$ displays a pronounced peak at $\tilde{I}_R=0$, indicating that rigid-body rotation is mostly negligible. Conversely, the PDF of $\tilde{I}_S$ peaks at $\tilde{I}_S/\overline{|\tilde{\omega}|}=0.35$, signifying the prevalence of weak shearing motion in the flow. This observation aligns with the visualisations presented in figure 6. The minimal scale dependence of the PDFs suggests that both shear and rigid-body rotation motions are distributed within turbulence independently of scale at intermediate scales.

Figure 8. The PDFs of the intensities of shear, $\tilde {I}_S$, and rigid-body rotation, $\tilde {I}_R$, of filtered velocity fields in (a) linear and (b) logarithmic scales. The results are presented for the PIV data measured at $x=0.360$ m.

4.2. Scaling of higher-order moments

Kolmogorov's second similarity hypothesis suggests that the $n$th-order moment of the velocity difference between two points separated by a distance $r$, commonly referred to as the $n$th-order structure function, should follow a power law $r^{n/3}$. Previous research has demonstrated extensively that the scaling exponents deviate from $n/3$ as $n$ increases. This study revisits this topic, particularly focusing on shearing motion and rigid-body rotation associated with shear layers and vortex tubes. It is important to clarify that our aim is not to establish the precise scaling exponents but rather to discuss the relevance of small-scale intermittency with these motions, which can be instrumental in understanding the statistical properties of turbulence in terms of flow structures. In the filtered velocity field with filter length $L_f$, the velocity increments due to shear and rigid-body rotation over the distance $L_f$ are measured as $\tilde {I}_SL_f$ and $\tilde {I}_RL_f$, respectively. The present study investigates the $L_f$ dependence of $n$th-order moments of $\tilde {I}_SL_f$ and $\tilde {I}_RL_f$, denoted as $\overline {(\tilde {I}_SL_f)^n}$ and $\overline {(\tilde {I}_RL_f)^n}$. According to Kolmogorov's hypothesis, these are predicted to scale as $L_f^{n/3}$ in the inertial subrange, while smaller exponents are expected under the influence of small-scale intermittency. Figure 9 compares the results for $n=3$ and 5 at $x=0.360$ m with the Kolmogorov scaling. The maximum filter length considered here is $L_f/\eta = 659$, which is significantly smaller than the integral scale $L_u/\eta = 1635$. The longitudinal energy spectrum of streamwise velocity, $E_u(k_x)$, at this measurement location has been detailed in Mori et al. (Reference Mori, Watanabe and Nagata2024). At the wavenumber corresponding to $L_f/\eta = 659\eta$, specifically $k_x\eta = 9 \times 10^{-3}$, the spectrum exhibits a clear power law $E_u \sim k_x^{-5/3}$. This indicates that the fitting range of $L_f/\eta$ falls well within the inertial subrange. For shearing motion, both $\overline {(\tilde {I}_SL_f)^3}$ and $\overline {(\tilde {I}_SL_f)^5}$ conform to power laws as functions of $L_f$. However, the results for rigid-body rotation tend to diverge from these power laws, particularly for $L_f/\eta >500$.

Figure 9. Scale dependence of (a) third-order and (b) fifth-order moments of the velocity increments due to shear, $\tilde {I}_SL_f$, and rigid-body rotation, $\tilde {I}_RL_f$. The solid lines indicate the Kolmogorov scaling.

The exponents $p$ for the power laws $\overline {(\tilde {I}_SL_f)^n}\sim L_f^p$ and $\overline {(\tilde {I}_RL_f)^n}\sim L_f^p$ are determined using a least squares method. For shear, the exponent associated with $\overline {(\tilde {I}_SL_f)^n}$ is evaluated across the entire range of $L_f$ examined in the experiments. Because of the limited range of the power law for $\overline {(\tilde {I}_RL_f)^n}$, $p$ for rigid-body rotation is calculated using data points for $L_f/\eta \leq 480$. In this range, the slopes of $\overline {(\tilde {I}_SL_f)^3}$ and $\overline {(\tilde {I}_RL_f)^3}$ are found to be similar, as shown in figure 9(a). Figure 10 presents the exponents $p$ of $\overline {(\tilde {I}_SL_f)^n}$ and $\overline {(\tilde {I}_RL_f)^n}$ at $x=0.360$ m. We have also confirmed that similar results are obtained for different measurement locations. These results are compared with the scaling exponents of the longitudinal structure function reported in Arneodo et al. (Reference Arneodo1996) and Iyer et al. (Reference Iyer, Sreenivasan and Yeung2020). For shear intensity, the exponents closely match those of the structure function: $p$ aligns with the Kolmogorov scaling $p=n/3$ for $n\leq 4$, but diverges for higher $n$. The extent of deviation from $p=n/3$ is quantitatively consistent between the shear intensity and the longitudinal structure function. The deviation from $p=n/3$ for $n\leq 4$ in rigid-body rotation is also minimal. However, the exponent $p$ for higher-order moments of $\tilde {I}_RL_f$ is significantly smaller than $n/3$, and differs from those for $\tilde {I}_SL_f$ and the structure functions. Shearing motion is characterised by a transverse velocity gradient of $\boldsymbol {\nabla } \tilde {\boldsymbol {u}}_S$ in the basic reference frame of the triple decomposition. However, in other frames, such as the laboratory coordinates $\boldsymbol {x}$, $\boldsymbol {\nabla } \boldsymbol {u}_S$ can exhibit non-zero diagonal components (longitudinal velocity gradient). Therefore, comparing the exponents between shear intensity and longitudinal structure function is meaningful. While it is known that the transverse structure function for $n\geq 4$ has smaller scaling exponents than the longitudinal one, this discrepancy is not substantial for $n\leq 8$ examined here (Dhruva, Tsuji & Sreenivasan Reference Dhruva, Tsuji and Sreenivasan1997; Gotoh, Fukayama & Nakano Reference Gotoh, Fukayama and Nakano2002; Iyer et al. Reference Iyer, Sreenivasan and Yeung2020).

Figure 10. The power law exponents $p$ for the $n$th-order moments of the velocity increments due to shear, $\tilde {I}_SL_f$, and rigid-body rotation, $\tilde {I}_RL_f$, at $x=0.360$ m.

The alignment of the scaling exponent between shear intensity and structure function suggests that velocity increments between two points separated by a distance $r$ are influenced predominantly by shearing motion at the scale of $r$. Consistently, regions characterised by intense velocity gradients even at the smallest scale are influenced predominantly by shear (Das & Girimaji Reference Das and Girimaji2020). Additionally, the intensity of rigid-body rotation demonstrates scaling exponents that are considerably smaller than the Kolmogorov scaling $n/3$. This observation aligns with the markedly intermittent distribution of rigid-body rotation, characterising vortex tubes, as visualised in figure 6(a). As discussed with conditional averages below, shearing motion at intermediate scales is concentrated in sheet-like structures, manifesting as shear layers. These results suggest that velocity increments between two points are influenced predominantly by shear layers. Iyer et al. (Reference Iyer, Sreenivasan and Yeung2020) explored the scaling exponents of longitudinal and transverse structure functions, noting that the exponents for high-order transverse structure functions tend to stay at approximately 2. This behaviour and the fractal description of small-scale turbulence also suggest that sheet-like structures dominate transverse velocity increments. The present analysis further provides direct evidence supporting the relevance of shearing motion associated with layer structures to the observed deviation from the Kolmogorov scaling.

4.3. Characteristics of shear layers at intermediate scales

The conditional statistics evaluated near the local maxima of shear intensity are examined to investigate the flow structure associated with shearing motion at intermediate scales. The results are first presented for different filter lengths and turbulent Reynolds numbers. In § 4.4, the findings are then compared with small-scale shear layers characterised by the Kolmogorov scales.

Figure 11 provides a visualisation of the mean shear intensity $\langle \tilde {I}_S\rangle$ and mean velocity vectors in the filtered velocity fields for filter lengths $L_f/\eta =343$ and $458$. The mean velocity vectors indicate that flows in both $\pm \zeta _1$ directions, for $\zeta _2>0$ and $\zeta _2<0$, contribute to the shear. The area exhibiting large shear intensity is narrow in the $\zeta _2$ direction but elongated along the $\zeta _1$ axis. This observation confirms the formation of layer structures with shearing motion at intermediate scales. Notably, the mean flow pattern remains consistent across both length scales examined. The aspect ratio of the shear layer is determined by analysing the profiles of $\langle \tilde {I}_S\rangle$ along the $\zeta _1$ and $\zeta _2$ axes. The normalised mean shear intensity is defined as $\hat {I}_S(\zeta _1, \zeta _2)= (\langle \tilde {I}_S\rangle (\zeta _1,\zeta _2)-\overline {\tilde {I}_S})/ (\langle \tilde {I}_S\rangle (0,0)-\overline {\tilde {I}_S})$, which diminishes from 1 to 0 as $|\zeta _1|$ or $|\zeta _2|$ increases from 0. The extent of the shear layer in the $\zeta _1$ direction, $L_1$, is measured as the distance between two points where $\hat {I}_S(\zeta _1,0)=0.1$. Likewise, the dimension of the layer in the $\zeta _2$ direction, $L_2$, is determined from two points where $\hat {I}_S(0,\zeta _2)=0.1$. The profiles of $\hat {I}_S$ have been evaluated for all measurement locations and filter lengths, confirming an aspect ratio $A_R=L_1/L_2\approx 4.5$, which remains consistent irrespective of $L_f$ and $Re_\lambda$.

Figure 11. The mean shear intensity $\langle \tilde {I}_S\rangle$ and mean velocity vectors $(\langle \tilde {u}^{(s)}_1\rangle$, $\langle \tilde {u}^{(s)}_2\rangle )$ around locally intense shear regions of filtered velocity fields at filter lengths (a) $L_f/\eta =343$ and (b) $L_f/\eta =458$. The vector lengths indicate the velocity magnitude. The coordinate is normalised by the Kolmogorov scale $\eta$. The results are shown for $x=0.360$ m and $C_{th}=2$.

Figure 12 displays the conditional average of the mean vorticity of rigid-body rotation, $\langle \tilde {\omega }_{R}^{(s)}\rangle$, in the shear coordinate. These results are obtained from the filtered velocity fields with filter lengths $L_f/\eta =343$ and 458. The white solid line represents the location of the shear layer, marked by the isoline of the mean shear intensity. Large positive values of $\langle \tilde {\omega }_{R}^{(s)}\rangle$ are observed at the edges of the shear layer on $\zeta _2=0$. Furthermore, regions of negative $\langle \tilde {\omega }_{R}^{(s)}\rangle$ are present on both sides of the shear layer. This distribution pattern is the same for both filter lengths. Figure 12(a) also illustrates the orientation of the vortical motion, as determined by the sign of $\langle \tilde {\omega }_{R}^{(s)}\rangle$. The flow induced by rigid-body rotation is aligned with the mean flow surrounding the shear layer, as visualised in figure 11.

Figure 12. The distribution of mean vorticity of rigid-body rotation $\langle \tilde {\omega }_{R}^{(s)}\rangle$ near the shear layers at filter lengths (a) $L_f/\eta =343$ and (b) $L_f/\eta =458$. The white solid line is the isoline of mean shear intensity $\langle \tilde {I}_S\rangle =1.5\overline {\tilde {I}_S}$, indicating the shear layer location. The results are shown for $x=0.360$ m and $C_{th}=2$. The arrows illustrate the orientation of vortical motions.

Figure 13(a) shows the mean shear vorticity $\langle \tilde {\omega }_{S}^{(s)}\rangle$ and the mean velocity in the $\zeta _1$ direction, $\langle \tilde {u}^{(s)}_1\rangle$, across the shear layer at $\zeta _1=0$. The shear vorticity is significantly large within the thin layer. It approaches zero for large $|\zeta _2|$, indicating that the shearing motion identified at $\zeta _2=0$ weakly influences the far-field characteristics with large $|\zeta _2|$. Concurrently, the mean velocity associated with the shear, $\langle \tilde {u}^{(s)}_1\rangle$, exhibits a distinct jump within the region where $\langle {\tilde {\omega }_{S}^{(s)}}\rangle$ is large. The observed pattern of the mean velocity jump in the shear layers within the filtered velocity field aligns with the mean velocity profiles around small-scale shear layers in prior studies (Eisma et al. Reference Eisma, Westerweel, Ooms and Elsinga2015; Watanabe et al. Reference Watanabe, Tanaka and Nagata2020; Fiscaletti et al. Reference Fiscaletti, Buxton and Attili2021). Figure 13(b) shows $\langle \tilde {\omega }_{S}^{(s)}\rangle$ at $\zeta _1=0$ normalised by its maximum value at $(\zeta _1, \zeta _2)=(0, 0)$. The distribution of the normalised shear vorticity is identical for different filter lengths, indicating the presence of self-similar structures of shearing motion at intermediate scales.

Figure 13. (a) The mean shear vorticity $\langle \tilde {\omega }_{S}^{(s)}\rangle$ and the mean velocity in the $\zeta _1$ direction, $\langle \tilde {u}^{(s)}_1\rangle$, across the shear layer at $\zeta _1=0$ in filtered velocity fields at filter length $L_f/\eta =343$. (b) The scale dependence of the mean shear vorticity normalised by the maximum value. The results are shown for $x=0.360$ m.

The thickness $\delta _S$ and velocity jump $\Delta u$ of the averaged shear layers are quantified with the half-width of $\langle \tilde {\omega }_{S}^{(s)}\rangle$. The definitions of $\delta _S$ and $\Delta u$ are chosen to compare directly with previous studies on small-scale shear layers, which employ the half-width to quantify $\delta _S$ and $\Delta u$. The layer thickness $\delta _S$ is determined as the distance between the two points with $\langle \tilde {\omega }_{S}^{(s)}\rangle /\langle \tilde {\omega }_{S}^{(s)}\rangle _{max}=0.5$, where $\langle \tilde {\omega }_{S}^{(s)}\rangle _{max}$ is $\langle \tilde {\omega }_{S}^{(s)}\rangle$ at $(\zeta _1, \zeta _2)=(0,0)$. The mean velocity gradient caused by shear is represented by $\langle \tilde {\omega }_{S}^{(s)}\rangle$ at $(\zeta _1, \zeta _2)=(0,0)$, by which the mean velocity jump across the shear layer is evaluated as $\Delta u = \delta _S\langle \tilde {\omega }_{S}^{(s)}\rangle$.

Randomly fluctuating velocity fields exhibit shearing motion, even if they are not the solutions to the Navier–Stokes equations (Watanabe et al. Reference Watanabe, Tanaka and Nagata2020). The scale dependence of shear layers is explored for a multi-scale, random and solenoidal velocity field. This velocity field possesses the same energy spectrum as homogeneous isotropic turbulence at $Re_\lambda = 128$, but with phases in wavenumber space generated by random numbers. The random velocity, free from the dynamics of Navier–Stokes equations, is frequently investigated to understand the kinematic nature of multi-scale velocity fields (Shtilman, Spector & Tsinober Reference Shtilman, Spector and Tsinober1993; Tsinober Reference Tsinober2009). Details on the generation of random velocity are provided in Appendix B. Figure 14 presents the conditional statistics of shear layers for the random velocity, while analogous statistics in genuine turbulence are depicted in figure 13. In figure 14(a), the shear layer within the random velocity also displays significant shear vorticity at its centre, across which the velocity changes abruptly. These profiles show little difference between turbulence and random velocity. Moreover, the shear vorticity near shear layers at different scales, as shown in figure 14(b), maintains a self-similar profile even in random velocity. These findings indicate that the self-similar layer structure with shear at intermediate scales arises primarily from the kinematic nature of multi-scale random velocities.

Figure 14. The same plots as in figure 13 obtained for random velocity: (a) the mean shear vorticity and mean velocity for $L_f/\eta =30$; (b) the mean shear vorticity normalised by its peak value.

Figure 15 presents the relationship between the layer thickness $\delta _S$ and the filter length $L_f$ at four measurement locations. The figure also compares results obtained using various thresholds $C_{th}$. As expected from the filter characteristics, $\delta _S$ increases linearly with $L_f$. A least squares method yields $\delta _S=0.79L_f$. Notably, this relationship is independent of $C_{th}$. When analysing shear layers in the filtered velocity field, the thickness of these layers is determined by the chosen filter length.

Figure 15. The scale dependence of the shear layer thickness $\delta _S$ estimated as the half-width of the mean shear vorticity. The line indicates $\delta _S=0.79L_f$ obtained with a least squares method.

Figure 16(a) displays the relationship between the velocity jump of the shear layer, $\Delta u(L_f)$, and the shear layer thickness $\delta _S(L_f)$. The Kolmogorov velocity and length scales, independent of $L_f$, normalise $\Delta u$ and $\delta _S$, respectively. The range of $L_f$, the measurement locations and the values of $C_{th}$ are the same as in figure 15. Applying larger $C_{th}$ values leads to the exclusion of weaker shearing motions from the analysis, which consequently results in an increase in $\Delta u$ as $C_{th}$ increases. Despite this increase, the scale dependence of $\Delta u$ remains similar for all $C_{th}$ values, showing that $\Delta u$ increases with $\delta _S$. According to the Kolmogorov scaling, the velocity jump across a shear layer of thickness $\delta _S$ is predicted to scale as $\Delta u\sim (\varepsilon \delta _S)^{1/3}$. The slope of $\Delta u$ closely follows this power law. This power law is more evident in the compensated plot shown in figure 16(b), where $\Delta u/(\varepsilon \delta _S)^{1/3}$ is plotted against $\delta _S/\eta$. The scale dependence of $\Delta u/(\varepsilon \delta _S)^{1/3}$ is insignificant, suggesting that $\Delta u\sim (\varepsilon \delta _S)^{1/3}$ is generally valid for the present data. However, the results also indicate that the coefficient $A$ in $\Delta u=A(\varepsilon \delta _S)^{1/3}$ is not universal but varies with $C_{th}$. This variation is attributed to the elimination of weaker shearing motions at higher $C_{th}$ values. For $C_{th}=1.5$, the value of $A$ is in the range approximately $2.5\pm 0.2$ for $Re_\lambda =433$–732. The velocity jump $\Delta u$ evaluated on two-dimensional planes is underestimated by a factor of about $1/\sqrt {3}$ compared to that in three-dimensional fields, as demonstrated in Appendix A. Consequently, the actual velocity jump is expressed more accurately as $\Delta u = A'(\varepsilon \delta _S)^{1/3}$, where $A' \approx \sqrt {3}\,A \approx 4.3$.

Figure 16. (a) The scale dependence of the mean velocity jump $\Delta u$ across the shear layer. (b) The compensated plots of $\Delta u$ normalised by $(\varepsilon \delta _S)^{1/3}$. Symbols are the same as in figure 15.

Figure 17 illustrates the scale dependence of the shear Reynolds number $Re_S$, a crucial parameter characterising the dynamics of shear layers. The shear Reynolds number is defined using the thickness and velocity jump of the shear layer as $Re_S=\delta _S\,\Delta u/\nu$. Given the Kolmogorov scaling for the velocity jump, $\Delta u\sim \delta _S^{1/3}$, $Re_S$ is expected to obey a power law of $\delta _S$ written as $Re_S\sim \delta _S^{4/3}$. Consistently, $Re_S\sim (\delta _S/\eta )^{1.3}$ is obtained with a least squares method. The shear Reynolds number is also underestimated by the two-dimensional analysis of three-dimensional shearing motions, as discussed in Appendix A. The actual shear Reynolds number is about $\sqrt {3}$ times larger than the values presented in figure 17. The shear Reynolds number in the intermediate scales is sufficiently large for the shear layers to be unstable. This point is discussed further in § 4.4.

Figure 17. The scale dependence of the shear Reynolds number. The results are presented for $C_{th}=1.5$.

4.4. Comparisons of shear layers at intermediate scales and the smallest scale

The findings from this study on shear layers at intermediate scales show similarities to the characteristics of small-scale shear layers investigated previously. The latter has been investigated with the triple decomposition of the fully resolved velocity gradient tensor (Eisma et al. Reference Eisma, Westerweel, Ooms and Elsinga2015; Fiscaletti et al. Reference Fiscaletti, Buxton and Attili2021; Hayashi et al. Reference Hayashi, Watanabe and Nagata2021a; Watanabe & Nagata Reference Watanabe and Nagata2022, Reference Watanabe and Nagata2023). Here, these shear layers are compared between the intermediate scales and the smallest scale.

The mean profile of shear intensity depicted in figure 11 reveals that the aspect ratio $A_R$ of the shear layer in the mean flow pattern is approximately 4.5. This same methodology for assessing the aspect ratio is applicable to the mean shear intensity profile of the small-scale shear layer presented in previous studies. For instance, in a turbulent planar jet with $Re_\lambda =97$ in Hayashi et al. (Reference Hayashi, Watanabe and Nagata2021a), the small-scale shear layer has $A_R=4.6$, which aligns closely with $A_R=4.5$ observed for the shear layers at intermediate scales. Moreover, the two-dimensional distribution of the mean shear intensity and mean velocity vector, as shown in figure 11, resembles the distribution pattern found for small-scale shear layers (Hayashi et al. Reference Hayashi, Watanabe and Nagata2021a).

Figure 12 indicates the presence of vortex tubes exhibiting rigid-body rotation near the shear layers at intermediate scales. The sign of the rigid-body rotation vorticity $\tilde {\omega }_{R}^{(s)}$ reveals that the vortices within the shear layer (where $\tilde {\omega }_{R}^{(s)}>0$) rotate in the same direction as the shear-induced vorticity ($\tilde {\omega }_{S}^{(s)}>0$). Conversely, vortices located alongside the shear layers exhibit the opposite rotating direction. Watanabe & Nagata (Reference Watanabe and Nagata2022) presented similar observations for small-scale shear layers, where pairs of anti-rotating vortices associated with rigid-body rotation were also noted in the mean profile around the shear layers. Thus the arrangement of vortices around shear layers appears consistent across both intermediate and small scales. In the case of small-scale shear layers, it is understood that the vortices on the sides of the shear layer contribute to the flow that drives the shearing motion (Watanabe & Nagata Reference Watanabe and Nagata2022). This role of vortices is likely comparable at the intermediate scale because of the similar configurations of vortices. These findings suggest that shear layers often emerge adjacent to rotating motion, aligning with earlier research on tubular and sheet-like structures at intermediate scales (Bermejo-Moreno et al. Reference Bermejo-Moreno, Pullin and Horiuti2009). These structures tend to appear next to each other. However, given that rigid-body rotation is more spatially intermittent than shearing motion, such vortex configurations may not be present for all shear layers in instantaneous flow fields.

Watanabe & Nagata (Reference Watanabe and Nagata2023) investigated the shear Reynolds number $Re_S$ for small-scale shear layers in homogeneous isotropic turbulence, defined using the half-width of the shear intensity $\delta _S$ and the velocity jump $\Delta u$ across the layers. The characteristics of small-scale shear layers are compared with the scale dependence of $\Delta u$ and $Re_S$ at intermediate scales (greater than $100\eta$) derived from the current experimental data. Figure 16 demonstrates the Kolmogorov scaling for the velocity jump $\Delta u=A'(\varepsilon \delta _S)^{1/3}$, with $A'\approx 4.3$ for the smallest $C_{th}$. This lowest threshold value is selected to include even weak shearing motions, akin to the analyses of small-scale shear layers in Watanabe & Nagata (Reference Watanabe and Nagata2023). The present results for $\Delta u$ yield the following relationship for the mean velocity jump of shear layers in the inertial subrange:

(4.1)\begin{equation} \Delta u/u_\eta=A'(\delta_S/\eta)^{1/3}.\end{equation}

The time scale associated with the evolution of shear layers is defined as $\tau _S=\delta _S/\Delta u$. The small-scale shear layers often collapse, forming small-scale vortex tubes through shear instability, as described in Vincent & Meneguzzi (Reference Vincent and Meneguzzi1994). The time scale of this shear instability is comparable to $\tau _S$ and is of the same order as the Kolmogorov time scale $\tau _\eta$ for the small-scale shear layers (Watanabe & Nagata Reference Watanabe and Nagata2023). Equation (4.1) yields the following expression for $\tau _S$:

(4.2)\begin{equation} \tau_S/\tau_\eta={A'}^{{-}1}(\delta_S/\eta)^{2/3},\end{equation}

which can be related to the time period for vortex formation from shear layers at scale $\delta _S$. Finally, (4.1) yields the shear Reynolds number as

(4.3)\begin{equation} Re_S=A'(\delta_S/\eta)^{4/3}.\end{equation}

These relationships are based on the Kolmogorov scaling of the velocity jump $\Delta u$ within the inertial subrange. However, they align well with the characteristics of small-scale shear layers. Typically, these small-scale shear layers were shown to have $\delta _S\approx 4\eta$, $\varDelta _u\approx 5u_\eta$ and therefore $Re_S=(\delta _S/\eta )(\varDelta _u/u_\eta )\approx 20$ (Watanabe & Nagata Reference Watanabe and Nagata2023). Equation (4.1) specifically predicts $\Delta u=6.8u_\eta$ for a shear layer thickness $\delta _S=4\eta$, closely matching the direct observation of $\Delta u\approx 5u_\eta$ for the small-scale shear layers. This congruence suggests that other characteristics of small-scale shear layers are also consistent with the estimations based on the Kolmogorov scaling. For instance, (4.2) with $\delta _S= 4\eta$ predicts $\tau _S=0.6\tau _\eta$, aligning with $\tau _S=0.8\tau _\eta$, which is evaluated directly for small-scale shear layers. Additionally, (4.3) with $\delta _S\approx 4\eta$ yields $Re_S=27$, closely resembling the reported value $Re_S=20$ for small-scale shear layers. Despite the strong influence of viscosity on small-scale shear layers, as evidenced by the kinetic energy and enstrophy budgets (Pirozzoli et al. Reference Pirozzoli, Bernardini and Grasso2010; Hayashi et al. Reference Hayashi, Watanabe and Nagata2021a; Watanabe & Nagata Reference Watanabe and Nagata2022), the empirical relations rooted in Kolmogorov scaling are surprisingly consistent with the small-scale shear layers. This implies that (4.1)–(4.3) are applicable even to the shear layers at scales smaller than those examined in this study.

The shear layers at intermediate scales exhibit a high shear Reynolds number ($Re_S\gg 1$), indicating their instability against perturbations (Betchov & Szewczyk Reference Betchov and Szewczyk1963; Lin & Corcos Reference Lin and Corcos1984). The mean shear intensity profile displayed in figure 11 reveals an aspect ratio of approximately 4.5 for these layers. Such a low aspect ratio suggests that the shear layers are absolutely unstable, even in the absence of external perturbations. This is due to the self-induced velocity of the shear layers, which initiates the self-roll-up process of the layers (Watanabe & Nagata Reference Watanabe and Nagata2023). The present results imply that the instability of shear layers with thickness $\delta _S$ within the inertial subrange readily leads to the formation of vortex tubes of a similar scale. Theoretical and numerical analyses of shear instability have confirmed that the shear layer possesses an optimal wavelength for disturbances, which most effectively accelerates the roll-up of the shear layers (Betchov & Szewczyk Reference Betchov and Szewczyk1963; Lin & Corcos Reference Lin and Corcos1984). For shear layers with a finite aspect ratio, this optimal wavelength is around seven times the thickness defined as the half-width of the shear intensity (Watanabe & Nagata Reference Watanabe and Nagata2023). Both perturbation-induced and self-induced instabilities of shear layers with a finite aspect ratio are further accelerated by external disturbances with length scale $7\delta _S$. Small-scale shear layers with $\delta _S\approx 4\eta$ in isotropic turbulence are indeed particularly unstable against perturbations at this wavelength, which corresponds to approximately $28\eta$ (Watanabe & Nagata Reference Watanabe and Nagata2023). This scale dependence of the response of shear layers to perturbations can be important in understanding the interaction of turbulent motions with different scales in terms of flow structures. Additionally, the instability of shear layers within the inertial range can also be crucial in understanding the modulation of turbulence by disturbances, such as flows interacting with cylinders, spheres or particles (Nagata et al. Reference Nagata, Noguchi, Kusama, Nonomura, Komuro, Ando and Asai2020a; Takamure, Kato & Uchiyama Reference Takamure, Kato and Uchiyama2023), when the disturbance scale matches the instability mode of shear layers at a specific scale. This aspect will also be important in studies of flow control, which often leverage flow instability to maximize the impact of disturbances introduced into flows (Cattafesta & Sheplak Reference Cattafesta and Sheplak2011; Watanabe Reference Watanabe2024).

5. Conclusion

The scale dependence of local shearing motion has been explored through wind tunnel experiments of decaying homogeneous isotropic turbulence generated by multiple jets, with the turbulent Reynolds number ranging approximately from 900 to 400. The PIV datasets in Mori et al. (Reference Mori, Watanabe and Nagata2024) were analysed using the triple decomposition (Kolář Reference Kolář2007) applied to filtered velocity fields. This decomposition separates the coarse-grained velocity gradient tensor into three components: shear, rigid-body rotation and elongation, each associated with a specific scale determined by the filter cutoff $L_f$. Vortex tubes and shear layers (also called vortex sheets) are linked to rigid-body rotation and shear. Here, $L_f$ falls within intermediate scales, specifically greater than $100\eta$, and is expected to lie in the inertial subrange.

The analysis of the instantaneous distribution of rigid-body rotation and shear, along with the PDFs of their intensities, $\tilde {I}_S$ and $\tilde {I}_R$, at the scale of $L_f$ reveals that rigid-body rotation exhibits more spatial intermittency compared to shearing motion. Shearing motion is present almost everywhere in turbulence, whereas most flow regions exhibit negligible rigid-body rotation. As the scale $L_f$ increases, the mean intensities of rigid-body rotation and shear decrease, following power laws with exponents close to the Kolmogorov scaling $L_f^{-1/3}$ for the inertial subrange. Additionally, the moments of velocity increments caused by shear and rigid-body rotation, defined through their intensities as $\tilde {I}_SL_f$ and $\tilde {I}_RL_f$, are investigated across various scales. The moments of the velocity increment due to shear, $\overline {(\tilde {I}_SL_f)^{n}}$, obey power laws of $L_f$, denoted as $\overline {(\tilde {I}_SL_f)^{n}}\sim L_f^{p}$. This analysis reveals anomalous scaling for the shear intensity, where the exponent $p(n)$ is smaller than the Kolmogorov scaling $p=n/3$ for larger values of $n$. This deviation from the Kolmogorov scaling aligns quantitatively with that observed for the longitudinal structure function, suggesting that the velocity increment between two points is influenced predominantly by shearing motion with the scale of two-point distance. The moments of the velocity increment attributable to rigid-body rotation, $\overline {(\tilde {I}_RL_f)^{n}}$, also follow power laws, albeit over a narrower range compared to shear. The exponent for $\overline {(\tilde {I}_RL_f)^{n}}\sim L_f^{p}$ deviates more significantly from $n/3$ than that of shear. This larger deviation is consistent with the more intermittent distributions of rigid-body rotation observed in the flow.

The mean flow structure associated with shearing motion was explored further through conditional averages around regions with locally intense shear. In these analyses, the shear layer manifests between parallel mean flows in opposite directions. The observed shear layer exhibits an aspect ratio of approximately 4.5 and is found in proximity to rotational motions, characteristic of vortex tubes. The aspect ratio of the shear layer, and the configuration of these vortices at intermediate scales, align with those of small-scale shear layers at the Kolmogorov scale. The mean shear layer pattern remains consistent when scaled with the filter length, suggesting self-similar structures of shearing motion across different scales. A comparison between turbulence and random velocity has indicated that the self-similar shear layers at different scales arise from the kinematic nature of multi-scale velocity fluctuations. The mean velocity jump $\Delta u$ across the shear layer increases with the layer thickness $\delta _S$. This increase aligns well with the Kolmogorov scaling, as denoted in (4.1), leading to similar power laws for the time scale and Reynolds number of shear layers, as given in (4.2) and (4.3). Although these power laws are based on the Kolmogorov scaling within the inertial subrange, their extension to smaller scales effectively predicts the characteristics of small-scale shear layers.

The scaling exponents of shear intensity underscore the significance of shearing motion at intermediate scales, which may surpass rigid-body rotation in influencing some scale-dependent turbulence properties. These motions are manifested as vortex tubes and shear layers. Numerous efforts have been made to model turbulence by conceptualising it as being composed of spatially distributed simple structures (Townsend Reference Townsend1976; Lundgren Reference Lundgren1993; Marusic & Monty Reference Marusic and Monty2019). Notably, a simple model of small-scale shear layers, based on the mean flow pattern observed directly for small-scale shearing motion within turbulent flows, has successfully elucidated the response of turbulence to small-scale perturbations (Watanabe & Nagata Reference Watanabe and Nagata2023). The self-similarity observed in the shear layers offers an advantage in constructing models of these layers at various scales. The mean flow structure of shearing motion and its scaling properties, revealed in this study, hold the potential for enhancing our understanding of turbulent flows in the context of flow structures.

Acknowledgements

Numerical simulations presented in this paper were performed using the high-performance computing systems at the Japan Agency for Marine-Earth Science and Technology and Nagoya University. This work was also supported by the Collaborative Research Project on Computer Science with High-Performance Computing in Nagoya University.

Funding

This work was supported by JSPS KAKENHI grant nos 22K03903 and 22H01398.

Declaration of interests

The authors report no conflict of interest.

Data availability statement

The data that support the findings of this study are available from the corresponding author upon reasonable request.

Appendix A. Comparison of the triple decomposition between two- and three-dimensional velocity gradient tensors

The present study has analysed the two-dimensional velocity gradient measured by PIV. The triple decomposition is used to extract three motions from two-dimensional planes even though turbulence involves three-dimensional fluid motions. This appendix investigates the discrepancies in the triple decomposition between two-dimensional (2-D) and three-dimensional (3-D) velocity gradient tensors using the DNS database of homogeneous isotropic turbulence, the same database utilised previously in Watanabe et al. (Reference Watanabe, Tanaka and Nagata2020) and Watanabe & Nagata (Reference Watanabe and Nagata2023). The DNS were conducted using an in-house finite difference code, which applies a fourth-order fully conservative finite difference scheme and a third-order Runge–Kutta method (Morinishi et al. Reference Morinishi, Lund, Vasilyev and Moin1998). The statistically steady state was achieved through a linear forcing scheme (Carroll & Blanquart Reference Carroll and Blanquart2013). The turbulent Reynolds number is $Re_\lambda =202$, and the simulation uses $2048^3$ grid points.

The triple decomposition is applied to the low-pass filtered 3-D velocity gradient tensor $(\boldsymbol {\nabla } \tilde {\boldsymbol {u}})_{ij}$, where $i,j=1, 2, 3$, resulting in $\boldsymbol {\nabla } \tilde {\boldsymbol {u}}_S$, $\boldsymbol {\nabla } \tilde {\boldsymbol {u}}_R$ and $\boldsymbol {\nabla } \tilde {\boldsymbol {u}}_E$. A 3-D Gaussian filter with filter length $L_f$ is employed in wavenumber space, as described by Pope (Reference Pope2000). The algorithm for triple decomposition follows Nagata et al. (Reference Nagata, Watanabe, Nagata and da Silva2020b). Similarly, the triple decomposition of the 2-D filtered velocity gradient tensor described in § 3.2 is applied to the same DNS database. Both analyses provide flow statistics as functions of the filter length $L_f$.

Figure 18 visualises 2-D distributions of $\tilde {I}_R$ and $\tilde {I}_S$ derived from the 3-D triple decomposition. A highly intermittent distribution of $\tilde {I}_R$ is observed, with values close to zero across most of the flow, while shear dominates a significant portion of the flow. This predominance of shear over rigid-body rotation aligns with findings from the triple decomposition of fully resolved velocity gradient tensors (Das & Girimaji Reference Das and Girimaji2020; Nagata et al. Reference Nagata, Watanabe, Nagata and da Silva2020b; Hayashi et al. Reference Hayashi, Watanabe and Nagata2021a). Additionally, this tendency is also evident in the triple decomposition applied to 2-D planes, as shown in figure 6.

Figure 18. Two-dimensional distributions of the intensities of (a) rigid-body rotation and (b) shear, evaluated using the 3-D triple decomposition for filter length $L_f/\eta =30$ in DNS.

Figure 19(a) compares the 2-D and 3-D triple decompositions regarding the $L_f$ dependence of the mean intensities of shear and rigid-body rotation, $\overline {\tilde {I}_S}$ and $\overline {\tilde {I}_R}$. Both decompositions yield a similar trend: $\overline {\tilde {I}_S}$ and $\overline {\tilde {I}_R}$ decrease with $L_f$ at a comparable rate. The mean intensities for the 2-D decomposition are smaller than those for the 3-D case. This discrepancy arises because the 2-D decomposition considers only motions defined on an examined plane. The shear component of the velocity gradient tensor for the 2-D case can be expressed in a basic reference frame as

(A1)\begin{equation} \boldsymbol{\nabla} \tilde{\boldsymbol{u}}_S= \begin{pmatrix} 0 & a \\ 0 & 0 \end{pmatrix}. \end{equation}

For the 3-D case, $\boldsymbol {\nabla } \tilde {\boldsymbol {u}}_S$ in a basic reference frame is written as

(A2)\begin{equation} \boldsymbol{\nabla} \tilde{\boldsymbol{u}}_S= \begin{pmatrix} 0 & a & b \\ 0 & 0 & c \\ 0 & 0 & 0 \end{pmatrix}. \end{equation}

It should be noted that other forms are possible as long as $\boldsymbol {\nabla } \tilde {\boldsymbol {u}}_S$ remains purely asymmetric (Kolář & Šístek Reference Kolář and Šístek2014). The shear intensity is $\tilde {I}_S=\sqrt {2}\,a$ for the 2-D case, and $\tilde {I}_S=\sqrt {2(a^2+b^2+c^2)}$ for the 3-D case, suggesting that the shear intensity is inherently smaller on a 2-D plane, which does not account for two of the three non-zero components. This explanation also holds true for the intensity of rigid-body rotation. As all non-zero components in $\boldsymbol {\nabla } \tilde {\boldsymbol {u}}_S$ are statistically identical in isotropic turbulence, it can be expected that the average of $\tilde {I}_S$ in the 3-D decomposition is about $\sqrt {3}$ times larger than that in the 2-D case. Here, $\sqrt {3}$ for the mean intensities is not the exact value derived theoretically. Figure 19(b) presents the compensated plots, where $\tilde {I}_S$ and $\tilde {I}_R$ for the 2-D case are multiplied by $\sqrt {3}$. The compensated intensities align with their 3-D counterparts. Thus the discrepancy between the 2-D and 3-D decompositions in figure 19(a) is attributed to the out-of-plane components of the velocity gradient tensor. Despite the difference by a factor of $\sqrt {3}$, the $L_f$ dependence remains consistent for both 2-D and 3-D decompositions. Therefore, evaluating the scale dependence of shear and rigid-body rotation on 2-D planes still provides valuable insights into local turbulent motions considered in the triple decomposition.

Figure 19. (a) The scale dependence of the mean intensities of shear and rigid-body rotation, $\overline {\tilde {I}_S}$ and $\overline {\tilde {I}_R}$, evaluated using 2-D and 3-D triple decompositions applied to DNS data of homogeneous isotropic turbulence. (b) Plots of $\overline {\tilde {I}_S}$ and $\overline {\tilde {I}_R}$, multiplied by $\sqrt {3}$ in the 2-D case to account for the underestimation due to dimensionality reduction.

Figure 20(a) presents the third- and fifth-order moments of the velocity increments due to shear, $\tilde {I}_SL_f$, evaluated using the 2-D and 3-D triple decompositions. Similar to the mean shear intensity, the 2-D decomposition underestimates the higher-order moments of $\tilde {I}_SL_f$. However, the $L_f$ dependence is consistent between the 2-D and 3-D decompositions, suggesting that the scaling exponents in $\overline {(\tilde {I}_SL_f)^n} \sim L_f^{p(n)}$ are also similar for both cases. A direct evaluation of $p$ using a least squares method on the plots of $\overline {(\tilde {I}_SL_f)^n}$ is unsuitable because the Reynolds number is not sufficiently high in the DNS. The scaling exponents of structure functions at moderate Reynolds numbers are often estimated with the extended self-similarity (ESS) method (Benzi et al. Reference Benzi, Ciliberto, Tripiccione, Baudet, Massaioli and Succi1993; Saw et al. Reference Saw, Debue, Kuzzay, Daviaud and Dubrulle2018; Matsushima, Nagata & Watanabe Reference Matsushima, Nagata and Watanabe2021), which determines the scaling exponents for $n \neq 3$ by plotting the $n$th-order structure functions against the third-order structure function. This study applies the ESS method to the $n$th-order moments of $\tilde {I}_SL_f$ to determine the scaling exponents. Although previous studies have shown that scaling exponents estimated with ESS align with those measured directly in experiments, it has also been argued that the ESS method can yield inaccurate estimations due to low-Reynolds-number effects on the third-order structure function (Tang et al. Reference Tang, Antonia, Djenidi, Danaila and Zhou2017). Here, the ESS method is utilised solely to compare the scaling exponents of $\overline {(\tilde {I}_SL_f)^n}$ between the 2-D and 3-D triple decompositions, and is not intended to provide exact values for the exponents. In addition, the discussion is limited to shearing motion here because power laws are not observed for high-order moments of $\tilde {I}_{R}L_f$ with the ESS method for both the 2-D and 3-D cases. Figure 20(b) displays the scaling exponents of $\overline {(\tilde {I}_SL_f)^n} \sim L_f^{p(n)}$, estimated using the ESS method. The exponents are evaluated for $20 \leq L_f/\eta \leq 100$. Both the 2-D and 3-D decompositions yield identical scaling exponents, indicating that they are unlikely to be affected by out-of-plane motions not captured on 2-D planes. These exponents are also consistent with those observed in the current experiments and those derived from longitudinal structure functions, as shown in figure 10.

Figure 20. (a) The scale dependence of the third- and fifth-order moments of the velocity increments due to shear, $\tilde {I}_SL_f$, evaluated using 2-D and 3-D triple decompositions applied to DNS data. (b) The power-law exponents $p$ for the $n$th-order moments of $\tilde {I}_SL_f$. These exponents are evaluated using the extended self-similarity method.

The conditional statistics of shear layers are compared between the 2-D and 3-D triple decompositions. In both cases, the centre of shear layers is identified as a local maximum of $\tilde {I}_S$ where $\tilde {I}_S \geq 2\overline {\tilde {I}_S}$. For the 3-D analysis, the shear coordinate $(\zeta _1, \zeta _2, \zeta _3)$ is defined using the methodology described in Hayashi et al. (Reference Hayashi, Watanabe and Nagata2021a). The filtered velocity vector in the shear coordinate is represented as $(\tilde {u}_1^{(s)}, \tilde {u}_2^{(s)}, \tilde {u}_3^{(s)})$. Here, the direction of $\zeta _3$ aligns with the direction of the shear vorticity vector ${\tilde {\omega }}_{Si} = \epsilon _{ijk}(\boldsymbol {\nabla } \tilde {\boldsymbol {u}}_S)_{jk}$ and is given by ${\tilde {\boldsymbol {\omega }}}_S/|\tilde {\boldsymbol {\omega }}_S|$. The orthogonal directions $\zeta _1$ and $\zeta _2$ are determined such that shear is represented by $\partial \tilde {u}_1^{(s)}/\partial \zeta _2$. Details of the numerical algorithm for determining the shear coordinate are available in Hayashi et al. (Reference Hayashi, Watanabe and Nagata2021a). Flow variables defined at computational grid points in DNS are interpolated onto the shear coordinate system. The discretisation and interpolation methods used are consistent with those described in § 3.3. The analysis with the 2-D triple decomposition, as outlined in § 3.3, is also conducted using DNS data for comparison. The filter length $L_f$ is set at $L_f/\eta =60$, although the following discussion remains valid regardless of the chosen $L_f$.

Figure 21(a) compares the mean shear vorticity in the $\zeta _3$ direction, $\langle \tilde {\omega }_{S3}^{(s)} \rangle$, plotted against $\zeta _2$ across the centre of the shear layer at $(\zeta _1, \zeta _3) = (0, 0)$. The corresponding plots obtained from the experiments are presented in figure 13(a). Both 2-D and 3-D decompositions effectively capture the prominent peak in shear vorticity within the shear layers. The layer thickness, estimated by the mean shear vorticity, is similar for both decompositions. However, consistent with observations for the mean shear intensity in figure 19, the mean shear vorticity within the shear layer is underestimated by the 2-D triple decomposition. The peak value of $\langle \tilde {\omega }_{S3}^{(s)} \rangle$ in the 3-D case is $0.32 \tau _\eta ^{-1}$, approximately $\sqrt {3}$ times greater than that in the 2-D decomposition, which is $0.18 \tau _\eta ^{-1}$. This indicates that the effect of evaluating shear in 2-D planes is consistent across both conditional and unconditional averages.

Figure 21. Conditional statistics of shear layers obtained using 2-D and 3-D triple decompositions in DNS of isotropic turbulence: (a) mean shear vorticity, and (b) mean velocity at $L_f/\eta =60$. Indices 1 and 2 of vectors denote the parallel and normal directions to the shear layers, respectively, while 3 represents the direction of shear vorticity at the centre of the shear layers.

Figure 21(b) compares the conditional average of velocity components in the $\zeta _1$ and $\zeta _2$ directions. The experimental results are also presented in figure 13(a). Due to the presence of shear, $\tilde {u}_1^{(s)}$ displays a velocity jump within the shear layer. The mean velocity jump, evaluated using the mean layer thickness as defined in § 4.3, is $13.2u_\eta$ in the 3-D decomposition, approximately $\sqrt {3}$ times larger than $7.1u_\eta$ observed in the 2-D case. This discrepancy indicates that analyses conducted on 2-D planes underestimate the mean velocity jump by a factor of approximately $\sqrt {3}$. While the mean velocity in the layer parallel direction, $\langle \tilde {u}_1^{(s)}\rangle$, is similar for both 2-D and 3-D decompositions, a qualitative difference is observed in the velocity in the layer normal direction, $\tilde {u}_2^{(s)}$. In the 3-D decomposition, $\langle \tilde {u}_2^{(s)}\rangle$ displays positive and negative values around $\zeta _2=0$. This profile suggests that the shear layer experiences compression, indicated by $\partial \tilde {u}_2^{(s)}/\partial \zeta _2 <0$. This compression is also characteristic of small-scale shear layers and is related to an expanding flow in the direction of shear vorticity, contributing to vortex stretching (Watanabe et al. Reference Watanabe, Tanaka and Nagata2020). The presence of straining flows with both compression and expansion highlights a 3-D feature of shear layers. Consequently, the 2-D triple decomposition fails to capture this compressive flow in the $\zeta _2$ direction, as evidenced by $\langle \tilde {u}_2^{(s)}\rangle \approx 0$.

Appendix B. Generation of multi-scale, random and solenoidal velocity

This appendix details the generation of random velocity fields used in the comparative analysis with genuine turbulence to investigate the kinematic aspects of shear layers. The procedure follows the method described by Johnsen et al. (Reference Johnsen2010): velocity vectors in the physical domain, $\boldsymbol {u} = (u, v, w)$, are generated by applying the inverse Fourier transform to their counterparts in the wavenumber domain, $\hat {\boldsymbol {u}} = (\hat {u}, \hat {v}, \hat {w})$. These solenoidal velocity vectors $(\hat {u}, \hat {v}, \hat {w})$ possess a predefined 3-D energy spectrum $E(k)$ and random phase components. The formula for the velocity vector components is

(B1)\begin{equation} \hat{\boldsymbol{u}}(k_x, k_y, k_z) = \left( \frac{k_y}{k_{xy}}\,a + \frac{k_xk_z}{k_{xy}k}\,b, \frac{k_yk_z}{k_{xy}k}\,b - \frac{k_x}{k_{xy}}\,a, -\frac{k_{xy}}{k}\,b \right),\end{equation}

with

(B2a,b)\begin{equation} a = \sqrt{\frac{2E(k)}{4{\rm \pi} k^2}}\, {\rm e}^{{\rm i}\phi_x}\cos (\phi_z), \quad b = \sqrt{\frac{2E(k)}{4{\rm \pi} k^2}}\, {\rm e}^{{\rm i}\phi_y}\cos (\phi_z). \end{equation}

In this expression, $\phi _\alpha (k_x, k_y, k_z)$ ($\alpha = x$, $y$ or $z$) is a random phase between 0 and $2{\rm \pi}$. The wavenumber vector is $(k_x, k_y, k_z)$, with $k_{xy} = \sqrt {k_x^2 + k_y^2}$ and $k = \sqrt {k_x^2 + k_y^2 + k_z^2}$. After specifying $E(k)$ based on a model spectrum or DNS of turbulence, the components $(\hat {u}, \hat {v}, \hat {w})$ are calculated using (B1) by assigning random values to $\phi _x$, $\phi _y$ and $\phi _z$. Performing the inverse Fourier transform of these components yields a random solenoidal velocity field consistent with the chosen energy spectrum. In this study, $E(k)$ is derived from the DNS database of forced homogeneous isotropic turbulence at $Re_\lambda = 128$, as detailed in Watanabe et al. (Reference Watanabe, Tanaka and Nagata2020).

The present study examines 10 random velocity fields, each generated using distinct sets of random numbers for the phase assignments. These random velocity fields are discretised using $1024^3$ grid points, identical to the grid resolution in the original DNS where the energy spectrum was determined. Ensemble averages across these random velocity fields result in a turbulent Reynolds number $Re_\lambda =128$. Visualisations of shear and rigid-body rotation at the smallest scale in these random velocity fields were presented in Watanabe & Nagata (Reference Watanabe and Nagata2022).

References

Akao, T., Watanabe, T. & Nagata, K. 2022 Vertical confinement effects on a fully developed turbulent shear layer. Phys. Fluids 34 (5), 055129.10.1063/5.0090686CrossRefGoogle Scholar
Arneodo, A., et al. 1996 Structure functions in turbulence, in various flow configurations, at Reynolds number between 30 and 5000, using extended self-similarity. Europhys. Lett. 34 (6), 411.10.1209/epl/i1996-00472-2CrossRefGoogle Scholar
Bailey, S.C.C., et al. 2013 Obtaining accurate mean velocity measurements in high Reynolds number turbulent boundary layers using Pitot tubes. J. Fluid Mech. 715, 642670.10.1017/jfm.2012.538CrossRefGoogle Scholar
Benzi, R., Ciliberto, S., Tripiccione, R., Baudet, C., Massaioli, F. & Succi, S. 1993 Extended self-similarity in turbulent flows. Phys. Rev. E 48 (1), R29.10.1103/PhysRevE.48.R29CrossRefGoogle ScholarPubMed
Bermejo-Moreno, I., Pullin, D.I. & Horiuti, K. 2009 Geometry of enstrophy and dissipation, grid resolution effects and proximity issues in turbulence. J. Fluid Mech. 620, 121166.10.1017/S002211200800476XCrossRefGoogle Scholar
Betchov, R. & Szewczyk, A. 1963 Stability of a shear layer between parallel streams. Phys. Fluids 6 (10), 13911396.CrossRefGoogle Scholar
Buaria, D. & Sreenivasan, K.R. 2023 Saturation and multifractality of Lagrangian and Eulerian scaling exponents in three-dimensional turbulence. Phys. Rev. Lett. 131 (20), 204001.10.1103/PhysRevLett.131.204001CrossRefGoogle Scholar
Carroll, P.L. & Blanquart, G. 2013 A proposed modification to Lundgren's physical space velocity forcing method for isotropic turbulence. Phys. Fluids 25 (10), 105114.CrossRefGoogle Scholar
Castaing, B., Gagne, Y. & Hopfinger, E.J. 1990 Velocity probability density functions of high Reynolds number turbulence. Physica D 46 (2), 177200.10.1016/0167-2789(90)90035-NCrossRefGoogle Scholar
Cattafesta, L.N. III & Sheplak, M. 2011 Actuators for active flow control. Annu. Rev. Fluid Mech. 43, 247272.CrossRefGoogle Scholar
Clemens, N.T. & Mungal, M.G. 1991 A planar Mie scattering technique for visualizing supersonic mixing flows. Exp. Fluids 11 (2–3), 175185.10.1007/BF00190296CrossRefGoogle Scholar
Coriton, B., Steinberg, A.M. & Frank, J.H. 2014 High-speed tomographic PIV and OH PLIF measurements in turbulent reactive flows. Exp. Fluids 55, 120.10.1007/s00348-014-1743-3CrossRefGoogle Scholar
Das, R. & Girimaji, S.S. 2020 Revisiting turbulence small-scale behavior using velocity gradient triple decomposition. New J. Phys. 22 (6), 063015.10.1088/1367-2630/ab8ab2CrossRefGoogle Scholar
Davidson, P.A. 2004 Turbulence: An Introduction for Scientists and Engineers. Oxford University Press.Google Scholar
Dhruva, B., Tsuji, Y. & Sreenivasan, K.R. 1997 Transverse structure functions in high-Reynolds-number turbulence. Phys. Rev. E 56 (5), R4928.10.1103/PhysRevE.56.R4928CrossRefGoogle Scholar
Eisma, J., Westerweel, J., Ooms, G. & Elsinga, G.E. 2015 Interfaces and internal layers in a turbulent boundary layer. Phys. Fluids 27 (5), 055103.10.1063/1.4919909CrossRefGoogle Scholar
Elsinga, G.E., Ishihara, T., Goudar, M.V., da Silva, C.B. & Hunt, J.C.R. 2017 The scaling of straining motions in homogeneous isotropic turbulence. J. Fluid Mech. 829, 3164.10.1017/jfm.2017.538CrossRefGoogle Scholar
Elsinga, G.E. & Marusic, I. 2010 Universal aspects of small-scale motions in turbulence. J. Fluid Mech. 662, 514539.10.1017/S0022112010003381CrossRefGoogle Scholar
Elsinga, G.E. & Marusic, I. 2016 The anisotropic structure of turbulence and its energy spectrum. Phys. Fluids 28 (1), 011701.10.1063/1.4939471CrossRefGoogle Scholar
Enoki, R., Watanabe, T. & Nagata, K. 2023 Statistical properties of shear and nonshear velocity components in isotropic turbulence and turbulent jets. Phys. Rev. Fluids 8 (10), 104602.10.1103/PhysRevFluids.8.104602CrossRefGoogle Scholar
Fiscaletti, D., Buxton, O.R.H. & Attili, A. 2021 Internal layers in turbulent free-shear flows. Phys. Rev. Fluids 6 (3), 034612.10.1103/PhysRevFluids.6.034612CrossRefGoogle Scholar
Frisch, U., Sulem, P.-L. & Nelkin, M. 1978 A simple dynamical model of intermittent fully developed turbulence. J. Fluid Mech. 87 (4), 719736.10.1017/S0022112078001846CrossRefGoogle Scholar
Ganapathisubramani, B., Lakshminarasimhan, K. & Clemens, N.T. 2008 Investigation of three-dimensional structure of fine scales in a turbulent jet by using cinematographic stereoscopic particle image velocimetry. J. Fluid Mech. 598, 141175.10.1017/S0022112007009706CrossRefGoogle Scholar
Gauding, M., Bode, M., Brahami, Y., Varea, É. & Danaila, L. 2021 Self-similarity of turbulent jet flows with internal and external intermittency. J. Fluid Mech. 919, A41.10.1017/jfm.2021.399CrossRefGoogle Scholar
Ghira, A.A., Elsinga, G.E. & da Silva, C.B. 2022 Characteristics of the intense vorticity structures in isotropic turbulence at high Reynolds numbers. Phys. Rev. Fluids 7 (10), 104605.CrossRefGoogle Scholar
Goto, S., Saito, Y. & Kawahara, G. 2017 Hierarchy of antiparallel vortex tubes in spatially periodic turbulence at high Reynolds numbers. Phys. Rev. Fluids 2 (6), 064603.CrossRefGoogle Scholar
Gotoh, T., Fukayama, D. & Nakano, T. 2002 Velocity field statistics in homogeneous steady turbulence obtained using a high-resolution direct numerical simulation. Phys. Fluids 14 (3), 10651081.10.1063/1.1448296CrossRefGoogle Scholar
Goudar, M.V. & Elsinga, G.E. 2018 Tracer particle dispersion around elementary flow patterns. J. Fluid Mech. 843, 872897.CrossRefGoogle Scholar
Hayashi, M., Watanabe, T. & Nagata, K. 2021 a Characteristics of small-scale shear layers in a temporally evolving turbulent planar jet. J. Fluid Mech. 920, A38.CrossRefGoogle Scholar
Hayashi, M., Watanabe, T. & Nagata, K. 2021 b The relation between shearing motions and the turbulent/non-turbulent interface in a turbulent planar jet. Phys. Fluids 33 (5), 055126.CrossRefGoogle Scholar
Hirota, M., Nishio, Y., Izawa, S. & Fukunishi, Y. 2017 Vortex stretching in a homogeneous isotropic turbulence. J. Phys.: Conf. Ser. 822 (1), 012041.Google Scholar
Isaza, J.C., Salazar, R. & Warhaft, Z. 2014 On grid-generated turbulence in the near- and far field regions. J. Fluid Mech. 753, 402426.CrossRefGoogle Scholar
Iyer, K.P., Sreenivasan, K.R. & Yeung, P.K. 2020 Scaling exponents saturate in three-dimensional isotropic turbulence. Phys. Rev. Fluids 5 (5), 054605.CrossRefGoogle Scholar
Jiménez, J., Wray, A.A., Saffman, P.G. & Rogallo, R.S. 1993 The structure of intense vorticity in isotropic turbulence. J. Fluid Mech. 255, 6590.CrossRefGoogle Scholar
Johnsen, E., et al. 2010 Assessment of high-resolution methods for numerical simulations of compressible turbulence with shock waves. J. Comput. Phys. 229 (4), 12131237.10.1016/j.jcp.2009.10.028CrossRefGoogle Scholar
Kailasnath, P., Sreenivasan, K.R. & Stolovitzky, G. 1992 Probability density of velocity increments in turbulent flows. Phys. Rev. Lett. 68 (18), 2766.10.1103/PhysRevLett.68.2766CrossRefGoogle ScholarPubMed
Kang, S.-J., Tanahashi, M. & Miyauchi, T. 2007 Dynamics of fine scale eddy clusters in turbulent channel flows. J. Turbul. 8, N52.10.1080/14685240701528544CrossRefGoogle Scholar
Keylock, C.J. 2018 The Schur decomposition of the velocity gradient tensor for turbulent flows. J. Fluid Mech. 848, 876905.CrossRefGoogle Scholar
Kistler, A.L. & Vrebalovich, T. 1966 Grid turbulence at large Reynolds numbers. J. Fluid Mech. 26 (1), 3747.CrossRefGoogle Scholar
Kitamura, T., Nagata, K., Sakai, Y., Sasoh, A., Terashima, O., Saito, H. & Harasaki, T. 2014 On invariants in grid turbulence at moderate Reynolds numbers. J. Fluid Mech. 738, 378406.10.1017/jfm.2013.595CrossRefGoogle Scholar
Kolář, V. 2007 Vortex identification: new requirements and limitations. Intl J. Heat Fluid Flow 28 (4), 638652.10.1016/j.ijheatfluidflow.2007.03.004CrossRefGoogle Scholar
Kolář, V. & Šístek, J. 2014 Recent progress in explicit shear-eliminating vortex identification. In Proceedings of the 19th Australasian Fluid Mechanics Conference. Australasian Fluid Mechanics Society Australia.Google Scholar
Kolmogorov, A.N. 1941 The local structure of turbulence in incompressible viscous fluid for very large Reynolds numbers. Dokl. Akad. Nauk SSSR 30, 299303.Google Scholar
Kolmogorov, A.N. 1962 A refinement of previous hypotheses concerning the local structure of turbulence in a viscous incompressible fluid at high Reynolds number. J. Fluid Mech. 13 (1), 8285.CrossRefGoogle Scholar
Kouchi, T., Fukuda, S., Miyai, S., Nagata, Y. & Yanase, S. 2019 Acetone-condensation nano-particle image velocimetry in a supersonic boundary layer. In AIAA Scitech 2019 Forum, p. 1821. American Institute of Aeronautics and Astronautics.10.2514/6.2019-1821CrossRefGoogle Scholar
Krogstad, P.-Å. & Davidson, P.A. 2012 Near-field investigation of turbulence produced by multi-scale grids. Phys. Fluids 24 (3), 035103.CrossRefGoogle Scholar
Kronborg, J. & Hoffman, J. 2023 The triple decomposition of the velocity gradient tensor as a standardized real Schur form. Phys. Fluids 35 (3), 031703.CrossRefGoogle Scholar
Leung, T., Swaminathan, N. & Davidson, P.A. 2012 Geometry and interaction of structures in homogeneous isotropic turbulence. J. Fluid Mech. 710, 453481.CrossRefGoogle Scholar
Lin, S.J. & Corcos, G.M. 1984 The mixing layer: deterministic models of a turbulent flow. Part 3. The effect of plane strain on the dynamics of streamwise vortices. J. Fluid Mech. 141, 139178.CrossRefGoogle Scholar
Liu, C., Gao, Y., Tian, S. & Dong, X. 2018 Rortex – a new vortex vector definition and vorticity tensor and vector decompositions. Phys. Fluids 30 (3), 035103.CrossRefGoogle Scholar
Lundgren, T.S. 1993 A small-scale turbulence model. Phys. Fluids 5 (6), 14721483.CrossRefGoogle Scholar
Marusic, I. & Monty, J.P. 2019 Attached eddy model of wall turbulence. Annu. Rev. Fluid Mech. 51, 4974.10.1146/annurev-fluid-010518-040427CrossRefGoogle Scholar
Matsuda, K., Schneider, K. & Yoshimatsu, K. 2021 Scale-dependent statistics of inertial particle distribution in high Reynolds number turbulence. Phys. Rev. Fluids 6 (6), 064304.CrossRefGoogle Scholar
Matsushima, T., Nagata, K. & Watanabe, T. 2021 Wavelet analysis of shearless turbulent mixing layer. Phys. Fluids 33 (2), 025109.CrossRefGoogle Scholar
Melina, G., Bruce, P.J.K. & Vassilicos, J.C. 2016 Vortex shedding effects in grid-generated turbulence. Phys. Rev. Fluids 1 (4), 044402.CrossRefGoogle Scholar
Mohamed, M.S. & Larue, J.C. 1990 The decay power law in grid-generated turbulence. J. Fluid Mech. 219, 195214.10.1017/S0022112090002919CrossRefGoogle Scholar
Mori, T., Watanabe, T. & Nagata, K. 2024 Nearly homogeneous and isotropic turbulence generated by the interaction of supersonic jets. Exp. Fluids 65 (4), 47.CrossRefGoogle Scholar
Morinishi, Y., Lund, T.S., Vasilyev, O.V. & Moin, P. 1998 Fully conservative higher order finite difference schemes for incompressible flow. J. Comput. Phys. 143 (1), 90124.CrossRefGoogle Scholar
Mouri, H., Hori, A. & Kawashima, Y. 2007 Laboratory experiments for intense vortical structures in turbulence velocity fields. Phys. Fluids 19 (5), 055101.10.1063/1.2720827CrossRefGoogle Scholar
Nagata, K., Saiki, T., Sakai, Y., Ito, Y. & Iwano, K. 2017 Effects of grid geometry on non-equilibrium dissipation in grid turbulence. Phys. Fluids 29 (1), 015102.CrossRefGoogle Scholar
Nagata, R., Watanabe, T., Nagata, K. & da Silva, C.B. 2020 b Triple decomposition of velocity gradient tensor in homogeneous isotropic turbulence. Comput. Fluids 198, 104389.CrossRefGoogle Scholar
Nagata, T., Noguchi, A., Kusama, K., Nonomura, T., Komuro, A., Ando, A. & Asai, K. 2020 a Experimental investigation on compressible flow over a circular cylinder at Reynolds number of between 1000 and 5000. J. Fluid Mech. 893, A13.CrossRefGoogle Scholar
Naso, A. & Pumir, A. 2005 Scale dependence of the coarse-grained velocity derivative tensor structure in turbulence. Phys. Rev. E 72 (5), 056318.10.1103/PhysRevE.72.056318CrossRefGoogle ScholarPubMed
Neamtu-Halic, M.M., Mollicone, J.-P., Van Reeuwijk, M. & Holzner, M. 2021 Role of vortical structures for enstrophy and scalar transport in flows with and without stable stratification. J. Turbul. 22 (7), 393412.CrossRefGoogle Scholar
Nieuwstadt, F.T., Westerweel, J. & Boersma, B. 2016 Introduction to Theory and Applications of Turbulent Flows. Springer.CrossRefGoogle Scholar
Pack, D.C. 1950 A note on Prandtl's formula for the wave-length of a supersonic gas jet. Q. J. Mech. Appl. Maths 3 (2), 173181.CrossRefGoogle Scholar
Perry, A.E. & Chong, M.S. 1994 Topology of flow patterns in vortex motions and turbulence. Appl. Sci. Res. 53, 357374.10.1007/BF00849110CrossRefGoogle Scholar
Pirozzoli, S., Bernardini, M. & Grasso, F. 2010 On the dynamical relevance of coherent vortical structures in turbulent boundary layers. J. Fluid Mech. 648, 325349.CrossRefGoogle Scholar
Pizzaia, A. & Rossmann, T. 2018 Effect of boundary layer thickness on transverse sonic jet mixing in a supersonic turbulent crossflow. Phys. Fluids 30 (11), 115104.CrossRefGoogle Scholar
Pope, S.B. 2000 Turbulent Flows. Cambridge University Press.CrossRefGoogle Scholar
Rabey, P.K., Wynn, A. & Buxton, O.R.H. 2015 The kinematics of the reduced velocity gradient tensor in a fully developed turbulent free shear flow. J. Fluid Mech. 767, 627658.CrossRefGoogle Scholar
Saddoughi, S.G. & Veeravalli, S.V. 1994 Local isotropy in turbulent boundary layers at high Reynolds number. J. Fluid Mech. 268, 333372.10.1017/S0022112094001370CrossRefGoogle Scholar
Sakurai, Y. & Ishihara, T. 2018 Relationships between small-scale fluid motions and inertial particle clustering in turbulence. J. Phys. Soc. Japan 87 (9), 093401.CrossRefGoogle Scholar
Saw, E.-W., Debue, P., Kuzzay, D., Daviaud, F. & Dubrulle, B. 2018 On the universality of anomalous scaling exponents of structure functions in turbulent flows. J. Fluid Mech. 837, 657669.CrossRefGoogle Scholar
She, Z.-S. & Leveque, E. 1994 Universal scaling laws in fully developed turbulence. Phys. Rev. Lett. 72 (3), 336.CrossRefGoogle ScholarPubMed
Shtilman, L., Spector, M. & Tsinober, A. 1993 On some kinematic versus dynamic properties of homogeneous turbulence. J. Fluid Mech. 247, 6577.CrossRefGoogle Scholar
da Silva, C.B., Dos Reis, R.J.N. & Pereira, J.C.F. 2011 The intense vorticity structures near the turbulent/non-turbulent interface in a jet. J. Fluid Mech. 685, 165190.CrossRefGoogle Scholar
Sreenivasan, K.R. & Antonia, R.A. 1997 The phenomenology of small-scale turbulence. Annu. Rev. Fluid Mech. 29 (1), 435472.CrossRefGoogle Scholar
Takamure, K., Kato, H. & Uchiyama, T. 2023 Wake characteristics of sphere with circular uniaxial through-hole arranged perpendicularly to streamwise direction. Powder Technol. 415, 118175.CrossRefGoogle Scholar
Tan, S., Xu, X., Qi, Y. & Ni, R. 2023 Scalings and decay of homogeneous, nearly isotropic turbulence behind a jet array. Phys. Rev. Fluids 8 (2), 024603.CrossRefGoogle Scholar
Tang, S.L., Antonia, R.A., Djenidi, L., Danaila, L. & Zhou, Y. 2017 Finite Reynolds number effect on the scaling range behaviour of turbulent longitudinal velocity structure functions. J. Fluid Mech. 820, 341369.CrossRefGoogle Scholar
Theunissen, R. 2010 Adaptive image interrogation for PIV: application to compressible flows and interfaces. PhD thesis, Delft University of Technology.Google Scholar
Thormann, A. & Meneveau, C. 2014 Decay of homogeneous, nearly isotropic turbulence behind active fractal grids. Phys. Fluids 26, 025112.CrossRefGoogle Scholar
Townsend, A.A. 1976 The Structure of Turbulent Shear Flow. Cambridge University Press.Google Scholar
Tsinober, A. 2009 An Informal Conceptual Introduction to Turbulence. Springer.CrossRefGoogle Scholar
Vincent, A. & Meneguzzi, M. 1994 The dynamics of vorticity tubes in homogeneous turbulence. J. Fluid Mech. 258, 245254.CrossRefGoogle Scholar
Wang, Y., Gao, Y. & Liu, C. 2018 Galilean invariance of Rortex. Phys. Fluids 30 (11), 111701.CrossRefGoogle Scholar
Watanabe, T. 2024 Efficient enhancement of turbulent entrainment by small-scale shear instability. J. Fluid Mech. 988, A20.CrossRefGoogle Scholar
Watanabe, T., Jaulino, R., Taveira, R.R., da Silva, C.B., Nagata, K. & Sakai, Y. 2017 Role of an isolated eddy near the turbulent/non-turbulent interface layer. Phys. Rev. Fluids 2 (9), 094607.CrossRefGoogle Scholar
Watanabe, T. & Nagata, K. 2018 Integral invariants and decay of temporally developing grid turbulence. Phys. Fluids 30 (10), 105111.CrossRefGoogle Scholar
Watanabe, T. & Nagata, K. 2022 Energetics and vortex structures near small-scale shear layers in turbulence. Phys. Fluids 34 (9), 095114.CrossRefGoogle Scholar
Watanabe, T. & Nagata, K. 2023 The response of small-scale shear layers to perturbations in turbulence. J. Fluid Mech. 963, A31.CrossRefGoogle Scholar
Watanabe, T., Riley, J.J., Nagata, K., Onishi, R. & Matsuda, K. 2018 A localized turbulent mixing layer in a uniformly stratified environment. J. Fluid Mech. 849, 245276.CrossRefGoogle Scholar
Watanabe, T., Tanaka, K. & Nagata, K. 2020 Characteristics of shearing motions in incompressible isotropic turbulence. Phys. Rev. Fluids 5 (7), 072601(R).CrossRefGoogle Scholar
Westerweel, J. & Scarano, F. 2005 Universal outlier detection for PIV data. Exp. Fluids 39 (6), 10961100.10.1007/s00348-005-0016-6CrossRefGoogle Scholar
Zheng, Y., Nagata, K. & Watanabe, T. 2021 Turbulent characteristics and energy transfer in the far field of active-grid turbulence. Phy. Fluids 33 (11), 115119.CrossRefGoogle Scholar
Figure 0

Figure 1. A schematic of a multiple-jet wind tunnel (Mori et al.2024). All dimensions are in mm.

Figure 1

Figure 2. (a) Measurement locations for PIV. (b) An example of velocity fluctuation vectors $\boldsymbol {u}'=(u',v')$ measured by PIV. The colour represents the magnitude of the vectors, $|\boldsymbol {u}'|$.

Figure 2

Figure 3. Vertical profiles of (a) mean velocity and (b) turbulence intensity at $x=0.465$ m and $x=0.605$ m.

Figure 3

Figure 4. The decay properties of turbulence generated by the jet interaction measured in Mori et al. (2024): (a) turbulent kinetic energy per unit mass, $k_T=(\overline {{u'}^2}+2\overline {{v'}^2})/2$; and (b) Taylor microscale, Kolmogorov scale and turbulent Reynolds number. A power law $k_T=a_k(x-x_0)^{-n_k}$ is compared with the measured data in (a).

Figure 4

Figure 5. Normalised longitudinal energy spectra of streamwise and vertical velocities, $E_u(k_x)$ and $E_v(k_y)$, measured at $x=0.605$m, where $k_x$ and $k_y$ represent the wavenumbers in the $x$ and $y$ directions, respectively. For comparison, the figure also includes energy spectra from direct numerical simulations (DNS) of homogeneous isotropic turbulence (HIT) with $Re_\lambda =202$ (Watanabe & Nagata 2023) and from experiments of passive-grid turbulence with $Re_\lambda =520$ (Kistler & Vrebalovich 1966), a boundary layer with $Re_\lambda =1450$ (Saddoughi & Veeravalli 1994; Nieuwstadt, Westerweel & Boersma 2016), and active-grid turbulence with $Re_\lambda =241$ (Zheng, Nagata & Watanabe 2021).

Figure 5

Table 1. Summary of turbulence characteristics: the turbulent Reynolds number $Re_\lambda$, the characteristic velocity scale of large-scale motions ${\mathcal {U}}=\sqrt {2k_T/3}$, the Kolmogorov velocity scale $u_\eta$, the integral scale $L_u$, the Taylor microscale $\lambda$, the Kolmogorov scale $\eta$, the spatial resolution of PIV $\varDelta$, the integral time scale $T=L_u/{\mathcal {U}}$, and the Kolmogorov time scale $\tau _\eta$.

Figure 6

Figure 6. Distributions of the intensities of (a) rigid-body rotation $\tilde {I}_R$, and (b) shear $\tilde {I}_S$ in a filtered velocity field with filter length $L_f/\eta =343$.

Figure 7

Figure 7. Scale dependence of the mean intensities of shear and rigid-body rotation, $\overline {\tilde {I}_S}$ and $\overline {\tilde {I}_R}$. The DNS results of isotropic turbulence are shown for comparison (Watanabe & Nagata 2023).

Figure 8

Figure 8. The PDFs of the intensities of shear, $\tilde {I}_S$, and rigid-body rotation, $\tilde {I}_R$, of filtered velocity fields in (a) linear and (b) logarithmic scales. The results are presented for the PIV data measured at $x=0.360$ m.

Figure 9

Figure 9. Scale dependence of (a) third-order and (b) fifth-order moments of the velocity increments due to shear, $\tilde {I}_SL_f$, and rigid-body rotation, $\tilde {I}_RL_f$. The solid lines indicate the Kolmogorov scaling.

Figure 10

Figure 10. The power law exponents $p$ for the $n$th-order moments of the velocity increments due to shear, $\tilde {I}_SL_f$, and rigid-body rotation, $\tilde {I}_RL_f$, at $x=0.360$ m.

Figure 11

Figure 11. The mean shear intensity $\langle \tilde {I}_S\rangle$ and mean velocity vectors $(\langle \tilde {u}^{(s)}_1\rangle$, $\langle \tilde {u}^{(s)}_2\rangle )$ around locally intense shear regions of filtered velocity fields at filter lengths (a) $L_f/\eta =343$ and (b) $L_f/\eta =458$. The vector lengths indicate the velocity magnitude. The coordinate is normalised by the Kolmogorov scale $\eta$. The results are shown for $x=0.360$ m and $C_{th}=2$.

Figure 12

Figure 12. The distribution of mean vorticity of rigid-body rotation $\langle \tilde {\omega }_{R}^{(s)}\rangle$ near the shear layers at filter lengths (a) $L_f/\eta =343$ and (b) $L_f/\eta =458$. The white solid line is the isoline of mean shear intensity $\langle \tilde {I}_S\rangle =1.5\overline {\tilde {I}_S}$, indicating the shear layer location. The results are shown for $x=0.360$ m and $C_{th}=2$. The arrows illustrate the orientation of vortical motions.

Figure 13

Figure 13. (a) The mean shear vorticity $\langle \tilde {\omega }_{S}^{(s)}\rangle$ and the mean velocity in the $\zeta _1$ direction, $\langle \tilde {u}^{(s)}_1\rangle$, across the shear layer at $\zeta _1=0$ in filtered velocity fields at filter length $L_f/\eta =343$. (b) The scale dependence of the mean shear vorticity normalised by the maximum value. The results are shown for $x=0.360$ m.

Figure 14

Figure 14. The same plots as in figure 13 obtained for random velocity: (a) the mean shear vorticity and mean velocity for $L_f/\eta =30$; (b) the mean shear vorticity normalised by its peak value.

Figure 15

Figure 15. The scale dependence of the shear layer thickness $\delta _S$ estimated as the half-width of the mean shear vorticity. The line indicates $\delta _S=0.79L_f$ obtained with a least squares method.

Figure 16

Figure 16. (a) The scale dependence of the mean velocity jump $\Delta u$ across the shear layer. (b) The compensated plots of $\Delta u$ normalised by $(\varepsilon \delta _S)^{1/3}$. Symbols are the same as in figure 15.

Figure 17

Figure 17. The scale dependence of the shear Reynolds number. The results are presented for $C_{th}=1.5$.

Figure 18

Figure 18. Two-dimensional distributions of the intensities of (a) rigid-body rotation and (b) shear, evaluated using the 3-D triple decomposition for filter length $L_f/\eta =30$ in DNS.

Figure 19

Figure 19. (a) The scale dependence of the mean intensities of shear and rigid-body rotation, $\overline {\tilde {I}_S}$ and $\overline {\tilde {I}_R}$, evaluated using 2-D and 3-D triple decompositions applied to DNS data of homogeneous isotropic turbulence. (b) Plots of $\overline {\tilde {I}_S}$ and $\overline {\tilde {I}_R}$, multiplied by $\sqrt {3}$ in the 2-D case to account for the underestimation due to dimensionality reduction.

Figure 20

Figure 20. (a) The scale dependence of the third- and fifth-order moments of the velocity increments due to shear, $\tilde {I}_SL_f$, evaluated using 2-D and 3-D triple decompositions applied to DNS data. (b) The power-law exponents $p$ for the $n$th-order moments of $\tilde {I}_SL_f$. These exponents are evaluated using the extended self-similarity method.

Figure 21

Figure 21. Conditional statistics of shear layers obtained using 2-D and 3-D triple decompositions in DNS of isotropic turbulence: (a) mean shear vorticity, and (b) mean velocity at $L_f/\eta =60$. Indices 1 and 2 of vectors denote the parallel and normal directions to the shear layers, respectively, while 3 represents the direction of shear vorticity at the centre of the shear layers.