1. Introduction
In the last two decades, horizontal drilling and extended-reach horizontal drilling have become ubiquitous. In oil and gas production, horizontal drilling allows several advantages including much greater access to the reservoir and hence higher production rates. Extended-reach horizontal wells have been drilled to more than 15 km. More recently, engineered geothermal systems have been proposed where parallel horizontal wells are drilled and connected to construct an aerial closed heat exchanger. Carbon capture and sequestration (CCS) also requires drilling operations. In all horizontal or high-angle drilling, although there are benefits, one of the continuing technical challenges is complete removal of the drilled rock cuttings to the surface.
In a drilling operation, drilling fluid is pumped down the drill pipe to the drill where it exits through nozzles in the drill bit. Here there are number of functions required of the fluid, but a key task is to carry the rock cuttings away from the bit, along the annulus between the drill pipe and the rock formation, all the way to the surface. At the surface, the cuttings are separated from the drilling fluid, which is then recirculated to the drill bit. In a long horizontal or near-horizontal section, despite the fluid flow, the cuttings will sediment to form a bed on the lower side of the wellbore, and this bed then moves slowly via saltation. Formation of such a bed impedes the drilling process through friction with the drill pipe and through constriction of the flow path. If allowed to further build, when the drill bit is pulled out of the well, it can become stuck (IADC 2015). Hence, understanding the removal of the cuttings bed and/or ensuring no buildup of material in the well, either through choice of process or through control of drilling-fluid properties, has received and continues to receive considerable attention both experimentally and theoretically (Philip, Sharma & Chenevert Reference Philip, Sharma and Chenevert1998; Ozbayoglu et al. Reference Ozbayoglu, Saasen, Sorgun and Svanes2008; Chin & Zhuang Reference Chin and Zhuang2011; Erge & van Oort Reference Erge and van Oort2020; Huque et al. Reference Huque, Butt, Zendehboudi and Imtiaz2020, Reference Huque, Rahman, Zendehboudi, Butt and Imtiaz2021; Pandya, Ahmed & Shah Reference Pandya, Ahmed and Shah2020). One aspect of the process known to considerably improve cuttings transport is application of drill pipe rotation (Ozbayoglu et al. Reference Ozbayoglu, Saasen, Sorgun and Svanes2008), and several rules-of-thumb exist. Whereas considerable progress in understanding cuttings transport has been made, there is still much to learn.
For the length of a well, the cuttings flow is along the annulus between the drill pipe and the rock formation or between the drill pipe and liner. In both cases, the outer wall is fixed and the inner wall (the drill pipe) can, and typically does, rotate. Recommended rotation rates for cuttings transport (IADC 2015) (hole cleaning) depend on the size of the drill pipe and wellbore as well as the superficial flow velocity. An example best practice would be that for a hole size of 15.24 cm (6 inch) at the furthest reaches of the well, a rotation rate of >100 rpm should be maintained. For this configuration, making reasonable assumptions for the fluid viscosity and density, this equates to a Taylor number (i.e. the ratio of the centrifugal force to the viscous force) Ta > 100. The drilling configuration is thus a Taylor–Couette flow with superimposed axial flow. Here we wish to gain physical insight, via detailed modelling, into the balance of material and process parameters that cause particles to be mobilised into the flow such that the axial flow can carry them forward.
Taylor–Couette flow and associated instabilities have been extensively studied in recent decades due to the extremely rich instabilities both observed and understood. Indeed, the flow has been referred to as ‘the hydrogen atom’ of fluid dynamics (Tagg Reference Tagg1994; Fardin, Perge & Taberlet Reference Fardin, Perge and Taberlet2014). Pioneering work in this geometry, without instability, was carried out by Couette (Reference Couette1888) and Mallock (Reference Mallock1889), who derived an analytical solution for the flow between concentric cylinders. Taylor (Reference Taylor1923) showed that beyond a critical rotation speed, by adding a small perturbation, a nonlinear distribution of the main flow field with pairs of steady secondary flows replaces the previous rectilinear distribution. The new flow, called Taylor–Couette flow, with the Taylor vortices present, is steady until the flow reaches a large Taylor number, at which point the flow transitions to an unsteady ‘wavy vortex’ flow, presumably indicating the presence of non-axisymmetric azimuthal instabilities. In a later study, Gollub & Swinney (Reference Gollub and Swinney1975) investigated the onset of turbulence in a rotating fluid. Here it was observed that, as the rotation rate increases, the flow field oscillates and twists and finally becomes turbulent.
For our practical situation described above, it should be expected that such high rotation speeds will mean that the inertial force along with the curvature of streamlines will lead to the presence of Taylor vortices (Taylor Reference Taylor1923) and that this could potentially play an important role for the cuttings transport problem. In such flow conditions, transport could be affected via both inter-vortex and intra-vortex mixing process, as has been previously studied by Dusting & Balabani (Reference Dusting and Balabani2009). More recently, attention has been focussed on the interaction of particles with the base flow (Majji & Morris Reference Majji and Morris2018; Baroudi, Majji & Morris Reference Baroudi, Majji and Morris2020; Gillissen et al. Reference Gillissen, Cagney, Lacassagne, Papadopoulou, Balabani and Wilson2020). In the work by Majji & Morris (Reference Majji and Morris2018), the inertial migration of dilute, neutrally buoyant particles with a volume fraction of ${\phi _{avg}} = 0.1\,\%$ in different flow regimes was investigated (including circular Couette flow (CCF), Taylor vortex flow (TVF) and wavy vortex flow (WVF)). The work by Baroudi et al. (Reference Baroudi, Majji and Morris2020) extended the experimental analysis to study the influence of inertia on migration of neutrally buoyant particles with a higher particle volume fraction of ${\phi _{avg}} = 10\,\%$ in circulate Couette flow and in the presence of Taylor vortices. In their experiments, it was shown that migration leads to particles decorating Taylor vortices in a ring-like structure. The resulting structure was explained as a competition between interaction with the walls and drift in the complex shear gradient, due to Taylor vortices, finally resulting in a limit cycle for position. Furthermore, more recent studies (Majji, Banerjee & Morris Reference Majji, Banerjee and Morris2018; Baroudi et al. Reference Baroudi, Majji, Peluso and Morris2023) have shown that particles significantly impact the qualitative nature of the Taylor–Couette flow dynamical system.
In simple flow conditions, an effective driving force for particle migration may be introduced: the particle pressure. This scalar quantity, which is analogous to the osmotic pressure in a solution, appears in Morris’ formulation for a suspension of non-Brownian spheres (Yurkovetsky & Morris Reference Yurkovetsky and Morris2008; Deboeuf et al. Reference Deboeuf, Gauthier, Martin, Yurkovetsky and Morris2009; Miller, Singh & Morris Reference Miller, Singh and Morris2009). Singh et al. (Reference Singh, Mari, Denn and Morris2018) found numerically that particle pressure roughly scales with N 1−N 2 (with N 1, N 2 the first and second normal stress differences, respectively). N 1−N 2 is proportional to the measured normal force in a parallel-plate geometry and hence is experimentally accessible for rectilinear flow conditions. Although gradients in the isotropic particle pressure may be a driving force for particle migration (Yurkovetsky & Morris Reference Yurkovetsky and Morris2008; Deboeuf et al. Reference Deboeuf, Gauthier, Martin, Yurkovetsky and Morris2009; Miller et al. Reference Miller, Singh and Morris2009), they are not a true substitute for material normal stress differences that may be observed for such mixtures (Guazzelli & Pouliquen Reference Guazzelli and Pouliquen2018; Maklad & Poole Reference Maklad and Poole2021). It is the latter that affect the mechanics in a shear flow. Miller et al. (Reference Miller, Singh and Morris2009) extended the previous studies by introducing an anisotropic formulation of the particle pressure that may be used to mimic the effect of true normal stress differences. It is now understood that inclusion of isotropic or anisotropic particle pressure (Miller et al. Reference Miller, Singh and Morris2009) is sufficient to successfully capture some of the important aspects of particle migration in rectilinear flows (Inkson et al. Reference Inkson, Papoulias, Tandon, Reddy and Lo2017). The numerical study by Kang & Mirbod (Reference Kang and Mirbod2021) used an Eulerian suspension balance model (SBM), introduced by Nott & Brady (Reference Nott and Brady1994) and later by Morris & Brady (Reference Morris and Brady1998), to investigate particle transport. Within this construction, which included normal forces via the anisotropic particle pressure definition, it was shown that for complex flows including Taylor vortices, the particles migrated to the centre of the vortices, in contrast to observations by Majji & Morris (Reference Majji and Morris2018).
In this study, we investigate the migration of particles in a complex flow field and elucidate the role of various force contributions. We have chosen to model and measure the flow within a horizontal Couette geometry exhibiting Taylor vortices in the presence of dense, gravitationally settling particles. We will show that although the particle pressure is required, the effect of lift forces play a critical role and without which the experimental observations cannot be captured numerically. To capture these forces, we require the relative velocity of the continuous and disperse phases, and so solve a separate momentum equation for each. The lift forces arise due to the shear gradient of the base flow in the inertial regime (i.e. the Saffman lift force; Saffman Reference Saffman1965, Reference Saffman1968) and due to the rotation of the particles, i.e. the Magnus force (Rubinow & Keller Reference Rubinow and Keller1961). We describe a transient Eulerian-Eulerian model formulation and test its reliability by comparing its predictions with a series of experimental observations. Our experiments show, and our model captures: (i) a redistribution of the particle bed with a distinctive twin-peaked trailing edge prior to re-suspension; (ii) a mixing parameter describing the resuspension of particles; (iii) particle decoration of the Taylor vortices in agreement with Majji & Morris (Reference Majji and Morris2018); (iv) a delayed transition from Taylor vortices to wavy Taylor vortices; and, in contrast to the neutrally buoyant case (Majji & Morris Reference Majji and Morris2018), (v) persistence of the decoration of the vortices into the wavy regime. In addition, we find a previously unreported novel period doubling instability of the particle bed structure (Appendix A). Although our model hints at reproducing this, the calculation requires excessive time to properly capture, so we have not pursued the comparison here.
The remainder of this paper is organised as follows. In § 2, we describe our model formulation and present the mathematical description of both the Saffman force and the Magnus force within an Eulerian framework. In § 3, we describe our bespoke flow-loop and X-ray shadowgraph system, and in § 4, we describe selected experimental results. In § 5, we present our numerical predictions and compare these with our experiments. Finally, in § 6, we provide some discussion of our results and conclude.
2. An Eulerian-Eulerian solver: SCRFoam
Here we describe the mathematical detail of a two-phase, i.e. solid and fluid, flow solver developed within OpenFOAM. There are a range of approaches that could have been chosen to describe the interaction of solid cuttings with a fluid phase in such modelling. Here, consistent with the application we have in mind, it is assumed that the ratio of the average cuttings size to a reference length of the geometry is reasonably small, $\delta \ll 1$, so that a continuum approximation is valid for the solid phase. Within the drilling context described above, there will be instances where this approximation will be invalid; however, we exclude those conditions from our scope here.
Among Eulerian approaches to study suspension flows, there exist in the rheological literature two constructs of particular interest. In the first, originally proposed by Miller et al. (Reference Miller, Singh and Morris2009), the suspension is modelled as a mixture using complex fluid properties. Here, to model the migration of particles relative to the bulk motion, a particle flux induced by the variation of the particle normal stresses was suggested. Several representations of the frame invariant forms of the model have been investigated, i.e. by either including isotropic normal stresses (particle pressure) or by including normal stress differences. In this model, the conservation of momentum is solved only for a mixture phase. Therefore, both the fluid and solid phases move at the same velocity within a computational cell (the mixture velocity), so that any forces arising through the relative velocity of the two phases, including drag and lift forces, are by construction removed. In a second approach, whilst retaining the mixture model, the relative velocity of the two phases is non-zero, i.e. ‘slip’ is allowed between the two phases. Although using this approach makes the investigation computationally more expensive (conservation of momentum is solved for each phase separately), this would allow one to investigate the effect of other physics and forces which were missing in the other technique (Nott & Brady Reference Nott and Brady1994) arising through the relative velocity of the two phases. Here, we choose to implement the second approach, i.e. instead of viewing the problem as the average flow of a ‘mixture’ together with no-slip between the phases, we will consider the phases separately so that the vectoral nature of the relative velocity is captured. This allows us to include and investigate the importance of specific forces, including drag, lift and gravity, on particle transport and migration.
2.1. The governing equations in the fluid phase
The fundamental Eulerian-Eulerian, or mixture model, approach has been widely used (Drew Reference Drew1983, Reference Drew1993; Subia et al. Reference Subia, Ingber, Mondy, Altobelli and Graham1998; Rao et al. Reference Rao, Mondy, Sun and Steve2002; Dbouk et al. Reference Dbouk, Lemaire, Lobry and Moukalled2013; Mirbod Reference Mirbod2016; Rebouças et al. Reference Rebouças, Siqueira, de Souza Mendes and Carvalho2016; Inkson et al. Reference Inkson, Papoulias, Tandon, Reddy and Lo2017). Here, we merely outline the governing equations, and focus on our formulation differences and extensions. A two-phase continuum model is implemented to simulate the transport of a continuous solid phase in a carrier Newtonian fluid. As is common, we assume the particles to be non-Brownian, mono-disperse and spherical. The relevant dimensionless parameters used in this study are
where d is the diameter of the spherical particles; H the gap size between the concentric cylinders defined as $H = {R_o} - {R_i}$ with ${R_i}$ and ${R_o}$ being the inner and outer cylinder radii, respectively; $\omega $ the rotation speed of the inner cylinder; ${t^\ast }$ dimensional time; ${\boldsymbol{u}^\ast }$ the dimensional velocity vector; ${p^\ast }$ the dimensional pressure; $\eta $ the viscosity of the Newtonian fluid; ${\boldsymbol{\sigma }^\mathrm{\ast }}$ the dimensional stress tensor; $Re$ the Reynolds number measuring the ratio between inertial and viscous forces; ${\rho ^f},{\rho ^s}$ the fluid and solid densities; $Fr$ a Froude number characterising the ratio of inertial force to gravitational force; g gravitational acceleration; $\gamma $ the density ratio of the solid and fluid particles; and $Ta$ the Taylor number characterising the importance of centrifugal force, relative to viscous force. At the onset of Taylor vortices, ${\lambda ^\ast }$ is their dimensional axial period. Note, in this article, superscripts f and s are used to refer to the fluid and solid phases, respectively, for each parameter.
Using the inertial force density ${\rho ^f}{({R_i}\omega )^2}/H$ as a reference, the dimensionless form of the governing equations for the fluid phase are
where (2.2) and (2.3) represent the conservation of mass and momentum, respectively. In this analysis, $\phi $ is the particle volume fraction (i.e. $\phi = {v_s}/{v_t}$, where ${v_s} = n{\textstyle{4 \over {24}}}{\rm \pi}{d^3}$ is the volume of spherical particles with n being the number of particles and ${v_t}$ is the total volume of mixture), $|\boldsymbol{g}|= g$ is the magnitude of the gravitational force and the total fluid stress ${\boldsymbol{\sigma }^f} ={-} {p^f}\boldsymbol{I} + {\boldsymbol{\tau }^f}$, where ${\boldsymbol{\tau }^f} = (\boldsymbol{\nabla }{\boldsymbol{u}^{\boldsymbol{f}}} + \boldsymbol{\nabla }{\boldsymbol{u}^{{\boldsymbol{f}^T}}})$ is the Newtonian fluid phase stress. Additionally, $\boldsymbol{F}$ is the interphase force exerted by the fluid on the particles and is discussed in § 2.3.
2.2. The governing equations in the solid phase
As with the fluid phase, the governing equations in the solid phase can be written in the form of conservation of mass and momentum as follows:
As with the fluid phase, we keep gravitational forces. Here, the particle stress tensor ${\boldsymbol{\sigma }^p}$ has been split into an isotropic part, particle pressure ${p^p}$ shown in (2.8) (Morris & Boulay Reference Morris and Boulay1999) and a deviatoric part ${\boldsymbol{\tau }^p}$ as shown in (2.7) (Krieger Reference Krieger1972; Dbouk et al. Reference Dbouk, Lemaire, Lobry and Moukalled2013). Following advances in suspension rheology, these combine to enable calculation of the particle stress tensor ${\boldsymbol{\sigma }^p}$:
with ${\phi _m}$ the maximum volume fraction (0.64 for random close-packed spheres) and ${\dot{\boldsymbol{\gamma }}^p}$ is the local bulk suspension rate of strain. One should note that some of the quantities appearing in (2.2)–(2.5) are phase-averaged quantities.
To solve the governing equations presented in (2.2)−(2.9), a new in-house solver has been developed within OpenFOAM (which we name ‘SCRFoam’). The coupling between the pressure and velocities of the fluid and solid phases is obtained based on a revised version of the PC-SIMPLE (Vasquez Reference Vasquez2000) algorithm and the SIMPLE-C algorithm (Van Doormaal & Raithby Reference Van Doormaal and Raithby1984) (hence, SCRFoam is Simple-C Revised Foam). The discussion relating to this method goes beyond the scope of the current manuscript so the details will be deferred for discussed in a separate article.
2.3. Interphase force
In this work, the force density $\boldsymbol{F}$ exerted by the liquid on the solid is split into a component due to the Archimedes effect ${\boldsymbol{F}_A}$, and forces due to the relative velocity of the two phases including drag ${\boldsymbol{F}_D}$, lift due to the shear gradient of the base flow in the inertial regime ${\boldsymbol{F}_{Saff}}$ and lift due to rotation of the particles ${\boldsymbol{F}_{Mag}}$ as follows:
2.3.1. Archimedes force
Following Jackson (Reference Jackson2000) and Chiodi, Claudin & Andreotti (Reference Chiodi, Claudin and Andreotti2014), the dimensionless form of the Archimedes force is
2.3.2. Drag force
Following the works by Chiodi et al. (Reference Chiodi, Claudin and Andreotti2014) and Ferguson & Church (Reference Ferguson and Church2004), the drag force acting on the particles in a direction parallel to their motion relative to the liquid is represented as
where ${\boldsymbol{u}_{\boldsymbol{r}}} = {\boldsymbol{u}^{\boldsymbol{f}}} - {\boldsymbol{u}^{\boldsymbol{p}}}$ is the relative velocity between the fluid and particles. The particle Reynolds number is defined as $R{e_p} = {\rho ^f}|{\boldsymbol{u}_{\boldsymbol{r}}}|d/\eta $. To capture the transition from viscous to inertial drag, the drag coefficient is written as (Ferguson & Church Reference Ferguson and Church2004; Chiodi et al. Reference Chiodi, Claudin and Andreotti2014)
Both ${C_\infty }$ and s a priori depend on concentration $\phi $ of particles. However, for the sake of simplicity, we neglect this dependence and use $s = \sqrt {24} $, as in the dilute limit. Similarly, we will take a constant asymptotic drag coefficient ${C_\infty }$ equal to 0.44 as previously suggested by Derksen (Reference Derksen2003). Here, $f(\phi )$ is a hindrance function, for example the Richardson–Zaki expression (Richardson & Zaki Reference Richardson and Zaki1997), and is defined as
Note that in the limit $R{e_p} \to 0$, (2.14) recovers (hindered) Stokes drag as ${C_d}(R{e_p}) \to (1/f(\phi ))(24/R{e_p})$. The expression for Stokes drag can be recovered from the definition of ${C_d}$, ${F_D} = {\textstyle{1 \over 2}}{\rho ^f}|{u_f}|{u_f}{C_d}A$, where A is the particle surface area (assumed spherical).
2.3.3. Lift due to the Saffman force
Particle migration has been studied widely (Bretherton Reference Bretherton1962; Goldsmith & Mason Reference Goldsmith and Mason1962; Segre & Silberberg Reference Segre and Silberberg1962a,Reference Segre and Silberbergb). The pioneering theoretical work by Saffman (Reference Saffman1965, Reference Saffman1968) showed that a single sphere moving with a relative velocity through an inertial flow within a background uniform simple shear will experience a lift force where the ‘scalar’ magnitude of this force was calculated to be $6.46 {({\eta ^f}{\rho ^f})^{0.5}}|{\boldsymbol{u}_{\boldsymbol{r}}}|{(d/2)^2}|\boldsymbol{\nabla } \times {\boldsymbol{u}^f}{|^{0.5}}$. This force is induced by the vorticity of the background fluid across a particle, such that the higher velocity on top of the particle contributes to decreasing the pressure, whilst the higher pressure at the bottom of the particle (on the side of ‘smaller’ velocity) drives the particle ‘upward’.
It is conventional to decompose the force exerted on a particle moving with a relative velocity in a fluid into two orthogonal components: a component of the force parallel to the relative flow direction known as the drag force (as discussed in § 2.3.2) and a component that is perpendicular to the drag force known as lift. Since the relative velocity ${\boldsymbol{u}_r}$ was used to obtain the direction of the drag force in (2.12), we recognise that the lift forces should appear in the $({\boldsymbol{u}_{\boldsymbol{r}}}/|{\boldsymbol{u}_{\boldsymbol{r}}}|) \times (\boldsymbol{\nabla } \times {\boldsymbol{u}_{\boldsymbol{r}}}/|\boldsymbol{\nabla } \times {\boldsymbol{u}_{\boldsymbol{r}}}|)$ direction (i.e. in a direction perpendicular to both the relative velocity direction and its vorticity direction. Note the normalisation to define a unit vector). Now, using the definition of the particle volume fraction, the Saffman lift force per unit volume obtained using the single particle calculation of Saffman (Reference Saffman1965, Reference Saffman1968) may be defined in our Eulerian-Eulerian representation as
In Eulerian-Lagrangian frameworks, the importance of lift has been widely recognised (Rubinow & Keller Reference Rubinow and Keller1961; Derksen Reference Derksen2003; Kosinski & Hoffmann Reference Kosinski and Hoffmann2007). In contrast, in previous Eulerian-Eulerian studies, Saffman lift forces have generally been excluded (e.g. Chiodi et al. Reference Chiodi, Claudin and Andreotti2014; Inkson et al. Reference Inkson, Papoulias, Tandon, Reddy and Lo2017; Kang & Mirbod Reference Kang and Mirbod2021). Among studies where the lift force has been included (Derksen Reference Derksen2003; ANSYS, Inc. 2009; Ibrahim & Meguid Reference Ibrahim and Meguid2020), although the drag force was introduced in the direction of relative velocity, the lift force was introduced in a direction perpendicular to the relative velocity direction and the fluid vorticity (and not the relative velocity vorticity as was used in (2.15)). Using such a definition, the Saffman lift force $\boldsymbol{F}_{\boldsymbol{Saff}}^\angle $ in Eulerian-Eulerian framework would be defined as (e.g. ANSYS, Inc. 2009)
We acknowledge that in simple flow conditions where the fluid and particle are moving in the same direction, ${\boldsymbol{F}_{\boldsymbol{Saff}}}$ ((2.15)) and $\boldsymbol{F}_{\boldsymbol{Saff}}^\angle $ ((2.16)) are in fact identical. In §§ 4–6, we compare these two implementations of lift forces for our problem and discuss the observed difference in more detail.
2.3.4. Lift due to Magnus force
The Magnus force is developed by a pressure differential on the surface of the particle resulting from a velocity differential due to rotation of the particle. Similar to the Saffman force, using the definition of the particle volume fraction, the Magnus lift force per unit volume obtained for the single-particle calculation of Rubinow & Keller (Reference Rubinow and Keller1961) may be defined within the Eulerian representation as
To the best of the authors’ knowledge, although the Magnus force has been previously formulated within Lagrangian-Eulerian models (Derksen Reference Derksen2003; Kosinski & Hoffmann Reference Kosinski and Hoffmann2007), it has not been previously formulated in any Eulerian-Eulerian framework as we present here.
2.4. Numerical domain
A schematic of the Couette geometry used in our numerical simulation is shown in figure 1. The geometry consists of two horizontal concentric cylinders. The inner cylinder has cone-shaped ends, which will generate Eckman vortices (Pfister & Rehberg Reference Pfister and Rehberg1981; Ahlers & Cannell Reference Ahlers and Cannell1983; Lücke, Mihelcic & Wingerath Reference Lücke, Mihelcic and Wingerath1985). The Eckman vortices provide a ‘soft’ boundary such that the flow field away from the cones can adjust to find a ‘correct’ axial periodicity despite the constraints imposed by axial periodic boundary conditions.
The inner cylinder is rotated with angular speed $\omega $, and the outer cylinder is stationary. Here it is assumed that the solid-phase velocity at the inner wall is subject to a no-slip boundary condition, and hence moves with the fluid phase at the same rotation speed at the wall. We acknowledge that although this may be an optimal choice among the available boundary conditions for rotating walls within the OpenFOAM platform, due to the use of a ‘smooth’ surface in our experiment, it might not physically match the experimental condition for the solid phase. At the stationary outer cylinder wall, a zero-velocity no-slip condition is assumed for both phases. The velocities of the fluid and solid phase at the inner cylinder wall are simulated using a rotatingWallVelocity boundary condition type defined in OpenFOAM. For pressure, a fixedFluxPressure type has been used, which guarantees a correct flux for both fluid and particles in the presence of gravitational acceleration (i.e. no flux through the walls). The zero-gradient boundary condition (i.e. zeroGradient type in OpenFOAM) for the particle volume fraction at the wall boundaries is used. To ensure the particles do not leave the geometry from the axial faces, a cyclic (i.e. cyclic type in OpenFOAM) boundary condition has been used.
3. Experimental
3.1. Materials and flow-cell
Experiments were performed with either aqueous glycerol solutions or tap-water (discussed in Appendices A and B). Although temperature was not specifically controlled, the ambient laboratory temperature was maintained at approximately 22 °C. An aqueous glycerol solution of 71.5 wt% (with corresponding density 1196 kg m−3) was chosen to give a nominal viscosity of 20 mPa s; however, varying experimental conditions caused slight variation about this value. Hence, for each experiment, the actual viscosity of the solution in the experimental section was sampled and measured directly, and is reported below. We chose for our systematic series of experiments glass ballotini beads with size between 425 μm and 600 μm (Sigma Aldrich G9268-250G). Glass has a density of 2500 kg m−3. We examined both dry and wet packs of the material and found a maximal packing fraction of 0.6 for a tapped pack of material either wet or dry. We weighed 10 ml of ballotini beads as 14.94 g; hence, ϕmax = 0.597. This corresponds reasonably to random loose packing for frictional spheres at 0.58. A slightly higher figure is to be expected from polydispersity.
The concentric cylinder section of our flow loop consists of a smooth Perspex rod with external diameter, 2Ri, of nominally 40 mm and a smooth Perspex pipe providing the outer wall with a nominal internal diameter, 2Ro, of 49.5 mm; hence, H/Ri = 0.2375 and the particle size relative to the annular gap is approximately 1/9.5. The centre body can be rotated at between approximately 20 rpm and 650 rpm whilst the outer wall is fixed. The internal Reynolds number, Re, is conventionally defined (Andereck, Liu & Swinney Reference Andereck, Liu and Swinney2006) as shown in (2.1). Hence, given our accessible rotation rate, for our aqueous glycerol, Re varies between approximately 11 and 380 with the corresponding Taylor number, Ta, varying between approximately 6 and 190 which allows us to investigate the particle transport problem in circular Couette, Taylor vortex and into wavy vortex regimes.
The rotating centre body is supported and driven from one end and is 270 mm in length giving the ratio of gap height and axial length of the set-up as 0.0176. The cell has a 200 mm transparent section. Particles are loaded over a 140 mm length approximately centred on the transparent section. A direct current motor is used to drive the centre rotation via a gearbox. Speed is controlled by voltage set using a programmable power supply. Actual rotation speed is measured using an optical encoder mounted on the Couette shaft and pulse counting via a National Instruments multifunction device. Thus, a chosen rotation sequence is set and measured under computer control.
3.2. Flow loop and imaging
Experiments were undertaken in a bespoke flow loop, figure 2. The pipework is constructed from 30 mm solvent-welded PVC pipe. The design encompasses a simple drop (particles load A) to allow introduction of a pack of wetted cuttings into the flow via gravity and whilst flow is running, thereby convecting the particles to the experimental section. There is a second load point along the Couette (particles load B) where an even distribution of particles may be introduced. On exit from the experimental section, the flow passes to a cyclone device, which separates the particles allowing them to fall to a collection point to be recovered. Thus, in principle, particles can be introduced and removed from the flow whilst maintaining the flow. For the experiments reported here, particles were loaded at point B to form a near-uniform bed at zero rotation and zero superficial flow over a length of the Couette.
The total volume of the slot used for loading particles at B is calculated as 5.55 cm3. The volume of the Couette for the 140 mm length of the slot is 92.6 cm3 so that a single full slot will give a particle volume fraction in the Couette over the 140 mm section of 3.6 % assuming our measured maximal packing (ϕ = 0.6) of the spheres in the loader slot and uniformly distributed particles in the Couette over the length of the loader. Thus, our initial loading, ϕave, is quantised in multiples of 3.6 %. Of course, our particles sediment so that the initial condition is a bed of particles at the lower side of the Couette.
Imaging is either optical (Basler acA1920-150uc), using a Nikon lens and simple mirror arrangement, or X-ray shadowgraphy with a Rex-Cell 1X system (Flow Capture AS, Norway). The X-ray source is aligned with the vertical centre of the flow-cell (figure 3a) so that, apart from parallax considerations, the image is a direct shadow of the particle distribution within the cell.
To provide a simple quantification of the particle distribution, we choose to define a mixing parameter, $\varLambda$, to characterise the degree to which particles are mixed during rotation. Here, $\varLambda$ will vary between 0, all particles at the bottom of the cell, and 1, particles distributed on average equally through the cell. Since X-ray adsorption at low concentration is expected to follow Beer's law, we may write
with I the measured intensity; I 0 the incident intensity; kw, kf, kp extinction coefficients for the wall material, the fluid and the particles, respectively; and xw 1, xf, xp, xw 2 the path length of the first wall, the fluid, the particles and the second wall, respectively, and as illustrated in figure 3(b) for a particular ray. Using the particle volume fraction, ϕ, and the total distance through the particle-fluid composition, xcomp, xf = (1 − ϕ)xcomp and xp = ϕ xcomp, and if we consider the image in comparison with an image of the fluid-filled Couette without particles, Iempty, then for each pixel,
and we then form
with suffixes top and bottom denoting symmetrically disposed image regions at the top and bottom of the cell. At zero or low rotation rates, the particles sediment to form a bank at the bottom of the cell and $\varLambda$ = 0. At sufficiently high rotation rates, we would expect the particles to be fully mixed so that there would be an equal volume fraction of particles at the top and bottom of the cell so that $\varLambda$ = 1.
4. Experimental results
We initially examine the particle distribution for a large concentration of particles in aqueous glycerol. The measurement is started with the cell completely full of aqueous glycerol, i.e. all bubbles are removed. We then add the particles for two different cases of half and one (wetted) volumes of the loading slot (ϕave = 1.8 % and ϕave = 3.6 %, respectively). Some further information at higher Ta (with lower viscosity) is presented in Appendix A. The centre body is rotated by hand so that any particles resting on its top surface are caused to fall and join the bed of particles at the lower wall of the cell. From this initial condition we, stepwise, increase the angular velocity of the centre over the desired range.
We quantify the degree to which the flow is capable of carrying the particles around the annulus by measuring the mixing parameter, $\varLambda$, plotted in figure 4(a). At low rotation rates, in the circular Couette flow regime, the particles all reside in a bed at the bottom of the cell ($\varLambda$ = 0), albeit once the flow field initiates Taylor vortices, some movement leading to redistribution is observed. At higher rotation rates, once the Taylor vortices are strong and well established, the drag and lift forces caused by the flow are sufficient to overcome gravity, and the particles are caried around the annulus. For the aqueous glycerol solution, the critical rotation rate is not dependent on the initial volume of particles, at least over the range examined $(1.8\,\%< {\phi _{avg}} < 3.6\,\%)$.
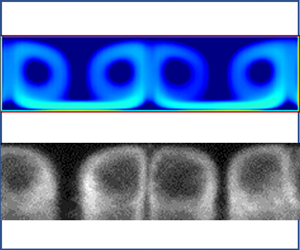
The evolution of particle distribution in aqueous glycerol is further assessed by generating a space-rotation plot from the X-ray image sequence. A line is taken from the midpoint of the image of the annular gap at the top (red) and bottom (blue) as indicated in figure 5(a). Ten images are averaged (10 × 10 ms exposure), and subsequent pixel lines are stacked. In the experiment, the rotation rate was incremented in steps of 20 rpm every 5 s. Hence, the horizontal axis is calibrated to rotation. The resulting plot of space (y-axis) versus rotation rate (x-axis) for the lower gap is shown in figure 5(b) and for the corresponding upper gap in figure 5(c). For this fluid, and in these images, particle bank formation is first clearly seen above approximately 170 rpm (Ta = 58), which is close to the expected onset of Taylor vortices and commensurate with the onset taking account of the narrower gap due to the particle bed. Thereafter, as speed is increased, the Taylor vortices are strong enough to regularise the interaction between the Taylor vortices and the particle bed along the axial direction, and this leads to a periodic distribution of solid particles at the bottom of the geometry. In figure 5(c) (top of the cell), particles are first seen at approximately 220 rpm (Ta = 75). Note that this value is slightly higher than that observed in figure 4 or figure 6 demonstrating, as can be discerned in figure 6, that the initial particles to pass around the annulus do not reach the upper centreline of the gap and so are not seen in figure 5, whereas they are seen in the orthogonal plane (figure 6) and the integration across the annulus (figure 4). In figure 5, the distribution away from the centre (position = 0 mm) is affected by imaging parallax; however, at the centre, we can see that the particles form a triplet of lines corresponding to the edges of two counter-rotating vortices and with the larger gap aligned with the bank of particles at the lower side. Initially, the particles are distributed as rings of diameter much less than the gap, but as rotation rate increases, the rings expand so that by approximately 350 rpm (Ta = 119), the observed lines are adjacent. In figure 6, the particle distribution projected onto a vertical plane, i.e. the background corrected shadowgraph, is shown as speed is increased. Here (and in figure 7), the mixing onset is at the same Ta as the lower concentrations and we choose to use a higher concentration to provide higher contrast images.
In figure 6(a), the redistribution of the bank at the bottom of the cell is clear. In addition, bright spots can be seen at the top of the cell indicating just a few particles being carried around the annulus. These though appear to be close to the inner Couette wall so are missed in the line section used for figure 5(c). In figure 6(c), distinct pairs of patches of particles are now seen at the top of the cell and are seen as a sharp onset in figure 5(c). As rotation is increased, the patches of particles expand to pairs of counter-rotating rings. As rotation is increased further, the rings expand and strengthen, and at 354 rpm (Ta = 120) (figure 6e), rings are also observed between the banks at the bottom of the cell. These observations are very similar to those reported by Majji et al. (Reference Majji, Banerjee and Morris2018), Majji & Morris (Reference Majji and Morris2018) for neutrally buoyant particles. However, in their case, the observed rings disappeared at the onset of wavy vortex flow (Ta > 56, which for our data would be figure 6(c) et seq. however, we see wavy vortex behaviour onset at approximately Ta > 169), whereas in the present case, the rings persist to the highest speeds we can measure at approximately Ta = 221. Figure 7 shows a time series of the images at 650 rpm (Ta = 187) where a clear periodic oscillation of the position of the rings is seen, indicating that the underlying wavy vortex flow has a periodic motion. The measured frequency is approximately 8.5 Hz.
5. Model comparisons
We now examine a series of numerical simulations using the fluid properties of aqueous glycerol used in our experiments. For these simulations, a mesh consisting of 7 270 120 cells was used. The initial volume fraction of the particles was set to be uniformly distributed at 3.6 % in the geometry away from the cone-shaped inner cylinder (i.e. for $- 6H < x < 6H$), while the volume fraction related to the rest of the geometry was set to zero.
One should note that in using an Eulerian-Eulerian solver, such as the one developed here, the ratio of the average particle size to a reference length of the geometry should be reasonably small, $\delta \ll 1$. In our experiments, we have chosen particles for which $0.085 \le \delta \le 0.12$. Below, we conduct a series of qualitative and quantitative analyses, systematically comparing the numerical and experimental results obtained for the mixing process and solids distribution. We examine different inertial regimes in a circular Couette, i.e. both Taylor vortex and wavy vortex regimes.
5.1. Mixing behaviour
A primary behaviour of interest is the mixing parameter, defined in (3.3), with experimental results shown in figure 4. To reproduce this dataset, we start with a uniform distribution of particles at the desired volume fraction and run to steady state at the Taylor number of interest. Thus, whereas in the experiment a rotation rate sweep is performed so that each new rotation rate is initiated with the distribution at the previous rotation rate, for the numerical calculation, each rotation rate is an independent calculation with a uniform particle distribution initial state. For all simulations, we set the value of $\delta = 0.102,\gamma = 2.09$, and the ratio of Taylor number to Froud number is fixed at $Ta/Fr = 21.2$ (i.e. the sweep is achieved by changing wall velocity). The numerical results are plotted in figure 8 as mixing parameter $\varLambda $ versus Taylor number and are overlaid with the experimental results. The numerical results are seen to quantitatively match the experimental results within experimental error.
At low Taylor numbers, the mixing parameter is zero, i.e. the particles are predominantly at the bottom of the Couette. On increasing the Taylor number, the mixing transition away from zero starts at a Taylor number of approximately 52 in our numerical simulation in good agreement with the experimental results of 53 as shown in figure 8. In the following section, we investigate the solid distribution at the start point of the Taylor vortex flow instability in more detail and its complex interaction with the Eckman vortices (Pfister & Rehberg Reference Pfister and Rehberg1981; Lücke et al. Reference Lücke, Mihelcic and Wingerath1985) due to end effects.
5.2. Evolution of bed structure
5.2.1. Observation of bed structure evolution
As the rotation rate is increased, even though mixing is seen, there is observed a persistent particle bed with a clearly periodic structure above a critical Taylor number (figure 5). This progression is reproduced in the numerical results. The numerically derived bed distributions as a function of Taylor number, observed from the underside of the geometry, are shown in figure 9. In figure 9(a), at Taylor numbers too small to initiate the mixing process, the solid bed adopts a uniform distribution in the middle of the geometry away from the cone-shaped ends of the inner wall. Near the cone-shaped ends, a non-uniform distribution is seen due to the presence of Eckman vortices. As the rotation rate increases, the initial rather uniform distribution is replaced by a more complex distribution, figure 9(b). At higher Taylor numbers, the distribution becomes a simpler periodic distribution (figure 9c) with a wavelength approximately equal to twice the gap between the two cylinders, H.
5.2.2. Analysis of bed structure evolution
In figure 10, calculated secondary flow streamlines in the x–y plane at z = 0 are superimposed on the calculated particle concentration. Below the critical Taylor number for mixing, a single vortex driven by the flow near the cone wall appears. These end vortices, which are considered as a base flow, i.e. not an inertial instability, are often referred to as Eckman vortices (Pfister & Rehberg Reference Pfister and Rehberg1981; Ahlers & Cannell Reference Ahlers and Cannell1983; Lücke et al. Reference Lücke, Mihelcic and Wingerath1985). It can be seen in figure 10(a) that the drag force exerted on the particle bed induced by the Eckman vortices is able to modify the bed distribution near the end walls, while the simple curvilinear flow in the rest of the geometry and away from the cone ends generates a uniformly distributed solid bed.
It is well known that, for a single-phase Newtonian fluid above a critical rotation speed, the flow between two concentric cylinders undergoes an inertial instability leading to the excitation of Taylor vortices. In such flows, there is a competition between a centrifugal force that has a destabilising effect and a viscous force that has a stabilising effect. The instability onset is a function of curvature ratio, i.e. the ratio of the gap size to the inner cylinder radius. According to Wendt (Reference Wendt1933), Prandtl was the first person who noted that for the stationary outer-cylinder case, Taylor's critical condition for the onset of instability can be approximated by a simple correlation as a multiplication of Reynolds number by the square root of curvature ratio, i.e. the Taylor number. Note that in our problem, due to the presence of gravity and the density difference between the solid particles and the surrounding fluid, we may observe the appearance of a solid bed which, correspondingly, may modify the ‘effective’ gap size between the two cylinders. Our preliminary numerical simulation, in the absence of particles (single phase), suggests that the critical Taylor number for transition to the Taylor vortex regime appears at a Taylor number of 45, while in the presence of ${\varPhi _{ave}} = 3.6\,\%$ particles, this transition appears at a much higher Taylor number of 52, which is consistent and in excellent agreement with our experimental results of a Taylor number of 53. Here, the onset of Taylor–Couette flow and the apparent stabilising effect of a particle bed at the bottom might be approximated to an eccentric Taylor–Couette flow problem and its stabilising effect, for which there is a well-established literature both experimental and theoretical (see, for example, Vohr Reference Vohr1968; Oikawa, Karasudani & Funakoshi Reference Oikawa, Karasudani and Funakoshi1989; Shu et al. Reference Shu, Wang, Chew and Zhao2004). Our numerical simulations reveal that at the onset of mixing, there is a complex interaction between the Eckman vortices, the solid bed distribution and Taylor vortices which could make the problem even more complex. The distribution of the solid bed (figures 9b and 10b) may locally modify the Taylor vortices along the x direction by changing this effective gap size. As shown, the presence of the Eckman vortices is able to locally change the solid bed distribution in the vicinity of the cones (e.g. figure 9b) and this can seed the creation of ‘Taylor vortices’ locally.
The numerical results, supported by our experimental data, suggest that at higher rotation rates, the inertial force is strong enough to regularise the interaction between the Taylor vortices and the particle bed along the axial direction, and this leads to a periodic distribution of solid particles at the bottom of the geometry (figure 9c). In fact, the counter-rotating nature of neighbouring vortices (figure 11a) leads to a drag force (figure 11b) that moves particles within the bed towards a converging stagnation point, and hence a mound of particles is seen every second vortex. Hence, the wavelength of the resulting periodic particle bed structure should be approximately 2H.
5.3. Formation of particle-decorated vortex structures
5.3.1. Ring-structure evolution
Once Taylor vortices have developed uniformly along the geometry, we begin to see mixing and observe, both in experiment (figures 6 and 7) and model (figures 10 and 12), the vortices decorated at their outer limit with particles. Note that the results presented in the experimental section (figures 6 and 7) are in fact an integration of concentration due to the nature of the X-ray shadowgraph technique. In figure 12, to better compare our numerical results with experiments, the isovolumic particle concentration is set with an opacity ranging from 0 (for $\phi = 0$) to 1 (for $\phi = 0.6$). Hence, the images in figure 12 are effectively integrations of particle density across the Couette (into the page). The rings begin to form at a Taylor number around 60 and by increasing the rotation rate of the inner wall, the rings become larger, consistent with our experimental observation (figure 6). Our numerical results suggest the presence of a sheet of particles proximal to the upper surface of the inner cylinder connecting the rings (more obvious in figure 13), which is not seen experimentally. One should note that once particles are in the vicinity of the wall, the flow field around each particle must be altered by the presence of the wall, and hence inertial effects should be expected to differ compared with an unbounded flow field. This effect is not captured by Saffman's calculation as he assumed an unbounded shear flow field and hence is not captured in our simulation. Single-body inertial migration between walls due to the proximity of the walls is complex. We refer interested readers to the work of Vasseur & Cox (Reference Vasseur and Cox1976) that addresses the simple shear case for neutrally buoyant as well as density-mismatched particles.
In figures 13(a–c), the images show the cross-sectional particle density in the $x\unicode{x2013} y$ plane at $z = 0$ for $-2 < x < 2$ and $4 < y < 5$ showing the solids distribution on the top of the geometry along the gap direction. In figure 13(d–f), at $z = 0$ for $-2 < x < 2$ and $-4 < y < -5$, the corresponding solids distributions at the bottom of the geometry are shown. In figure 13(d–f), the amount of the solid located at the bed is reduced as the rotation rate increases. Taylor vortices appear to enhance the mixing process and thereby enhance solid transport. One should note that a previous numerical study carried out in a Taylor–Couette geometry (Kang & Mirbod Reference Kang and Mirbod2021), which included normal forces arising from an anisotropic particle pressure definition but not lift forces, predicted that within complex flows including Taylor vortices, the particles migrate to the centre of the vortices, in contrast to observations by Majji & Morris (Reference Majji and Morris2018), and both our experimental and numerical results.
For suspension flow problems, such as studied here, the neutrally buoyant case provides an important comparison which we now address. In the sedimenting case (Ta = 90 and $\gamma = 2.09$), although the average volume fraction across the domain is ${\varPhi _{ave}} = 3.6\,\%$, we can see from the mixing parameter (figure 8) that a significant proportion of the particles reside in a bed at the bottom of the Couette. Hence, to match the volume fraction of moving particles found in the sedimenting case to the same volume fraction of moving particles in a neutrally buoyant case (i.e. without a bed of particles), we find that we need to reduce the total average volume fraction to ${\varPhi _{ave}} = 0.5\,\%$. In figure 14, we compare particles distributions for the sedimenting case (Ta = 90 and $\gamma = 2.09$, figure 14a) to the distribution in the neutrally buoyant case (Ta = 90 and $\gamma = 1$, figure 14c). We also compare the distribution of Archimedes force for the two cases, respectively figures 14(b) and 14(d). The top-bottom asymmetry is compared in rows (i) and (ii) of the figure.
Comparing figures 14(a-i) and 14(a-ii), there is no top-bottom symmetry. In this case, gravity acts in opposition to the centrifugal force in the top of the cell, but cooperatively at the bottom of the cell, hence breaking the axial symmetry and resulting in sedimentation at the bottom of the cell. The corresponding asymmetric Archimedes force distribution is shown in figures 14(b-i) and 14(b-ii). In the neutrally buoyant case, comparing figures 14(c-i) and 14(c-ii), the gravitational force is absent so that the top-bottom symmetry is not broken and we find a uniform particle ring distribution azimuthally, as observed experimentally by Majji & Morris (Reference Majji and Morris2018), and hence an axisymmetric ring pattern. The Archimedes force distribution (figures 14d-i and 14d-ii) is symmetric top to bottom.
The variation of the mixing parameter with time for two Taylor numbers are plotted in figure 15(a). Since our initial condition is a uniform particle distribution, the mixing parameter starts from 1 in both cases. At $Ta = 30$, due to the absence of Taylor vortices, the mixing parameter starts from one and goes to zero implying no mixing. At the higher Taylor number, $Ta = 200$, the mixing parameter exhibits a time dependent periodic variation due to the onset of wavy vortex behaviour (see inset), and hence a periodic variation of material integrated within our fixed measurement region (the definition of the lift parameter and the integration domains are provided in the Supplementary material and movie). The frequency of the calculated periodic motion is approximately 10.5 Hz, in reasonably good agreement with our experimental observation at approximately 8.5 Hz. Our results produced by the model, supported by experiments, capture a delayed transition from Taylor vortices to wavy Taylor vortices. Our numerical simulation in the absence of particles (single phase) suggests that the critical Taylor number for transition to the wavy vortex regime appears at a Taylor number of 103, while in the presence of ${\varPhi _{ave}} = 3.6\,\%$ particles, this transition appears at the much higher Taylor number of 145, the latter of which is in reasonable agreement with our experimental value of approximately 160.
In previous studies for neutrally buoyant particles (e.g. Majji & Morris Reference Majji and Morris2018), as the rotation speed was increased, the observed rings disappeared at the onset of wavy vortex flow, while in our problem, the rings persist in this flow regime (as shown numerically in figure 15 and experimentally in figure 7). Video files from both experiment (Supplementary material and movie 1 is available at https://doi.org/10.1017/jfm.2023.1042) and numerical simulation (Supplementary material and movie 2) highlighting this persistence have been provided. We postulate a possible explanation of this observation by noting that due to sedimentation of particles, in our problem, there exist particle banks (i.e. reservoirs of particles) on the lower side of the cell. The relatively fixed position of these solid beds of particles (see figures 7, 12 and 13) may therefore act to fix a source position for a stream of particles lifted from the bank and taken around the annulus. Our well-defined rings of particles well into the wavy vortex regime could then be related to these fixed points, rather than being fully randomised trajectories (after many revolutions) for neutrally buoyant particles in the absence of solid beds.
5.3.2. Ring formation dependent on lift forces
We now focus on the detailed effect of lift forces and their formulation in distributing particles. As discussed in the experimental section and also reported previously by Majji & Morris (Reference Majji and Morris2018), Baroudi et al. (Reference Baroudi, Majji and Morris2020), the presence of spherical solid particles will decorate the Taylor vortex flow. Figures 16(a) and 16(d) show the results of our full model at $Ta = 90$ exhibiting steady-state ring structures. Figures 16(c) and 16(f) show the results of the same model but with lift forces set to zero. In the absence of lift forces, the particles dynamically swirl between the vortices, qualitatively resembling the process investigated by Dusting & Balabani (Reference Dusting and Balabani2009) for mixing of a dye in the Taylor vortex flow regime.
Model formulations, such as presented in (2.16), have been commonly used in both Eulerian-Eulerian and Eulerian-Lagrangian formulations. In our simulations, using that formulation instead of (2.15) leads to an unsteady flow field with particles moving between secondary flow structures (figures 16b and 16e). It is therefore clear that it is not the magnitude of lift force that needs to be corrected but its direction (see (2.15) and (2.16)).
We next analyse the relative contributions of lift forces and gravitational forces. Any non-neutrally buoyant particle, moving within a carrier fluid, will be subject to a force due to gravity and, in an inertial regime, a force due to a difference of acceleration (the first terms in the left-hand side and the right-hand side of the conservation of momentum for each of the fluid and solid phases in (2.3) and (2.5)). These forces are respectively due to a density mismatch or flux difference, and cause the particle to move with a velocity different to the fluid, i.e. a relative velocity. The distribution of relative secondary motion in the vorticity direction and forces arising through the relative velocity of the two phases, including drag and lift forces at the top of the Couette for both (i) gravitationally sedimenting and (ii) neutrally buoyant cases are shown in figure 17. Note that for the neutrally buoyant case, although the density of fluid and solid are identical and gravity has no role in creating the ‘relative velocity’, the difference in the flux term of the inertial force (the difference in the first terms in the left-hand side of conservation of momentum for fluid and solid phases in (2.3) and (2.5)) would lead to a relative velocity between the two phases. Note that difference in stress of solid and fluid phases (the difference in second terms in the right-hand side of conservation of momentum for fluid and solid phases in (2.3) and (2.5)) would also play a role in the appearance of the relative velocity. The relative velocity appearing between solid and liquid phases are smaller in the neutrally buoyant case, compared to the sedimenting particle case (figures 17-i and 17-ii). As a consequence, this leads to larger values of the drag force. Interestingly, although the relative velocity is reduced in the neutrally buoyant case, the strength of the lift forces seems to be of the same order of magnitude as those in the sedimenting particle case, which might seem to be counter-intuitive at first glance. Here, one should note that due to the absence of any solid bed in the neutrally buoyant case, the vorticity strength would be higher and this in turn could increase the strength of lift forces.
Our results suggest that capturing the correct migration of particles in complex flow conditions requires inclusion of forces arising from the relative velocity of the two phases, and there is a fine balance between lift forces and other balancing forces such as drag in the secondary flow direction, as shown in figure 16. The results suggest that in the case of a sedimenting particle, Saffman's force seems to be larger than the Magnus force, whereas in the neutrally buoyant case, the role of Magnus force becomes relatively more important. We conclude that to obtain an accurate migration of particles (to capture the ring structure in this particular example) in different gravitational regimes, the presence of both lift forces due to Magnus and Saffman are important.
6. Discussion
In our model formulation, the force coupling between the fluid and particles comprises a sum of gravitational, Archimedes and drag forces together with Saffman and Magnus lift forces. We find that to reproduce the experimental behaviours, even qualitatively, we require all these forces. Despite this success, the functional forms chosen, although appearing in the literature, are not well defined over all concentration regimes that exist within our computational domain. Hence, it is difficult to be certain of the detailed balance of forces at any point within the domain. Nevertheless, we find that without the lift forces, it is impossible to reproduce the observed ring structure, which is a clear and strong observational feature. We have demonstrated the effect of either neglecting the lift forces or of ‘incorrectly’ formulating their direction in figure 16.
Hence, we conclude that to accurately capture the observed migration of particles in the inertial regime, the presence of the lift forces is imperative. These lift forces have been widely dismissed for Eulerian-Eulerian solvers previously reported in the literature (Chiodi et al. Reference Chiodi, Claudin and Andreotti2014, Inkson et al. Reference Inkson, Papoulias, Tandon, Reddy and Lo2017). However, without lift forces, particles swirl between the centre and outer edge and between pairs of vortices. This clearly contradicts both our experimental observations (figures 6 and 7) for the dense particle case and those reported by Majji et al. (Reference Majji, Banerjee and Morris2018), Majji & Morris (Reference Majji and Morris2018) for the neutral buoyancy case. We also note that at the onset of particle mixing (experimentally figures 6a and 6b), when lift forces are still comparatively weak, we see particles at the centre of the vortices. Only at higher Taylor numbers (i.e. high inertia) do we see particles migrate to the periphery of the vortices, further suggesting the association of lift forces with such movement.
Within a shear flow but close to a boundary, particles will experience a force away from that boundary. This may be understood from simple Bernoulli consideration of flow either side of the particle, i.e. the pressure on the wall side of the particle will be higher than on the other side of the particle. Hence, in the annular gap and in the absence of other forces, the particles will migrate to the approximate centre of the gap. To model this effect, the position of the particle relative to walls together with the flow perturbation due to the finite size of the particle are needed. Hence, within our Eulerian-Eulerian formulation, since these factors are not captured, neither is the wall-induced migration.
In contrast to most previous work (e.g. Majji et al. Reference Majji, Banerjee and Morris2018; Majji & Morris Reference Majji and Morris2018), in our calculation and experiments, the particles sediment. At all but the highest rotation rates, this leads to the appearance of particle banks on the lower side of the cell. Particle transport around the annulus appears to proceed with each bank being a ‘source’ of particles and a ‘sink’ of particles such that the trajectory around the annulus begins and ends on a bank. The relatively fixed position of each bank of particles (see figure 5) therefore leads to a fixed position as the source of particles so that at each rotation speed, the particle trajectories have a fixed starting point. We see well-defined rings of particles well into the wavy vortex regime in clear contrast to the neutrally buoyant case (Majji & Morris Reference Majji and Morris2018), and we postulate that this fixed point rather than fully randomised trajectories may be the underlying explanation.
The observation of period doubling for particles in water (Appendix A) at moderate rotation but high Taylor number (sufficiently high to have a turbulent vortex structure) has not been previously reported. For the initially regular and consistently shaped banks of particles, to evolve to two shapes interleaved, there must be, at these rotation speeds, net asymmetric particle transport between the initially even banks. Whereas some initial calculations suggest that our model can reproduce this effect, a full investigation and explanation of this instability is beyond the scope of the present work.
7. Conclusion
We have constructed a mathematical platform for simulating two-phase flows of non-Brownian particle suspensions within an Eulerian-Eulerian framework. A fully 3-D, transient, numerical solver has been written using OpenFOAM, which we refer to as SCRFoam. In this formulation, the conservation of mass and momentum in both phases are solved, and consequently separate velocities of each of the fluid and solid phases at each computational time step are obtained. This approach allows investigation of the forces arising through the relative velocity of the two phases, including drag and lift forces. To determine the validity of our approach and to motivate extensions to the conventional model, we have conducted limited experiments with Newtonian fluids and glass ballotini beads within a concentric cylinder geometry. We find that all key features of the experiments are captured by our model, but note that without the lift terms, as commonly neglected in previous Eulerian-Eulerian solvers, particles drift to the centre of the Taylor vortices rather than to the periphery as experimentally observed. In particular, our model captures the annularly asymmetric bed mounds at low rotation, onset of mixing and, at high rotation, the formation of ring structures. The model also captures the persistence of the ring structures beyond the transition to wavy vortices as we find in our experiments.
Using rheometric techniques, a scalar quantity known as the particle pressure can be obtained that may be sufficient to describe the particle migration for suspension flows under viscously dominated conditions and high particle concentrations in rectilinear flows. Here we have shown that in more complex flow conditions, such as those observed in Taylor–Couette flows, the presence of the lift force is a key feature to capture inertial non-Brownian particle migration. In our experiments, we observe the migration of particles also due to wall repulsion which was not currently included in our modelling.
Supplemental material and movies
Supplementary material and movies are available at https://doi.org/10.1017/jfm.2023.1042.
Acknowledgements
Although we modified the flow loop for these experiments, we are grateful to Dr G. Oddie for the original design and construction of the flow loop employed here. We are indebted to Professor Morris for discussion relating to the effect of walls in particle transport.
Declaration of interests
The authors report no conflict of interest.
Appendix A
To focus the discussion, the main text has been limited to experimental and numerical results relevant to moderate Ta number and moderate volume fractions. Here we report, without further analysis, a curious observation made with water as the background fluid. For our particles in water, as the centre-body rotation speed is increased, we see a reproducible redistribution of particle beds into a period doubled structure, figure 18. We have not observed this for higher viscosity aqueous glycerol solutions.
In figure 18(a), the optical arrangement used to obtain the images in figure 18(b,c) is shown where the mirror is placed sufficiently low that an oblique view is obtained highlighting the outline of the particle distribution within the bed. Figure 18(b) shows images at steady state for a sequence of rotation rates and figure 18(c) shows the detailed approach to the observed rearrangement. As rotation speed is increased, as indicated in each panel, the particle redistribution evolves as follows: (i) above a certain rotation speed, movement of surface particles in the bed; (ii) movement of particles such that the beds redistribute into periodic mounds roughly commensurate with the expected Taylor vortex wavelength; (iii) at this point, a general circulation of particles over each mound can be seen leading to a fore-aft asymmetry of the mound shape with a ‘shark-tooth’ appearance (figure 19a); and (iv) further rotation rate increase then drags particles from the bed and around the annulus of the cell. As particles are suspended in the flow now, the volume of each mound decreases, and the shape evolves to a fore-aft symmetry, but now extended further around the inner wall of the outer surface and narrower in the axial direction. Note that above approximately 132 rpm (Ta = 682) for a single phase, but modified by the presence of particles, we may expect turbulent vortices (Andereck et al. Reference Andereck, Liu and Swinney2006). Although the particle mounds are observed to align with the converging stagnation line at the outer wall developed by the counter-rotating vortex structure, over a narrow rotation rate range between approximately 225 rpm and 260 rpm (1160 < Ta < 1340 or 2380 < Re < 2750), we see a remarkable period doubling where the particle mounds rearrange to be alternating broad and narrow mounds. We have not been able to generate this feature with aqueous glycerol solution, but with this higher viscosity fluid, we cannot access such high Ta numbers. The period doubling takes a few minutes to evolve, but once formed is stable over longer periods. At these rotation rates, particles can be seen to travel around the Couette and thereby potentially have the opportunity to pass from one mound to another. The measured axial periodicity of the mounds is plotted in figure 19(b). The periodicity is close to that expected for a Taylor vortex wavelength, even into the turbulent vortex regime with the particles decorating the converging node between the vortices. Figure 19(b) indicates the observed period doubling over a narrow range of Taylor numbers.
Appendix B
Since viscous and inertial forces combine to lift a particle and gravity to bring it back to the bottom of the cell, it is natural to consider plotting mixing data (figure 4) as a function of either Shields number, θ, (viscous dominated process) or Froude number, Fr = Ta $\cdot$ θ, (inertia dominated process). In fact, neither collapses both the aqueous glycerol and water data. Hence, in figure 20, we plot our mixing data (figure 4) together with mixing data for water as a function of a combined scaled Froude number and Shields number, i.e. a ratio of inertial plus viscous forces to gravitational forces, $\varSigma = (Ta/n + 1)\theta $. Whilst suggestive, there are insufficient data here to substantiate this postulated dependence. Nevertheless, the suggested scaling implies that the critical rotation rate for initiation of mixing should be proportional to the square root of particle size. Experiments with a smaller particle size are indeed consistent with this.