


Introduction
As a global health threat in the 21st century,(Reference Costello, Abbas and Allen1) climate change adversely affects human lifestyle worldwide by causing food shortages, increased sea levels, extreme weather, and decreased productivity.(Reference Bressler2) The Paris Agreement, signed by 196 nations in 2015, aimed to limit global warming to ≤ 2℃ above the pre-industrial air temperatures.(3) To achieve this goal, current diet-related greenhouse gas emissions (GHGEs) should be reduced to 40% by 2050. However, this goal will be difficult to achieve if it cannot be reduced by 25 years (in 2075).(Reference Clark, Domingo and Colgan4) Electricity and heat (energy use) sectors contribute the most to total GHGEs (approximately 32%);(Reference Ritchie, Rosado and Roser5) however, diet-related GHGEs, including those from the pre- to post-production stages, also contribute to 21%–37% of the total global GHGEs.(Reference Mbow, Rosenzweig and Barioni6) Thus, to meet the goal of the Paris Agreement, we must reduce GHGE from industry, electricity sectors, food production, and agriculture by improving individuals’ dietary choices for the planet’s health as soon as possible.(Reference Clark, Domingo and Colgan4)
In 2019, the EAT-Lancet Commission aimed to achieve both human and planetary health. They presented a reference planetary health diet (PHD) that considered environmentally sustainable food systems for the planet, such as emphasising plant foods and limiting animal foods, while resolving the problem of food security in the growing global population.(Reference Willett, Rockstrom and Loken7) In addition, several previous studies have reported that higher adherence to the PHD based on the EAT-Lancet Commission criteria was inversely associated with all-cause mortality(Reference Karavasiloglou, Thompson and Pestoni8–Reference Bui, Pham and Wang12) and diet-related GHGE(Reference Laine, Huybrechts and Gunter10) among adults residing in Western countries. Most of these studies have been conducted on individuals living in Europe. However, it is necessary to examine how adherence to the PHD affects health- and diet-related GHGE levels among adults living in non-Western countries due to the different habitual dietary patterns among cultures and countries.(Reference Ye, Geng and Zhou13,Reference Chen, Wang and Ji14)
This study aimed to evaluate the association between adherence to PHD and mortality in all 47 Japanese prefectures using regional differences in diet and health outcomes and assess the association between adherence to PHD and diet-related GHGE. Considering the results of previous studies,(Reference Laine, Huybrechts and Gunter10,Reference Ye, Geng and Zhou13,Reference Chen, Wang and Ji14) we hypothesised that moderate adherence to PHD is inversely associated with diet-related GHGE and mortality. However, the highest adherence may increase mortality due to induced deficiencies in certain nutrients.(Reference Beal, Ortenzi and Fanzo15)
Methods
Study design
This was a cross-sectional prefecture-level ecological study. Given that most granular data are available at the prefectural level, the associations between PHD scores and all-cause and cause-specific mortalities and diet-related GHGEs were evaluated across all 47 prefectures in Japan. This study was conducted using the following steps: (1) collection of data from electronically available aggregated reports from government sources, (2) estimation of dietary data according to prefecture from the collected data using the Standard Tables of Food Composition in Japan, (3) calculation of adherence to PHD and diet-related GHGE from dietary data, and (4) evaluation of the association between adherence score and mortality and diet-related GHGEs. Ethical approval was not required as only anonymised data from annual reports and summary tables were used, which contained no identifiable information, in accordance with the Ethical Guidelines of Epidemiological Research established by the Ministry of Education, Culture, Sports, Science, and Technology and Ministry of Health, Labour and Welfare. This study was conducted according to the Strengthening the Reporting of Observational Studies in Epidemiology-Nutritional Epidemiology.(Reference Lachat, Hawwash and Ocke16)
Data sources
Data from several government sources, including the Family Income and Expenditure Survey,(17) Retail Price Survey,(18) Vital Statistics,(19) National Health and Nutrition Survey, Japan(NHNS-J),(20) Census,(21) National Survey of Family Income, Consumption and Wealth,(22) Comprehensive Survey of Living Conditions,(23) and Annual Report on Prefectural Accounts were used.(24) Our underlying data are available electronically as aggregated reports on the Official Statistics of Japan website (e-Stat: https://www.e-stat.go.jp/stat-search?page=1&toukei=00400002). Details of all the data by prefecture are shown in the Online Resource.
Dietary assessment
The weight of food purchased in each prefecture was calculated using annual average data from the 2021–2023 Family Income and Expenditure Survey,(17) which aims to understand the actual state of household income and expenditure in individuals’ lives and to provide basic data for national economic formulation and social policies. The survey used a multistage random sampling method, extracting approximately 9,000 households from all over Japan monthly. Participants continued to record the purchase price and weight of each item they purchased for 6 months. The weight of each purchase was measured using an electronic scale distributed by the Ministry of Internal Affairs and Communications. After the 6-month survey was completed, newly selected households replaced the completed households. Therefore, the survey was conducted throughout the year. We used data based on the location of the prefectural capital for each prefecture.
Of the 212 dietary items in this survey, 211 were analysed, including those eaten away from home. School lunches were excluded because of the inability to calculate food weight. For items lacking reported food weight, we calculated the weight of food purchased using the purchased price obtained from the Family Income and Expenditure Survey and the price per weight of food obtained from the 2021–2023 Retail Price Survey.(18) The study data were weighted by the average number of participants per household in each prefecture, considering the weight of food purchased per individual as the dietary intake. Dietary intake was calculated from the amount of each food and beverage purchased using a programme developed with the Standard Tables of Food Composition in Japan.(25) For multiple foods included as a single item in the Family Income and Expenditure Survey, we used the mean value of each food and beverage included in the food list. To calculate the adherence score for PHD, we adjusted the energy intake using the density method by standardising the energy of each prefecture to 2,500 kcal/day.(Reference Willett, Rockstrom and Loken7,Reference Ye, Geng and Zhou13)
Regarding the estimation accuracy of dietary data at the available prefecture level, salt intake estimated from the Family Income and Expenditure Survey showed a moderate correlation with salt intake assessed from the 2016 NHNS-J (r = 0.52),(20) which used single-day semi-weighed household dietary records at the individual level, excluding trip or festivity days. Salt intake estimated from the Family Income and Expenditure Survey was underestimated compared with that estimated from the 2016 NHNS-J (8.7 g vs. 9.9 g/day). However, the energy-adjusted values were similar (10.3 g vs. 9.9 g/day). Thus, the energy-adjusted weight of dietary purchase data from the Family Income and Expenditure Survey may accurately reflect the habitual dietary intake at the prefecture level. The reason for comparing the estimated salt intake for each dietary assessment was that data were available only for salt consumption from the 2016 NHNS-J.
Calculation of planetary health diet score and diet-related greenhouse gas emission
Adherence score to the PHD was evaluated using the EAT-Lancet diet index (Supplementary Table 1). This score was developed according to a previously reported scoring algorithm based on the EAT-Lancet Commission by Stubbendorff et al.(Reference Stubbendorff, Sonestedt and Ramne11) and Ye et al.(Reference Ye, Geng and Zhou13) This score performed better across reducing mortality risk and diet-related GHGEs than other diet scores reflecting adherence to the EAT–Lancet reference diet.(Reference Stubbendorff, Stern and Ericson26) Details are described in Supplementary Table 1 and elsewhere.(Reference Stubbendorff, Sonestedt and Ramne11) Briefly, the EAT-Lancet diet index comprises 14 food and nutrient domains associated with PHD patterns (fruits, vegetables, fish, legumes, grains, nuts, unsaturated oils, tubers or starchy vegetables, dairy foods, eggs, poultry, beef and pork, saturated oils, and all sugars) that should be encouraged, optimised, or limited (Supplementary Table 1).(Reference Willett, Rockstrom and Loken7) According to the EAT-Lancet Commission, recommended food and nutrient intakes have been established by food and nutrient intake per 2,500 kcal of energy per day.(Reference Willett, Rockstrom and Loken7,Reference Ye, Geng and Zhou13) PHD adherence scores were calculated using the amount of food and nutrients per 2,500 kcal of energy per day against each domain-recommended dietary intake value. The score for each domain ranged from zero (worst) to three (best). The scores for the 14 components were summed to obtain the total PHD adherence score, ranging from zero (worst) to 42 (best). Prefectures were then classified into four categories according to the PHD score: ≤ 24 (n = 14, low), 25 (n = 17, medium-low), 26 (n = 10, medium-high), and 27 points (n = 6, high).
Table 1. Characteristics of the Japan prefecture-level according to adherence to the planetary health diet score
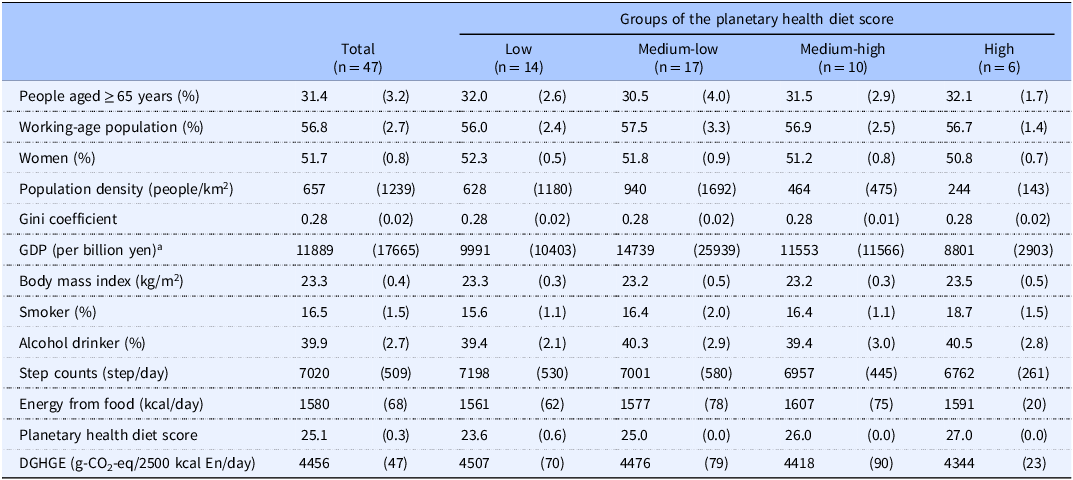
DGHGE, diet-related greenhouse gas emissions; En, energy; GDP, gross domestic product.
a The annual exchange rate for 2022 was 133.7 yen/dollar.
All values are shown as mean (standard deviation).
The prefectures included in each group according to the planetary health diet score: low group; Gifu, Osaka, Hyogo, Nara, Shimane, Okayama, Hiroshima, Yamaguchi, Ehime, Kochi, Fukuoka, Saga, Oita, and Kagoshima; Medium-low group; Hokkaido, Aomori, Akita, Saitama, Tokyo, Kanagawa, Ishikawa, Fukui, Mie, Shiga, Kyoto, Wakayama, Tottori, Kagawa, Kumamoto, Miyazaki, and Okinawa; Medium-high group; Miyagi, Yamagata, Chiba, Toyama, Yamanashi, Nagano, Shizuoka, Aichi, Tokushima, and Nagasaki; high group; Iwate, Fukushima, Ibaraki, Tochigi, Gunma, and Niigata.
Diet-related GHGEs (g-CO2-eq/d) were estimated by summing the products of the weight of food purchases and the GHGE value for each food and beverage. The GHGE values were estimated using production-based Japanese input–output table-applied methods for each food and beverage listed in the Japanese Food Composition Tables.(Reference Sugimoto, Murakami and Asakura27) Our use of this database involved retrieving data for emission components, including production to farm gate/factory gate; however, not for marketing- and waste-processing-related data. Similar to calculating the PHD adherence score, we calculated the diet-related GHGE value per 2,500 kcal of energy per day.
Mortality and event status
The Vital Statistics for 2022 provides data on mortality rates per 100,000 individuals in Japan from all causes, including cancer (neoplasms), heart disease, cerebrovascular disease (stroke), and pneumonia, stratified based on the prefecture.(19) The International Classification of Diseases 10th revision codes were C00–C97 for cancer; I01–I02.0, I05–I09, I20–I25, I27, and I30–I52 for heart disease; I60–I69 for stroke; and J12–J18 for pneumonia.
Other covariates
Age-standardised data on step counts and body mass index (BMI) were extracted from the aggregated reports of the 2016 NHNS-J.(20) Details of the survey have been explained elsewhere.(Reference Iwaoka, Yoshiike and Date28–Reference Watanabe, Inoue and Miyachi30) Daily step counts were measured using a waist-worn pedometer (ALNESS 200 S AS-200; Yamasa Co., Tokyo, Japan), with data from Sundays and holidays excluded.(Reference Inoue, Ohya and Tudor-Locke31) All participants recorded their daily step count over one day in a diary. Regarding the aggregated data, individuals with < 100 steps or ≥ 50,000 steps were excluded. BMI was calculated using the participants’ height and body weight, measured to the nearest 0.1 cm and 0.1 kg, respectively, using a stadiometer and weighing scale, with participants barefoot and wearing light clothing.(Reference Watanabe, Inoue and Miyachi30) The data on the population and gross domestic product of each of the 47 prefectures were obtained from the 2020 Census(21) and the 2020 Annual Report on Prefectural Accounts,(24) respectively. Data on the Gini coefficient, alcohol consumption rate, and smoking rate were obtained from the 2019 National Survey of Family Income, Consumption, and Wealth(22) and the 2022 Comprehensive Survey of Living Conditions, respectively.(23)
Statistical analyses
Continuous variables are presented as means and standard deviations (SDs). The 2016 NHNS-J was not conducted in Kumamoto Prefecture due to the 2016 earthquake. Missing data from Kumamoto (step count, BMI, and salt intake) were imputed using values from the 2012 NHNS-J. A mapping for mean PHD score and diet-related GHGE of Japan’s 47 prefectures was visualised using the “ggplot2” package of R software, and the “maps” and “mapdata” packages were used to capture and process data.(Reference Nakagata and Ono32,Reference Watanabe, Inoue and Miyachi33)
Food and nutrient status are expressed as the median of each group for the adherence score. The association between adherence scores and food and nutrient statuses was assessed using Spearman’s correlation analysis. We also evaluated the contribution and absolute value of diet-related GHGE for each food and beverage.
The rates of all-cause and cause-specific mortalities for each adherence score group are expressed as the number of events per 100,000 individuals. A multivariate Poisson regression model was used to calculate the rate ratios (RRs) and 95% confidence intervals (CIs) for all-cause and cause-specific mortalities according to each group of adherence scores.(Reference Watanabe, Inoue and Miyachi33) The reference levels for adherence scores were set as the medium-low group. The relationship between adherence to the PHD and GHGE was evaluated using a general linear model. To evaluate the curvilinearity of the associations, a multivariate-adjusted restricted cubic spline model with three knots (10th, 50th, and 90th percentiles) was used,(Reference Watanabe, Yoshida and Watanabe34) setting 25 points as the median PHD score as the reference value. The statistical significance of the nonlinearity was assessed using the Wald test, which compares the likelihood ratio of the spline model with that of the linear model. A p-value of < 0.05 indicated a significant nonlinear association between exposure and outcome.(Reference Watanabe, Yoshida and Watanabe34) Linear trend p-values were calculated using the likelihood ratio test with the PHD score as the continuous variable.
Multivariate analysis was performed by modelling the potential confounding factors reported in previous studies.(Reference Ye, Geng and Zhou13,Reference Watanabe, Inoue and Miyachi33,Reference Yoshikawa and Kawachi35) Model 1 was not adjusted for confounding variables (crude model). Model 2 was adjusted for the percentage of older adults (continuous), percentage of women (continuous), population density (continuous), gross domestic product (continuous), Gini coefficient (continuous), BMI (continuous), smoking rate (continuous), alcohol consumption rate (continuous), daily step counts (continuous), and energy consumption from food and beverages (continuous).
A two-tailed significance level of 5% was adopted. STATA MP (version 15.0; StataCorp LP, College Station, TX, USA) was used for data analysis and R version 4.2.1 (www.r-project.org) for mapping the 47 prefectures of Japan.
Results
Table 1 shows the characteristics at the Japanese prefecture-level according to the PHD adherence score groups. The mean (range) of the PHD score and diet-related GHGE were 25.1 (22−27) points and 4,456 (4276−4631) g-CO2-eq/2,500 kcal energy/day, respectively. Compared with the prefecture group with low adherence to PHD, those with high adherence were lower in women, population density, and step counts. Prefectures with high adherence scores tended to have a higher prevalence of smokers. Detailed demographic data and PHD adherence scores are shown in Supplementary Tables 2 and 3.
Figure 1 shows the geographical distribution of the prefectural mean PHD score and diet-related GHGE across the 47 prefectures of Japan. The prefectures in the middle of Japan tended to have a higher PHD score and lower diet-related GHGE. Table 2 and Supplementary Tables 4 and 5 show the associations between adherence scores and dietary intake. Adherence scores were moderately correlated to the intake of carbohydrates (r = 0.63), vitamin K (r = 0.59), magnesium (r = 0.57), pulses (r = 0.53), and seaweeds (r = 0.55) but inversely correlated to the intake of saturated fatty acid (r = −0.67), monounsaturated fatty acid (r = −0.54), cholesterol (r = −0.53), red meat (r = −0.56), chicken (r = −0.76), and eggs (r = −0.55). In Japan, meat (16.4%), cooked foods (15.9%), cereals (12.8%), and fish and shellfish (8.9%) contributed to the diet-related GHGEs (Supplementary Table 6).
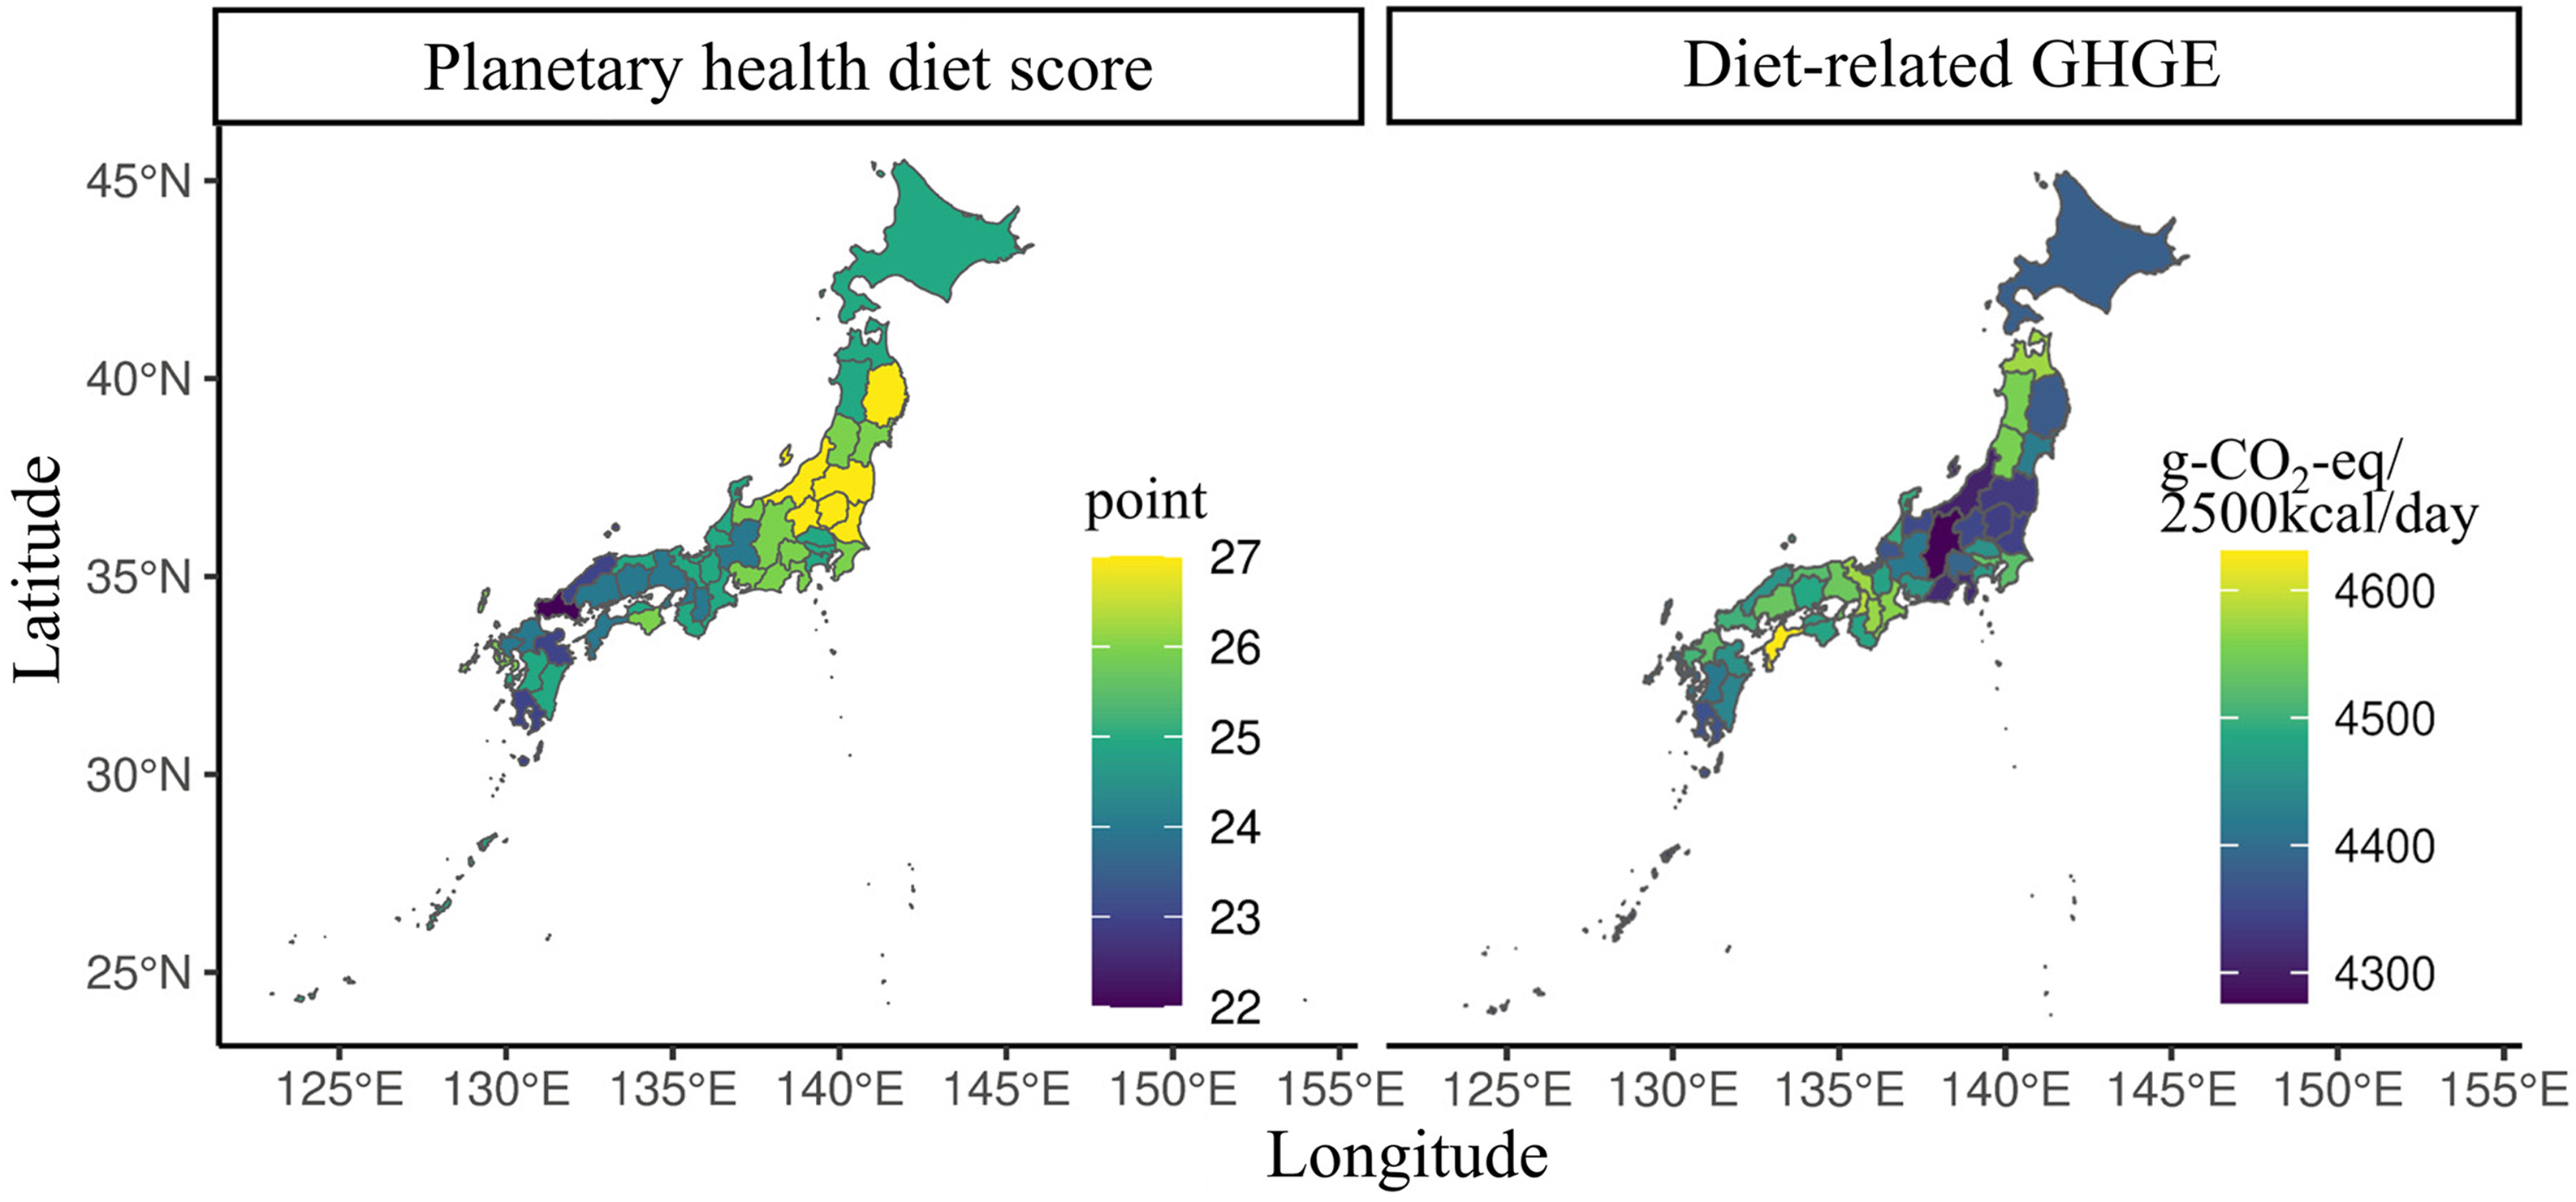
Figure 1. Geographical distribution of prefectural mean planetary health diet score and diet-related greenhouse gas emission in the 47 prefectures of Japan.
Table 2. Association between energy and nutrients from food and beverages and adherence to planetary health diet score
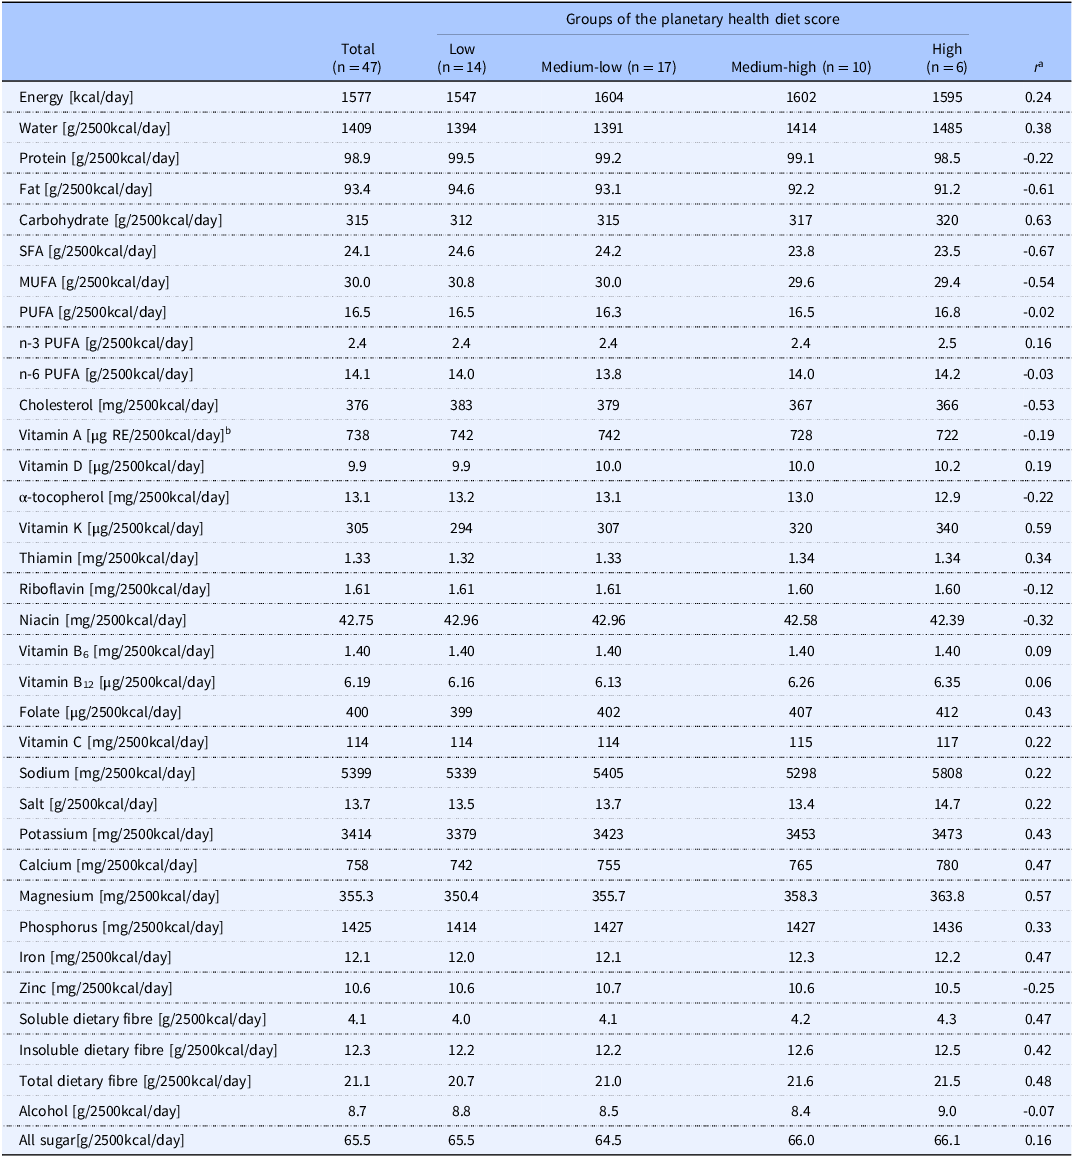
MUFA, monounsaturated fatty acid; PUFA, polyunsaturated fatty acid; SFA, saturated fatty acid.
a Spearman’s correlation analysis was used to evaluate the relationship between nutrient intake and adherence score.
b Sum of retinol, β-carotene/12, α-carotene/24, and cryptoxanthin/24.
Nutrient was adjusted for 2500 kcal/day of energy via the nutrient density method. Values are shown as a median in each group.
Table 3 shows the associations between the PHD score and all-cause and cause-specific mortalities. The mortality rates per 100,000 individuals from all-cause cancer, heart disease, stroke, and pneumonia in 2022 in Japan were 1285.8, 316.1, 190.9, 88.1, and 60.7, respectively. After adjusting for confounders, such as socioeconomic level and lifestyle, compared with prefecture in the medium-low group of adherence score, those in the low and high groups were associated with a higher mortality RR for all-cause (low group: RR = 1.03 [95% CI = 1.01–1.05], high group: RR = 1.03 [95% CI = 1.00–1.07]) and pneumonia (low group: RR = 1.10 [95% CI = 1.00–1.23], high group: RR = 1.16 [95% CI = 1.00–1.36]). In addition, the high adherence score group was associated with mortality from heart disease (RR = 1.12 [95% CI = 1.02–1.22]) and stroke (RR = 1.18 [95% CI = 1.04–1.33]). The multivariate-adjusted RR values (95% CIs) for all-cause mortality for a 1-point adherence score per day increments were 0.93 (95% CI = 0.90–0.97) and 1.03 (95% CI = 1.01–1.05) in prefectures with lower and higher than 25 points, respectively.
Table 3. Rate ratio of all-cause and cause-specific mortality and planetary health diet score in Japanese
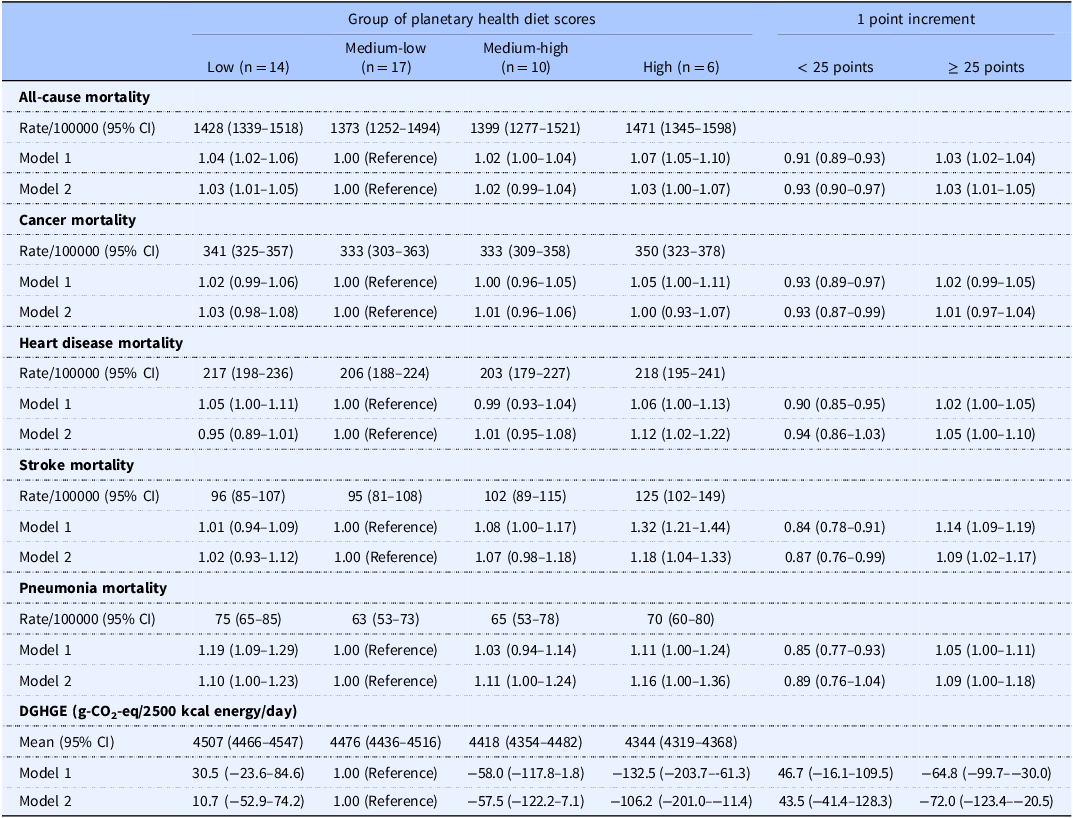
Abbreviations: BW, body weight; CI, confidence interval; DGHGE, diet-related greenhouse gas emissions; RR, rate ratio.
Mortality rate ratios were calculated using Poisson regression models using the following two models: Model 1 is not adjusted for confounders (crude model); Model 2 is adjusted for percentage of the older, percentage of the women, population density, gross domestic product, Gini coefficient, body mass index, smoking rate, alcohol consumption rate, daily step counts, energy from food, and beverage.
Figure 2 illustrates the dose-response association between the PHD score and all-cause and cause-specific mortalities and diet-related GHGE using a restricted cubic spline model. Reverse J-shaped associations were observed between the adherence score and mortality from all causes, stroke, and pneumonia (p for nonlinearity < 0.05), with the lowest RR of mortality of 25 points as population means (Figure 2a-e). Adherence to the PHD score was also inversely associated with diet-related GHGE (p for nonlinearity = 0.015, Table 3 and Figure 2f).
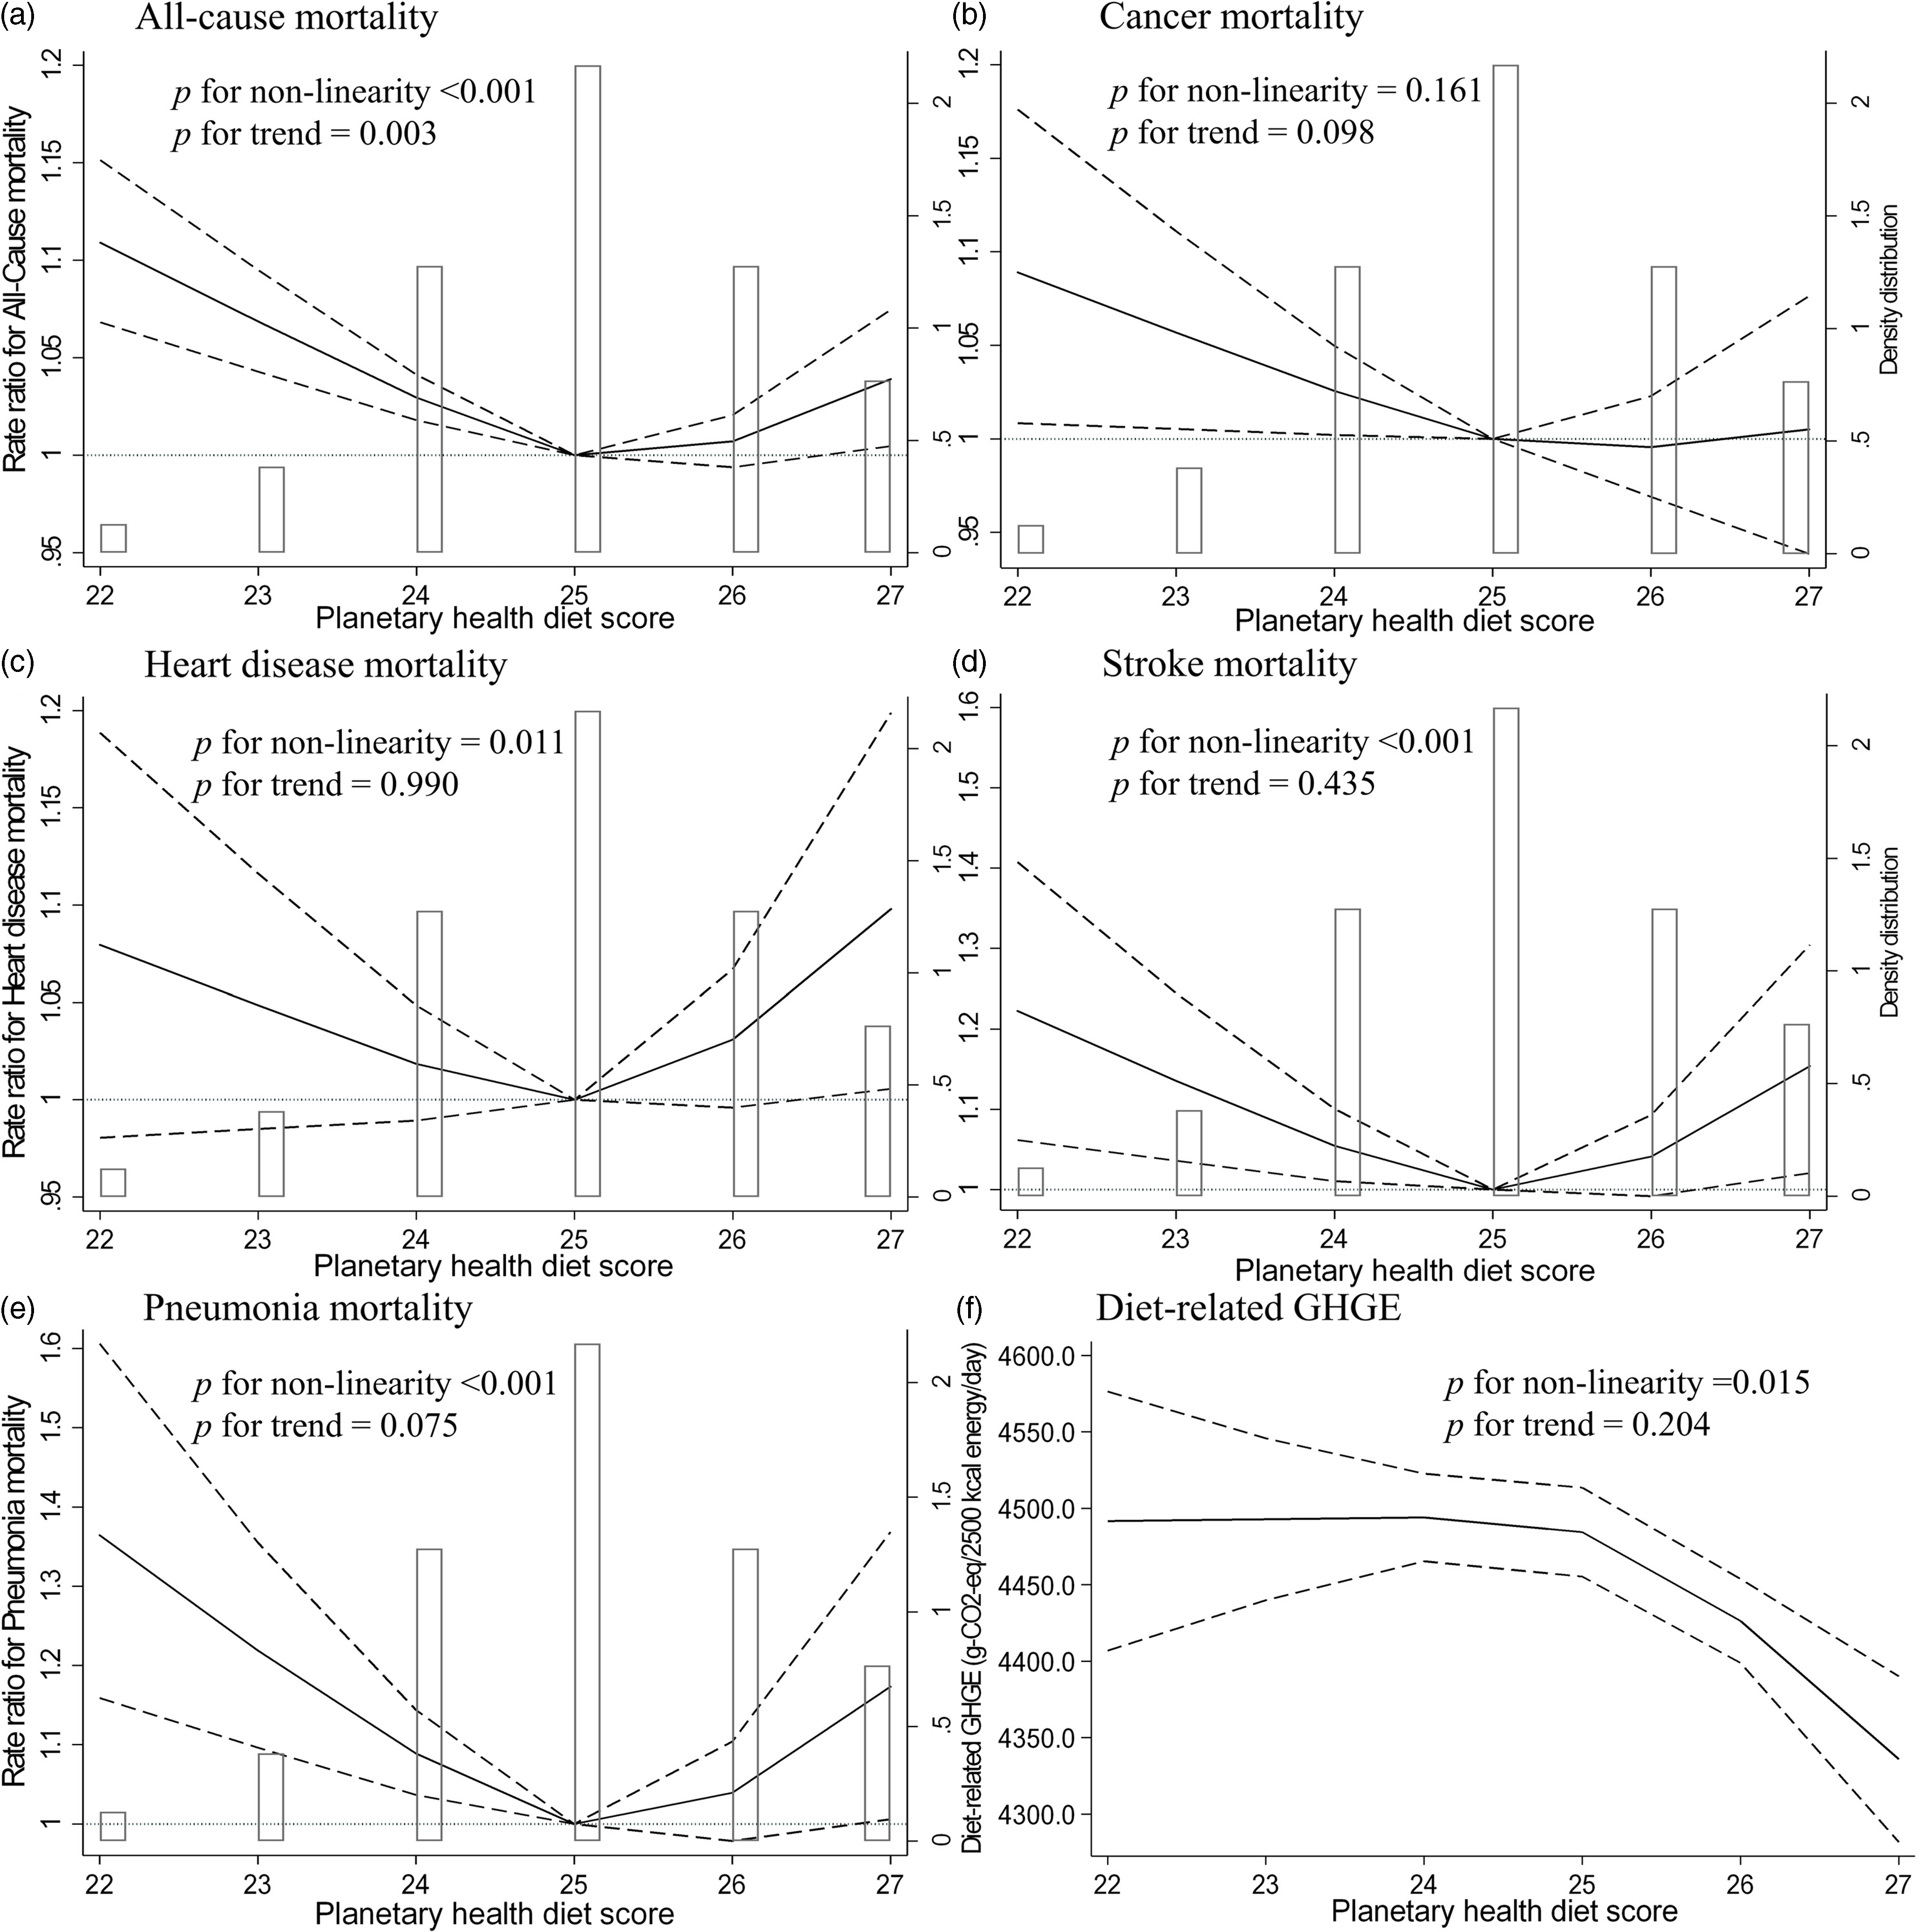
Figure 2. Multivariable restricted cubic spline regression model between the planetary health diet score and all-cause and cause-specific mortality and diet-related greenhouse gas emission. The histogram shows the distribution of exposure variables. Solid lines represent the rate ratio of mortality or mean diet-related greenhouse gas emission (GHGE), dashed lines represent 95% confidence interval (CI), and the rate ratio is based on the median planetary health diet score as the reference was calculated. We estimated that P ≥ 0.05 when the 95% CI of the rate ratio did not exceed 1.00, and P < 0.05 when the 95% CI of the rate ratio exceeded 1.00. The adjustment factors were the percentage of the older population, the percentage of women, population density, gross domestic product, Gini coefficient, body mass index, smoking rate, alcohol drinking rate, daily step counts, and energy from food and beverages.
Discussion
This study evaluated the distribution of adherence to PHD and diet-related GHGE across 47 prefectures in Japan, using data from the Family Income and Expenditure Survey, which indicated large regional variations. In addition, we showed that even after adjusting for confounders, the RR of all-cause mortality was 3% higher in the lowest and highest of PHD adherence than in the moderate-low group. These results aligned with our hypothesis set up before the study began. To the best of our knowledge, this is the first study to evaluate the association among adherence to PHD, mortality, and diet-related GHGE in 47 prefectures in Japan. Additionally, this study’s findings may support previous studies on this association in individuals from both Western(Reference Karavasiloglou, Thompson and Pestoni8–Reference Bui, Pham and Wang12) and non-Western countries.(Reference Ye, Geng and Zhou13,Reference Chen, Wang and Ji14)
Our results showed that diet-related GHGE differed among prefectures in Japan, with an average value of 4,456 g-CO2-eq/2,500 kcal energy/day. A previous study indicated that the mean diet-related GHGE estimated from 4-d dietary records was 4,031 g-CO2-eq/day in healthy Japanese adults aged 20–69 years.(Reference Sugimoto, Murakami and Asakura27) For comparison with our study, the average value of diet-related GHGE was 4,765 g-CO2-eq/2,500 kcal energy/day when the GHGE value of the previous study was adjusted per 2500 kcal of energy intake. Although the characteristics of the participants included in this study (all ages) and the previous study (adults only) differ, our results are similar to those of the previous study. Japan’s total GHGE in 2022 was 1,085 million t-CO2-eq/year, according to a report by its Ministry of Environment.(36) The estimated value of total diet-related GHGE emitted by approximately 120 million individuals (the total Japanese population) from the production stage is approximately 195 million t-CO2-eq/year, which contributes to approximately 18.0% of the total GHGEs in 2022. However, the diet-related GHGE of our study and previous studies(Reference Sugimoto, Murakami and Asakura27) may have been underestimated because the reference values we used for GHGEs per weight of each food and beverage item did not include GHGEs from the post-production stage and international transportation in most cases.(Reference Sugimoto, Murakami and Asakura27) According to a report by the Ministry of Agriculture, Forestry, and Fisheries, Japan’s food self-sufficiency rate per energy in 2022 is only approximately 38%.(37) Thus, several foods are dependent on imports. These findings may provide knowledge for addressing global warming caused by GHGE reduction in Japan. Japan’s food self-sufficiency rate should be considered to more accurately estimate and reduce diet-related GHGE in Japan.
Our findings indicate a reverse J-shaped association between adherence to the PHD and mortality. A previous study reported similar results (reverse J-shaped association) in European individuals.(Reference Knuppel, Papier and Key9) In contrast, several previous studies have reported that adherence to PHD has an inverse association with mortality in European,(Reference Laine, Huybrechts and Gunter10) Swedish,(Reference Stubbendorff, Sonestedt and Ramne11) British,(Reference Karavasiloglou, Thompson and Pestoni8) American,(Reference Bui, Pham and Wang12) and Chinese(Reference Ye, Geng and Zhou13,Reference Chen, Wang and Ji14) populations. These previous studies found it difficult to compare results owing to differences in the evaluation methods for PHD adherence scores and dietary survey methods. Despite the differences in the assessment methods of healthy dietary patterns and geographical regions, a previous meta-analysis revealed that better dietary patterns were associated with lower mortality risk(Reference English, Ard and Bailey38) and diet-related GHGE.(Reference Aleksandrowicz, Green and Joy39) This finding supports our results, indicating that adherence to PHD is inversely associated with diet-related GHGE. However, our results showed that the level of PHD adherence with the lowest mortality risk did not significantly reduce diet-related GHGE. Further well-designed studies with larger individual-level samples are required to develop PHD guidelines for Japanese individuals associated with reduced GHGE levels and mortality risk as a co-benefit of environmental and human health. Our results may provide insights for creating dietary guidelines for sustainable PHDs in the Japanese population.
Our results showed that the lowest and highest adherence to PHD were associated with mortality, and the mechanisms underlying these associations are not fully understood. However, these associations may be explained by differences in nutrient intake according to the PHD adherence level.(Reference Beal, Ortenzi and Fanzo15) We found that individuals with the lowest adherence to PHD tended to have a low intake of nutrients, such as carbohydrates and vitamin K, and a previous study has reported that these nutrients are associated with mortality risk.(Reference Seidelmann, Claggett and Cheng40,Reference Juanola-Falgarona, Salas-Salvado and Martinez-Gonzalez41) In addition, poor diet quality may lead to poor nutritional status(Reference Watanabe, Kurotani and Yoshida42) and the double burden of malnutrition, such as underweight and obesity, which is closely associated with the risk of non-communicable diseases worldwide.(Reference Wells, Sawaya and Wibaek43) In contrast, we observed that high adherence to PHD was associated with a lower intake of saturated and monounsaturated fatty acids. A previous meta-analysis indicated that saturated fatty acid intake is associated with mortality risk;(Reference Mazidi, Mikhailidis and Sattar44) however, several Japanese epidemiological studies have shown that saturated fatty acid intake is inversely associated with all-cause mortality(Reference Yamagishi, Iso and Yatsuya45) and the incidence of total stroke, particularly lacunar infarction and deep intraparenchymal haemorrhage.(Reference Yamagishi, Iso and Kokubo46) Low intake of saturated fatty acids is associated with very low blood cholesterol concentrations, leading to angionecrosis in intracerebral arterioles through the disappearance of medial smooth muscle cells, increasing the fragility of the vascular wall.(Reference Konishi, Iso and Komachi47) Thus, the high adherence to PHD in the Japanese population may result in a lack of beneficial effects on human health owing to low intake of certain nutrients, including saturated fatty acids. These mechanisms may support our results, showing an association between the lowest and highest adherence to PHD and mortality. Further studies are required to assess whether the mortality risk associated with PHD adherence is reduced by addressing the issue of poor nutritional intake.
The strength of this study lies in calculating the PHD adherence score and diet-related GHGE using the mean value in each prefecture for 3 years (2021–2023) based on the Family Income and Expenditure Survey. The estimation of dietary intake generally uses a 24-h dietary recall or dietary records over several days; therefore, it may not reflect an individual’s habitual dietary intake.(Reference Watanabe, Nanri and Yoshida48) The Family Income and Expenditure Survey we used surveys each individual for 6 months, which may reflect more habitual dietary intake. This may be essential for accurately evaluating regional differences in habitual adherence to PHD and the association among PHD score, mortality, and diet-related GHGE. However, this study has some methodological limitations. First, this study was an ecological study that evaluated the association among adherence to PHD, mortality, and diet-related GHGE. As such, the possibility of an ecological fallacy cannot be discounted because individual-level associations may differ in direction and magnitude from group-level associations. This study could be the temporal difference between the secondary databases. Furthermore, this study used a cross-sectional design that precluded causal inferences regarding the outcomes and exposure. Second, we conducted a prefectural-level ecological study because of the availability of more granular data for variables such as the weight of the food purchased and mortality. However, the prefecture-level ecological analysis averaged the differences in lifestyle and environmental characteristics in smaller locations, such as cities and towns. This may result in a small effect size of the analysis results because data from areas with extremely high or low PHD scores cannot be obtained. Further studies are required to collect granular or individual-level data on the weight of food purchased and mortality rates. Third, we used total grain consumption instead of whole grain consumption to calculate the PHD score. The dietary survey method we used did not allow for the evaluation of regional differences in total grain and whole grain intake. As evidence, the PHD score for grain intake was two points in almost all regions, excluding Wakayama prefecture (Supplementary Table 3). This suggests that even if we performed a sensitivity analysis excluding grains from the score or reconsidered the PHD scoring, the current ranking of regions by PHD score would remain unchanged. To address these problems, whole grain intake should be evaluated using a more accurate dietary survey at the individual level, not at the prefecture level. Fourth, although the current study adjusted for confounders, residual confounders may exist in the association between adherence to PHD, mortality, and diet-related GHGE. A large sample size is needed to adjust for more confounding factors, including environmental and social factors. Fifth, participants in the Family Income and Expenditure Survey were selected using random sampling. However, to the best of our knowledge, the participation rate for this survey has not been reported. The participation rate in the 2016 NHNS-J, conducted using a similar random sampling method, is only 44.4%.(20) Thus, these participants may have been more health-aware than the general Japanese population. Lastly, the PHD score was calculated based on the amount of food purchased. However, those who grow food, such as rice and vegetables, may not purchase these items but are likely to consume them, potentially leading to an underestimation of food weight and systematic errors. Moreover, the Family Income and Expenditure Survey includes the weight of food that was not consumed and wasted, and non-edible portions, which may lead to an overestimation of food weight. Despite these limitations, we found a moderate correlation between our results and the salt intake estimated using available dietary recording methods in the 2016 NHNS-J.
Conclusions
Our findings indicate large regional variations in adherence to the PHD and diet-related GHGE in Japan, and adherence to the PHD was associated with all-cause mortality, heart disease, stroke, and pneumonia. We demonstrated that the lowest RR for all-cause mortality was associated with a PHD score of 25 points, which is the average for the population. This suggests that excessive adherence to current environmentally friendly PHDs is associated with high mortality rates, highlighting the need to modify the current PHD guidelines to benefit the environment and human health. This study needs to be re-evaluated using a longitudinal study with data from individual- or granular-level data on adherence to PHD and mortality based on data from Japan because the cross-sectional prefecture-level ecological design induced ecological fallacy and cannot evaluate causal inferences regarding exposure and outcomes.
Supplementary material
The supplementary material for this article can be found at https://doi.org/10.1017/jns.2025.10018.
Data availability
The data underlying this study are available electronically in the form of aggregated reports on the Official Statistics of Japan (e-Stat) website at https://www.e-stat.go.jp/stat-search?page=1&toukei=00400002.
Acknowledgements
We acknowledge the staff of Family Income and Expenditure Survey, Vital Statistics, the National Health and Nutrition Survey, Japan, Retail Price Survey, Annual Report on Prefectural Accounts, National Survey of Family Income, Consumption and Wealth, Comprehensive Survey of Living Conditions, and School Health Examination Survey for their valuable contributions. We also thank Minami Sugimoto, an assistant professor at Toho University, for providing useful values of diet-related greenhouse gas emissions for each food and beverage listed in the Japanese Food Composition Tables. We wish to thank all the participants for their cooperation in this study. We would like to thank Editage (www.editage.jp) for their English-language editing.
Authorship
The authors’ responsibilities were as follows: study conception and design: D.W. and Y.I.; analyses and interpretation of data: D.W. and Y.I.; drafting of the manuscript: D.W.; manuscript revision: D.W. and Y.I.; data provision: D.W. and Y.I.; approval of the manuscript: all the authors.
Financial support
This study was conducted with support from Research Grant of Kurita Water and Environment Foundation through a research grant provided to Daiki Watanabe (grant number 24C010). The funders had no role in the study design, data collection, analysis, interpretation of data, report writing, and decision to submit the article for publication.
Competing interests
The authors declare none.


 Open access