1. Introduction
Whether low-income individuals are saving adequately for their retirement years is a perennial concern of policymakers and academics. Although there are several ways in which low-income individuals could prepare for retirement, including being eligible for Social Security, participating in a firm's defined benefit (DB) pension plan, contributing to individual retirement accounts (IRAs), and participating in an employment-based retirement plan (such as 401(k) plans, 403(b) plans, and other similar plans), the take-up of voluntary savings plans such as IRAs and 401(k)'s has generally been low among lower income workers. For example, Copeland (Reference Copeland2012) estimates that in 2010, among families with income below $25,000, less than 9% had an employment-based defined contribution (DC) plan and less than 10% had an IRA or Keogh plan.Footnote 1 Thus, a recent aim of policy has been to increase participation in and contributions to these types of plans,Footnote 2 and several studies have demonstrated that policy interventions like auto-enrollment in 401(k) plans lead to increased participation and savings rates among employees. However, little attention has been paid to how individuals adjust their finances in order to fund the contributions to their retirement accounts, or whether the reduced liquidity of these accounts leads to problems if the individual faces a negative shock. In this paper, then, we examine whether participation in 401(k) plans are correlated with increased short-term debt or increased short-term material hardships, as money is set aside for consumption well into the future.
IRA and 401(k)-type plans have the benefit either that contributions are tax-deductible (traditional accounts) or that withdrawals are tax-free (for Roth accounts). Amounts in these accounts are less liquid than in taxable accounts, however. If a withdrawal is made from a traditional account prior to the qualifying retirement age (generally 59½), such a withdrawal is subject to a 10% penalty (though there are a number of exceptions)Footnote 3 and is taxed as ordinary income.Footnote 4 In addition, the ability to make a withdrawal or take a loan from a 401(k)-type plan at a current employer is limited.Footnote 5
Recent policy interventions to encourage low-income individuals to save for retirement have generally taken two forms. The first has been to provide a financial incentive to contribute to retirement accounts. In 2002, the Saver's Credit was introduced, which provides a non-refundable credit to low-income taxpayers that is based on the amount placed in a qualified retirement account and the income of the taxpayer. Several analysts have suggested further expansions to the Saver's Credit, and the President's FY2011 Budget (U.S. Office of Management and Budget, 2010) contained two proposals aimed at increasing retirement savings among lower income taxpayers, including an expansion of the Saver's Credit and the auto-enrollment of workers not otherwise covered by a retirement plan in workplace IRAs.
The second policy intervention has been to encourage employers to automatically enroll their employees in a firm's 401(k)-type plan upon being hired, unless the employee affirmatively opts out of participation (rather than requiring workers to affirmatively choose to contribute). To this end, the Pension Protection Act of 2006, among other things, provided statutory authority for employers to automatically enroll workers in DC plans.
The desirability of these policy interventions, however, rests on the assumption that a low participation rate among low-income individuals is a problem to be concerned about and remedied. Theoretically, however, it is not clear that this is the case. McFadden (Reference McFadden and Wise2010) shows that in a simple intertemporal choice model that allows for conventional saving, a home purchase (possibly with a mortgage), revolving credit, and 401(k) saving, that it is rational for borrowers who have high marginal interest rates on their borrowing to pay down some debt rather than holding some savings in a 401(k) account. As a result, nonparticipation in a 401(k) account may be desirable for some individuals, and inducing those individuals to participate in a 401(k) plan through auto-enrollment may leave them worse off. Notably, although auto-enrollment policies typically include an option to opt out, the success of such policies rests in part on the inattention of employees who rely on default choices. This suggests that some people who would be better off by opting out may fail to do so.
In addition, participating may lead the individual to incur additional debt or face material hardships. Consider an individual making a decision each period of how much to consume, how much to save in a liquid taxable account and how much to contribute to a relatively illiquid IRA or 401(k)-type plan, and suppose that the individual has contributed to the tax-preferred account for some time. To contribute to a retirement plan (barring an increase in income), an individual can either shift their savings from a taxable to a tax-preferred account, reduce consumption, or increase debt. As noted below, to the extent that low-income individuals participate in retirement savings plans, it appears that contributions at least partially constitute new savings that is not simply shifted from another type of account, making it more likely that low-income individuals are either reducing consumption or taking on debt in order to contribute to a retirement account.Footnote 6
Now, suppose that the individual faces a negative income, health, or expense shock in a particular period. If the individual is rational and reoptimizes, to balance their contemporaneous budget they will be able to stop contributions to the tax-preferred plan and use the funds in the taxable account (if any). If such funds are not sufficient, however, the individual faces three choices. First, they might be able to withdraw funds from the 401(k) account, incurring taxes and penalties,Footnote 7 or they may be able to take out a loan on the account (though such a withdrawal or loan may not be allowed).Footnote 8 Second, they could take on debt, though such debt may carry a high interest rate. Third, they could decrease consumption, though this may involve forgoing some spending on necessities.
Further, suppose that the individual contributed to the tax-preferred account either because they were using it as a self-control device,Footnote 9 or because they signed up for the account when they were hired and have been inattentive since.Footnote 10 In such a case, even when facing a negative shock, they may not reoptimize and may continue contributing to the account. As a result, balancing the individual's contemporaneous budget constraint would involve taking greater amounts of debt or forgoing additional consumption.
Although the discussion above applies to any individual, it seems reasonable that individuals with little discretionary income would be more likely to have to avail themselves of either increasing debt or decreasing consumption.
In this paper, then, we seek to study whether policies encouraging 401(k)-type plan participation are potentially detrimental to the individual by leading to increased material hardships (such as the lack of sufficient food or the inability to afford needed housing, utilities, or health expenses) or an increase in debt that is of a type that tends to carry a high interest rate. Since our data pre-dates the more widespread use of auto-enrollment into DC plans, any impacts of DC plan participation that we find are among individuals who affirmatively opted in to DC plan participation. However, one might expect that these impacts are likely to be larger among those who are auto-enrolled.
To examine these questions, we utilize data from the 2004 wave of the Survey of Income and Program Participation.Footnote 11 In specifications in which we instrument for contributing to a DC plan with an indicator for whether an individual's employer offers a plan to any employee, our estimation results suggest that, among those in lower household income quintiles, participating in a DC plan leads to higher probabilities of experiencing any type of material hardship. In addition, the likelihood of holding credit card or other debt increases across quintiles, though the amount of debt does not appear to increase.
The paper proceeds as follows. Section 2 reviews the relevant literature, and Section 3 describes the data. Section 4 outlines the estimation method to examine the impact of DC plan participation on the presence of hardships and debt, and Section 5 presents the estimation results. Section 6 concludes.
2. Related literature
There is substantial debate over whether and how much the availability of tax-preferred retirement affects the savings rates of households. Several papers (surveyed in Poterba et al., Reference Poterba, Venti and Wise1996) found that these plans tend to increase savings among plan participants, whereas other authors (surveyed in Engen et al., Reference Engen, Gale and Scholz1996) found that most of the contributions to these plans consist of amounts that would have been saved otherwise (either in non-tax-deferred instruments, or by borrowing less to finance other assets). More recently, Benjamin (Reference Benjamin2003) finds positive but smaller effects of 401(k) eligibility on savings using propensity score matching, while Gelber (Reference Gelber2009) finds that savings increase substantially when workers who were not initially eligible to participate in an employer's 401(k) plan become eligible. In addition, results in Engen and Gale (Reference Engen and Gale2000) and Chernozhukov and Hansen (Reference Chernozhukov and Hansen2004) suggest that 401(k) accounts do increase wealth among those with low earnings or assets, respectively. Thus, to the extent that low-income individuals participate in retirement savings plans, it appears that contributions at least partially constitute new savings that is not simply shifted from another type of account.
Four recent studies have attempted to examine whether higher Saver's Credit rates are associated with higher rates of contribution, and the results are mixed. In an experiment conducted with H&R Block that was structured to be similar to the Saver's Credit, Duflo et al. (Reference Duflo, Gale, Liebman, Orszag and Saez2006) find that contributions to an H&R Block IRA product increased significantly with the presence of a match and a higher match rate, with match rates of zero, 20% and 50% associated with take-up rates of 3%, 8% and 14%. However, using H&R Block tax return data from 2005, Duflo et al. (Reference Duflo, Gale, Liebman, Orszag and Saez2006) and Duflo et al. (Reference Duflo, Gale, Liebman, Orszag and Saez2007) find that take-up and contributions increased only slightly with the actual Saver's Credit rate, with an increase from 25% to 100% yielding only a 1.3 percentage point increase in take-up. Using public use tax return data, Ramnath (Reference Ramnath2013) also finds no significant effect of the credit rate on contributions, while Heim and Lurie (Reference Heim and Lurie2014) find that the introduction of the Saver's Credit led to an increase in the propensity to contribute and the amount contributed, but that the response was centered among taxpayers with higher lifetime income.
Finally, a recent set of papers, including Madrian and Shea (Reference Madrian and Shea2001), Choi et al. (Reference Choi, Laibson, Madrian, Metrick and Wise2004a , Reference Choi, Laibson and Madrian b ) and others, have examined the impact of automatic enrollment of workers in employment-based retirement plans on participation in those plans, and have found that such policies significantly increase the likelihood that a worker contributes to a tax-preferred account.
3. Data
This paper uses data from the 2004 panel of the Survey of Income and Program Participation. The SIPP is a longitudinal survey in which respondents are interviewed every 4 months over a 3-year period.Footnote 12 Each wave consists of a core survey, with a set of questions that are asked in every interview, and several topical modules, which contain questions on specific topics.
The SIPP offers several important advantages for this type of study. First, the SIPP is a nationally representative sample of all ages of respondents, and oversamples low-income respondents, which are a focus of concerns about unpreparedness for retirement. Second, the SIPP contains questions on retirement plan participation, debt holdings, and material hardships of respondents, so that we can examine the relationships between these variables.
For this study, we use information that was collected in Wave 5 (in June–September 2005), Wave 6 (in October 2005–January 2006), and Wave 7 (in February 2006–May 2006). From the core survey, we use information the demographic characteristics of respondents, including their income, gender, education level, whether they are married, and whether they own a home. We take the values of these variables from the Wave 7 core survey, so that we are using the respondents’ characteristics at the same time that they are answering questions on employer-based retirement plans. We also use information on the respondent's household income. For this variable, we aggregate income reported in Waves 5–7, so that we have an annualized measure.
We then merge in information from three topical modules – the Retirement and Pension Plan Coverage module from Wave 7, the Assets and Liabilities module from Wave 6, and the Adult Well-Being module from Wave 5. Ideally, information on employer-based retirement plans, loan holdings, and material hardships would have been asked in the same wave, and so all variables would represent responses covering the same timeframe. Unfortunately, the SIPP asked these questions in different waves, and so the reference periods for each set of questions do not coincide perfectly with each other. However, these questions are all asked within one calendar year, and so we treat the data as a cross-section.Footnote 13
From the Wave 7 – Retirement Plan and Pension Coverage module, we extract information on participation in and contributions to employer-based plans. In this module, individuals that are identified as workers in the core module of Wave 7 are asked first to identify the main job at which they work, and then they are asked about pension plans available at that job. Respondents are asked whether the employer offered a retirement or pension plan to anyone in the company, and if so, are asked follow-up questions regarding what type of plan it is (in particular, whether it is a DC plan) and whether the respondent is included in the company plan. If they are included in the company plan, respondents are asked whether they contributed; if they are not included, respondents are asked for the reason why they were not included. Using these answers we code up three variables. The first denotes that the respondent's firm offers a DC plan to any employees, the second denotes that the respondent was offered such a plan by their employerFootnote 14 , and the third denotes that the respondent contributed to the plan.
We then merge to this data information from the Wave 5 – Adult Well-Being topical module. This module seeks to determine whether respondents had trouble meeting basic needs in the prior year. Respondents are first asked whether there was a time during the past 12 months when they did not meet all of their essential expenses. Respondents are then asked a number of questions regarding whether in the past 12 months they were not able to meet particular expenses. These include not paying the rent or mortgage; not paying gas, oil, or electric bills; whether the utility shut off service; whether the telephone company disconnected service; not going to the doctor or hospital when needed; not seeing the dentist when needed; whether there was often or sometimes not enough to eat; whether sometimes or often food that was bought did not last and there was no money to buy more; and whether sometimes or often balanced meals were not affordable. We combine some of these categories to create four indicator variables. These denote having difficulties with housing, utilities, medical or dental, or food expenses.
Finally, we merge in variables from the Wave 6 – Assets and Liabilities topical module. In this set of questions, respondents are asked about the presence and amounts of various types of debt on the last day of the survey's reference period. We create variables denoting the presence and amounts of five types of debt, held either individually or jointly with a spouse: store or credit card debt, bank or credit union loans (other than car or housing), car debt, house debt, and other debt (including medical bills, private loans, educational loans, and others, but excluding car and housing loans).
When this process is complete, we have observations at the individual level, including information on retirement plan participation, employer offer of a plan, debt holding and material hardship. Finally, we restrict the sample to include only individuals aged 22–65 who are employed and are not business owners. To account for oversampling of low-income respondents, all tabulations and regressions were performed using the SIPP's final weights.
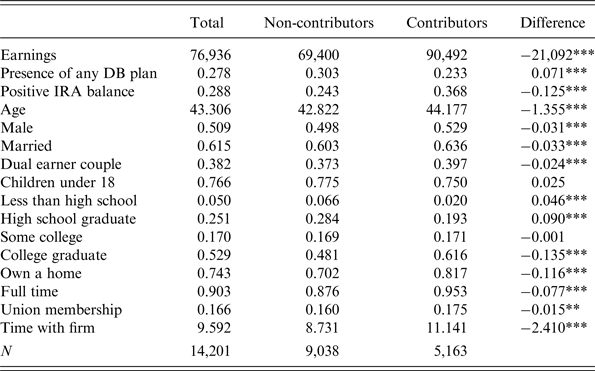
Table 1 presents sample statistics. Means are presented for the entire sample, as well as contributors and non-contributors separately, along with the statistical significance of differences between these groups. The average age of the sample is 43, with contributors slightly older than non-contributors on average. Contributors tend to be more likely to work full time, be a member of a union, have higher earnings, and be more educated, while non-contributors are more likely to have a DB plan. Slightly more than half of the sample is male, while 61.5% of the sample is married.
Table 1. Sample statistics
Legend: *p < 0.1, **p < 0.05, ***p < 0.01.
Notes: Data from the 2004 Survey of Income and Program Participation.
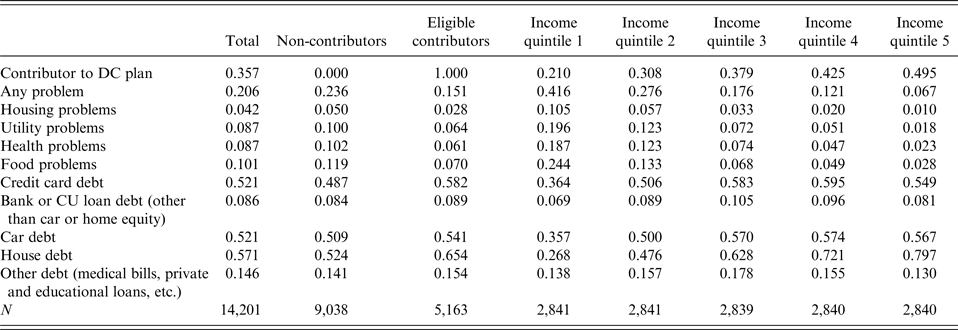
In Table 2, we present means of the main dependent and independent variables for the whole sample, for contributors and non-contributors separately, and for each quintile of household income.Footnote 15 In the full sample, 35.7% of respondents are contributors to a DC plan. That fraction increases with income, from a low of 21.0% in the bottom income quintile to 49.5% in the top income quintile. Almost 21% of the sample reports facing some type of material hardship, with non-contributors being more likely to report a hardship than contributors. Not surprisingly, the presence of material hardships tends to be concentrated in the lower income quintiles, with 41.6% of the lowest income quintile reporting some type of material hardship compared with just 6% in the highest income quintile. Finally, 52.1% of the sample holds credit card debt, 8.6% hold some bank or credit union debt (other than car or house debt), 52.1% hold car debt, 57.1% hold house debt, and 14.6% hold some other type of debt (including medical bills, private loans, and education loans). Across all types of debt, contributors are more likely to hold debt than non-contributors. With the exception of house debt, which increases across household income quintiles, debt-holding tends to be highest for income quintiles three and four, with lower fractions holding loans among both higher and lower income quintiles.
Table 2. Presence of DC account, material hardship and debt, by contributor status and income quintiles
Notes: Data from the 2004 Survey of Income and Program Participation.
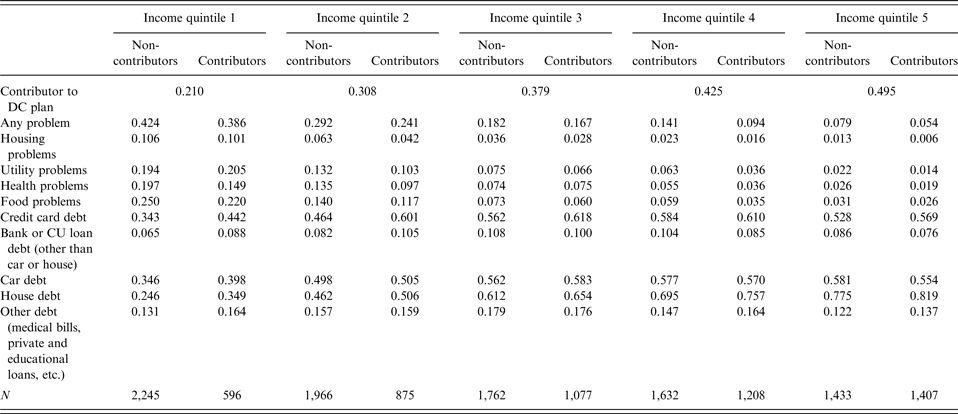
Finally, in Table 3 we examine whether any differences in material hardship between contributors and non-contributors emerge when we look within household income quintiles. For the four highest income quintiles, material hardships tend to be higher among non-contributors. Among the lowest quintile, however, utility problems are more prevalent among contributors. Finally, debt holding tends to be higher among contributors than non-contributors, and this is particularly true in the two lowest income quintiles.
Table 3. Presence of material hardship and debt, by contributor status × income quintile
Notes: Data from the 2004 Survey of Income and Program Participation.
Taken together, then, these tabulations are not consistent with DC account participation leading to an increase in material hardships among contributors overall, though contributing and hardships are positively related among the lowest income quintiles for particular types of hardships. Contributing does, though, appear to be positively related to debt-holding. However, one obviously cannot interpret any differences in material hardships and loan holding across contributors and non-contributors found above as the causal impact of contributing, since there are a number of characteristics of individuals (for example, tastes for savings and stability of employment) that are correlated both with contributing behavior and material hardship and loan holding.
4. The estimation method
To more convincingly identify the impact that contributing to a DC plan has on whether the individual faces a material hardship or holds high interest debt, we estimate equations of the form
where P i is an indicator denoting whether individual participates in an employer-based savings plan, Hardship i is an indicator variable reflecting the presence of one of the four types of material hardship, Debt i is an indicator variable reflecting debt holding of one of the three types, the X i vector contains demographic, income, savings, and employer characteristics, and ε hi and ε di are error terms.Footnote 16
Estimating equations (1) and (2) using ordinary least squares is likely to be problematic, however, due to unobservable characteristics that could be correlated with both the choice to participate in an employer-based retirement saving plan, debt holdings, and the presence of a hardship. For example, individuals who have a greater taste for saving will be more likely to participate in an employment-based plan, and less likely to hold debt of any type. In addition, having material hardships or holding more debt may directly reduce the propensity for an individual to participate in a DC plan. For both of these reasons, the estimated effect of participating in a plan on debt will be biased downward toward finding that participating in a retirement plan makes it less likely that the individual will hold debt.
To deal with these issues, the standard solution is to instrument for the endogenous regressors using a variable that is correlated with participation, uncorrelated with the error term, and so it only impacts the presence of hardship through its effect on participation. For this, we follow Poterba et al. (Reference Poterba, Venti and Wise1996) and others by instrumenting for participating in an employer-based plan using a variable that denotes whether the individual's employer offers a plan to any employee.Footnote 17 Clearly, such a variable will be correlated with the choice to participate in a plan, so the remaining concern is whether the employer choice is correlated with the employee's taste for savings. Poterba et al. (Reference Poterba, Venti and Wise1996) argues that, conditional on income, 401(k) eligibility can be taken as exogenous, since the choice to offer a plan is made by the employer.
However, Benjamin (Reference Benjamin2003) argues that even within income groups, several characteristics of 401(k) eligible individuals are likely to be correlated with tastes for saving if individuals sort into employers. To attempt to ensure that an employer offering is uncorrelated with the tastes of the employee, we control for as many other characteristics as we can that are likely to determine the individuals choice of employer, including log earnings, age and age squared, gender, marital status, being a dual-earner couple, educational attainment, the presence of children under the age of 18, home ownership, DB plan participation, IRA ownership, job tenure, and indicator variables for the individual's industry, union membership, and working full time.Footnote 18
Although the dependent and endogenous variables are binary variables, we follow Angrist and Pischke (Reference Angrist and Pischke2009), who argue that these additional complications can be ignored, and estimate a linear probability model using instrumental variables. Since this method has the advantage of ease of interpretation of coefficients, we use this as our base specification. Alternatively, one could estimate an IV probit model, which we also estimate as a specification check.
5. The impact of participation on hardships and debt
We now examine whether participation in an employer-based retirement plan causes an individual to either be more likely to face some sort of material hardship, or to be more likely to take on more debt.
5.1 Impact on material hardships
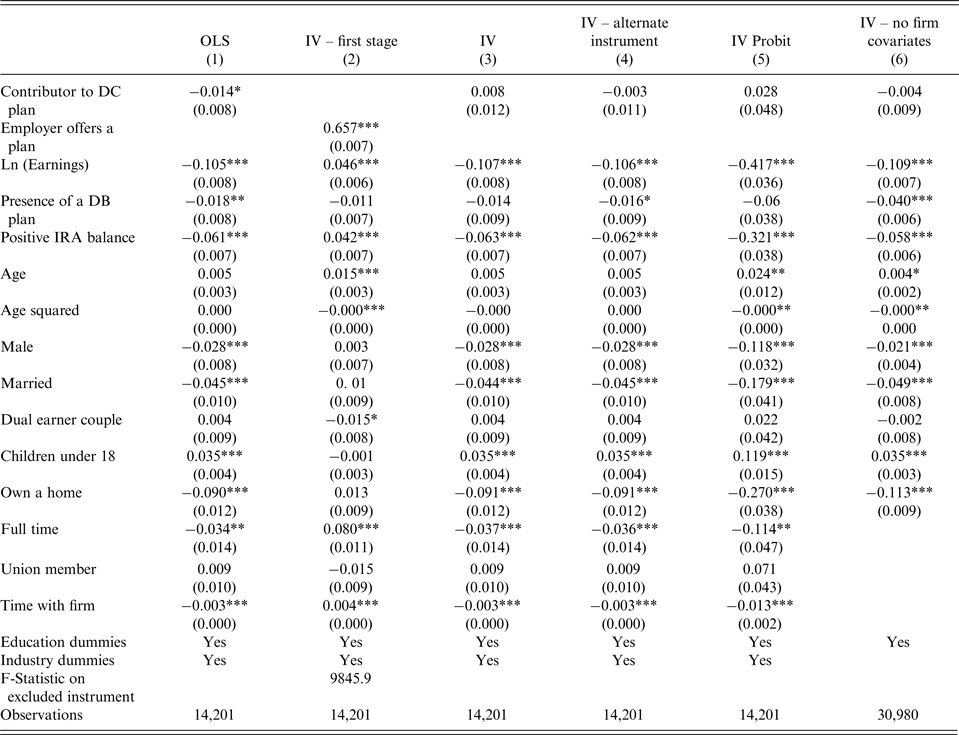
Table 4 presents estimates of the effect of contributing to a DC plan on the presence of any type of material hardship.
Table 4. Effect of contributing to a DC plan on the presence of any material hardship
Legend: *p < 0.1, **p < 0.05, ***p < 0.01.
Notes: Data from the 2004 Survey of Income and Program Participation. Column 5 presents marginal effects from the IV Probit specification. Robust standard errors clustered at the household level are in parentheses.
In Column 1, we present estimates from an OLS regression of a linear probability model in which the dependent variable indicates the individual reporting any material hardship (including housing, utility, health, and food problems), and the independent variable of interest indicates contributing to a DC retirement plan. The coefficient in this specification is −0.005, and is not statistically significant. However, as noted above, such a coefficient will be biased downward if individuals who are less likely to encounter financial problems are also more likely to contribute to DC plans.
We next we instrument being a contributor to a DC plan with the individual's employer offering a DC plan to any employees. Results from the first stage regression are presented in Column 2. Weak instruments are clearly not a concern in this specification, as the F-statistic on the excluded instrument is in excess of 9,000. In Column 3, which presents results from the second stage, the coefficient on being a DC plan contributor switches sign to 0.008, which would suggest that those who contribute to a DC plan are 0.8 percentage points more likely to face material hardship, though the coefficient is statistically insignificant.Footnote 19 In Column 4, we use the alternate instrument, which reflects that the individual was offered a plan by their employer. The coefficient in this specification is still insignificant, but is now negative at −0.003. This would be expected if people who are less likely to have material difficulties tend to choose employers that offer them a DC plan, since this instrument would be still be negatively correlated with the error term, and so would not completely eliminate the bias in Column 1.
Column 5 presents marginal effects from an IV Probit specification, where the instrument is the employer offering a DC plan. Although the magnitude of the effect is larger in this specification is larger, the qualitative result is still the same, in that the coefficient on being a contributor to a DC plan is positive, but insignificant. This result suggests that the functional form assumptions implicit in Column 3 do not appear to be driving those results.
Finally, in Column 6, we rerun the specification in Column 3 with the original instrument, but omit industry dummies, whether an individual works full time, and whether the individual is a union member. Including these variables has the advantage of controlling better for other characteristics of the individual and firm that are likely to determine whether an employer offers a plan, so that (conditional on these variables) employer offering is more likely to be uncorrelated with the tastes of the employee, making our instrument more likely to be valid. However, for a substantial segment of the sample, one or more of these variables are missing, and so including them as regressors results in a decreased sample size. The results in Column 6 suggest that including these variables with the resulting decrease in sample size does not qualitatively affect the results. The estimated coefficient on contributing to a DC plan is now −0.004, and is still statistically insignificant.
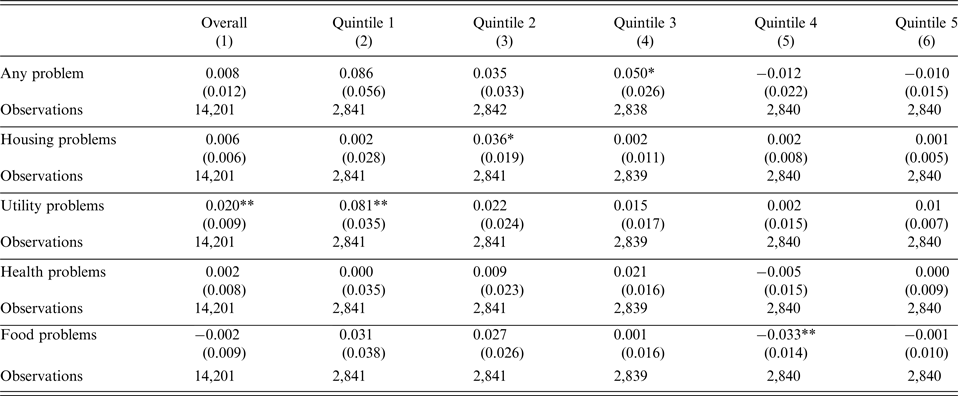
The results in Table 4 suggest that contributing to a DC plan may lead to a small positive increase in material hardships in the sample as a whole. However, for some of the people in the sample, particularly those with high income, one might not expect that contributing to a DC plan would lead to material hardship. Thus, in Table 5, we cut the sample by household income quintile to examine whether contributing to a DC plan leads to material hardships for lower income individuals.
Table 5. Effect of contributing to a DC plan on material hardship, by type and income quintile
Legend: *p < 0.1, **p < 0.05, ***p < 0.01.
Notes: Data from the 2004 Survey of Income and Program Participation. All specifications include the same set of covariates as in Table 4. Robust standard errors clustered at the household level are in parentheses.
The top panel presents results for instrumental variable specifications like those in Column 3 of the previous table, in which the dependent variable denotes the individual reporting any material hardship. For the lowest three income quintiles, contributing to a DC plan is estimated to increase the presence of any type of material hardship, with an 8.6 percentage point increase for the lowest quintile, a 3.5 percentage point increase for the second-lowest quintile, and a 5.0. percentage point increase for the middle quintile. Further, the estimates for quintile 3 are statistically significant at the 10% level. As expected, contributing to a DC plan is not estimated to increase material hardships for the top two income quintiles, as the coefficients in those specifications are very small, negative, and statistically insignificant.
In the bottom four panels, the dependent variable is changed to indicate the presence of one of the four types of material hardship (related to housing expenses, utility expenses, health expenses, or food expenses). Across these specifications, the coefficient on contributing to a DC plan in the housing-related hardships specification is statistically significant for the second quintile, and the coefficient in the utility-related hardships is statistically significant for the first quintile. In addition, the coefficients follow a general pattern of larger and positive coefficients for lower quintiles, and smaller (and sometimes negative) coefficients for higher income quintiles.Footnote 20 These results suggest that contributing to a DC plan does not tend to increase a particular type of hardship, but rather may lead to higher probabilities of most types of material hardships for those in lower household income quintiles.
5.2 Impact on debt holdings
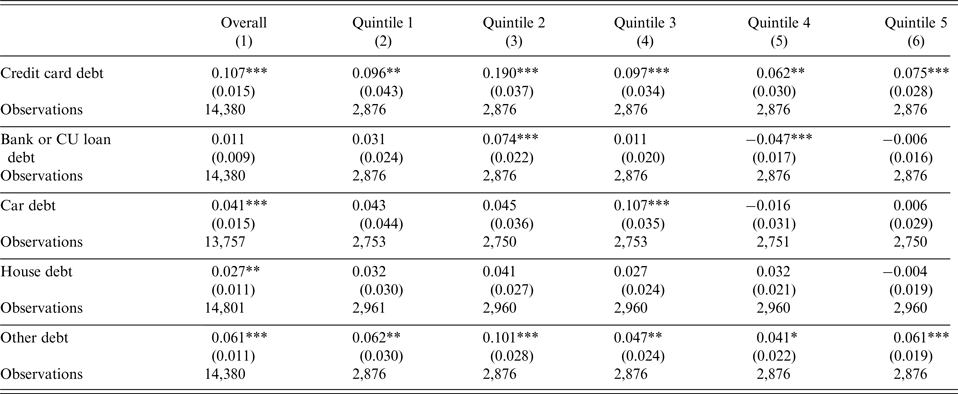
Table 6 presents the results from specifications in which the dependent variable denotes the respondent holding debt of some type. These specifications mirror those in Column 3 of Table 4, in which contributing is instrumented with an indicator for being offered a plan, and individual and firm covariates are included.
Table 6. Effect of contributing to a DC plan on debt holding, by type and income quintile
Legend: *p < 0.1, **p < 0.05, ***p < 0.01.
Notes: Data from the 2004 Survey of Income and Program Participation. All specifications include the same set of covariates as in Table 4. Robust standard errors clustered at the household level are in parentheses.
In the top panel, we estimate the impact of contributing to a DC plan on having credit card debt. Among the sample as a whole, the coefficient on being a DC plan contributor is 0.107 and is statistically significant, suggesting that those who contribute to DC plans are 10.7 percentage points more likely to owe some amount on store bills or credit cards. In addition, the estimated coefficients are positive and statistically significant for all income quintiles. The largest estimated effect is for the second quintile, for whom contributing to a DC plan is estimated to increase the probability of holding credit card debt by 19 percentage points. Interestingly, this effect is larger than that for the first income quintile, perhaps reflecting that the lowest income respondents are less able to acquire credit cards than those in higher income quintiles. As expected, the lowest impact on debt holding is estimated for the highest income quintile, for which contributing to a DC plan is estimated to increase the probability of holding credit card debt by 7.5 percentage points. In the second panel, only for the second income quintile is the coefficient statistically significant, suggesting that contributing to a DC plan increases the fraction of this quintile with bank or credit union loan debt by 7.4 percentage points.
The third and fourth panels present the results of the impact of contributing to a DC plan on car and house debt. For both of these types of debt, contributing is estimated to increase debt-holding in the entire sample, with a 4.1 percentage point increase in holding car debt (centered primarily in the third income quintile), and a 2.7 percentage point increase in holding house debt.
Finally, the bottom panel presents results of the impact of contributing to a DC plan on the presence of other debt, including medical bills, private loans, and educational loans. Here, in the entire sample, contributing to a DC plan is estimated to increase the probability of holding these types of debt by 6.1 percentage points. Looking across income quintiles, all coefficients are positive and statistically significant, and the estimated effect is largest for the lowest two income quintiles. However, the magnitude of these coefficients suggests that some of these point estimates may be too large to be plausible.Footnote 21 Nevertheless, the results do suggest that this type of debt-holding increases when individuals contribute to DC plans.
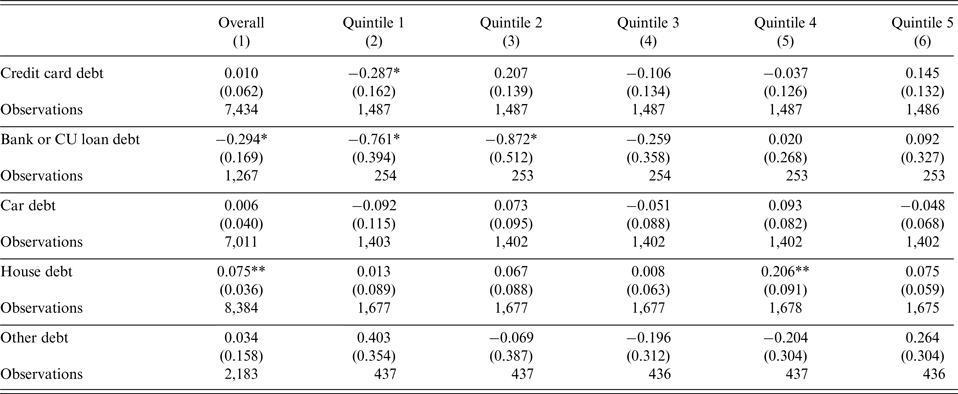
In Table 7, to examine whether contributing to a DC plan leads to greater amounts of debt, we change the dependent variable to indicate the log amount of debt of a particular type, and cut the sample to include only those who report holding some debt.
Table 7. Effect of contributing to a DC plan on amount of debt held among debt holders, by type and income quintile
Legend: *p < 0.1, **p < 0.05, ***p < 0.01.
Notes: Data from the 2004 Survey of Income and Program Participation. All specifications include the same set of covariates as in Table 4. Robust standard errors clustered at the household level are in parentheses.
Looking at the first column, contributing to a DC plan only appears to have a significant positive effect on house debt among debt-holders, as all of the other coefficients are with coefficients being either small and insignificant or negative.Footnote 22 In addition, looking across income quintiles, the only positive and significant effect appears for the fourth quintile when the dependent variable is the amount of house debt.
Taken together, then, these results suggest that contributing to a DC plan appears to have a significant effect on debt holding on the extensive margin (whether or not the individual holds any debt) but not on the intensive margin (how much is held among debt holders).
6. Conclusion
In this paper, we used data from the 2004 Survey of Income and Program Participation to examine the extent to which contributing to 401(k)-type accounts leads to an increase in these short-term financial difficulties, particularly among low-income individuals. The results implied that participating in a DC plan leads to a higher probability of any types of material hardship for those in lower income quintiles. In addition, the likelihood of holding credit card or other debt increases across quintiles, though the amount of debt does not appear to increase.
The hardship results suggest that there may be a downside of encouraging participation in DC plans among low-income individuals. By setting aside funds for retirement in a DC plan, they may not have sufficient amounts available to meet all of their material needs, and so may need to put off paying a utility bill or repairing their home.
The debt results, however, could be viewed two different ways. If setting aside funds in a DC plan is leading individuals to have to take out a loan or use a credit card to pay needed expenses, then the positive impact of DC participation on debt holding would clearly be unwelcome. On the other hand, it may be that participating in a DC plan increases familiarity with the financial system, making the individual more likely to use debt instruments. In this case, the increase debt-holding among DC plan participants may not be a bad thing, in that it integrates them more fully into the financial system without leading to a large increase in the amount of debt that is held.
Overall, these results suggest that participating in a tax-preferred retirement savings account may not be unambiguously positive. Even though the population studied in this paper chose to participate in a DC plan, we still found significant impacts of that participation on some measures of hardship and debt holding, and it is possible that individuals who are defaulted into participating may exhibit greater impacts. As such, policymakers should compare the beneficial effects of better preparation for retirement against the possibly negative impact of increased hardships and debt holding when deciding whether to further increase DC plan participation among low-income populations.


