


1. Introduction
Fiscal consolidation is pivotal to achieving fiscal sustainability and enhancing economic stability, particularly when there is high government debt and persistent budgetary imbalances. As countries grapple with mounting debt levels and economic pressures, fiscal consolidation becomes essential to restore fiscal health and ensure long-term economic stability. This process involves a broad array of measures aimed at reducing budget deficits and government debt, with the goal of achieving a balanced budget and curbing excessive borrowing that could lead to a debt crisis. Fiscal consolidation typically involves a combination of revenue increases and expenditure reductions. Revenue increases can be achieved through various means, such as raising taxes, improving tax compliance, and broadening the tax base. Expenditure reductions may involve cutting public spending on various programs, implementing spending reviews to eliminate inefficiencies, and reforming public sector wages and benefits. Structural reforms, such as improving public sector efficiency and fostering a more conducive environment for economic growth, are also crucial components of fiscal consolidation strategies (Alesina and Ardagna Reference Alesina and Ardagna2010, Alesina et al. Reference Alesina, Favero and Giavazzi2019). These measures are intended to return fiscal balances to a sustainable level, thereby preventing excessive borrowing and reducing the risk of a fiscal crisis.
A critical metric in assessing the effectiveness of fiscal consolidation is the cyclically adjusted primary balance (CAPB), which adjusts the primary balance (defined as the difference between government revenues and noninterest expenditures) for the effects of economic fluctuations. By accounting for these cyclical effects, the CAPB provides a more accurate reflection of the government’s fiscal stance. This measure allows policymakers and researchers to evaluate whether fiscal consolidation measures are effectively reducing government debt relative to GDP, while distinguishing between temporary fluctuations in fiscal balances due to economic conditions and more permanent changes resulting from consolidation efforts.
The literature on fiscal consolidation offers a nuanced and sometimes contradictory view of its effects on economic growth and debt sustainability. Numerous studies emphasize the role of government debt thresholds with specific levels of public debt beyond which it may impact economic growth. Estimates of these thresholds vary widely, with some studies suggesting that debt thresholds for negative economic effects range from as low as 30% to as high as 120% of (Reinhart et al. Reference Reinhart, Reinhart and Rogoff2012, Bexheti et al. Reference Bexheti2020, Bhimjee and Leão Reference Bhimjee and Leão2020, Bousnina and Gabsi Reference Bousnina and Gabsi2022). This variation highlights the difficulty of determining the optimal debt level and the challenges inherent in effectively implementing fiscal consolidation. Furthermore, the effects of fiscal consolidation on the debt-to-GDP ratio remain a subject of debate. Some research indicates that fiscal consolidation efforts successfully reduce the debt-to-GDP ratio, suggesting effective debt management (Martin Reference Martin2020, Afonso and Leal Reference Afonso and Leal2022). However, other studies propose that fiscal consolidation may paradoxically increase the debt ratio due to its potential negative effects on economic growth (Müller Reference Müller2014). This contradiction highlights the need for a more thorough understanding of the conditions under which fiscal consolidation measures are effective and the mechanisms through which they influence debt dynamics.
1.1. Problem statement and objective of the study
Despite its importance, significant gaps remain in the literature regarding the optimal debt level for initiating effective fiscal consolidation. The debate centers around several key issues, including debt thresholds for effective consolidation, and no consensus exists on the specific level of government debt that signals when fiscal consolidation should be activated. Studies suggest several thresholds, from as low as 30% to as high as 120% of GDP (Reinhart et al. Reference Reinhart, Reinhart and Rogoff2012, Bexheti et al. Reference Bexheti2020). This lack of agreement highlights the complexity of determining the optimal debt level and challenges in defining when consolidation measures are necessary. Secondly discusses the impact on the debt-to-GDP ratio, where the literature presents conflicting views on how fiscal consolidation affects the debt-to-GDP ratio. Some studies find that fiscal consolidation efforts successfully reduce this ratio, indicating effective debt management (Afonso, Alves and Tovar Jalles 2022, Martin et al. Reference Martin, Mikołajczak, Baekkeskov and Hartley2022). Conversely, other research suggests that fiscal consolidation may paradoxically increase the debt ratio due to its adverse effects on economic growth (Georgantas et al. Reference Georgantas, Kasselaki and Tagkalakis2023). This contradiction highlights the need for a more nuanced understanding of the relationship between consolidation measures and debt dynamics. Third, the conditions for successful Consolidation, which determine the effectiveness of fiscal consolidation, may depend on specific economic conditions, such as the business cycle phase and initial public debt level. Case in point, studies indicate that consolidation efforts may be more successful when economic conditions are favorable, whereas attempts during recessions could be counterproductive (Fatás and Summers Reference Fatás and Summers2018, Aldama and Creel Reference Aldama and Creel2022). Understanding these conditions is essential for designing policies that effectively balance debt reduction with economic growth.
This study seeks to address these critical gaps by providing a comprehensive analysis of the interplay between government debt thresholds, economic growth, and primary balance, with a focus on Organisation for Economic Co-operation and Development (OECD) countries. By examining how different levels of government debt affect fiscal consolidation outcomes and economic stability, this research aims to offer valuable insights into the design and implementation of effective fiscal policies. In doing so, it aims to clarify the relationship between debt levels and fiscal consolidation, providing a clearer understanding of how to achieve sustainable GDP per capita while managing public debt effectively. This study’s central economic questions focus on unraveling the effects of general government debt on GDP per capita and the primary fiscal balance in the context of fiscal consolidation. Additionally, this research explores the implications of a specific threshold of general government debt on these economic variables during fiscal consolidation. The key economic questions addressed in this study are as follows:
-
1. What are the impacts of fiscal consolidation on GDP per capita and primary fiscal balance in OECD countries?
-
2. What is the government’s threshold impact on GDP per capita in the present of fiscal consolidation?
-
3. What is the impact of government expenditure and government revenue on GDP per capita?
-
4. What is the impact of the disaggregated government expenditure and tax categories impact on GDP per capita?
-
5. Variation of government threshold that impacts the GDP per capita during fiscal consolidation?
-
6. What is the government’s threshold impact on primary fiscal balance in the present of fiscal consolidation?
-
7. What is the impact of government expenditure and government revenue on primary fiscal balance?
-
8. What is the impact of the disaggregated government expenditure and tax categories impact on primary fiscal balance?
-
9. Variation of government threshold that impacts the primary fiscal balance during fiscal consolidation?
1.2. Key macroeconomic analysis
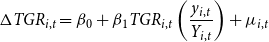
Figure 1 provides key insights into the fiscal dynamics of OECD countries, particularly the interaction between GDP per capita, government debt, and the cyclically adjusted primary balance (CAPB). These relationships carry significant implications for fiscal policy and debt sustainability in advanced economies. Graph (a) reveals a positive association between GDP per capita and CAPB, suggesting that higher income levels are linked to stronger fiscal positions. This pattern reflects the ability of high-income OECD countries to implement more effective fiscal policies, leveraging greater economic capacity to sustain fiscal discipline and stabilize public finances. It aligns with the conventional view that wealthier economies maintain higher fiscal buffers, reducing their vulnerability to fiscal stress. Graph (b) highlights a nonlinear relationship between general government gross debt and CAPB. At lower debt levels, increasing debt is associated with a deterioration in CAPB, indicating weaker fiscal discipline. However, at higher debt thresholds, CAPB begins to rise, suggesting a more aggressive fiscal consolidation response. This pattern is consistent with the notion that once debt reaches unsustainable levels; OECD governments are compelled to adopt stringent fiscal measures to prevent further fiscal deterioration. The presence of such debt thresholds highlights the importance of early intervention to avoid abrupt and costly fiscal consolidation efforts.
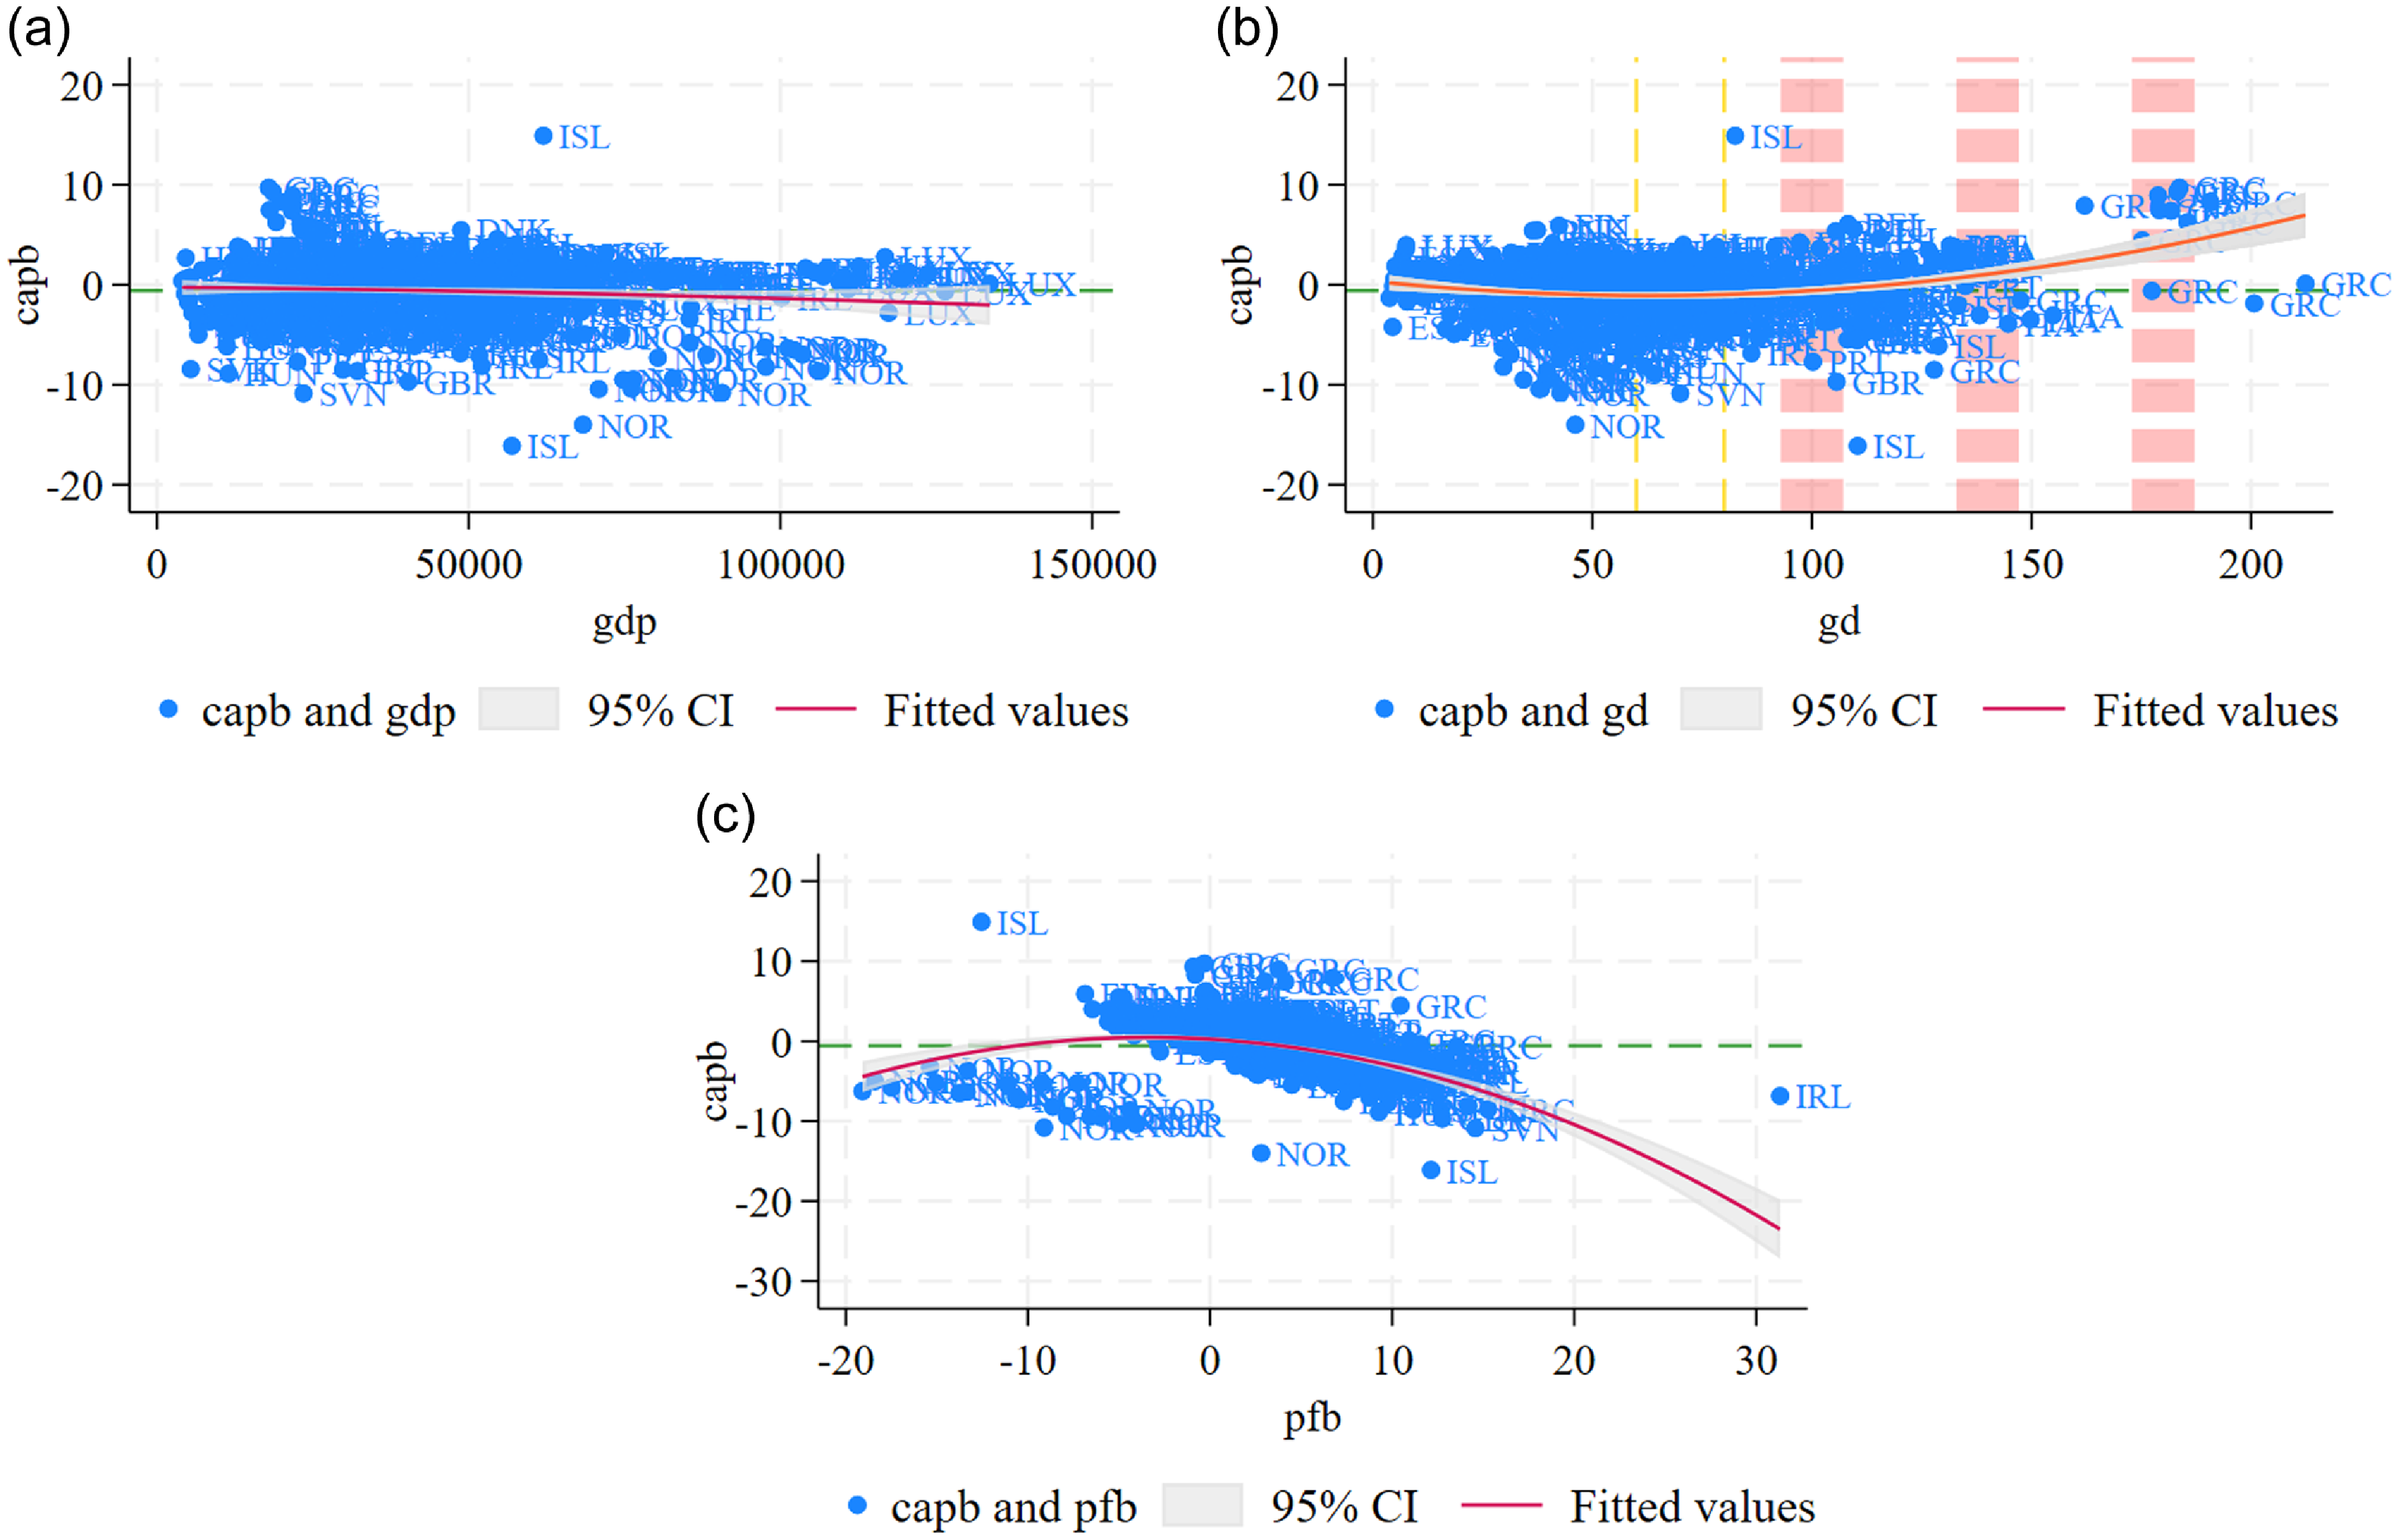
Figure 1. Economic variables of interest. Note that $gdp$
GDP per capita
$gdp$
GDP per capita $\; pfb\;$
primary fiscal balance and
$\; pfb\;$
primary fiscal balance and $gd$
general government gross debt. The green horizontal line represents the average cyclically adjusted primary balance. The vertical yellow line on the left marks the 60% threshold, while the one on the right indicates the 80% threshold. The red lines represent all higher thresholds above 90%.
$gd$
general government gross debt. The green horizontal line represents the average cyclically adjusted primary balance. The vertical yellow line on the left marks the 60% threshold, while the one on the right indicates the 80% threshold. The red lines represent all higher thresholds above 90%.
Graph (c) illustrates that an increase in the primary fiscal balance is positively correlated with CAPB, reinforcing the role of fiscal consolidation in shaping CAPB dynamics. At lower primary balances, CAPB remains below the historical mean, signaling weaker consolidation efforts. In contrast, higher primary balances are associated with CAPB exceeding the mean, indicating stronger fiscal adjustment. This suggests that proactive fiscal policies aimed at improving the primary balance are crucial in maintaining debt sustainability and preventing excessive fiscal pressures. These trends outline the importance of timely and well-calibrated fiscal consolidation in OECD countries. While fiscal adjustments become more pronounced at higher debt levels, maintaining a sound primary balance and leveraging GDP per capita to support fiscal discipline are essential for ensuring long-term debt sustainability. Further highlight the need for a forward-looking fiscal strategy that balances GDP per capita with responsible fiscal management, mitigating the risks of abrupt fiscal adjustments in response to rising debt burdens.
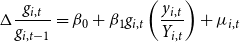
Figure 2 provides a graphical representation of the key economic indicators namely, general government gross debt, GDP per capita, and the primary fiscal balance across the sampled OECD countries. A salient observation from the figure is that a substantial number of countries exhibit gross government debt levels exceeding the 60% of GDP threshold, which has been widely cited in the literature as a critical point beyond which debt can have adverse macroeconomic consequences Alloza et al. (Reference Alloza, Andrés, Pérez and Rojas2020). Debt levels surpassing this threshold may exacerbate fiscal vulnerabilities by increasing the cost of debt servicing, thereby crowding out expenditure on growth-enhancing investments such as infrastructure, education, and health.
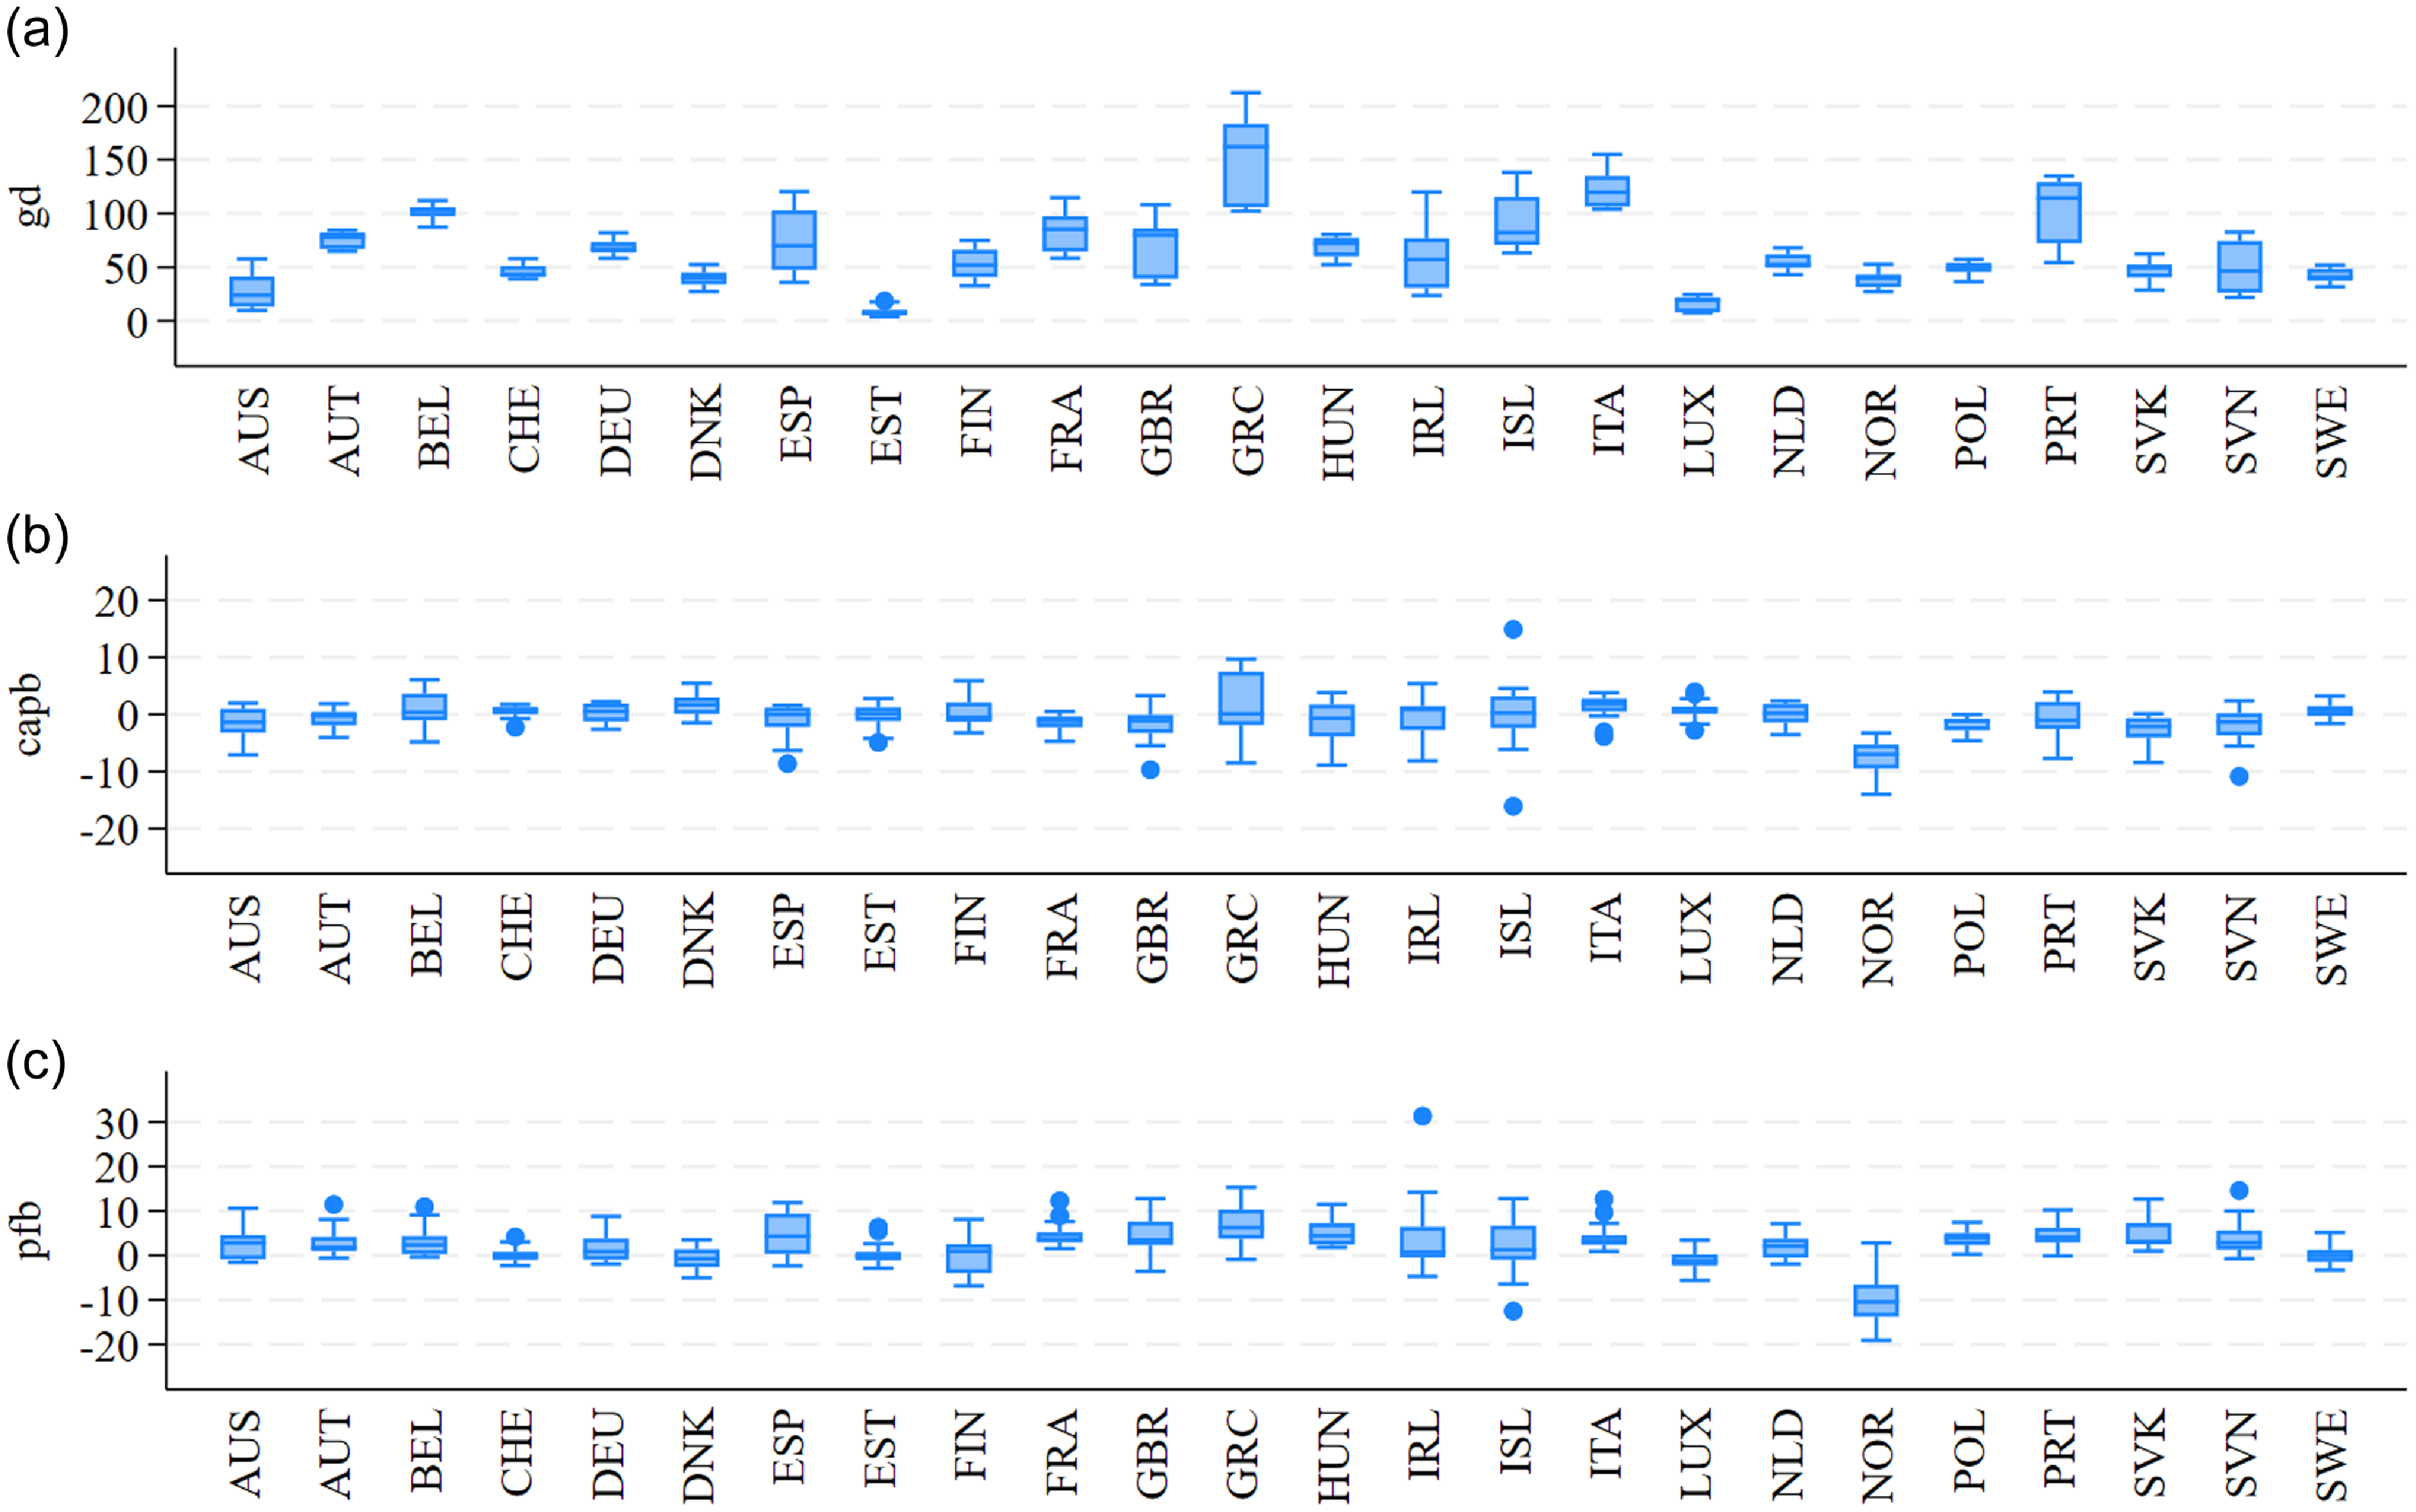
Figure 2. Each country’s economic variables of interest. Note that $\; gd\;$
general government gross debt,
$\; gd\;$
general government gross debt, $gdp\;$
GDP per capita and
$gdp\;$
GDP per capita and $pfb$
primary fiscal balance. Note that AUS Australia, AUT Austria, BEL Belgium, DNK Denmark, EST Estonia, FIN Finland, FRA France, DEU Germany, GRC Greece, HUN Hungary, ISL Iceland, IRL Ireland, ITA Italy, LUX Luxembourg, NLD Netherlands, NOR Norway, POL Poland, PRT Portugal, SVK Slovak Republic, SVN Slovenia, ESP Spain, SWE Sweden, CHE Switzerland and GBR United Kingdom.
$pfb$
primary fiscal balance. Note that AUS Australia, AUT Austria, BEL Belgium, DNK Denmark, EST Estonia, FIN Finland, FRA France, DEU Germany, GRC Greece, HUN Hungary, ISL Iceland, IRL Ireland, ITA Italy, LUX Luxembourg, NLD Netherlands, NOR Norway, POL Poland, PRT Portugal, SVK Slovak Republic, SVN Slovenia, ESP Spain, SWE Sweden, CHE Switzerland and GBR United Kingdom.
Moreover, elevated debt burdens can erode investor confidence, potentially leading to higher risk premia and reduced capital inflows, particularly in fiscally constrained economies. In contrast, the patterns observed in GDP per capita and the primary fiscal balance appear to be markedly heterogeneous across countries, suggesting a non-uniform response to fiscal conditions. This divergence implies that the nexus between government indebtedness and macroeconomic performance is neither linear nor universally applicable. For some economies, rising debt levels are associated with deteriorations in GDP per capita, possibly due to increased uncertainty, weakened fiscal space, or diminished private sector confidence. For others, high debt may not be accompanied by a significant decline in GDP per capita, which could reflect stronger institutional frameworks, more effective fiscal rules, or greater market confidence in debt sustainability. This observed variability highlights the importance of country-specific factors, including the composition and maturity of debt, the credibility of fiscal policy, the structure of the economy, and the institutional capacity to implement consolidation measures. Additionally, the asymmetric responses of the primary fiscal balance to rising debt levels may indicate differences in policy priorities, political will, and the cyclical position of each country’s economy. Taken together, the figure reinforces the notion that while debt thresholds like the 60% benchmark serve as important reference points, the economic implications of breaching such levels are deeply context-dependent and require a nuanced, multi-dimensional analysis.
1.3. Key findings
This study provides a comprehensive empirical investigation into the macroeconomic effects of fiscal consolidation and the composition of public finances on economic performance within OECD countries. Specifically, it examines how fiscal consolidation interacts with GDP per capita and the primary fiscal balance, while also exploring the threshold effects of government debt and the disaggregated impact of expenditure and tax categories on fiscal and economic outcomes. Employing a combination of Fixed Effects (FE), Random Effects (RE), and Fixed-Effect Threshold Models over a panel dataset, the study identifies both linear and nonlinear relationships that have significant implications for fiscal policymaking during consolidation periods. What is the impact of fiscal consolidation on GDP per capita and primary fiscal balance? It is found that 1% increase in fiscal consolidation leads to increase in GDP per capita by 0.0231%. These findings suggest that fiscal consolidation can serve as a catalyst for economic growth, albeit with differing magnitudes across estimation techniques. However, this growth effect is counterbalanced by evidence that fiscal consolidation adversely affects the primary fiscal balance, reducing it by 0.416%. This paradox highlights the potential short-term fiscal costs of consolidation, even in the presence of positive growth dynamics, possibly due to reduced revenues or delayed expenditure adjustments. Other key question of interest is what is the government’s threshold impact on GDP per capita and primary fiscal balance in the present of fiscal consolidation?Footnote 1 It found that a critical nonlinearity in the relationship between government debt and GDP per capita and primary fiscal balance. A government debt threshold of 31.4% of GDP is identified, beyond which government debt exerts a significantly negative effect on GDP per capita. Moreover, a separate threshold analysis finds that government debt threshold exceeding 86.7% of GDP has a statistically significant detrimental effect on the primary fiscal balance. These findings provide empirical validation for the existence of fiscal sustainability thresholds, where debt levels beyond certain points may undermine macroeconomic stability.
In a far as what is the impact of government expenditure and government revenue on GDP per capita and primary fiscal balance?Footnote 2 It is found that government expenditure exerts a negative and statistically significant effect on GDP per capita. A 1%-point increase in the share of government expenditure relative to GDP is associated with a reduction in GDP per capita 1.04% to 1.17%. This inverse relationship may reflect the distortionary effects of excessive government spending, particularly when expenditures are allocated inefficiently or directed toward non-productive activities. Moreover, it may signal potential crowding-out effects, where increased public sector demand displaces private sector investment and consumption, ultimately impeding economic growth. In contrast, government revenue does not exert a statistically significant effect on GDP per capita in any of the model specifications. While the sign of the coefficient varies across estimations, the t-statistics remain below conventional thresholds for statistical significance. This indicates that variations in government revenue, at least in the short run, do not meaningfully influence GDP per capita. One possible explanation for this neutrality is the offsetting nature of government revenue policies. Where the positive effects of redistributive or growth-enhancing revenue measures are counterbalanced by the adverse effects of distortionary taxation or administrative inefficiencies. Turning to primary fiscal balance reveals that 1% increase in government result to 0.524% better fiscal performance. This counterintuitive result may be interpreted in the context of expenditure reforms, where increases in productive or well-targeted spending. Such as infrastructure investment or social protection measures. Coincide with fiscal consolidation efforts and structural adjustments that improve the fiscal stance. It also reflects cyclical improvements in revenue collection associated with higher public investment and economic activity, even if such dynamics are not directly captured by the revenue variable. As with GDP per capita, government revenue does not exhibit a statistically significant effect on the primary fiscal balance. This finding suggests that increases in revenue, in isolation, are not sufficient to generate improvements in the primary balance, possibly due to rigidities in the fiscal framework or offsetting increases in public expenditure.
The study also investigate what is the impact of the disaggregated government expenditure and tax categories impact on GDP per capita and primary fiscal balance?Footnote 3 In the far as the impact of government expenditure and taxation on GDP per capita in the context of fiscal consolidation. The results indicate that military expenditure significantly reduces GDP per capita, with a 1% increase leading to a 1.5% decline. In contrast, government spending on health and education positively affects GDP per capita, with a 1% increase in health expenditure resulting in a 2.7% increase, and a 1% rise in education expenditure leading to a 2.1% increase. Regarding taxation, personal income tax has a positive but modest effect, with a 1% increase yielding a 0.43% rise in GDP per capita, while indirect taxes exert a small negative impact, reducing GDP by 0.12% per 1% increase. Government consumption expenditure significantly harms GDP, with a 1% increase resulting in a 2.4% to 2.7% decrease in GDP per capita. These findings highlight the need for targeted fiscal consolidation policies, emphasizing the reduction of military spending and government consumption, while prioritizing health and education investments. On the other hand, investigates the disaggregated impacts of government expenditure and taxation on the primary fiscal balance, with a focus on fiscal consolidation policies. The results reveal that military expenditure has a positive effect on the primary fiscal balance, with a 1% increase leading to a 1.2% to 1.8% improvement. Similarly, spending on health and education contributes positively to the fiscal balance, with health expenditure showing a 0.25% to 0.33% increase and education expenditure resulting in a 0.53% increase per 1% rise. However, government consumption expenditure and gross fixed capital formation exhibit negative effects, with a 1% increase in consumption expenditure leading to a 0.17% to 0.18% decrease in the fiscal balance. Tax categories show mixed results: personal income tax improves the fiscal balance (0.03% to 0.10% increase), while corporate income tax, social security contributions, and indirect taxes exert a negative impact, with reductions ranging from 0.01% to 0.06%. These findings highlight the importance of controlling government consumption and prioritizing productive spending areas like health and education to maintain fiscal stability during consolidation efforts. The findings provide valuable insights for policymakers aiming to optimize fiscal policies in times of economic restraint.
Lastly the study investigate what is the variation of government threshold that impacts the GDP per capita and primary fiscal balance during fiscal consolidation?Footnote 4 The variation of government debt thresholds has notable implications for economic performance and fiscal stability in OECD countries. When government debt is below 31.40% of GDP, it tends to support GDP per capita growth by enabling investment in infrastructure and public goods. However, once debt exceeds 68.40%, GDP per capita is negatively affected due to factors like reduced private sector investment and higher borrowing costs. Interestingly, debt above this threshold can lead to positive growth again, possibly due to the implementation of fiscal reforms. Regarding the primary fiscal balance, debt levels over 80.70% of GDP increase the risk of fiscal deterioration, indicating that excessive debt can strain public finances. Yet, once debt surpasses 86.70%, improvements in the primary fiscal balance are likely as governments adopt stricter fiscal policies, such as austerity or tax reforms. These findings emphasize the need for policymakers to carefully monitor debt levels. Maintaining debt below the 68.40% threshold helps safeguard economic growth, while crossing these thresholds necessitates proactive fiscal adjustments to restore balance and prevent economic decline. Proper management of debt through strategic investments and fiscal reforms is key to sustaining long-term economic stability.
1.4. Significant of the study
Policymakers are encouraged to consider these insights in their fiscal planning, focusing on strategies that keep government debt within manageable levels to support long-term economic stability and growth. This study enhances the existing literature by providing a clearer understanding of how fiscal consolidation interacts with debt thresholds and economic performance, offering practical guidance for policymakers in managing public finances.
This study makes several important contributions to the literature on government debt, fiscal consolidation, and economic performance. Previous research has highlighted a range of debt thresholds affecting economic performance, with estimates varying significantly (Reinhart et al. Reference Reinhart, Reinhart and Rogoff2012, Liu and Lyu Reference Liu and Lyu2021). However, these studies often lack a concrete, universally applicable threshold. Our research identifies a critical gross debt threshold of 86.70% of GDP, which serves as a precise benchmark for assessing the impacts of debt on fiscal consolidation and economic stability (Georgantas et al. Reference Georgantas, Kasselaki and Tagkalakis2023). This specific threshold provides policymakers with a clear target for maintaining fiscal health. Although the existing literature generally addresses the impacts of fiscal consolidation, it often lacks specific quantifications. Our study provides detailed measurements of how fiscal consolidation affects GDP per capita and the primary fiscal balance, showing a reduction of 0.0240% in GDP per capita and a significant decrease of 1.366% in the primary fiscal balance (Alesina and Ardagna Reference Alesina and Ardagna2010). This quantification clarifies the short-term economic trade-offs associated with consolidation efforts. Using a fixed-effect threshold model with panel data from 24 OECD countries over a 22-year period, this study addresses the limitations of simpler models used in prior research. This methodological rigor enables us to capture non-linear relationships and dynamic interactions between government debt and fiscal consolidation more effectively than previous studies. Our research covers a broad sample of OECD countries from 2000 to 2022, overcoming limitations related to regional focus and data scope as seen in prior studies (Ciaffi et al. Reference Ciaffi, Deleidi and Di Domenico2024). This extensive analysis provides a more generalized view of the effects of debt thresholds on fiscal consolidation and economic performance, reconciling conflicting findings in the literature. Existing literature presents varying debt thresholds, ranging from 30% to 130% of GDP (Alesina et al. Reference Alesina, Favero and Giavazzi2019, Bexheti et al. Reference Bexheti2020). Our study refines this range by identifying a specific threshold within this spectrum, contributing to a more nuanced understanding of when debt levels adversely impact economic outcomes. By including a diverse set of OECD countries, this study offers insights into how different economic contexts influence the effectiveness of fiscal consolidation measures. This broader perspective helps address the limitations of single-country or region-specific analyses and provides a more comprehensive understanding of fiscal policy dynamics (Brady and Magazzino Reference Brady and Magazzino2018).
The study is organized as follows: Section 2 reviews the literature, Section 3 outlines the methodology, Section 4 presents and discusses the results, and Section 5 concludes with the key findings, policy implications, and future research directions.
2. Literature review
The impact of government debt on economic growth and fiscal stability, particularly in the context of fiscal consolidation, has been the subject of extensive scholarly debate. While numerous studies have sought to identify thresholds of government debt that signal a tipping point for economic performance, the literature presents a fragmented and, at times, contradictory landscapeFootnote 5 . Several studies have attempted to pinpoint thresholds beyond which government debt exerts detrimental effects on economic growth and fiscal sustainability. The seminal work of 55 and Presbitero (Reference Presbitero2012), sparked global attention by suggesting that economic growth weakens significantly when government debt exceeds a 90% debt-to-GDP threshold. Specifically, these authors find that below the 90% threshold, the link between public debt and GDP growth is relatively weak or ambiguous. However, once debt surpasses this threshold, median growth declines by approximately 1 percentage point, and average growth deteriorates even further. While influential, these studies have been criticized for relying heavily on aggregate data without accounting for the heterogeneity in institutional capacity, macroeconomic frameworks, or fiscal credibility across countries. This limitation is particularly important given the diverse fiscal space and monetary constraints that countries face. Fournier and Fall (Reference Fournier and Fall2017) advance this discourse by applying a threshold framework within the OECD context. Their analysis suggests that governments respond actively to rising debt when it approaches 120% of GDP by adjusting fiscal balances; however, beyond a 170% debt-to-GDP ratio, the incentive or ability to consolidate weakens, leading to relaxed fiscal adjustments. While insightful, this study’s findings are confined to advanced economies and may not extrapolate well to emerging or low-income countries, which typically face tighter borrowing constraints and weaker institutional mechanisms for fiscal discipline. A more conservative view is presented by Alloza et al. (Reference Alloza, Andrés, Pérez and Rojas2020),who recommend a 60% debt-to-GDP threshold as more appropriate for sustaining long-term growth. Their findings challenge the earlier conclusions of 55 and Presbitero (Reference Presbitero2012), suggesting that the growth-dampening effects of public debt may emerge at substantially lower levels than previously thought. This divergence highlights the contextual sensitivity of debt thresholds, particularly when applied to countries with varying levels of fiscal resilience, structural economic vulnerabilities, or exposure to external shocks. Alloza et al. (Reference Alloza, Andrés, Pérez and Rojas2020) further argue that the conventional thresholds of 60%, 90%, 120%, or 170% may be overly simplistic when applied uniformly across heterogeneous economies. Their work emphasizes the need for a more nuanced, context-specific framework that accounts for country-specific factors such as debt composition, interest-growth differentials, and the quality of institutions.
In response to this call for contextual sensitivity, Simeonovski et al. (Reference Simeonovski, Fidanoski, Petkovski and Sergi2022) conduct a region-specific analysis focusing on 16 countries in Central and Southeast Europe. They identify a debt threshold of 77.3% of GDP, beyond which economic growth begins to deteriorate. Moreover, when budget balances are integrated into the analysis, the threshold varies from 69.4% to 74.1%, further underscoring the importance of fiscal performance in shaping the debt-growth nexus. However, while their findings are methodologically robust, the regional scope introduces concerns about generalizability to other economic regions, especially those with different political institutions, debt structures, or monetary policy regimes. Additionally, incorporating budget balances may raise issues of multicollinearity, potentially distorting the interpretation of threshold effects. The works 55 and Presbitero (Reference Presbitero2012), Fournier and Fall (Reference Fournier and Fall2017), Alloza et al. (Reference Alloza, Andrés, Pérez and Rojas2020), and Simeonovski et al. (Reference Simeonovski, Fidanoski, Petkovski and Sergi2022) converge on the view that there exists a non-linear relationship between public debt and economic growth, but they diverge significantly in identifying the precise threshold at which debt begins to exert a harmful effect. These differences underscore the importance of considering institutional quality, macroeconomic resilience, and regional dynamics when evaluating the sustainability of public debt. Therefore, while the concept of a government debt threshold remains central to fiscal policy discourse, its exact level is not fixed and must be assessed within the broader context of each country’s economic and institutional.
Liu and Lyu (Reference Liu and Lyu2021) identify a much higher debt threshold of 130% of GDP, suggesting an inverted U-shaped relationship between public debt and economic growth. Their study, using a threshold regression model, indicates that while moderate debt levels may initially stimulate growth, debt levels above 130% lead to significant economic deterioration. This finding highlights the complexity of the debt-growth relationship and suggests that optimal debt thresholds may vary significantly across different economic contexts. Georgantas et al. (Reference Georgantas, Kasselaki and Tagkalakis2023) provide additional nuance by examining the conditions under which fiscal consolidation may succeed or fail. Their analysis of 24 OECD countries from 1990 to 2019, using the local projection method, reveals that fiscal consolidation is more likely to be contractionary in high-debt countries, particularly when the debt ratio exceeds 80% of GDP. They argue that spending-based fiscal adjustments implemented under high-debt conditions, during recessions, or when monetary policy is tight, are self-defeating, as they lead to only minimal reductions in the public debt ratio. Conversely, consolidations initiated in low-debt countries, during economic expansions, or when monetary conditions are loose, can be expansionary and result in more significant debt reduction.
Studies by Law et al. (Reference Law, Ng, Kutan and Law2021) and Chowdhury et al. (Reference Chowdhury, Prince, Shoyeb and Abdullah2024) highlight the importance government debt impacts economic growth differently in advanced and developing economies. Law et al. (Reference Law, Ng, Kutan and Law2021) identify a 51.65% debt-to-GDP threshold, beyond which debt negatively affects growth. However, their findings may overlook differences in fiscal, monetary, and institutional environments. Chowdhury et al. (Reference Chowdhury, Prince, Shoyeb and Abdullah2024) suggest that institutional quality mediates the debt-macroeconomic stability relationship, with a positive effect above a certain threshold of institutional quality. This highlights the need for institutional factors in debt-growth models. On the other hand, Mohsin et al. (Reference Mohsin, Ullah, Iqbal, Iqbal and Taghizadeh-Hesary2021) find that external debt has a stronger negative impact on growth than domestic debt. This suggests that external debt carries greater risks, yet the study requires more exploration into the broader macroeconomic context. Dumitrescu et al. (Reference Dumitrescu, Kagitci and Cepoi2022) observe that higher public debt increases inflation when the shadow economy surpasses a threshold. While important, the study lacks a detailed exploration of the mechanisms linking inflation and the shadow economy in debt-growth models. Despite methodological rigor from Law et al. (Reference Law, Ng, Kutan and Law2021), Chowdhury et al. (Reference Chowdhury, Prince, Shoyeb and Abdullah2024), Mohsin et al. (Reference Mohsin, Ullah, Iqbal, Iqbal and Taghizadeh-Hesary2021) and Dumitrescu et al. (Reference Dumitrescu, Kagitci and Cepoi2022), such as dynamic panel threshold techniques, many studies rely on aggregate data, which may obscure country-specific factors. Nevertheless, they offer valuable insights in the role of institutions, the heterogeneity of debt effects across countries, and the need for context-specific approaches to fiscal policy. Qureshi and Liaqat (Reference Qureshi and Liaqat2020) analyze data from 123 countries over the period 1990 to 2015, revealing that while external debt generally has a negative impact on economic growth, it is positively associated with income growth in lower- and upper-middle-income countries. Their study further disaggregates external debt, finding that public external debt consistently detracts from growth across all income groups. Elkhalfi et al. (Reference Elkhalfi, Chaabita, Benboubker, Ghoujdam, Zahraoui, Alaoui, Laalam, Belhaj and Hammouch2024) examine a smaller panel of 10 countries from 1990 to 2022, uncovering a non-linear relationship where an initial increase in external debt stimulates growth, but excessive accumulation leads to diminishing returns and negative growth outcomes. On the other hand, Chen et al. (Reference Chen, Li, Xie and Xu2024) focus on China and conclude that government debt has a positive effect on the country’s growth, highlighting the unique economic dynamics of China. These studies collectively contribute to the growing body of literature on government debt thresholds, providing nuanced insights into the debt-growth nexus across different economic contexts.
Afonso, Alves and Jalles (2022) investigate the necessity and effectiveness of fiscal consolidation using a large sample of developed and developing economies from 1980 to 2018. By focusing on the debt-stabilizing primary balance as a measure of fiscal consolidation need, the study fills a gap in existing research. Their results indicate that advanced economies often require consolidation, which generally improves fiscal sustainability. However, fiscal sustainability tends to worsen when consolidation is most needed, suggesting the importance of economic context and timing. While the study contributes valuable insights, it has limitations. The reliance on the debt-stabilizing primary balance may oversimplify fiscal policy dynamics, and the correlation-based findings leave causality unclear. Alesina et al. (Reference Alesina, Favero and Giavazzi2019) explore the impact of austerity measures on economic performance and debt levels in Europe post-2010, revealing a heated debate. They argue that while austerity is often deemed necessary due to high debt, its effects have been contentious. Critics assert that austerity worsened recessions and increased the debt-to-GDP ratio, supported by Blanchard (Reference Blanchard1990) who highlight high fiscal multipliers. The study points out that austerity’s impact may vary significantly across different contexts and economic conditions. A key limitation is its focus on European economies, which may not address the varying effectiveness of threshold-based fiscal policies in other regions or under different economic conditions. Fatás and Summers (Reference Fatás and Summers2018) argue that fiscal consolidations conducted during recessionary periods are counterproductive, exacerbating debt-to-GDP ratios through reduced output. Their study, extending Blanchard (Reference Blanchard1990) methodology, suggests that such consolidations have strong hysteresis effects, leading to long-term negative impacts on growth. The study’s focus on the aftermath of the global financial crisis may not generalize to other economic periods or different types of fiscal consolidations, such as those undertaken during periods of economic expansion or in response to different shocks. The findings are based on advanced economies, potentially overlooking the unique challenges faced by emerging OECD countries, which might react differently to fiscal consolidations due to varying economic conditions and institutional contexts. The study assumes a uniform impact of fiscal consolidation across all advanced economies, disregarding country-specific factors such as differing fiscal capacities, debt levels, and economic structures that could influence the effectiveness of consolidation efforts.
Ciaffi et al. (Reference Ciaffi, Deleidi and Di Domenico2024) this study employs the Local Projections approach to assess the impact of government expenditure components consumption and investment on output and public debt sustainability in 14 OECD countries from 1981 to 2017. They find that while all fiscal policy shocks reduce the public debt-to-GDP ratio, government investment has a more significant positive effect on public debt sustainability compared to government consumption. The study’s main contribution is highlighting the superior role of government investment in promoting long-term fiscal stability. However, it may not fully account for variations in policy effectiveness across different OECD subgroups or economic contexts. Bamba et al. (Reference Bamba, Combes and Minea2020) this paper analyses how fiscal consolidations affect the composition of government spending using System-GMM estimations on 53 developed and emerging countries from 1980 to 2011. The study reveals that fiscal consolidations tend to reduce the government investment-to-consumption ratio, especially during periods of high debt and low economic cycles. The main limitation is its potential overemphasis on the negative long-term effects of reduced public investment, without considering potential short-term stabilization benefits. The findings might also be less applicable to OECD countries with different fiscal structures and economic conditions. Afonso, Alves and Jalles (2022) this study evaluates the impact of fiscal consolidations on private consumption and investment across 174 countries from 1970 to 2018. It finds that increases in government consumption have a Keynesian effect on private consumption, while tax increases can have a positive impact on private consumption during fiscal consolidations. Fiscal contractions also tend to crowd in private investment, particularly in advanced economies. The study’s focus on a broad range of countries may dilute specific insights relevant to OECD nations, and its findings on the positive effects of taxation on consumption might not align with all economic contexts or fiscal conditions.
Aaskoven and Wiese (Reference Aaskoven and Wiese2022) examine the effectiveness of fiscal rules in achieving sustained debt reduction during fiscal consolidation periods using data from 19 OECD countries. They find that the EU’s Stability and Growth Pact is linked with sustained debt reduction, whereas the mere presence of national fiscal rules shows ambiguous results. Their study highlights that fiscal rules are more effective when integrated into a robust national institutional framework. The analysis would benefit from a more nuanced consideration of how variations in the stringency of national fiscal rules and institutional quality affect fiscal outcomes across different economic cycles and political environments. Furthermore, the methodological novelty in identifying fiscal consolidation periods, while innovative, may require further validation to ensure its robustness and replicability across other datasets. Aldama and Creel (Reference Aldama and Creel2022) investigate the cyclical behavior of fiscal policy using a real-time panel dataset covering 19 OECD countries from 1997 to 2018. Their findings indicate that fiscal policy is procyclical during economic downturns and a-cyclical during upturns. Despite the evidence of sustainability, they do not find that fiscal consolidations are stronger during recessions, suggesting a procyclical bias driven largely by the post-Global Financial Crisis period. However, the study’s focus on procyclicality may overlook the potential variability in fiscal policy effectiveness across different economic phases or structural conditions within the OECD countries.
Brady and Magazzino (Reference Brady and Magazzino2018) analyze the effectiveness of fiscal rules in managing high government debt levels. They find that fiscal rules can be successful in reducing public debt during periods of high debt accumulation. However, the study highlights the lack of consensus on what constitutes an optimal level of government debt, pointing to varying thresholds across different studies. This ambiguity poses challenges for policymakers seeking to determine effective debt management strategies. While Brady and Magazzino (Reference Brady and Magazzino2018) provide insights into the potential success of fiscal rules, their study’s generalizability is limited by the lack of a clear, universally applicable threshold for optimal debt levels. This variability suggests that the effectiveness of fiscal rules may be context-dependent, influenced by specific economic and institutional factors. Niemann and Pichler (Reference Niemann and Pichler2020) investigate how sovereign risk affects optimal fiscal policy, developing a model with endogenous default costs and belief-driven debt rollover crises. Their findings indicate that while optimal taxes and spending are typically procyclical, sovereign risk can lead to countercyclical fiscal policies during crises. Debt build-ups are triggered by mild recessions, with successful consolidations occurring only during favorable economic conditions. Niemann and Pichler (Reference Niemann and Pichler2020) model provides valuable insights into the cyclical nature of optimal fiscal policy under sovereign risk. However, the focus on endogenous default costs and belief-driven crises might oversimplify the complexities of sovereign risk, potentially overlooking other influential factors such as external economic shocks or political instability. Additionally, the model’s assumptions and theoretical framework should be tested against empirical data to validate its practical applicability. Jacobs et al. (Reference Jacobs, Ogawa, Sterken and Tokutsu2020) establish a causal link between public debt and economic growth, asserting that high levels of public debt negatively impact growth regardless of the debt ratio. Their contributed to the understanding of the relationship between public debt and growth, their study could be criticized for not accounting for the varying impacts of debt on different economies or under different economic conditions. The causal link established may also require further validation through additional empirical studies to account for potential confounding factors. Mtibaa et al. (Reference Mtibaa, Lahiani and Gabsi2022) examine the impact of fiscal consolidation on economic growth in Tunisia from 1970 to 2018. Using advanced econometric techniques, they find that fiscal consolidation negatively affects growth in both the short- and long-term. The study also reveals a unidirectional nonlinear Granger causality from fiscal consolidation to economic growth, suggesting that fiscal adjustments may be costly for the economy. Mtibaa et al. (Reference Mtibaa, Lahiani and Gabsi2022) study provides important evidence on the impact of fiscal consolidation in Tunisia, but its focus on a single country limits the generalizability of the findings. The study could be enhanced by comparing the results with those from other countries or regions to determine if the observed effects are unique to Tunisia or part of a broader pattern. Furthermore, the study’s reliance on specific econometric techniques may benefit from robustness checks using alternative methods to ensure the reliability of the findings.
Although a substantial body of literature has examined the macroeconomic implications of fiscal consolidation, several significant gaps remain unresolved, particularly in the context of OECD countries. Existing studies have primarily concentrated on the short-term output effects of fiscal adjustments, often overlooking their broader and long-term impacts on GDP per capita and the primary fiscal balance. While pioneering contributions such as those by Alesina and Ardagna (Reference Alesina and Ardagna2010) and Guajardo et al. (Reference Guajardo, Leigh and Pescatori2014), Afonso, Alves and Jalles (2022), Aaskoven and Wiese (Reference Aaskoven and Wiese2022), Aldama and Creel (Reference Aldama and Creel2022), Niemann and Pichler (Reference Niemann and Pichler2020) and Ciaffi et al. (Reference Ciaffi, Deleidi and Di Domenico2024) differentiate between spending-based and revenue-based consolidations, they fall short of providing a nuanced analysis of how such policies influence GDP per capita growth trajectories and fiscal sustainability over time. Moreover, few studies account for nonlinearities or threshold effects in the relationship between government debt and macroeconomic performance, despite theoretical evidence suggesting that the impact of fiscal consolidation may depend critically on the initial level of government indebtedness.
In particular, the literature lacks a rigorous investigation into how government debt thresholds condition the effectiveness of fiscal consolidation on macroeconomic outcomes. While research by 55, Presbitero (Reference Presbitero2012), Fournier and Fall (Reference Fournier and Fall2017), Alloza et al. (Reference Alloza, Andrés, Pérez and Rojas2020), Simeonovski et al. (Reference Simeonovski, Fidanoski, Petkovski and Sergi2022), Law et al. (Reference Law, Ng, Kutan and Law2021), Chowdhury et al. (Reference Chowdhury, Prince, Shoyeb and Abdullah2024) and Mohsin et al. (Reference Mohsin, Ullah, Iqbal, Iqbal and Taghizadeh-Hesary2021)Footnote 6 has raised awareness of debt thresholds, there is limited empirical inquiry into whether these thresholds amplify or mitigate the effects of fiscal consolidation on GDP per capita and the primary fiscal balance. This study addresses that gap by estimating threshold effects explicitly within fiscal consolidation periods, thereby identifying nonlinear relationships and regime-specific dynamics between government debt, economic output, and fiscal performance. Furthermore, existing empirical work tends to treat government expenditure and revenue as aggregate variables, without decomposing their individual categories. This aggregation masks the differential effects that disaggregated expenditure items (e.g., capital versus current spending) and tax components (e.g., direct versus indirect taxes) may have on macroeconomic performance. For instance, while capital expenditure may be growth-enhancing, current expenditure often exhibits lower multipliers, particularly under fiscal consolidation. Similarly, the growth and fiscal impacts of progressive income taxation may differ substantially from those of consumption-based taxes. Yet, few studies have evaluated these category-specific fiscal channels during periods of fiscal tightening. Additionally, although several studies have assessed the impact of fiscal consolidation on growth or debt dynamics, very few have examined how government spending and revenue decisions affect the primary fiscal balance directly, especially in the presence of consolidation efforts. The omission of such direct fiscal balance impacts limits our understanding of how policymakers can optimize fiscal space while avoiding adverse effects on economic activity. Another overlooked dimension in the current literature is the variation in government debt thresholds that may influence macroeconomic variables across different consolidation episodes. It remains unclear whether a single debt threshold applies uniformly across countries and time, or whether multiple, context-dependent thresholds exist, which could cause nonlinear fiscal transmission mechanisms.
Table 1. Economic variables are utilized
3. Methodology
This study employed quantitative analysis of OECD data from 24 countries from 2000 to 2022. These countries were selected based on data availability. Table 1 lists the economic variables used.
Table 1 reflects the data used to examine how big is big with the view of a revisit of the threshold analysis of government debt on GDP per capita and primary fiscal balance in the presence of fiscal consolidation in OECD countries. According to the growth literature (Reinhart et al. Reference Reinhart, Reinhart and Rogoff2012, Bexheti et al. Reference Bexheti2020, Bhimjee and Leão Reference Bhimjee and Leão2020, Bousnina and Gabsi Reference Bousnina and Gabsi2022), factors affecting a country’s economic growth include population, gross capital formation, inflation, interest paid on public debt, foreign direct investment, and trade openness. Government expenditures and revenues are used because of key fiscal policy economic variables Alloza et al. (Reference Alloza, Andrés, Pérez and Rojas2020). The GDP per capita and gross domestic debt are dependent variables given the economic theory of Cobb-Douglas production and government budget constraints (Mankiw Reference Mankiw2020). The cyclically adjusted primary balance is used as a proxy for fiscal consolidation. This variable has been used by (Alesina and Perotti Reference Alesina and Perotti1995, Alesina and Perotti Reference Alesina and Perotti1997, Alesina et al. Reference Alesina, Favero and Giavazzi2019), among others, as a measure of fiscal consolidation. Table 2 reflect all the countries that have been used in this study.
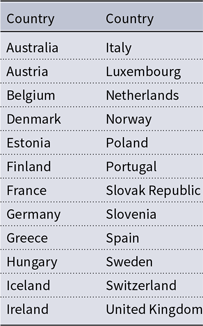
Table 2. List of countries used
This study utilized the fixed-effect panel threshold model over other models due to its advantages. This approach addresses challenges like endogeneity and time series dynamics, ensuring unbiased estimates. The dataset includes panel data for OECD countries, requiring an approach that captures within-group variations while controlling for unobserved heterogeneity. The model naturally accommodates threshold analysis, enhancing the accuracy of policy recommendations related to fiscal consolidation measures. Other scholars who have used this model include (Reinhart et al. Reference Reinhart, Reinhart and Rogoff2012, Bexheti et al. Reference Bexheti2020, Bhimjee and Leão Reference Bhimjee and Leão2020, Bousnina and Gabsi Reference Bousnina and Gabsi2022).
3.1. Stylized CAPB
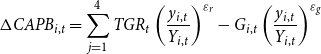
The stylized cyclically adjusted primary balance (CAPB) is derived via the OECD approach, which emphasizes the elasticity of government expenditure and taxes to identify discretionary fiscal actions. It compares the current primary deficit to what it would have been if expenditure in the previous year had grown with potential GDP and revenues had grown with actual GDP (Mourre et al. Reference Mourre2013). The OECD approach is reflected in Equation 1.
 \begin{equation} \Delta CAPB_{i,t}=\frac{\left[\left(\sum _{j=1}^{4}TG{R_{i,t}}^{{\varepsilon _{tgr}}}-G_{i,t}^{\varepsilon _{g}}\right)-\left(\sum _{j=1}^{4}TG{R_{i,t-1}}^{{\varepsilon _{tgr}}}\left(1+y_{i,t}\right)-G_{i,t-1}^{\varepsilon _{g}}\left(1+y_{i,t}\right)\right)\right]}{Y_{i,t-1}} \end{equation}
where $y$
is the growth of nominal GDP and
$y$
is the growth of nominal GDP and $Y$
is the growth of nominal GDP potentialFootnote
7
growth rate, which is estimated based on country-specific production functions. The OECD approach offers a much broader scope for CAPB because it involves a disaggregated approach and the elasticity of
$Y$
is the growth of nominal GDP potentialFootnote
7
growth rate, which is estimated based on country-specific production functions. The OECD approach offers a much broader scope for CAPB because it involves a disaggregated approach and the elasticity of $\varepsilon _{tgr}$
tax revenue and
$\varepsilon _{tgr}$
tax revenue and $\varepsilon _{g}$
government expenditure (Mourre et al. Reference Mourre2013). Four tax revenue categories are depicted in Equations 2 to 5.
$\varepsilon _{g}$
government expenditure (Mourre et al. Reference Mourre2013). Four tax revenue categories are depicted in Equations 2 to 5.
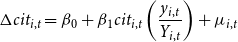 \begin{equation} \Delta cit_{i,t}=\beta _{0}+\beta _{1}cit_{i,t}\left(\frac{y_{i,t}}{Y_{i,t}}\right)+\mu _{i,t} \end{equation}
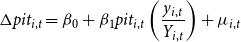 \begin{equation} \Delta pit_{i,t}=\beta _{0}+\beta _{1}pit_{i,t}\left(\frac{y_{i,t}}{Y_{i,t}}\right)+\mu _{i,t} \end{equation}
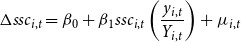 \begin{equation} \Delta ssc_{i,t}=\beta _{0}+\beta _{1}ssc_{i,t}\left(\frac{y_{i,t}}{Y_{i,t}}\right)+\mu _{i,t} \end{equation}
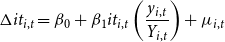 \begin{equation} \Delta it_{i,t}=\beta _{0}+\beta _{1}it_{i,t}\left(\frac{y_{i,t}}{Y_{i,t}}\right)+\mu _{i,t} \end{equation}
where $cit$
is corporate income tax
$cit$
is corporate income tax $pit$
is personal income tax
$pit$
is personal income tax $ssc$
is social security contributions and
$ssc$
is social security contributions and $it$
is indirect taxes. However, in the context of this study, we use an aggregate tax base, as reflected in Equation 6.
$it$
is indirect taxes. However, in the context of this study, we use an aggregate tax base, as reflected in Equation 6.
 \begin{equation} \Delta TGR_{i,t}=\beta _{0}+\beta _{1}TGR_{i,t}\left(\frac{y_{i,t}}{Y_{i,t}}\right)+\mu _{i,t} \end{equation}
On the government expenditure side, $g$
reflects the discretionary action of fiscal authorities, as shown in Equation 7.
$g$
reflects the discretionary action of fiscal authorities, as shown in Equation 7.
 \begin{equation} \Delta \frac{g_{i,t}}{g_{i,t-1}}=\beta _{0}+\beta _{1}g_{i,t}\left(\frac{y_{i,t}}{Y_{i,t}}\right)+\mu _{i,t} \end{equation}
The CAPB reflects cyclically adjusted tax revenue and government expenditure accounting for elasticity and the output gap shown in Equation 8.
 \begin{equation} \Delta CAPB_{i,t}=\sum _{j=1}^{4}TG{R_{t}}\left(\frac{y_{i,t}}{Y_{i,t}}\right)^{{\varepsilon _{r}}}-G_{i,t}\left(\frac{y_{i,t}}{Y_{i,t}}\right)^{{\varepsilon _{g}}} \end{equation}
3.2. Theoretical framework and model specification
3.2.1. Cobb-Douglas production
Cobb–Douglas production is used in this study because it provides attractive features of output generation and flexibility in the inclusion of other economic variables. The Cobb–Douglas production is given by Equation 8.
 \begin{equation} Q\left(LK\right)=\tau k^{\alpha }Al^{\alpha -1} \end{equation}
where $Q$
is output,
$Q$
is output, $l$
is labor,
$l$
is labor, $k$
is capital,
$k$
is capital, $A$
is a positive constant, and
$A$
is a positive constant, and $\tau$
and
$\tau$
and $\alpha$
are constants between 0 and 1 (Rasmidatta Reference Rasmidatta2011). However, for this study, the above Cobb–Douglas relationship will be extended with other economic variables, as reflected in Equation 9.
$\alpha$
are constants between 0 and 1 (Rasmidatta Reference Rasmidatta2011). However, for this study, the above Cobb–Douglas relationship will be extended with other economic variables, as reflected in Equation 9.
 \begin{equation} gdp_{it}= \alpha +{ \beta _{1}}k_{it}+\beta _{2}l_{it}++{\beta _{3}}g_{it}+\beta _{4}tgr_{it}+{\beta _{5}}ipd_{it}+{\beta _{6}}\textit{topnss}_{it}+{\beta _{7}}capb_{it}+\beta _{6}gd_{it}+\mu _{it} \end{equation}
3.2.2. Primary fiscal balance
The theoretical framework adopted by this study is the intertemporal primary fiscal balance depicted in Equation 10.
 \begin{equation} gd_{it}=\left(1+ipd_{it}\right)gd_{it-1}-gpb_{it} \end{equation}
where $gd_{it}$
is the general government gross debt dynamics,
$gd_{it}$
is the general government gross debt dynamics, $gpb_{it}$
is the government’s primary balance, and
$gpb_{it}$
is the government’s primary balance, and $ipd_{it}$
is the interest paid on public debt (Koczan Reference Koczan2015). The change in the level of the general government’s gross debt is expressed as a function of the past debt plus interest paid on public debt and the government’s primary balance, as reflected in Equation 11.
$ipd_{it}$
is the interest paid on public debt (Koczan Reference Koczan2015). The change in the level of the general government’s gross debt is expressed as a function of the past debt plus interest paid on public debt and the government’s primary balance, as reflected in Equation 11.
 \begin{equation} {\unicode[Arial]{x0394}} gd_{it}=\left(\frac{1+ipd_{it}}{1+rg_{it}}\right){\unicode[Arial]{x0394}} gd_{i,t-1}-gpb_{it} \end{equation}
where $\left(\frac{1+ipd_{it}}{1+gw_{it}}\right)$
automatic debt dynamics
$\left(\frac{1+ipd_{it}}{1+gw_{it}}\right)$
automatic debt dynamics $rg_{it}$
is the real economic growth rate. Here, higher primary balances result in lower debt, and higher past debt leads to higher current debt. Furthermore, a higher g lowers debt and a higher
$rg_{it}$
is the real economic growth rate. Here, higher primary balances result in lower debt, and higher past debt leads to higher current debt. Furthermore, a higher g lowers debt and a higher $ipd_{it}$
raises the interest paid on public debt (Koczan Reference Koczan2015). Given
$ipd_{it}$
raises the interest paid on public debt (Koczan Reference Koczan2015). Given ${\unicode[Arial]{x0394}} gd_{it}=0$
Equation 11 becomes a typical government primary balance that ensures stable debt as expressed in Equation 12.
${\unicode[Arial]{x0394}} gd_{it}=0$
Equation 11 becomes a typical government primary balance that ensures stable debt as expressed in Equation 12.
 \begin{equation} gpb_{it}=\left(\frac{1+ipd_{it}}{1+rg_{it}}\right)gd_{i,t-1} \end{equation}
if the $ipd_{it}$
raises, the interest paid on public debt exceeds the
$ipd_{it}$
raises, the interest paid on public debt exceeds the $rg_{it}$
real economic growth rate, and the solvency condition
$rg_{it}$
real economic growth rate, and the solvency condition $\lim _{n\rightarrow \infty } \; \left(\frac{1+ipd_{it}}{1+rg_{it}}\right)^{n}=0$
ensures that the government debt is bounded to observe the transversality condition (Koczan Reference Koczan2015). Therefore, a feedback fiscal policy rule of a rational government committed to stable debt is depicted in the econometric equation given in Equation 13.
$\lim _{n\rightarrow \infty } \; \left(\frac{1+ipd_{it}}{1+rg_{it}}\right)^{n}=0$
ensures that the government debt is bounded to observe the transversality condition (Koczan Reference Koczan2015). Therefore, a feedback fiscal policy rule of a rational government committed to stable debt is depicted in the econometric equation given in Equation 13.
 \begin{equation} gpb_{it}=\alpha +\beta _{1}gd_{i,t-1}+\mu _{it} \end{equation}
where $\beta _{1}$
is expected to be positive and significant so that the previous general government’s gross debt is offset by the current primary surplus to fulfill Bohn’s sufficient condition for sustainable fiscal policy (Koczan Reference Koczan2015). In the context of this study, the theoretical framework in Equation 13 is extended to an econometric setup for estimation, as reflected in Equation 14, with the inclusion of other economic variables of interest.
$\beta _{1}$
is expected to be positive and significant so that the previous general government’s gross debt is offset by the current primary surplus to fulfill Bohn’s sufficient condition for sustainable fiscal policy (Koczan Reference Koczan2015). In the context of this study, the theoretical framework in Equation 13 is extended to an econometric setup for estimation, as reflected in Equation 14, with the inclusion of other economic variables of interest.
 \begin{equation} gpb_{it}=\alpha +\beta _{1}gd_{i,t-1}+{\beta _{2}}ipd_{it}+{\beta _{3}}gdp_{it}+{\beta _{4}}\textit{topnss}_{it}+{\beta _{5}}capb_{it}+\beta _{6}gd_{it}+\mu _{it} \end{equation}
3.3. Model specification fixed-effect panel threshold model
The fixed-effect panel threshold model with multiple thresholds and multiple regimes is reflected in Equation 15.
 \begin{equation} y_{it}=\mu +X_{it}\left(q_{it}\lt \gamma _{1}\right)\beta _{1}+X_{it}\left(\gamma _{1}\lt q_{it}\lt \gamma _{2}\right)\beta _{2}+X_{it}\left(q_{it}\lt \gamma _{2}\right)\beta _{3}+u_{i}+e_{it} \end{equation}
where variable $q_{it}$
is the threshold variable. In the context of this study, this will be
$q_{it}$
is the threshold variable. In the context of this study, this will be $gdp_{it}$
, and
$gdp_{it}$
, and $\gamma _{1}$
and
$\gamma _{1}$
and $\gamma _{2}$
reflect the 2 threshold parameters that divide the equation into two regimes with coefficients
$\gamma _{2}$
reflect the 2 threshold parameters that divide the equation into two regimes with coefficients $\beta _{1}$
,
$\beta _{1}$
, $\beta _{3}$
and
$\beta _{3}$
and $\beta _{3}$
. The parameter
$\beta _{3}$
. The parameter $u_{i}$
is the individual effect, while
$u_{i}$
is the individual effect, while $e_{it}$
is the disturbance. On the other hand, in Equation 15, variable
$e_{it}$
is the disturbance. On the other hand, in Equation 15, variable $X_{it}$
reflects all explanatory variables that core explanatory variables are reflected in Equations 9 and 14, respectively, while
$X_{it}$
reflects all explanatory variables that core explanatory variables are reflected in Equations 9 and 14, respectively, while $y_{it}$
variable considered and fixed effect
$y_{it}$
variable considered and fixed effect $e_{it}$
. This transformation is simplified form represented in Equation 16.
$e_{it}$
. This transformation is simplified form represented in Equation 16.
 \begin{equation} y_{it}=\mu +X_{it}\left(q_{it},\gamma \right)\beta +u_{i}+e_{it} \end{equation}
where
 \begin{align} X_{it}\left(q_{it},\gamma \right)=\begin{cases} X_{it}\left(q_{it}\lt \gamma _{1}\right)\beta _{1}\\ X_{it}\left(\gamma _{1}\lt q_{it}\lt \gamma _{2}\right)\beta _{2}\\ X_{it}\left(q_{it}\lt \gamma _{2}\right)\beta _{3} \end{cases} \end{align}
Given $\gamma$
, the ordinary least-squares estimator of
$\gamma$
, the ordinary least-squares estimator of $\beta$
is reflected in Equation (18).
$\beta$
is reflected in Equation (18).
 \begin{equation} \hat{\beta }_{i}=X*\left(\gamma \right)'X*\left(\gamma \right)^{-1}\left\{X*\left(\gamma \right)'y*\right\} \end{equation}
To simulate the threshold model, two main steps are involved: determining threshold values $*$
with corresponding coefficients
$*$
with corresponding coefficients $\hat{\beta }_{i}$
and testing the significance of the threshold effect (Hansen Reference Hansen2000). The estimated threshold value
$\hat{\beta }_{i}$
and testing the significance of the threshold effect (Hansen Reference Hansen2000). The estimated threshold value $\overline{\gamma }$
is obtained by minimizing the residual sum of the squared errors
$\overline{\gamma }$
is obtained by minimizing the residual sum of the squared errors $S_{n}(\gamma )u_{i}e_{it}$
. The parameter estimates of threshold
$S_{n}(\gamma )u_{i}e_{it}$
. The parameter estimates of threshold $\hat{\beta }_{i}$
are then derived using ordinary least squares (Hansen Reference Hansen2000). To test for the threshold effect’s existence, the null hypothesis
$\hat{\beta }_{i}$
are then derived using ordinary least squares (Hansen Reference Hansen2000). To test for the threshold effect’s existence, the null hypothesis $H_{0}\colon \beta _{1}=\beta _{2}$
is compared against the alternative
$H_{0}\colon \beta _{1}=\beta _{2}$
is compared against the alternative $H_{0}\colon \beta _{1}\neq \beta _{2}$
. If the null hypothesis is rejected, indicating nonlinearity, a nonlinear regression with two threshold regimes is performed, and the F statistic under the null hypothesis is expressed as Equation 19.
$H_{0}\colon \beta _{1}\neq \beta _{2}$
. If the null hypothesis is rejected, indicating nonlinearity, a nonlinear regression with two threshold regimes is performed, and the F statistic under the null hypothesis is expressed as Equation 19.
 \begin{equation} F_{1}=\frac{S_{0}- S_{1}\left(\overline{\gamma }\right)}{\overline{\sigma ^{2}}} \end{equation}
where $S_{1}$
and
$S_{1}$
and $S_{0}$
in Equation 12 denote the residual sum of squared errors with and without threshold effects, respectively, while
$S_{0}$
in Equation 12 denote the residual sum of squared errors with and without threshold effects, respectively, while $\overline{\sigma ^{2}}=\frac{S_{1}\left(\overline{\gamma }\right)}{n}$
suggests the variance of the residual (Baltagi and Baltagi Reference Baltagi and Baltagi2008). Based on the null hypothesis of
$\overline{\sigma ^{2}}=\frac{S_{1}\left(\overline{\gamma }\right)}{n}$
suggests the variance of the residual (Baltagi and Baltagi Reference Baltagi and Baltagi2008). Based on the null hypothesis of $H_{0}$
, the threshold value is not identified, while
$H_{0}$
, the threshold value is not identified, while $F_{1}$
exhibits a nonstandard asymptotic distribution. Hansen (Reference Hansen1999) devised a repetitive bootstrap method for F-statistic critical values to verify the threshold effect’s significance by calculating asymptotic p-values. This study employs 2000 bootstraps. The LR statistic, expressed as Equation 20, uses the no rejection region method. Which is expressed as Equation 20.
$F_{1}$
exhibits a nonstandard asymptotic distribution. Hansen (Reference Hansen1999) devised a repetitive bootstrap method for F-statistic critical values to verify the threshold effect’s significance by calculating asymptotic p-values. This study employs 2000 bootstraps. The LR statistic, expressed as Equation 20, uses the no rejection region method. Which is expressed as Equation 20.
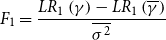 \begin{equation} F_{1}=\frac{LR_{1}\left(\gamma \right)- LR_{1}\left(\overline{\gamma }\right)}{\overline{\sigma ^{2}}} \end{equation}
In the panel threshold model, Hansen (Reference Hansen2000) also extended a similar computation to multiple thresholds, with the general approach being similar to the case of a single threshold (Baltagi and Baltagi Reference Baltagi and Baltagi2008).
3.3.1. Diagnostic test
Unit root tests ensure variable stationarity before estimation. Variables should be $I(0)$
or
$I(0)$
or $I(1) ;\; I(2)$
variables are removed. The Im–Pesaran–Shin and Levin–Lin–Chu tests are used. Pedroni (Reference Pedroni1996) and Westerlund (Reference Westerlund2007) cointegration tests examine long-term relationships. Pesaran (Reference Pesaran2015) CD test controls for dependency. (Pedroni Reference Pedroni1999, Pedroni Reference Pedroni2004) tests for co-integration. Before threshold estimation, OLS panel data regression is conducted, segmented into fixed and random effects, determined by the Hausman test (Hansen Reference Hansen1982).
$I(1) ;\; I(2)$
variables are removed. The Im–Pesaran–Shin and Levin–Lin–Chu tests are used. Pedroni (Reference Pedroni1996) and Westerlund (Reference Westerlund2007) cointegration tests examine long-term relationships. Pesaran (Reference Pesaran2015) CD test controls for dependency. (Pedroni Reference Pedroni1999, Pedroni Reference Pedroni2004) tests for co-integration. Before threshold estimation, OLS panel data regression is conducted, segmented into fixed and random effects, determined by the Hausman test (Hansen Reference Hansen1982).
4. Results
Table Table A.1 displays descriptive statistics, with the variable of interest GDP per capita, $gd$
general government gross debt, and primary fiscal balance having mean values of 4.735%, 64.126%, and 2.125%, respectively. Table A.2 displays the correlation matrix among the economic variables in this study, GDP per capita is negatively correlated with general government gross debt and primary fiscal balance, with values of 0.242 and 0.250, respectively. On the other hand, the cyclically adjusted primary balance was positively correlated with a value of 0.067. On the other hand, the primary fiscal balance is positively and negatively correlated with government gross debt as well as the cyclically adjusted primary balance, with values of 0.400 and 0.270, respectively.
$gd$
general government gross debt, and primary fiscal balance having mean values of 4.735%, 64.126%, and 2.125%, respectively. Table A.2 displays the correlation matrix among the economic variables in this study, GDP per capita is negatively correlated with general government gross debt and primary fiscal balance, with values of 0.242 and 0.250, respectively. On the other hand, the cyclically adjusted primary balance was positively correlated with a value of 0.067. On the other hand, the primary fiscal balance is positively and negatively correlated with government gross debt as well as the cyclically adjusted primary balance, with values of 0.400 and 0.270, respectively.
Table A.3 presents mixed results regarding the stationarity of economic variables. Im et al. (Reference Im, Pesaran and Shin2003) test indicates that GDP per capita, government debt, fiscal balance, population, capital formation, government expenditure, government revenue, inflation, and interest on public debt are all non-stationary at levels and become stationary only after first differencing, meaning they are integrated of order one, $I(1)$
. On the other hand, the test shows that foreign direct investment, trade openness, and the cyclically adjusted balance are stationary at levels, indicating they are integrated of order zero,
$I(1)$
. On the other hand, the test shows that foreign direct investment, trade openness, and the cyclically adjusted balance are stationary at levels, indicating they are integrated of order zero, $I(0)$
. In contrast, the Im et al. (Reference Im, Pesaran and Shin2003) test suggests that all the variables are stationary at levels,
$I(0)$
. In contrast, the Im et al. (Reference Im, Pesaran and Shin2003) test suggests that all the variables are stationary at levels, $I(0)$
, making them suitable for inclusion in a threshold model. Additionally, the Kao and Pedroni cointegration tests confirm the presence of a long-run equilibrium relationship among the variables, indicating that despite the mixed stationarity, the variables move together in the long term.
$I(0)$
, making them suitable for inclusion in a threshold model. Additionally, the Kao and Pedroni cointegration tests confirm the presence of a long-run equilibrium relationship among the variables, indicating that despite the mixed stationarity, the variables move together in the long term.
Table 3 presents the results of the Kao and Pedroni tests for panel cointegration. The Kao test, following (McCoskey and Kao Reference McCoskey and Kao1998), rejects the null hypothesis of no cointegration at the 1%, 5%, and 10% significance levels, indicating the presence of a long-run equilibrium relationship among the variables. Similarly, the Pedroni test, as developed by Pedroni (Reference Pedroni1996) and Pesaran (Reference Pesaran2015), also confirms the existence of cointegration among the economic variables examined in this study. These consistent results from both tests suggest that the variables are integrated in the long run, validating the use of panel regression models to estimate the underlying relationships. Table 4 presents the model selection results for the multiple regression analysis, which was employed to investigate the study’s core empirical question.
Table 3. Kao and Pedroni tests for co-integration
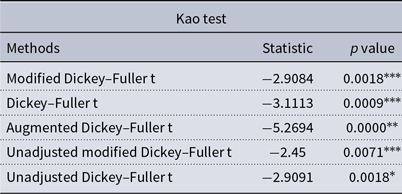
Note: that ***, **, * denote the rejection of the null of no co-integration for 99%, 95%, and 90%, respectively.
Table 4. Impacts of fiscal consolidation on GDP per capita and primary fiscal balance
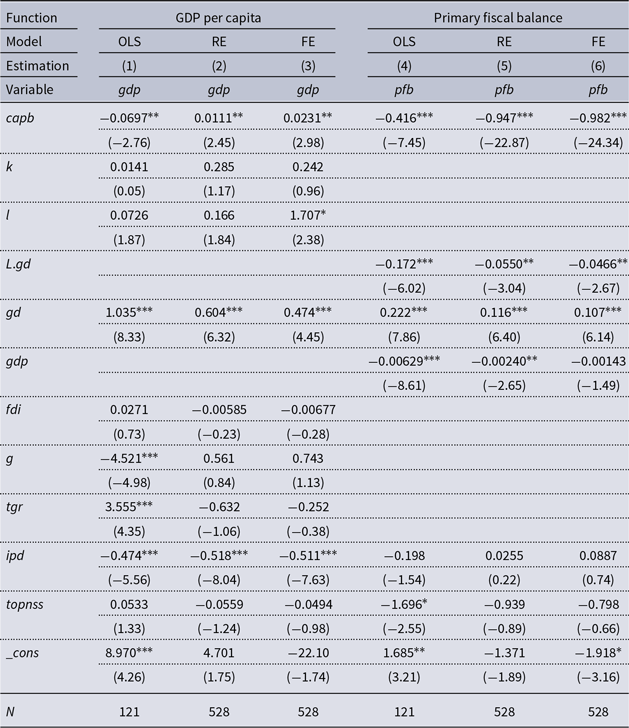
The t statistics are in parentheses; * p< 0.05, ** p< 0.01, *** p< 0.001.
4.1. Impacts of fiscal consolidation on GDP per capita and primary fiscal balance in OECD countries
What are the impacts of fiscal consolidation on GDP per capita and primary fiscal balance in OECD countries? Before estimating the threshold, this study conducts a standard linear regression using the ordinary least squares (OLS) panel data model. This model can be further categorized into fixed-effects (FE) and random-effects (RE) models. Across all modes, the variable of interest reflects an increase in government gross debt resulting in an increase in GDP per capita. On the other hand, the result reflects that a government gross debt increase increases the primary fiscal balance. In Table 4 estimations 2 and 3, the FE and RE models indicate that a 1% increase in fiscal consolidation results in GDP per capita increases of 1% and 0.0231%, respectively. These findings suggest that fiscal consolidation can positively affect GDP per capita within OECD countries, although the magnitude of the effect varies depending on the model used. This indicates that although efforts to reduce government deficits and debt levels can benefit economic performance, the effectiveness of these measures may differ across economic contexts and fiscal policies. Policymakers in OECD countries should also implement fiscal consolidation measures to enhance economic growth. However, it is crucial to tailor these measures to the specific economic conditions of each country to maximize their effectiveness. Additionally, a balanced approach that considers both short-term economic stability and long-term growth potential should be prioritized. These results contradict those of Leitner (Reference Leitner2020) which challenged the view that fiscal consolidations are always beneficial, finding that the short-term impact of austerity measures on growth was more negative than previously thought.
The results in Table 4 reveal a striking paradox where a 1% increase in fiscal consolidation is associated with a 0.416%, 0.947%, and 0.982% decline in the primary fiscal balance across three different specifications. This counterintuitive outcome suggests that fiscal consolidation, often intended to improve fiscal health, can initially weaken the primary fiscal balance due to its contractionary effects on economic activity. Specifically, fiscal consolidation reduces aggregate demand, curbing GDP growth, and consequently lowering tax revenues while potentially increasing unemployment-related expenditures. The magnitude of the effects highlights the role of fiscal multipliers, which tend to be larger during periods of economic slack, and structural rigidities in labor and product markets, common in many OECD countries, which exacerbate these adverse outcomes. Historical context for these findings, during the European sovereign debt crisis in 2010 to 2015, austerity measures in countries such as Greece, Spain, and Italy resulted in economic contractions that undermined fiscal balances despite aggressive fiscal consolidation. Similarly, in Japan during the late 1990s and early 2000s, fiscal consolidation measures coincided with stagnation and deflation, limiting their effectiveness in reducing debt levels. These episodes illustrate the potential for fiscal consolidation to yield short term fiscal outcomes contrary to its objectives, especially when implemented during periods of economic fragility or without complementary growth-enhancing measures.
These results have significant policy implications. First, they highlight the inherent trade-offs in fiscal consolidation efforts. Policymakers must weigh the short-term deterioration of fiscal balances against the long-term goal of debt sustainability. Automatic stabilizers, such as unemployment benefits and progressive tax systems, may exacerbate these short-term effects by intensifying expenditure increases and revenue declines during periods of consolidation-induced economic contraction. Second, the findings caution against adopting abrupt and severe austerity measures. The increasing magnitude of the adverse effects, from 0.416% to 0.982%, implies that the fiscal balance’s sensitivity to consolidation may exhibit nonlinearities, with higher levels of consolidation resulting in disproportionately larger negative effects. These results suggest that fiscal consolidation policies in OECD countries should be carefully calibrated and timed. Gradual adjustments, complemented by structural reforms aimed at boosting productivity and economic resilience, can help mitigate the contractionary effects. Furthermore, the composition of fiscal consolidation matters: expenditure-based adjustments and revenue-based measures may have different implications for economic activity and fiscal outcomes. Tailoring fiscal consolidation strategies to account for country-specific economic structures, institutional quality, and initial fiscal conditions can improve their effectiveness and minimize adverse short-term effects. While the findings underscore the challenges of achieving fiscal sustainability through consolidation, they also call for a nuanced approach that balances fiscal discipline with policies fostering economic growth. A deeper exploration of long-term dynamics and the conditions under which fiscal consolidation can yield sustainable improvements in fiscal health would further enrich this analysis.
The economic implications of these results are significant for the OECD countries. A decline in the primary balance following fiscal consolidation could lead to higher borrowing costs and increased vulnerability to economic shocks. This could undermine the very objectives of fiscal consolidation, such as reducing debt levels and improving fiscal sustainability. Therefore, it is essential to consider the timing, composition, and magnitude of fiscal consolidation measures to avoid adverse economic outcomes. These results are similar to those of Aldama and Creel (Reference Aldama and Creel2022) who found that in some cases, fiscal consolidation can lead to a worsening of fiscal balances, particularly in the short term. This study aligns with the finding that consolidation can have a contractionary effect on the economy, which in turn negatively impacts the fiscal balance. On the other hand, Guajardo et al. (Reference Guajardo, Leigh and Pescatori2014) research highlighted that fiscal consolidations typically lead to a short-term deterioration in economic performance, including lower GDP growth and worsening fiscal balances, before any potential long-term benefits materialize. The Hausman test (Hansen Reference Hansen1982) rejects random effects at 10% and 1% levels Table 4, indicating correlation between individual effects and explanatory variables. A fixed-effects threshold model ensures reliable estimates. Table 5 presents the results of the fixed effect threshold estimator and bootstrap analysis of GDP per capita.
Table 5. Fixed effect government debt threshold on GDP per capita
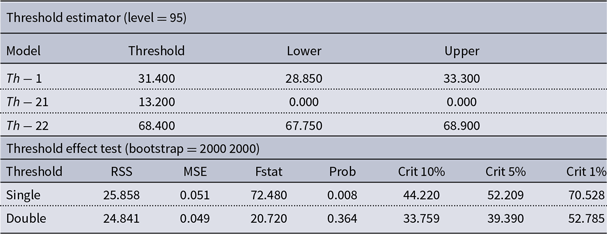
Note: that ***, **, * denote the significance of the threshold using the $F-test$
and critical values for 99%, 95%, and 90% of the threshold, respectively. Composed by the author.
$F-test$
and critical values for 99%, 95%, and 90% of the threshold, respectively. Composed by the author.
4.2. Impact of government debt thresholds and their impact on GDP per capita in the present of fiscal consolidation
The results are presented in Table 5 in the effort to investigate the following questionFootnote
8
. What impact do government debt thresholds and their impact on GDP per capita in the present of fiscal consolidation? The test for a single threshold is statistically significant at the 1% level, as the F-statistic 72.48% exceeds the 1% critical value 70.52%. This result indicates strong evidence of nonlinear effects of government debt on GDP per capita, with a threshold at approximately 31.4% of GDP. The results suggest that government debt exceeding 31.4% of GDP may begin to have detrimental effects on GDP per capita performance in OECD countries, particularly when fiscal consolidation measures are in place. Fiscal consolidation strategies should be designed to stabilize or reduce debt levels below this threshold to support long-term economic growth. The presence of such a threshold further justifies the importance of nonlinear modeling in fiscal policy analysis, as the impact of debt on growth is not constant across different debt regimes. This finding supports the hypothesis that there is a debt threshold beyond which the economic effects of debt deteriorate, particularly during periods of fiscal consolidation. $Th-21$
has no meaningful confidence interval 0.00 to 0.00, implying statistical insignificance or model instability at that lower bound.
$Th-21$
has no meaningful confidence interval 0.00 to 0.00, implying statistical insignificance or model instability at that lower bound. $Th-22$
has a narrow confidence interval 67.75% to 68.90%, indicating precision at the upper threshold. Although this higher threshold lacks statistical significance in this study, it is noteworthy that previous research has identified similar high debt thresholds as having harmful effects on economic performance. Specifically, (55, Jacobs et al. Reference Jacobs, Ogawa, Sterken and Tokutsu2020) have found that exceeding critical debt thresholds, often around similar or even higher levels, is associated with adverse economic outcomes. These studies support the notion that although the 68.40% threshold may not be significant in this analysis, it is prudent to remain cautious regarding high levels of government debt. The findings suggest a nuanced relationship between government debt and economic growth, with certain thresholds having significant negative implications for economic performance.
$Th-22$
has a narrow confidence interval 67.75% to 68.90%, indicating precision at the upper threshold. Although this higher threshold lacks statistical significance in this study, it is noteworthy that previous research has identified similar high debt thresholds as having harmful effects on economic performance. Specifically, (55, Jacobs et al. Reference Jacobs, Ogawa, Sterken and Tokutsu2020) have found that exceeding critical debt thresholds, often around similar or even higher levels, is associated with adverse economic outcomes. These studies support the notion that although the 68.40% threshold may not be significant in this analysis, it is prudent to remain cautious regarding high levels of government debt. The findings suggest a nuanced relationship between government debt and economic growth, with certain thresholds having significant negative implications for economic performance.
Based on the results, policymakers should consider a cautious approach when managing government debt levels. Specifically, a 31.40% threshold suggests that maintaining government debt below this level is crucial for sustaining economic performance. Policymakers should keep debt levels below this threshold to avoid potential adverse effects on GDP per capita. Although the 68.40% threshold was not found to be statistically significant in this study, it is essential to remain vigilant about higher debt levels. Policymakers should carefully assess the potential risks associated with crossing this higher threshold, particularly considering other studies indicating detrimental effects at such levels. If current debt levels approach these thresholds, implement gradual and well-structured fiscal consolidation measures to mitigate potential negative economic impacts.
4.3. Impact of government expenditure and government revenue on GDP per capita
Table6 in the effort to investigate the following question of what is the impact of government expenditure and government revenue on GDP per capita? The findings from Table 6, estimation 1, suggest that government expenditure significantly impacts economic growth. Specifically, a 1% increase in government expenditure leads to a 0.0104% decrease in economic growth, indicating that higher government spending may be associated with a slight reduction in growth. This implies that in the context of fiscal consolidation, increasing government expenditure might exert adverse effects on economic performance. In contrast, the results indicate that changes government revenues do not have a statistically significant impact on GDP per capita. This suggests that fluctuations in government revenues, within the scope of this study, do not directly influence GDP per capita measurably.
Table 6. Fixed effect impact of government expenditure and government revenue on GDP per capita
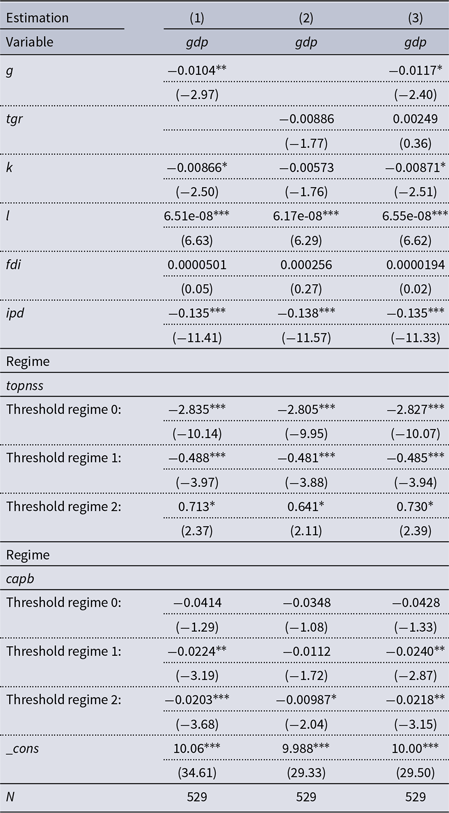
The t statistics are in parentheses; * p < 0.05, ** p < 0.01, *** p < 0.001.
Given the negative relationship between government expenditure and economic growth, policymakers should carefully evaluate and optimize government spending. It is crucial to ensure that expenditure is targeted toward investments and programs that stimulate GDP per capita and efficiency rather than simply increasing overall spending. Since total government revenues do not appear to significantly affect economic growth, it is advisable to focus on efficient and equitable tax policies that ensure stable revenue without exerting undue pressure on economic growth. Emphasizing spending on growth-enhancing investments, such as infrastructure, education, and R&D, can potentially offset the negative impacts of government expenditure on growth. Baum et al. (Reference Baum, Checherita-Westphal and Rother2013), found that that the impact of government expenditure on growth can be highly context-dependent. Well-targeted spending increases can stimulate growth, but poorly designed increases may have minimal or even negative effects. While Dumitrescu et al. (Reference Dumitrescu, Kagitci and Cepoi2022), Qureshi and Liaqat (Reference Qureshi and Liaqat2020) and Elkhalfi et al. (Reference Elkhalfi, Chaabita, Benboubker, Ghoujdam, Zahraoui, Alaoui, Laalam, Belhaj and Hammouch2024) noted that an increase in government expenditure is associated with a reduction in economic growth, particularly in high-debt countries, supporting the result that government expenditure can negatively affect economic growth.
The threshold estimations reveal significant nonlinearities in the relationship between fiscal policy variables and GDP per capita, particularly with respect to the levels of top trade openness $\textit{topnss}$
and the cyclically adjusted primary balance
$\textit{topnss}$
and the cyclically adjusted primary balance $capb$
. The results emphasize the importance of identifying optimal fiscal configurations that enhance growth performance while maintaining macroeconomic stability. For the
$capb$
. The results emphasize the importance of identifying optimal fiscal configurations that enhance growth performance while maintaining macroeconomic stability. For the $\textit{topnss}$
thresholds, the estimated coefficients across regimes indicate heterogeneous effects on GDP per capita. In Regime 0, corresponding to observations below the first threshold, the coefficient is approximately −2.83 and statistically significant at the 1% level. This suggests that low levels of non-social spending exert a substantial negative influence on GDP per capita, possibly due to underinvestment in critical infrastructure or productive public services. In Regime 1, which captures intermediate levels of
$\textit{topnss}$
thresholds, the estimated coefficients across regimes indicate heterogeneous effects on GDP per capita. In Regime 0, corresponding to observations below the first threshold, the coefficient is approximately −2.83 and statistically significant at the 1% level. This suggests that low levels of non-social spending exert a substantial negative influence on GDP per capita, possibly due to underinvestment in critical infrastructure or productive public services. In Regime 1, which captures intermediate levels of $\textit{topnss}$
, the effect remains negative but substantially attenuated −0.48, pointing to a diminished but persistent growth-reducing impact, likely reflecting inefficiencies or transitional fiscal rigidities. Conversely, in Regime 2, which reflects high levels of non-social expenditure, the coefficient becomes positive 0.71 and significant at the 10% level. This implies that at elevated expenditure levels, non-social spending may become growth-enhancing, potentially through improved allocative efficiency, enhanced capital accumulation, or multiplier effects associated with strategic public investment.
$\textit{topnss}$
, the effect remains negative but substantially attenuated −0.48, pointing to a diminished but persistent growth-reducing impact, likely reflecting inefficiencies or transitional fiscal rigidities. Conversely, in Regime 2, which reflects high levels of non-social expenditure, the coefficient becomes positive 0.71 and significant at the 10% level. This implies that at elevated expenditure levels, non-social spending may become growth-enhancing, potentially through improved allocative efficiency, enhanced capital accumulation, or multiplier effects associated with strategic public investment.
In contrast, the estimated coefficients for the $capb$
threshold regimes consistently reveal a negative relationship with GDP per capita at higher levels of fiscal consolidation. While the effect is statistically insignificant in Regime 0 suggesting negligible growth impact when the
$capb$
threshold regimes consistently reveal a negative relationship with GDP per capita at higher levels of fiscal consolidation. While the effect is statistically insignificant in Regime 0 suggesting negligible growth impact when the $capb$
is relatively loose the coefficients in Regime 1 and Regime 2 are both negative and statistically significant. Notably, the adverse impact intensifies in Regime 2, indicating that aggressive fiscal consolidation beyond a critical threshold may exert contractionary effects on growth, consistent with theoretical expectations regarding the short-run costs of fiscal tightening in demand-constrained environments. These findings imply that while moderate fiscal adjustments may be neutral or benign in terms of growth, excessive consolidation particularly under binding output gaps could undermine economic expansion. Taken together, the presence of double threshold effects in both
$capb$
is relatively loose the coefficients in Regime 1 and Regime 2 are both negative and statistically significant. Notably, the adverse impact intensifies in Regime 2, indicating that aggressive fiscal consolidation beyond a critical threshold may exert contractionary effects on growth, consistent with theoretical expectations regarding the short-run costs of fiscal tightening in demand-constrained environments. These findings imply that while moderate fiscal adjustments may be neutral or benign in terms of growth, excessive consolidation particularly under binding output gaps could undermine economic expansion. Taken together, the presence of double threshold effects in both $\textit{topnss}$
and
$\textit{topnss}$
and $capb$
highlights the nonlinear and regime-dependent nature of fiscal policy effectiveness. The evidence advocates for a calibrated approach to fiscal consolidation, whereby the composition and magnitude of adjustment are aligned with growth objectives and macroeconomic conditions.
$capb$
highlights the nonlinear and regime-dependent nature of fiscal policy effectiveness. The evidence advocates for a calibrated approach to fiscal consolidation, whereby the composition and magnitude of adjustment are aligned with growth objectives and macroeconomic conditions.
4.4. Impact of the disaggregated government expenditure and tax categories impact on GDP per capita
Table 7 presents the disaggregated effects of government expenditure categories on GDP per capita across a panel of OECD countries during periods of fiscal consolidation. This is in the effort to investigate the question what is the impact of the disaggregated government expenditure and tax categories impact on GDP per capita?
Table 7. Disaggregated government expenditure impact on GDP per capita
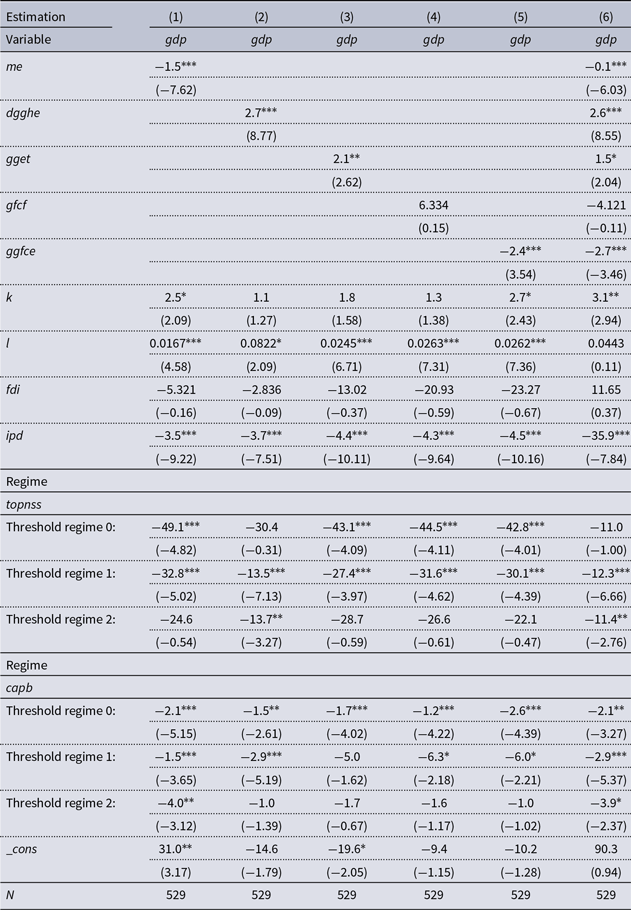
The t statistics are in parentheses;* p < 0.05, ** p < 0.01, *** p < 0.001.
The findings reveal significant heterogeneity in the growth effects of different expenditure components, with critical implications for expenditure composition and fiscal policy design under budgetary constraints. In estimation 1 and 5 it is found that military expenditure $me$
to exert a statistically significant and negative impact on GDP per capita with the magnitude of 1.5% and 0.1% respectably. This result aligns with the broader literature which suggests that military spending, while potentially justifiable on grounds of national security, tends to exhibit limited or even adverse productivity effects, particularly in the absence of external conflict or security threats. In contrast, in estimation 2 and 5 health expenditure
$me$
to exert a statistically significant and negative impact on GDP per capita with the magnitude of 1.5% and 0.1% respectably. This result aligns with the broader literature which suggests that military spending, while potentially justifiable on grounds of national security, tends to exhibit limited or even adverse productivity effects, particularly in the absence of external conflict or security threats. In contrast, in estimation 2 and 5 health expenditure $\textit{dgghe}$
and education expenditure
$\textit{dgghe}$
and education expenditure $gget$
are both positively and significantly associated with GDP per capita. Health spending demonstrates a strong and consistently significant effect, with coefficients of approximately 2.6% to 2.7%. This indicating that investment in public health is a potent driver of economic performance. Education expenditure also exhibits a positive effect, although the statistical significance is less robust with coefficients 2.1% and 1.5%. These findings are consistent with endogenous growth theory, which posits that human capital accumulation fostered through improved health and education constitutes a critical engine of long-run economic growth. On the other hand, in the context of fiscal consolidation in OECD countries, the results suggest that safeguarding or even augmenting social sector expenditures may yield substantial growth dividends without undermining fiscal adjustment objectives.
$gget$
are both positively and significantly associated with GDP per capita. Health spending demonstrates a strong and consistently significant effect, with coefficients of approximately 2.6% to 2.7%. This indicating that investment in public health is a potent driver of economic performance. Education expenditure also exhibits a positive effect, although the statistical significance is less robust with coefficients 2.1% and 1.5%. These findings are consistent with endogenous growth theory, which posits that human capital accumulation fostered through improved health and education constitutes a critical engine of long-run economic growth. On the other hand, in the context of fiscal consolidation in OECD countries, the results suggest that safeguarding or even augmenting social sector expenditures may yield substantial growth dividends without undermining fiscal adjustment objectives.
Surprisingly, in estimation 3 and 5 of gross fixed capital formation $gfcf$
does not yield a statistically significant relationship with GDP per capita indicating no discernible growth effect within the period of analysis. This deviation from conventional growth theory expectations may reflect the inefficiency or misallocation of public capital expenditures, short-term lags in their transmission to output, or the predominance of maintenance and replacement investments rather than new productive infrastructure. Lastly, in estimation 4 and 5 of general government final consumption expenditure
$gfcf$
does not yield a statistically significant relationship with GDP per capita indicating no discernible growth effect within the period of analysis. This deviation from conventional growth theory expectations may reflect the inefficiency or misallocation of public capital expenditures, short-term lags in their transmission to output, or the predominance of maintenance and replacement investments rather than new productive infrastructure. Lastly, in estimation 4 and 5 of general government final consumption expenditure $\textit{ggfce}$
is consistently and significantly negatively associated with GDP per capita, with coefficients ranging from 2.4% and 2.7% respectably. This category typically comprises recurrent outlays on wages, goods, and services which, while necessary for government operations, may have limited productive spill overs. The negative association highlights the macroeconomic costs of relying on consumption-heavy expenditure structures, particularly when fiscal consolidation necessitates expenditure restraint.
$\textit{ggfce}$
is consistently and significantly negatively associated with GDP per capita, with coefficients ranging from 2.4% and 2.7% respectably. This category typically comprises recurrent outlays on wages, goods, and services which, while necessary for government operations, may have limited productive spill overs. The negative association highlights the macroeconomic costs of relying on consumption-heavy expenditure structures, particularly when fiscal consolidation necessitates expenditure restraint.
Table 8 shows the impact of disaggregated tax categories on GDP per capita. Across estimations 1 to 4, when $cit,\; pit,\; ssc,\; and\; it$
are estimated individually in the model, they are found to be statistically insignificant. However, there are tax categories that have a significant impact on GDP per capita in estimation (5). In Table 8, estimation 5 shows that corporate income tax
$cit,\; pit,\; ssc,\; and\; it$
are estimated individually in the model, they are found to be statistically insignificant. However, there are tax categories that have a significant impact on GDP per capita in estimation (5). In Table 8, estimation 5 shows that corporate income tax $cit$
coefficient is 0.033, however, the effect is statistically insignificant, suggesting no robust relationship between
$cit$
coefficient is 0.033, however, the effect is statistically insignificant, suggesting no robust relationship between $cit$
and output. The economic implication is that the growth impact of
$cit$
and output. The economic implication is that the growth impact of $cit$
in high-income economies is likely muted by capital mobility and tax base erosion. This finding may be attributed to the high degree of capital mobility and the prevalence of advanced tax planning strategies, which limit the effective tax burden on capital and thereby weaken the direct growth effects of
$cit$
in high-income economies is likely muted by capital mobility and tax base erosion. This finding may be attributed to the high degree of capital mobility and the prevalence of advanced tax planning strategies, which limit the effective tax burden on capital and thereby weaken the direct growth effects of $cit$
. Moreover, the result is consistent with the view that corporate taxation in OECD countries is often designed with multiple objectives such as profit-shifting deterrence and international competitiveness rather than as a primary growth lever. On the other hand personal income tax
$cit$
. Moreover, the result is consistent with the view that corporate taxation in OECD countries is often designed with multiple objectives such as profit-shifting deterrence and international competitiveness rather than as a primary growth lever. On the other hand personal income tax $pit$
coefficient is 0.431, implying that a one-unit increase in PIT corresponds to a 43.1% increase in GDP per capita and statistically significant at the 1% level. As such
$pit$
coefficient is 0.431, implying that a one-unit increase in PIT corresponds to a 43.1% increase in GDP per capita and statistically significant at the 1% level. As such $pit$
’s potential as a growth-supportive tax instrument in OECD countries, possibly due to its redistributive properties and its role in financing productive government spending. This result suggests that
$pit$
’s potential as a growth-supportive tax instrument in OECD countries, possibly due to its redistributive properties and its role in financing productive government spending. This result suggests that $pit$
, when structured progressively and administered efficiently, may enhance economic performance through several mechanisms.
$pit$
, when structured progressively and administered efficiently, may enhance economic performance through several mechanisms.
Table 8. Disaggregated tax categories impact on GDP per capita
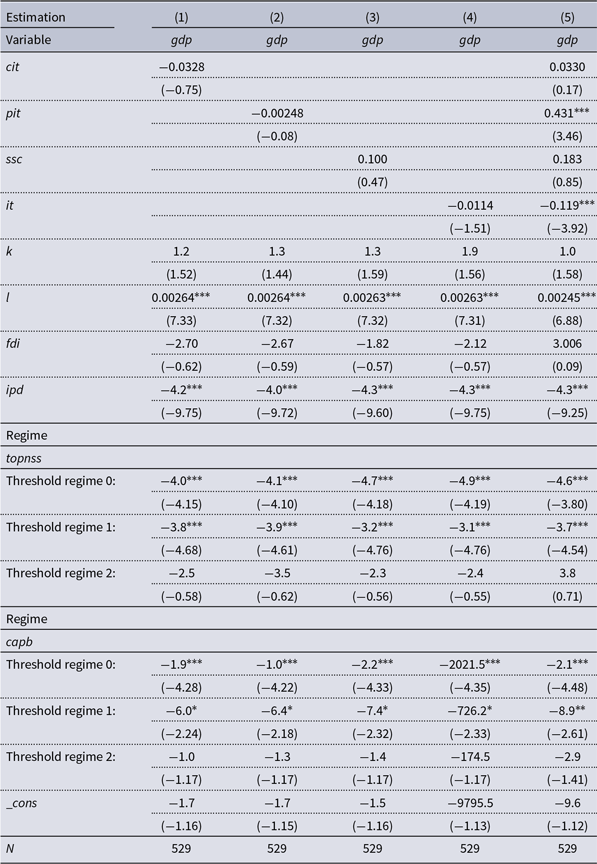
The t statistics are in parentheses; * p< 0.05, ** p< 0.01, *** p< 0.001.
First, higher $pit$
revenues can support productive public expenditure particularly in health, education, and infrastructure—thereby augmenting human capital and total factor productivity. Second, progressive income taxation can promote macroeconomic stability by smoothing consumption over the business cycle and reducing income inequality, which in turn fosters sustainable demand-led growth. The result aligns with empirical evidence that direct taxes, particularly
$pit$
revenues can support productive public expenditure particularly in health, education, and infrastructure—thereby augmenting human capital and total factor productivity. Second, progressive income taxation can promote macroeconomic stability by smoothing consumption over the business cycle and reducing income inequality, which in turn fosters sustainable demand-led growth. The result aligns with empirical evidence that direct taxes, particularly $pit$
, can be less distortionary and more growth-enhancing in advanced economies with well-developed institutions.
$pit$
, can be less distortionary and more growth-enhancing in advanced economies with well-developed institutions.
The social security contributions $scc$
is estimated coefficient is 0.183, however, the effect is not statistically significant. This outcome reflects the balancing of two opposing effects: the potential disincentive on labor supply due to higher payroll taxation versus the long-run gains from increased social protection, labor market participation, and productivity. The neutrality of
$scc$
is estimated coefficient is 0.183, however, the effect is not statistically significant. This outcome reflects the balancing of two opposing effects: the potential disincentive on labor supply due to higher payroll taxation versus the long-run gains from increased social protection, labor market participation, and productivity. The neutrality of $ssc$
in this context suggests that its growth effects may be largely contingent on the broader institutional framework, including labor market flexibility and the quality of social insurance schemes. Lastly the indirect taxes
$ssc$
in this context suggests that its growth effects may be largely contingent on the broader institutional framework, including labor market flexibility and the quality of social insurance schemes. Lastly the indirect taxes $it$
is found the have a negative coefficient of 0.119, meaning a one-unit increase in
$it$
is found the have a negative coefficient of 0.119, meaning a one-unit increase in $it$
is associated with an 11.9% decrease in GDP per capita. This effect is statistically significant at the 1% level. This finding raises concerns about the regressive nature of indirect taxes and their adverse impact on aggregate demand, particularly when consumption taxes are levied without compensatory social transfers. From a fiscal consolidation standpoint, this result suggests that shifting the tax burden towards indirect taxation may be counterproductive in terms of growth, especially in advanced economies where domestic consumption constitutes a major component of GDP.
$it$
is associated with an 11.9% decrease in GDP per capita. This effect is statistically significant at the 1% level. This finding raises concerns about the regressive nature of indirect taxes and their adverse impact on aggregate demand, particularly when consumption taxes are levied without compensatory social transfers. From a fiscal consolidation standpoint, this result suggests that shifting the tax burden towards indirect taxation may be counterproductive in terms of growth, especially in advanced economies where domestic consumption constitutes a major component of GDP.
The findings carry important implications for fiscal consolidation strategies in OECD countries. In particular, the positive and significant effect of personal income taxes on GDP per capita suggests that fiscal adjustment relying more heavily on PIT. Rather than on growth-dampening instruments such as indirect taxes may enhance macroeconomic performance while preserving fiscal space. The negative and statistically significant coefficient on IT indicates that heavy reliance on consumption-based taxation during consolidation episodes may impose contractionary pressures, especially in advanced economies where household consumption is a key growth driver. The neutrality of corporate income tax and social security contributions implies limited growth effects, underscoring that their inclusion in consolidation packages should be guided more by equity and administrative efficiency considerations than by growth objectives. Trade openness $\textit{topnss}$
regimes show that in Regimes 0 and 1, the coefficients are significantly negative value of 4.6 and 3.7, indicating that low trade openness impedes growth due to limited market access or unproductive spending. Regime 2 has a positive, though insignificant, coefficient 3.8, suggesting potential growth benefits for countries with higher trade openness, although the result is inconclusive. While the cyclically adjusted primary balance
$\textit{topnss}$
regimes show that in Regimes 0 and 1, the coefficients are significantly negative value of 4.6 and 3.7, indicating that low trade openness impedes growth due to limited market access or unproductive spending. Regime 2 has a positive, though insignificant, coefficient 3.8, suggesting potential growth benefits for countries with higher trade openness, although the result is inconclusive. While the cyclically adjusted primary balance $capb$
regimes reveal that Regime 0 has a strong negative and significant effect of 2.1, indicating that even moderate fiscal tightening can hinder growth. Regime 1 shows a more significant negative impact of 8.9, suggesting excessive fiscal consolidation severely stifles growth. Regime 2 has a negative but insignificant coefficient of 2.9, indicating diminishing effects from further consolidation.
$capb$
regimes reveal that Regime 0 has a strong negative and significant effect of 2.1, indicating that even moderate fiscal tightening can hinder growth. Regime 1 shows a more significant negative impact of 8.9, suggesting excessive fiscal consolidation severely stifles growth. Regime 2 has a negative but insignificant coefficient of 2.9, indicating diminishing effects from further consolidation.
4.5. Variation of government debt thresholds affecting GDP per capita during fiscal consolidation
Figure 3 illustrates the threshold effect of gross national debt on GDP per capita. The results are shown in figure 1 in the effort to investigate the following question. What is the government’s threshold that impacts GDP per capita in the current fiscal consolidation? The analysis reveals that within OECD economies, the impact of gross domestic debt on GDP per capita is influenced by specific debt thresholds. When government debt exceeds 31.40% of GDP, there is a notable increase in the likelihood of subsequent GDP per capita. As debt levels continue to rise, the probability of GDP per capita also increases. However, once government debt reaches 68.40% of GDP, the likelihood of a decline in GDP per capita becomes significant. Beyond this higher threshold, the probability of GDP per capita begins to increase again. This pattern highlights the importance of monitoring debt levels to understand their effects on economic performance. This suggests that moderate debt levels can be associated with growth outcomes, whereas very high debt levels may initially be harmful but could lead to improved growth prospects under certain conditions. Understanding these thresholds is crucial for policymakers in developing effective fiscal strategies to support sustainable economic growth.
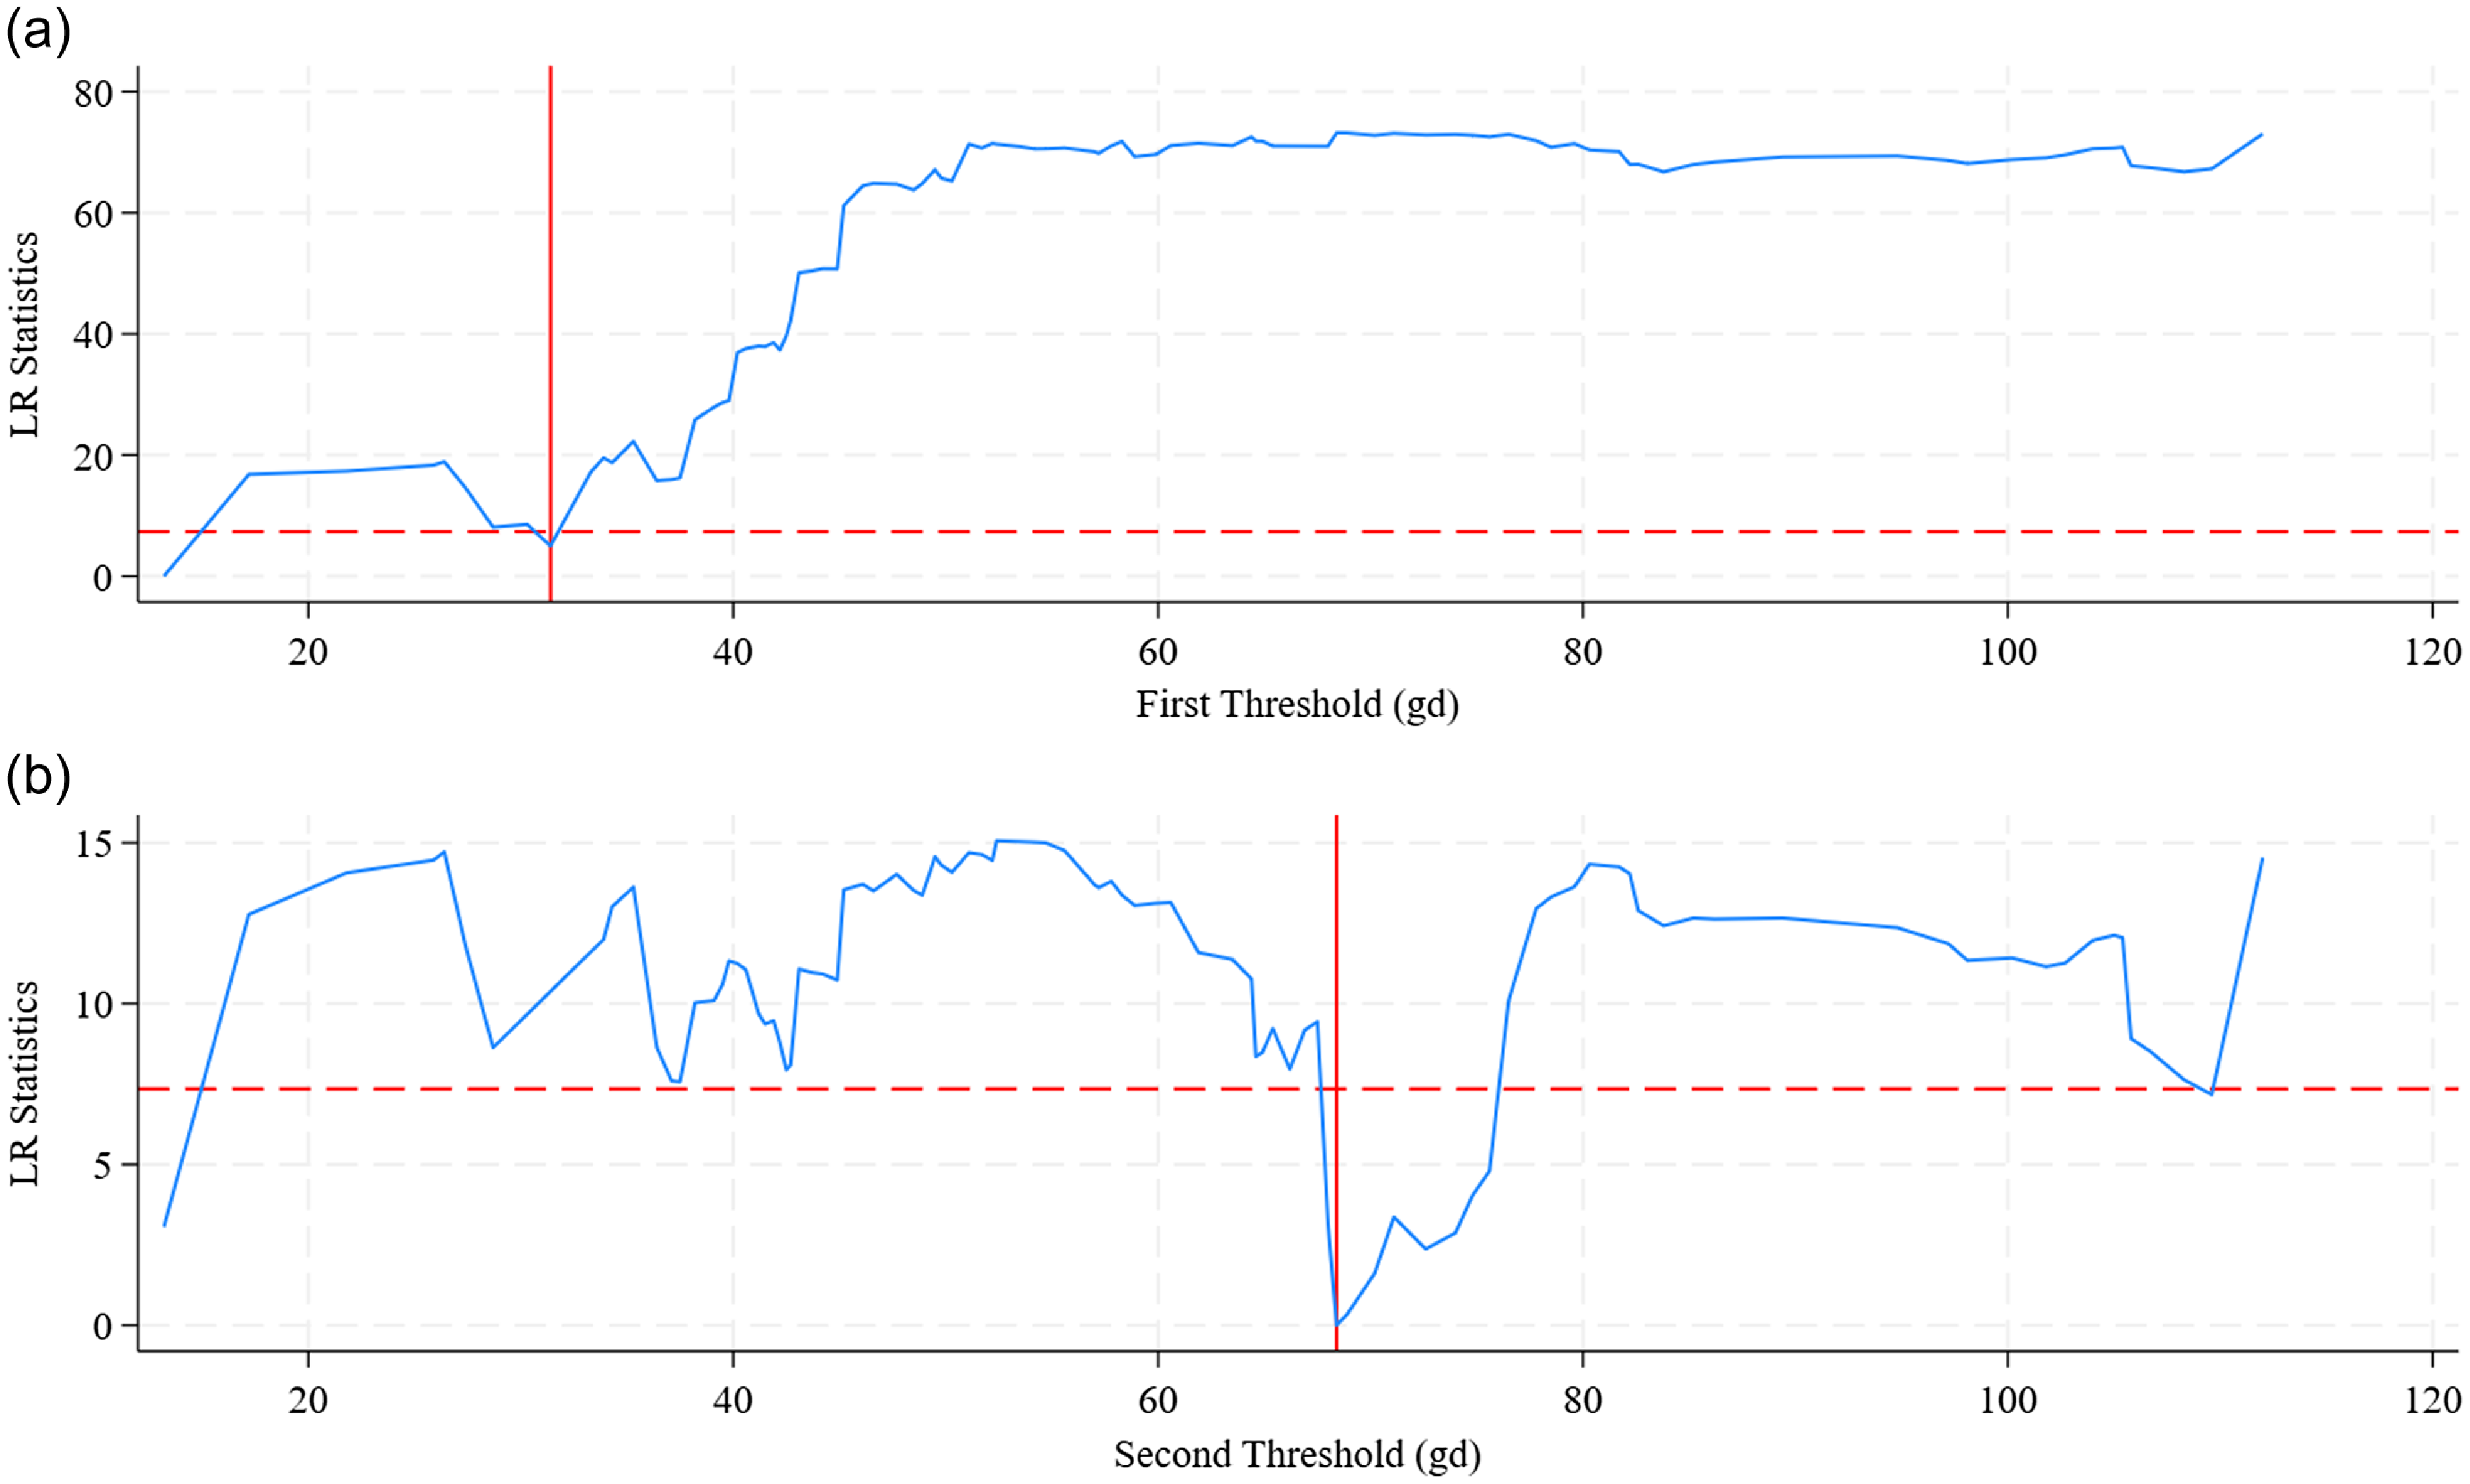
Figure 3. Threshold of gross domestic debt on GDP per capita. Note the $gd$
general government gross debt. Composed by the author.
$gd$
general government gross debt. Composed by the author.
In OECD countries, maintaining debt levels below a higher threshold is crucial to avoid potential adverse effects on economic performance. Policymakers should strive to keep government debt below the 68.40% threshold to prevent economic downturns and ensure stable growth. Effective debt-management strategies should be implemented to avoid crossing this critical threshold. Moderate debt levels below 31.40% may be beneficial, but prudent use of debt is important. Investments funded by debt should be targeted toward growth-enhancing projects that contribute to long-term economic stability and productivity. For countries approaching or exceeding the 68.40% threshold, policymakers should develop contingency plans to address potential negative impacts on economic growth. This includes considering structural reforms and fiscal adjustments to mitigate adverse effects. The results suggest that the relationship between government debt and GDP per capita is non-linear and context dependent. The identification of specific debt thresholds of 31.40% and 68.40% highlights the complexity of how debt levels influence economic growth. These findings support the notion that both low and high debt levels can have significant, though differing, impacts on economic performance. This challenge simplistic views of government debt and emphasizes the need for a nuanced understanding of debt dynamics in economic theory.
4.6. Impact of government debt thresholds on the primary fiscal balance in the presence of fiscal consolidation
Table 9 shows the fixed-effect threshold estimator employed to analyze the impact of the primary fiscal balance. The results are presented in Table 9 in the effort to investigate the following question what impact do government debt thresholds have on the primary fiscal balance in the presence of fiscal consolidation? Bootstrap techniques were used to validate the robustness and reliability of the identified thresholds. This method involves repeatedly sampling the dataset to assess the stability of the threshold estimates and ensure that the results are not driven by sample-specific anomalies. The findings from this analysis indicate that the threshold of 86.70% is statistically significant at the 1% level. This conclusion is supported by the fact that the F-statistic surpasses the critical value required for statistical significance at this level. The high significance of the 86.70% threshold indicates that it plays a crucial role in influencing the relationship under investigation, suggesting that at or above this debt level, the observed effects on the dependent variable become statistically significant and meaningful. Conversely, the threshold of 80.70% does not exhibit statistical significance because it falls within the range of insignificance between 10% and 1% significance levels.
Table 9. Fixed effect threshold estimator and bootstrap for primary fiscal balance
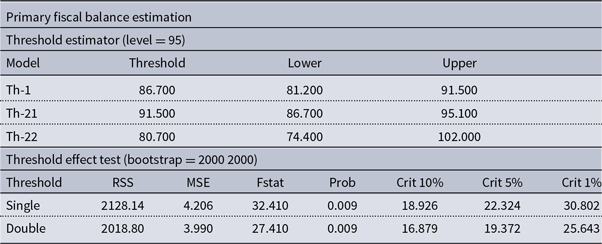
Note: that ***, **, *; denote the significance of the threshold using the $F-test$
and critical values for 99%, 95%, and 90% of the threshold, respectively. Composed by the author.
$F-test$
and critical values for 99%, 95%, and 90% of the threshold, respectively. Composed by the author.
This lack of significance suggests that the 80.70% threshold does not substantially affect the relationship being analyzed. In other words, the impact of government debt at this level is not statistically distinguishable from zero or negligible effects, indicating that government debt does not play a critical role in shaping the outcomes of interest. These results collectively underscore the importance of the 86.70% threshold for determining the dynamics of the relationships studied. The significant threshold suggests that debt levels above this point have a notable impact, while the limited relevance of the 80.70% threshold highlights that not all debt levels are equally influential. Thus, policymakers and analysts should focus on the 86.70% threshold when evaluating the effects of government debt on economic variables.
4.7. Impact of total government revenue and expenditures on the primary fiscal balance
The estimation results presented in Table 10 provide compelling evidence of government revenue and government expenditure and impact on primary fiscal balance. To investigate the question what is the impact of government expenditure and government revenue on primary fiscal balance? It is found the in estimation 1, that government expenditure $g$
is positive and statistically significant. This reflect that for a 1% in government expenditure result to 0.524% associated with improvements in the primary fiscal balance. While seemingly counterintuitive, this result can be rationalized by considering the composition and efficiency of expenditure. In advanced economies, a substantial portion of public spending may be directed toward productivity-enhancing investments that augment future fiscal capacity through higher output and, consequently, expanded revenue bases. Moreover, this finding aligns with theoretical frameworks positing that high-quality expenditure can exert a positive fiscal multiplier effect, which ultimately supports fiscal consolidation through revenue-enhancing channels. On the other hand, in estimation 2, government revenue
$g$
is positive and statistically significant. This reflect that for a 1% in government expenditure result to 0.524% associated with improvements in the primary fiscal balance. While seemingly counterintuitive, this result can be rationalized by considering the composition and efficiency of expenditure. In advanced economies, a substantial portion of public spending may be directed toward productivity-enhancing investments that augment future fiscal capacity through higher output and, consequently, expanded revenue bases. Moreover, this finding aligns with theoretical frameworks positing that high-quality expenditure can exert a positive fiscal multiplier effect, which ultimately supports fiscal consolidation through revenue-enhancing channels. On the other hand, in estimation 2, government revenue $tgr$
is positively signed but statistically insignificant with a value of 0.0642%. The result suggests limited marginal gains from additional revenue mobilization at prevailing levels. This may reflect diminishing fiscal returns to taxation in high-income economies characterized by already extensive tax systems. Moreover, it reinforces the notion that fiscal consolidation efforts predicated solely on revenue augmentation may be insufficient or counterproductive, especially in the absence of broader structural reforms targeting base broadening and compliance enhancement.
$tgr$
is positively signed but statistically insignificant with a value of 0.0642%. The result suggests limited marginal gains from additional revenue mobilization at prevailing levels. This may reflect diminishing fiscal returns to taxation in high-income economies characterized by already extensive tax systems. Moreover, it reinforces the notion that fiscal consolidation efforts predicated solely on revenue augmentation may be insufficient or counterproductive, especially in the absence of broader structural reforms targeting base broadening and compliance enhancement.
Table 10. Government revenue and government expenditure and impact on primary fiscal balance
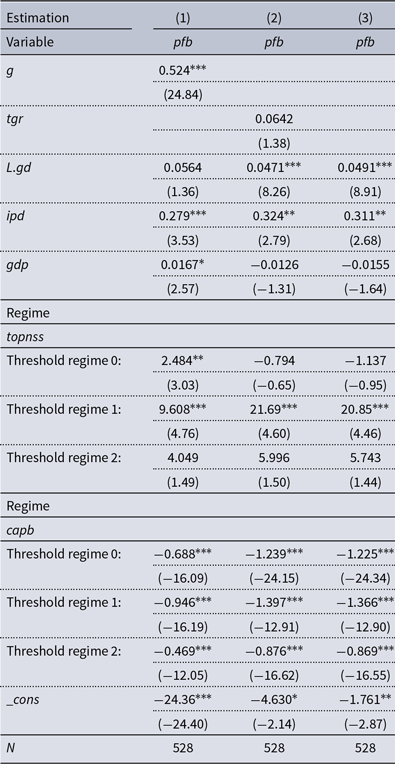
The t statistics are in parentheses; * p< 0.05, ** p< 0.01, *** p< 0.001.
The lagged value of general government gross debt $L.gd$
emerges as a key determinant of fiscal behavior. Its coefficient is positive and highly significant in estimation 2 and 3, respectively. This result confirms the presence of a debt-sensitive fiscal reaction function, whereby governments actively adjust their primary balances in response to rising debt levels in order to maintain solvency and reassure financial markets. Such behavior is consistent with the theoretical predictions of Bohn (Reference Bohn1998), who posits that a positive and significant relationship between the primary balance and lagged debt is indicative of sustainable fiscal policy. The significance of this coefficient under the threshold framework also implies that fiscal authorities exhibit greater responsiveness in high-debt regimes, possibly to avoid adverse market reactions, rating downgrades, or constraints on monetary sovereignty. Additionally, interest payments on public debt
$L.gd$
emerges as a key determinant of fiscal behavior. Its coefficient is positive and highly significant in estimation 2 and 3, respectively. This result confirms the presence of a debt-sensitive fiscal reaction function, whereby governments actively adjust their primary balances in response to rising debt levels in order to maintain solvency and reassure financial markets. Such behavior is consistent with the theoretical predictions of Bohn (Reference Bohn1998), who posits that a positive and significant relationship between the primary balance and lagged debt is indicative of sustainable fiscal policy. The significance of this coefficient under the threshold framework also implies that fiscal authorities exhibit greater responsiveness in high-debt regimes, possibly to avoid adverse market reactions, rating downgrades, or constraints on monetary sovereignty. Additionally, interest payments on public debt $ipd$
are consistently positive and significant across all specifications. This suggests that higher debt servicing costs act as a disciplining device, compelling governments to implement stronger primary surpluses to offset the fiscal burden imposed by rising interest expenditures. The implication is that fiscal authorities in OECD countries internalize the intertemporal budget constraint and engage in proactive adjustments to ensure debt sustainability when faced with adverse cost dynamics.
$ipd$
are consistently positive and significant across all specifications. This suggests that higher debt servicing costs act as a disciplining device, compelling governments to implement stronger primary surpluses to offset the fiscal burden imposed by rising interest expenditures. The implication is that fiscal authorities in OECD countries internalize the intertemporal budget constraint and engage in proactive adjustments to ensure debt sustainability when faced with adverse cost dynamics.
The coefficient on GDP per capita $gdp$
is positive and marginally significant in estimation 1, but becomes negative and statistically insignificant in estimations 2 and 3. This pattern may reflect the complex and potentially nonlinear relationship between economic development and fiscal balance. While higher income levels can broaden the tax base, they may also generate increased demand for public services, leading to greater expenditure pressures. Furthermore, advanced economies often face structural challenges such as population aging and low productivity growth, which may dilute the fiscal dividends of higher income. These findings underscore the importance of adopting a nuanced and state-contingent approach to fiscal consolidation. The evidence supports the hypothesis that governments in advanced economies do not follow uniform fiscal rules but instead respond dynamically to changes in their fiscal environment, particularly the level of public indebtedness and associated financing costs. The significance of threshold effects implies that fiscal policy is more active and precautionary when debt exceeds critical thresholds, consistent with the literature on non-linear fiscal responses and debt intolerance (Ostry et al. Reference Ostry, Ghosh, Kim and Qureshi2010).
$gdp$
is positive and marginally significant in estimation 1, but becomes negative and statistically insignificant in estimations 2 and 3. This pattern may reflect the complex and potentially nonlinear relationship between economic development and fiscal balance. While higher income levels can broaden the tax base, they may also generate increased demand for public services, leading to greater expenditure pressures. Furthermore, advanced economies often face structural challenges such as population aging and low productivity growth, which may dilute the fiscal dividends of higher income. These findings underscore the importance of adopting a nuanced and state-contingent approach to fiscal consolidation. The evidence supports the hypothesis that governments in advanced economies do not follow uniform fiscal rules but instead respond dynamically to changes in their fiscal environment, particularly the level of public indebtedness and associated financing costs. The significance of threshold effects implies that fiscal policy is more active and precautionary when debt exceeds critical thresholds, consistent with the literature on non-linear fiscal responses and debt intolerance (Ostry et al. Reference Ostry, Ghosh, Kim and Qureshi2010).
From a policy perspective, the positive relationship between government expenditure and the primary balance challenges the conventional austerity narrative and suggests that expenditure reallocation, rather than mere retrenchment, may be a more effective strategy for achieving fiscal sustainability. This is particularly relevant in the post-pandemic context, where fiscal space remains constrained but the need for public investment to support long-term growth and resilience is acute. The results reveal that fiscal behavior in OECD countries under consolidation is both strategic and sensitive to macro-fiscal thresholds, with implications for the design of future fiscal frameworks. Policymakers should prioritize fiscal rules and institutions that incorporate flexibility and responsiveness to debt dynamics, while also safeguarding investment in productive public goods. These findings contribute to the growing empirical literature on non-linear fiscal adjustments and provide a basis for more adaptive and sustainable consolidation strategies in high-debt environments.
Table 11. Disaggregated government expenditure impact on primary fiscal balance
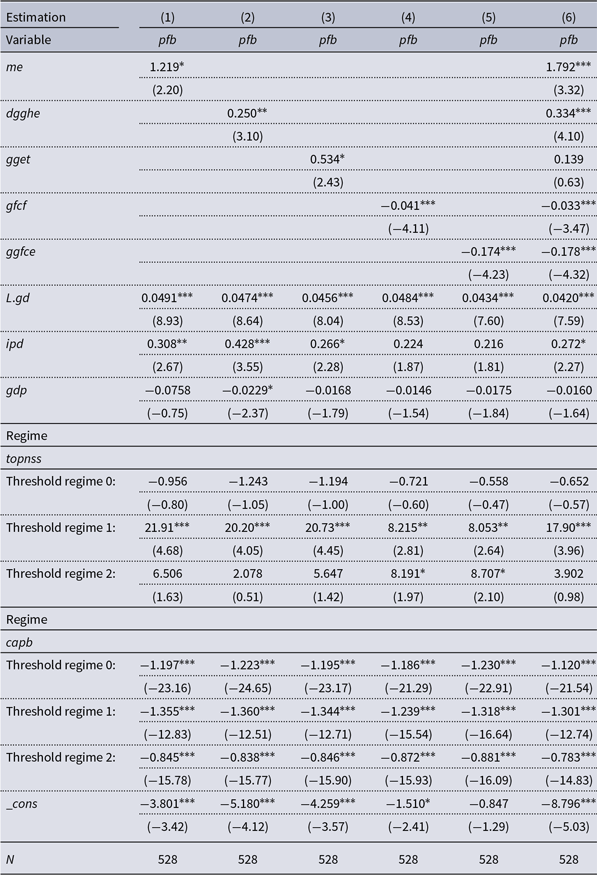
The t statistics are in parentheses; * p< 0.05, ** p< 0.01, *** p< 0.001.
4.8. Impact of the disaggregated government expenditure and tax categories impact on primary fiscal balance
Table 11 provides empirical insights into the differential effects of disaggregated components of government expenditure on the primary fiscal balance $pfb$
across OECD countries during periods of fiscal consolidation. The results highlight the nuanced relationship between the composition of public spending and fiscal sustainability, offering critical policy implications for the design of expenditure-based consolidation strategies. In estimation 1 and 6 military expenditure
$pfb$
across OECD countries during periods of fiscal consolidation. The results highlight the nuanced relationship between the composition of public spending and fiscal sustainability, offering critical policy implications for the design of expenditure-based consolidation strategies. In estimation 1 and 6 military expenditure $me$
exhibits a statistically significant and positive association with the primary fiscal balance in all specifications where it is included. The coefficient of 1.219% to 1.792% respectively, suggesting that increases in deficit outlays are, paradoxically, associated with improvements in the primary fiscal balance. This counterintuitive result may reflect the political economy dimension of fiscal policy, where military spending, often insulated from budgetary cuts due to strategic or geopolitical considerations, is offset by more aggressive consolidation efforts elsewhere in the budget. Alternatively, it may capture a fiscal illusion effect where military budgets are increased in tandem with broader austerity measures to maintain political support or national security credibility. On the other hand, in estimation 2 and 6 health expenditure
$me$
exhibits a statistically significant and positive association with the primary fiscal balance in all specifications where it is included. The coefficient of 1.219% to 1.792% respectively, suggesting that increases in deficit outlays are, paradoxically, associated with improvements in the primary fiscal balance. This counterintuitive result may reflect the political economy dimension of fiscal policy, where military spending, often insulated from budgetary cuts due to strategic or geopolitical considerations, is offset by more aggressive consolidation efforts elsewhere in the budget. Alternatively, it may capture a fiscal illusion effect where military budgets are increased in tandem with broader austerity measures to maintain political support or national security credibility. On the other hand, in estimation 2 and 6 health expenditure $\textit{dgghe}$
also shows a positive and statistically significant effect on the primary fiscal balance, with coefficients of 0.250% to 0.334%. This suggests that increases in health spending do not necessarily undermine fiscal consolidation efforts and may, in fact, be associated with improved fiscal positions. One possible explanation is that efficient public health systems may generate medium-term cost savings by reducing future liabilities in social insurance schemes and improving labor productivity and tax revenue generation, thus strengthening the fiscal base.
$\textit{dgghe}$
also shows a positive and statistically significant effect on the primary fiscal balance, with coefficients of 0.250% to 0.334%. This suggests that increases in health spending do not necessarily undermine fiscal consolidation efforts and may, in fact, be associated with improved fiscal positions. One possible explanation is that efficient public health systems may generate medium-term cost savings by reducing future liabilities in social insurance schemes and improving labor productivity and tax revenue generation, thus strengthening the fiscal base.
Estimation 3 and 6 it found that education expenditure $gget$
exhibits a weaker and less consistent relationship with the primary fiscal balance. In the model yields a positive and marginally significant effect 0.534% and 2.43% respectively but becomes statistically insignificant once other expenditure categories are controlled for estimation column 6. This attenuation suggests the effect of education spending on the fiscal balance may be contingent on broader fiscal dynamics and interdependencies among expenditure categories. The result also reflects the long-term nature of returns to education, which may not manifest in immediate fiscal improvements within the short-to-medium horizon captured in the model. Conversely in estimation 4, 5 and 6, gross fixed capital formation
$gget$
exhibits a weaker and less consistent relationship with the primary fiscal balance. In the model yields a positive and marginally significant effect 0.534% and 2.43% respectively but becomes statistically insignificant once other expenditure categories are controlled for estimation column 6. This attenuation suggests the effect of education spending on the fiscal balance may be contingent on broader fiscal dynamics and interdependencies among expenditure categories. The result also reflects the long-term nature of returns to education, which may not manifest in immediate fiscal improvements within the short-to-medium horizon captured in the model. Conversely in estimation 4, 5 and 6, gross fixed capital formation $gfcf$
and general government final consumption expenditure
$gfcf$
and general government final consumption expenditure $\textit{ggfce}$
both exhibit statistically significant and negative impacts on the primary fiscal balance. The coefficients on
$\textit{ggfce}$
both exhibit statistically significant and negative impacts on the primary fiscal balance. The coefficients on $gfcf$
being negative 0.041% and 0.033%, while those on
$gfcf$
being negative 0.041% and 0.033%, while those on $\textit{ggfce}$
having negative 0.174% and 0.178% respectively. These findings suggest that increases in capital and consumption-related government outlays are associated with deteriorations in the fiscal position, likely due to their immediate budgetary costs and limited short-run revenue offset effects. While public investment may enhance economic growth in the long run, its short-term fiscal burden poses a challenge during consolidation episodes characterized by tight budget constraints. Similarly, recurrent consumption expenditures, which are often rigid and politically sensitive, exert downward pressure on the primary fiscal balance, underscoring the importance of curbing unproductive or non-discretionary outlays in fiscal adjustment programs.
$\textit{ggfce}$
having negative 0.174% and 0.178% respectively. These findings suggest that increases in capital and consumption-related government outlays are associated with deteriorations in the fiscal position, likely due to their immediate budgetary costs and limited short-run revenue offset effects. While public investment may enhance economic growth in the long run, its short-term fiscal burden poses a challenge during consolidation episodes characterized by tight budget constraints. Similarly, recurrent consumption expenditures, which are often rigid and politically sensitive, exert downward pressure on the primary fiscal balance, underscoring the importance of curbing unproductive or non-discretionary outlays in fiscal adjustment programs.
Table 12 shows the impact of disaggregated tax categories on primary fiscal balance. Corporate income tax $cit$
is found to have a negative coefficient for
$cit$
is found to have a negative coefficient for $cit$
in estimations 1 of 0.043% and estimation 5 with the coefficient of 0.0308%. This could be due to a decrease in corporate profitability, leading to lower tax revenues and reduced investment or consumption in the economy. However, in estimation 5, the positive effect suggests that
$cit$
in estimations 1 of 0.043% and estimation 5 with the coefficient of 0.0308%. This could be due to a decrease in corporate profitability, leading to lower tax revenues and reduced investment or consumption in the economy. However, in estimation 5, the positive effect suggests that $cit$
could improve fiscal balance when coupled with other policy changes or external factors.
$cit$
could improve fiscal balance when coupled with other policy changes or external factors.
Table 12. Disaggregated tax categories impact on primary fiscal balance
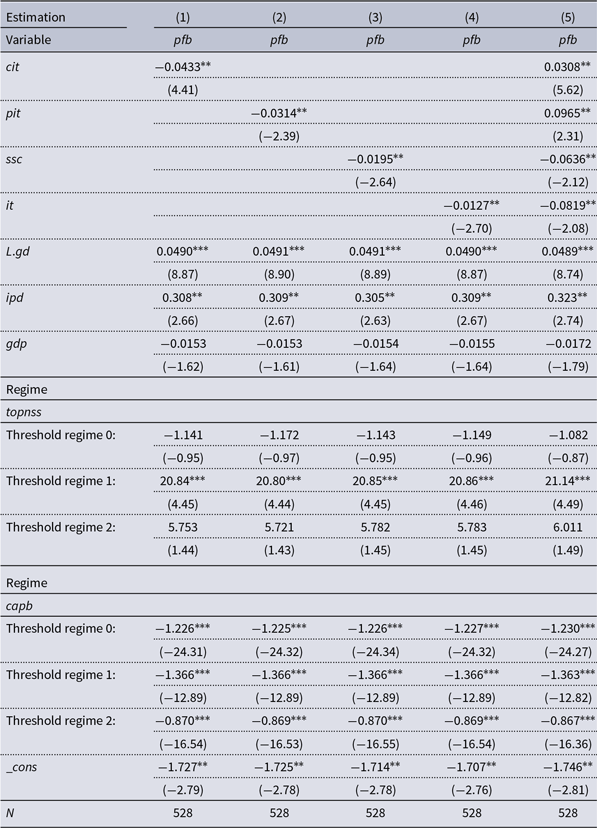
In OECD countries, which often have a relatively high tax-to-GDP ratio, the marginal effects of further increases in $cit,\; pit,\; ssc,$
and indirect taxes on the primary fiscal balance need to be carefully evaluated. These countries may benefit from broadening the tax base, reforming tax administration, and shifting towards less distortionary taxes, such as environmental taxes or taxes on capital income, which can generate revenue without severely affecting economic growth. Personal income tax
$cit,\; pit,\; ssc,$
and indirect taxes on the primary fiscal balance need to be carefully evaluated. These countries may benefit from broadening the tax base, reforming tax administration, and shifting towards less distortionary taxes, such as environmental taxes or taxes on capital income, which can generate revenue without severely affecting economic growth. Personal income tax $pit$
shows a negative and significant relationship with
$pit$
shows a negative and significant relationship with $pfb$
in estimation 1 The negative relationship observed in estimation 1 reflects that higher
$pfb$
in estimation 1 The negative relationship observed in estimation 1 reflects that higher $pit$
could discourage work effort, savings, and investment, leading to lower economic activity and tax revenue. However, the positive and significant relationship in estimation 5 implies that, under certain conditions,
$pit$
could discourage work effort, savings, and investment, leading to lower economic activity and tax revenue. However, the positive and significant relationship in estimation 5 implies that, under certain conditions, $pit$
could enhance fiscal health, likely due to the increased revenue generated from higher tax rates, possibly in an economy with sufficient income elasticity but becomes positive and significant in estimation 5.
$pit$
could enhance fiscal health, likely due to the increased revenue generated from higher tax rates, possibly in an economy with sufficient income elasticity but becomes positive and significant in estimation 5.
Social security contributions $ssc$
is found to have a negative and statistically significant coefficients for
$ssc$
is found to have a negative and statistically significant coefficients for $ssc$
across estimations 2 and 3 suggest that increases in social security contributions may reduce the primary fiscal balance, especially if they discourage labor force participation or decrease disposable income. This could have adverse long-term effects on economic productivity and growth, resulting in lower tax revenue despite higher tax rates. While increasing
$ssc$
across estimations 2 and 3 suggest that increases in social security contributions may reduce the primary fiscal balance, especially if they discourage labor force participation or decrease disposable income. This could have adverse long-term effects on economic productivity and growth, resulting in lower tax revenue despite higher tax rates. While increasing $ssc$
might initially boost fiscal revenue, it can dampen economic activity by reducing disposable income and increasing labor costs. In OECD countries, which typically have well-established social security systems, further increases in SSC may lead to a reduction in household consumption and a contraction in the labor market. OECD countries that adopt regressive taxes may face growing income inequality, which could undermine social cohesion and the sustainability of fiscal policy. Progressive tax reforms that focus on wealth and income redistribution may be necessary to ensure fiscal sustainability without harming low- and middle-income groups. Indirect taxes
$ssc$
might initially boost fiscal revenue, it can dampen economic activity by reducing disposable income and increasing labor costs. In OECD countries, which typically have well-established social security systems, further increases in SSC may lead to a reduction in household consumption and a contraction in the labor market. OECD countries that adopt regressive taxes may face growing income inequality, which could undermine social cohesion and the sustainability of fiscal policy. Progressive tax reforms that focus on wealth and income redistribution may be necessary to ensure fiscal sustainability without harming low- and middle-income groups. Indirect taxes $it$
reflect a negative coefficients for
$it$
reflect a negative coefficients for $it$
in estimations 2 and 3. The negative coefficients for indirect taxes in estimations 2 and 3 imply that higher levels of indirect taxation, which are consumption-based, may reduce overall consumption, leading to lower GDP and consequently reducing tax revenues. This could represent a supply-side constraint, where higher consumption taxes hinder economic growth and tax collection.
$it$
in estimations 2 and 3. The negative coefficients for indirect taxes in estimations 2 and 3 imply that higher levels of indirect taxation, which are consumption-based, may reduce overall consumption, leading to lower GDP and consequently reducing tax revenues. This could represent a supply-side constraint, where higher consumption taxes hinder economic growth and tax collection.
4.9. Variation of government thresholds impacting the primary fiscal balance during fiscal consolidation
What is the variation of government threshold that impacts the primary fiscal balance during fiscal consolidation? Figure 4 depicts the threshold impact of gross domestic debt on the primary fiscal balance. It is observed that when gross domestic debt exceeds the critical threshold of 86.70% of GDP, there is a significant likelihood of subsequent improvements in the primary fiscal balance. This suggests that in OECD countries, surpassing this high debt level might prompt governments to implement fiscal measures that enhance their primary fiscal balance, possibly through increased fiscal discipline or structural reforms. Conversely, when government gross debt reaches the 80.70% threshold, there is a notable risk of a decline in the primary fiscal balance. This indicates that at this debt level, governments might face challenges in maintaining fiscal stability, potentially leading to deterioration in fiscal conditions if not managed properly. Interestingly, once debt levels exceed the 80.70% threshold, the probability of observing improvements in the primary fiscal balance starts to rise. This implies that governments when dealing with high debt levels may adopt more effective fiscal policies or reforms, which could lead to a better primary fiscal balance over time.
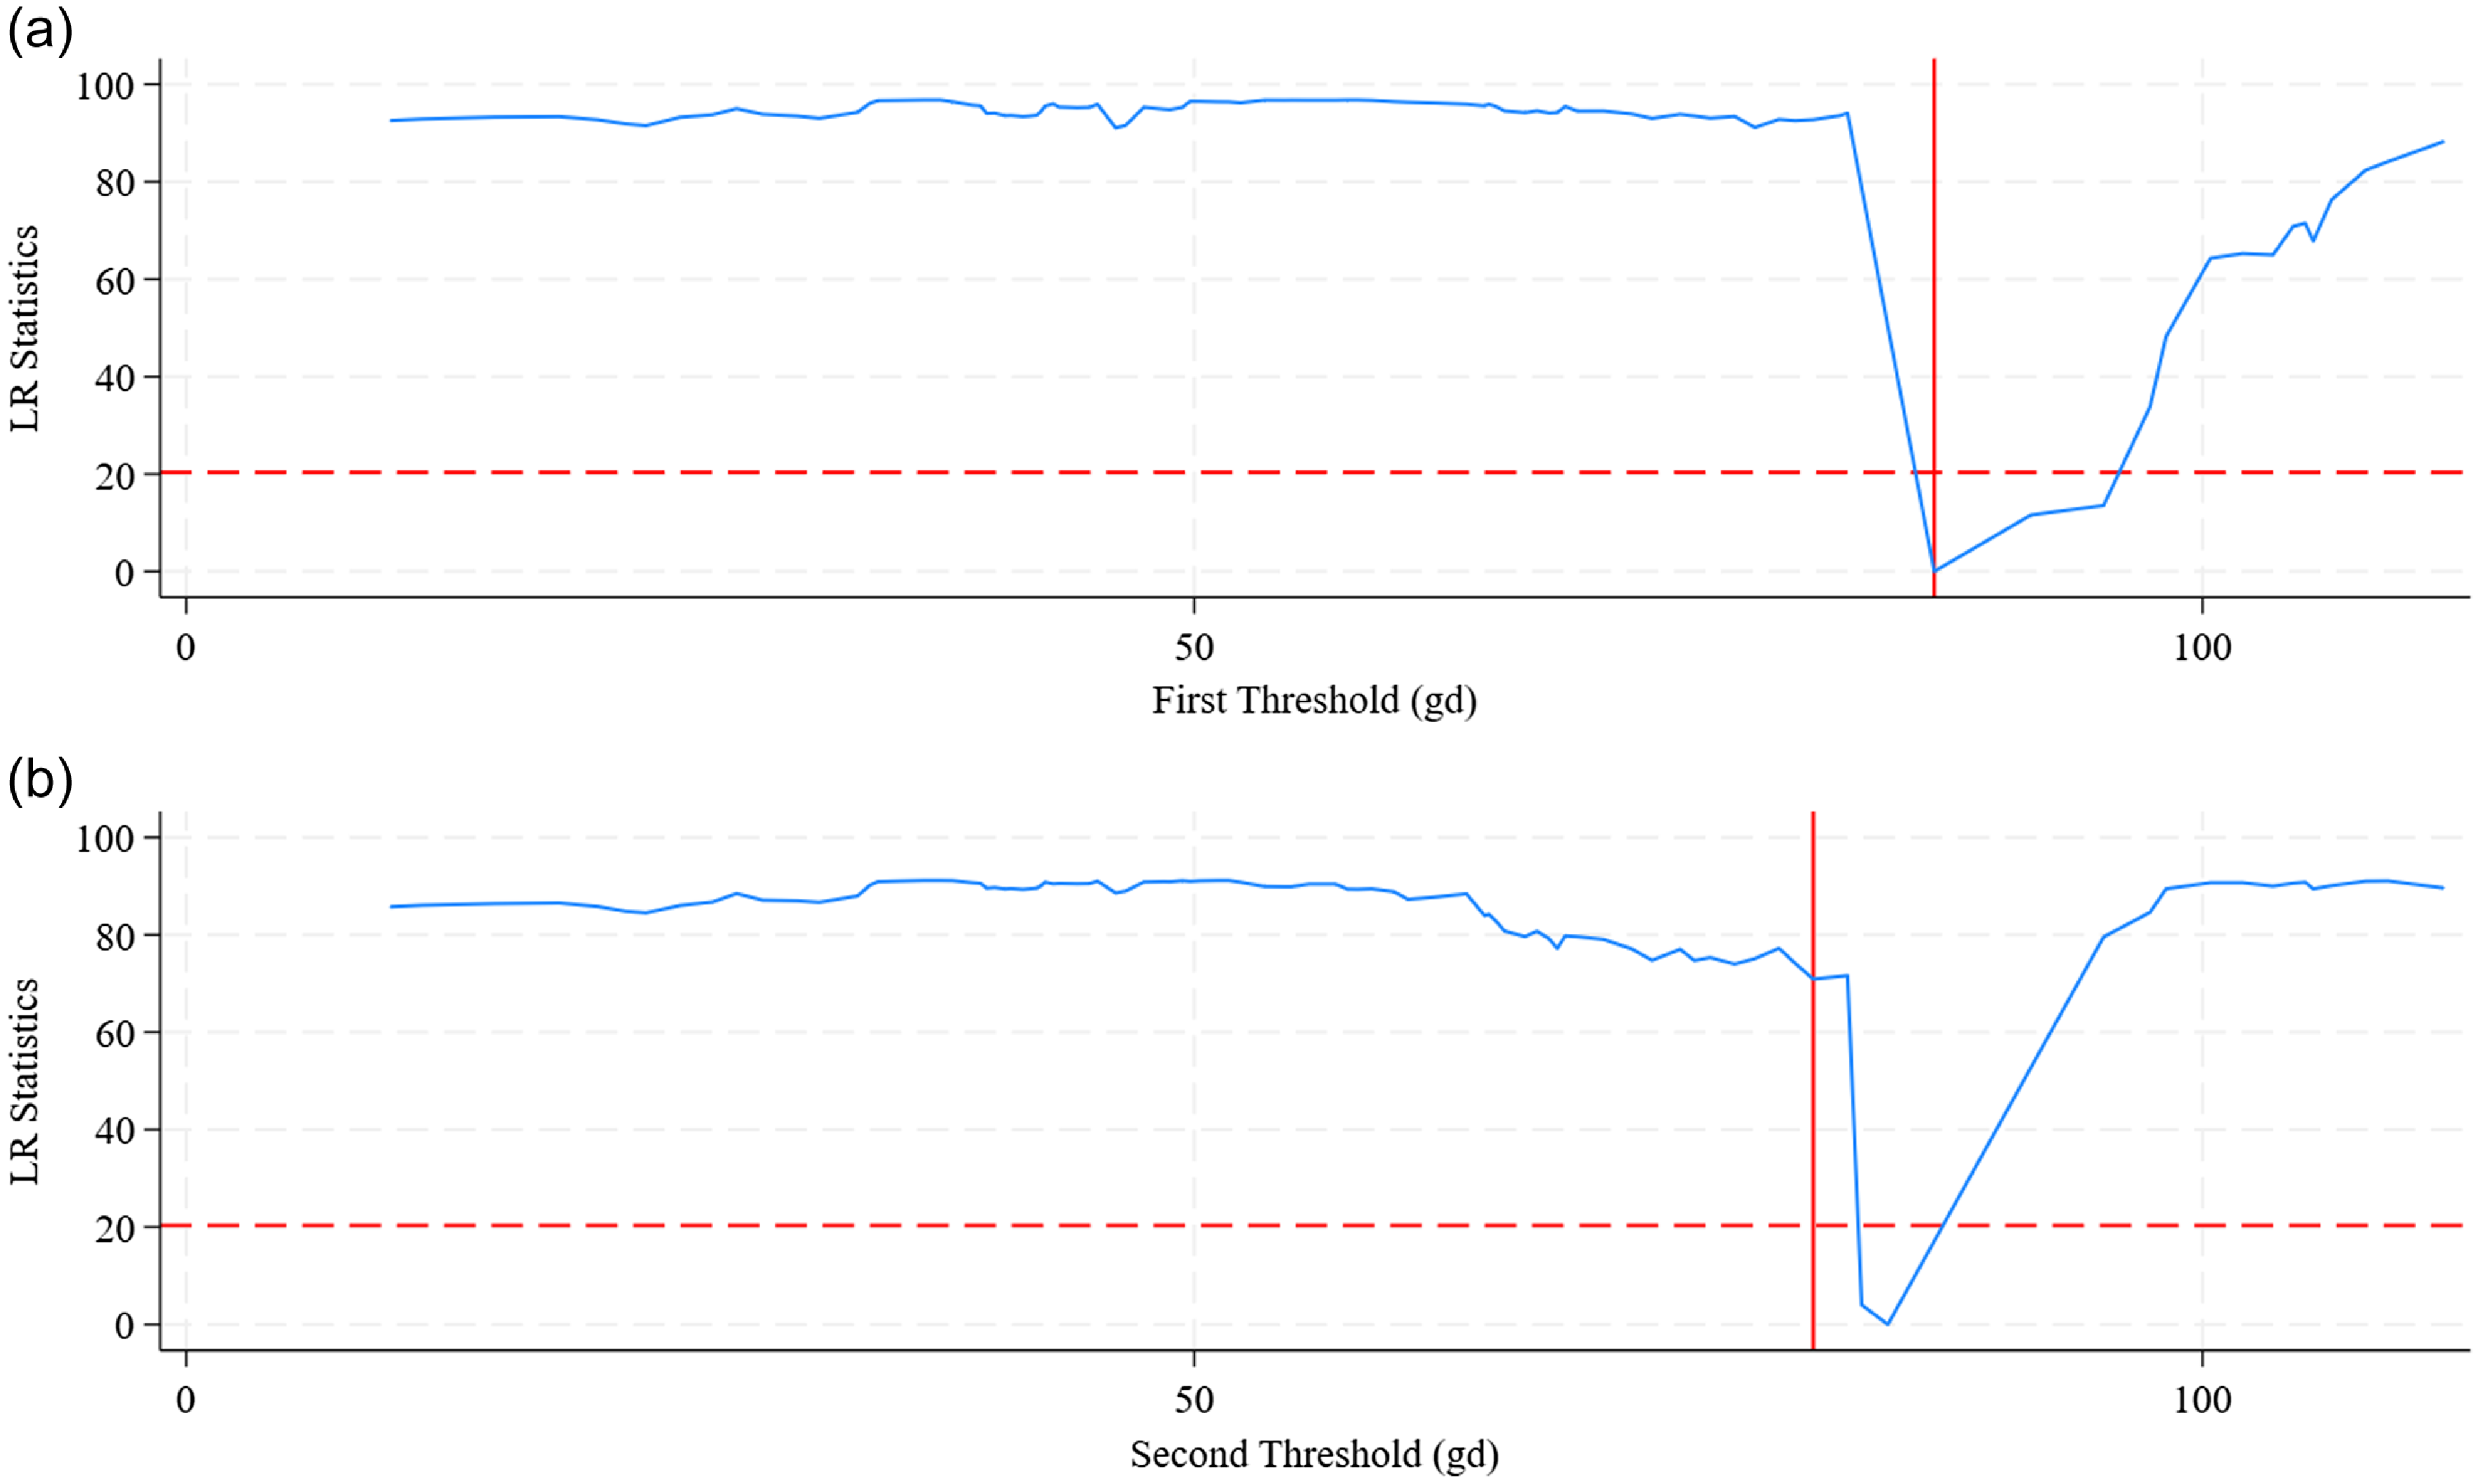
Figure 4. Threshold of gross national debt on primary fiscal balance. Note the $gd$
general government gross debt.
$gd$
general government gross debt.
OECD countries should cross the 86.70% debt threshold to signal the need for targeted fiscal adjustments or reforms to improve primary fiscal balance. This might involve increased fiscal discipline, expenditure cuts, or revenue enhancements to manage high debt levels effectively. Approaching the 80.70% debt threshold indicates growing fiscal risks. Governments must be proactive in addressing potential declines in the primary fiscal balance by implementing measures to stabilize fiscal conditions and avoid adverse economic outcomes. The observed pattern suggests that although high debt levels initially challenge fiscal stability, they can also motivate governments to adopt stronger fiscal policies. OECD countries should leverage this insight to design policies that can turn high debt levels into opportunities for improving fiscal health. Understanding these thresholds helps policymakers in their strategic planning and debt management. Countries should monitor their debt levels closely and prepare for potential fiscal adjustments as they approach these critical thresholds to ensure long-term economic stability and growth.
5. Conclusion
This study examines the interplay between government debt, fiscal consolidation, and economic indicators in OECD countries using a fixed-effect threshold model from 2000 to 2022. This study highlights trade-offs between fiscal consolidation and fiscal stability, noting that a 1% rise in the cyclically adjusted primary balance reduces the primary fiscal balance by 1.366%. The results reveal that government debt has a dual role in shaping economic performance. On the one hand, increases in government gross debt stimulate GDP per capita growth, supporting the notion that borrowing fuels economic activity. On the other hand, the analysis identifies specific debt thresholds beyond which the benefits of debt accumulation may diminish or even reverse. For instance, surpassing the debt threshold of 31.40% is associated with a risk of reduced GDP per capita growth, while crossing the 86.70% threshold has significant implications for the primary fiscal balance. These findings underscore the importance of considering debt levels within a nuanced framework that accounts for the potential non-linear effects of borrowing on economic performance. The presence of such thresholds suggests that debt can serve as a tool for GDP per capita but must be managed with caution to avoid triggering adverse economic consequences.
5.1. Recommendations
Given the identified debt thresholds, policymakers must maintain government gross debt levels below 31.40% of GDP to avoid potential declines in GDP per capita. Similarly, keeping debt below the 86.70% threshold helps to stabilize the primary fiscal balance. These recommendations are grounded in the empirical evidence from this study, which shows that exceeding these thresholds can lead to negative economic outcomes. The recommendation for prudent debt management is based on the study’s findings that certain debt levels are associated with significant economic risks. Maintaining debt within safe limits can help ensure sustainable GDP per capita and fiscal stability. Fiscal consolidation measures should be carefully designed to avoid intensifying the negative effects of high debt levels. Instead of across-the-board spending cuts, policymakers should focus on structural reforms that enhance the efficiency of public spending. This could include reforms in areas like healthcare, education, and infrastructure, where efficient allocation of resources could yield better economic outcomes. The study results indicate that fiscal consolidation can have harmful effects on GDP per capita and the primary fiscal balance if not implemented judiciously. By focusing on efficiency and targeted reforms, governments can mitigate these adverse effects. Regular monitoring of debt levels relative to GDP and primary fiscal balances should be implemented. Governments should develop early warning systems to detect when debt levels approach critical thresholds, allowing timely interventions to prevent economic downturns. The identification of critical debt thresholds suggests that proactive monitoring and timely intervention are essential for maintaining economic stability. By implementing such systems, policymakers can avoid crossing thresholds that could lead to negative economic outcomes.
5.2. Theoretical implications
The findings of this study contribute to a broader theoretical debate on the optimal level of government debt by challenging the traditional linear perspective on debt growth. The discovery of significant debt thresholds supports theories suggesting a non-linear relationship between government debt and economic outcomes. This study provides empirical evidence that the impact of government debt is not uniformly positive or negative but depends on the debt level relative to GDP. This nuanced understanding aligns with the concept of a “debt Laffer curve,” where there is an optimal level of debt maximizes economic growth, beyond which additional debt can be harmful. The findings also have implications for fiscal policy debate, suggesting that fiscal policies’ effectiveness may vary depending on the existing level of debt and the proximity to critical thresholds.
5.3. Limitations of the study
This study is focused exclusively on OECD countries, which limits the generalizability of the findings to other regions or countries with different economic structures. Although OECD countries share certain economic characteristics, the results may not apply to developing or emerging economies, where the relationship between debt and growth might differ. Although the fixed-effect threshold model is well-suited for capturing non-linear relationships, it may not fully account for other dynamic factors, such as external shocks, policy changes, and global economic conditions, that could influence the relationship between government debt and economic outcomes. Future studies may need to incorporate more complex models to capture these dynamics. This study’s analysis is based on a specific time frame, which may not capture the long-term effects of debt accumulation and fiscal consolidation. Case in point, the short-term benefits of increased debt may be offset by long-term risks, such as reduced investment in productive capacity or increased vulnerability to economic shocks. Additionally, this study may not fully account for the impact of economic crises or recovery periods on the relationship between debt and growth.
5.4. Suggestions for future research
Future research should consider expanding the analysis to include non-OECD countries and regions with varying levels of economic development. This would help assess the robustness of the identified thresholds and determine whether the relationship between government debt and economic outcomes is consistent across different economic contexts. Incorporating dynamic modeling approaches, such as vector autoregression and dynamic stochastic general equilibrium, can provide deeper insights into the temporal effects of debt and fiscal consolidation. Additionally, time-varying analyses could help identify how debt and economic outcomes evolve over economic cycles. Further investigation into the sectoral impacts of government debt and fiscal consolidation is needed. The could be analyzing how debt and consolidation affect specific sectors like healthcare, education, and infrastructure could provide more targeted policy recommendations. Additionally, research on the efficiency of public spending and how it interacts with debt levels could help identify ways to optimize fiscal policies. Exploring the long-term consequences of exceeding debt thresholds, including impacts on future growth, intergenerational equity, and economic resilience, could provide a more comprehensive understanding of debt sustainability. Future research could examine the trade-off between short-term economic gains and long-term risks associated with high debt levels.
Funding statement
No funds were provided.
Competing interests
There are no conflicts of interest to declare. The content of the study and the author.
Author contribution
I am a single author who conceived, designed, analyzed, and interpreted the data. I drafted the study and revised it critically for intellectual content.
Data availability
The data used in the study can be obtained upon request.
Appendix A.
Table A.1. Descriptive statistics
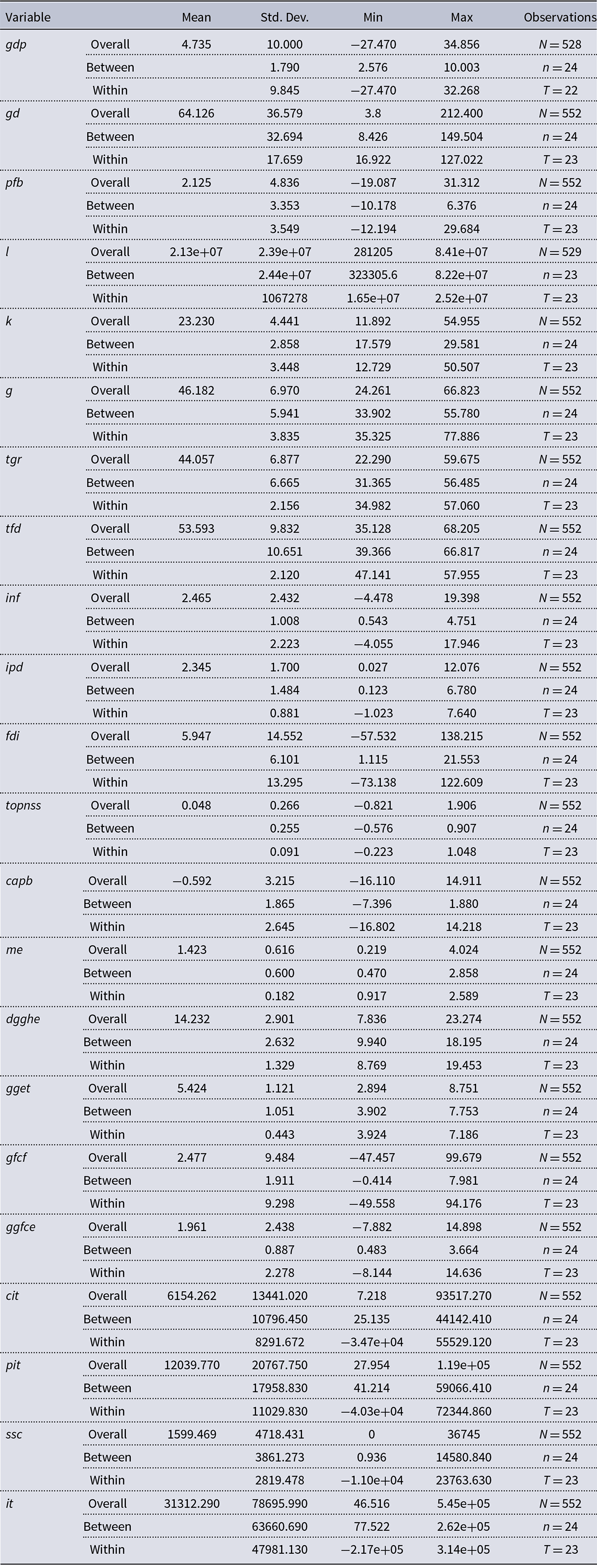
Table A.2. Matrix of correlations
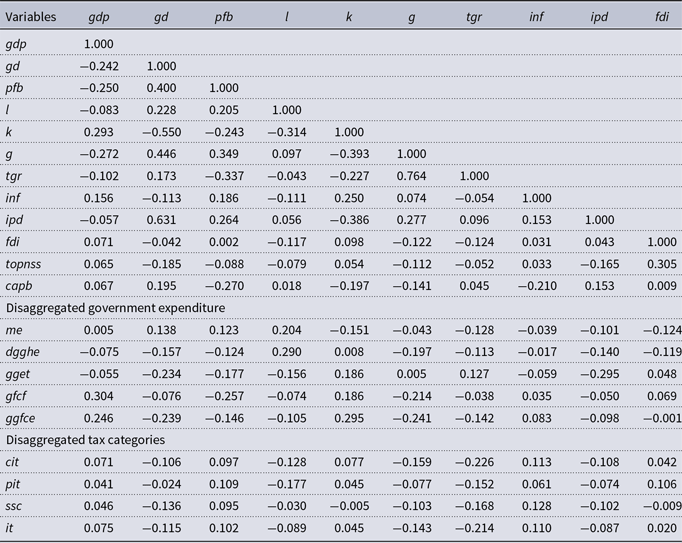
Table A.2. Continued.
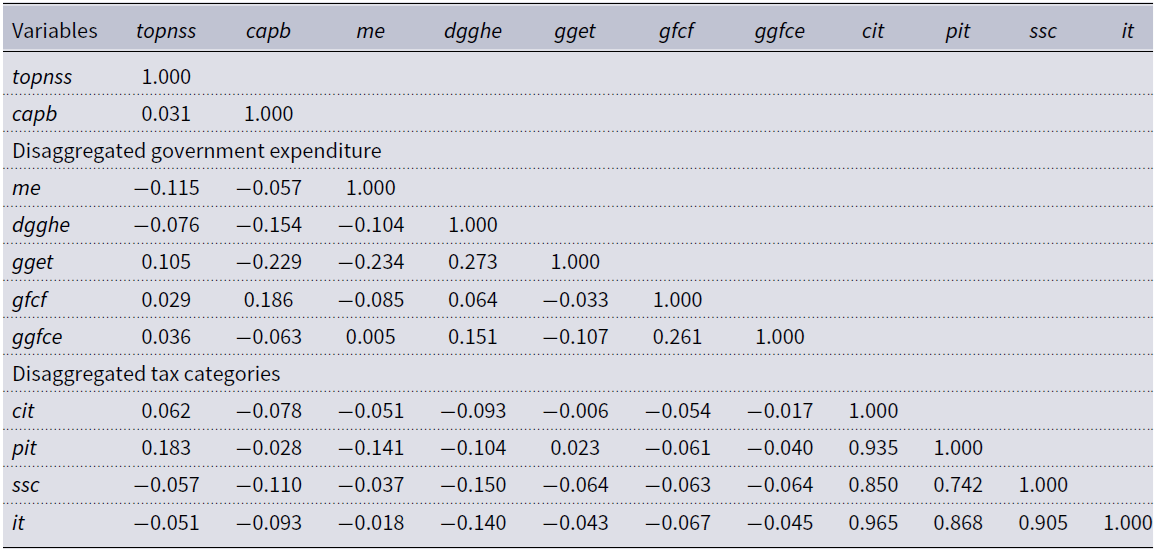
Table A.3. Im–Persaran–Shin and Levin–Lin–Chu unit root tests
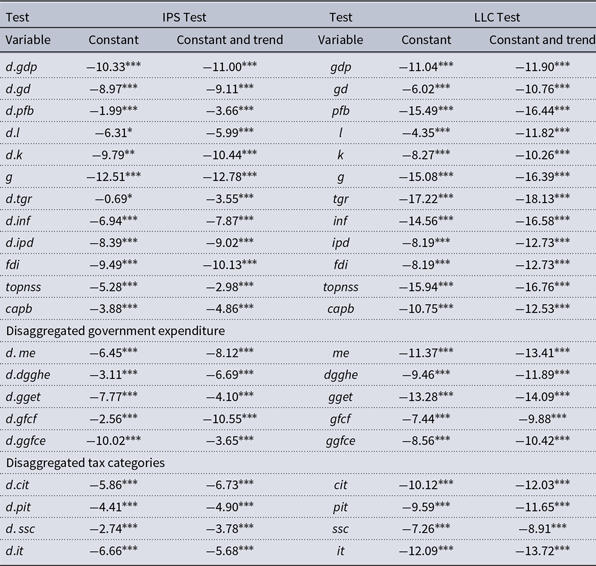
Note that ***, **, * denote the rejection of the null of a unit root of 99%, 95%, and 90%, respectively. The subscript $d$
reflects the different order
$d$
reflects the different order $\left( 1 \right).$
Critical values: without trend, −1.940 (1%), −1.820 (5%), −1.750 (10%), with trend, 2.580 (1%), −2.450 (5%), −2.390 (10%).
$\left( 1 \right).$
Critical values: without trend, −1.940 (1%), −1.820 (5%), −1.750 (10%), with trend, 2.580 (1%), −2.450 (5%), −2.390 (10%).
Table A.4. Hausman test
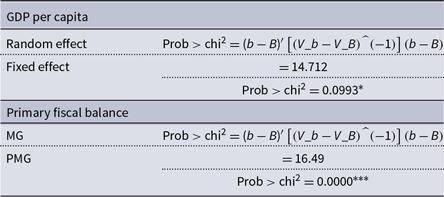


 Open access