Introduction
Over the past 15–20 years, genomic research has been rapidly developing due to the development of high-throughput DNA sequencing methods, called next generation sequencing technologies. This made it possible to sequence giant genomes, including conifer genomes, which are 4–9 times larger [~11–35 Gbp (Leitch et al., Reference Leitch, Johnston, Pellicer, Hidalgo and Bennett2019)] than the human genome [~3.06 Gbp (Nurk et al., Reference Nurk, Koren, Rhie, Rautiainen, Bzikadze, Mikheenko, Vollger, Altemose, Uralsky, Gershman, Aganezov, Hoyt, Diekhans, Logsdon, Alonge, Antonarakis, Borchers, Bouffard, Brooks, Caldas, Chen, Cheng, Chin, Chow, de Lima, Dishuck, Durbin, Dvorkina, Fiddes, Formenti, Fulton, Fungtammasan, Garrison, Grady, Graves-Lindsay, Hall, Hansen, Hartley, Haukness, Howe, Hunkapiller, Jain, Jain, Jarvis, Kerpedjiev, Kirsche, Kolmogorov, Korlach, Kremitzki, Li, Maduro, Marschall, McCartney, McDaniel, Miller, Mullikin, Myers, Olson, Paten, Peluso, Pevzner, Porubsky, Potapova, Rogaev, Rosenfeld, Salzberg, Schneider, Sedlazeck, Shafin, Shew, Shumate, Sims, Smit, Soto, Sovic ́, Storer, Streets, Sullivan, Thibaud-Nissen, Torrance, Wagner, Walenz, Wenger, Wood, Xiao, Yan, Young, Zarate, Surti, McCoy, Dennis, Alexandrov, Gerton, O’Neill, Timp, Zook, Schatz, Eichler, Miga and Phillipp2022)]. Thus, to date, more than 10 genomes of the conifer family Pinaceae have been fully sequenced, annotated and assembled (see for review Kuzmin et al., Reference Kuzmin, Feranchuk, Sharov, Cybin, Makolov, Putintseva, Oreshkova and Krutovsky2019; Bondar et al., Reference Bondar, Feranchuk, Miroshnikova, Sharov, Kuzmin, Oreshkova and Krutovsky2022), including Abies alba (Mosca et al., Reference Mosca, Cruz, Gómez Garrido, Bianco, Rellstab, Brodbeck, Csilléry, Fady, Fladung, Fussi, Gömöry, González-Martínez, Grivet, Gut, Hansen, Heer, Kaya, Krutovsky, Kersten, Liepelt, Opgenoorth, Sperisen, Ullrich, Vendramin, Westergren, Ziegenhagen, Alioto, Gugerli, Heinze, Höhn, Troggio and Neale2019) and partially Abies sibirica (Nystedt et al., Reference Nystedt, Street, Wetterbom, Zuccolo, Lin, Scofield, Vezzi, Delhomme, Giacomello and Alexeyenko2013).
Thanks to whole genome or partial genome sequencing of conifers, it became possible to develop easily genotyped species-specific microsatellite markers for various conifer species, for example, for such main species of the Eurasian boreal forests as Pinus sibirica Du Tour (Belokon et al., Reference Belokon, Politov, Mudrik, Polyakova, Shatokhina, Belokon, Oreshkova, Putintseva, Sharov, Kuzmin and Krutovsky2016) and Larix sibirica Ledeb. (Oreshkova et al., Reference Oreshkova, Putintseva, Sharov, Kuzmin and Krutovsky2017, Reference Oreshkova, Bondar, Putintseva, Sharov, Kuzmin and Krutovsky2019). These markers facilitate population genetic studies, identification of the timber and plant material origin in the fight against illegal logging and control over the legal origin of plant material, effective reforestation, identification of clone material, etc. (Krutovsky et al., Reference Krutovsky, Putintseva, Oreshkova, Bondar, Sharov and Kuzmin2019).
The main object of the study presented here was the Siberian fir (A. sibirica Ledeb.), one of the most important forest-forming species of the dark coniferous taiga with a large distribution zone, including the northeast of the European part of Russia, the Urals and most of Siberia. In general, representatives of the genus Abies (Mill) are of great interest to foresters, dendrologists, gardeners and landscapers. This genus is considered one of the largest in the Pinaceae family, including from 40 to 65 species according to various modern estimates (Semerikova et al., Reference Semerikova, Khrunyk, Lacoux and Semerikov2018).
However, despite its significance the genetic diversity of Siberian fir has been insufficiently studied. Most of earlier such studies were carried out using allozyme markers, which are less informative than simple sequence repeat (SSR) markers, and did not cover the entire range of the species (Goncharenko and Padutov, Reference Goncharenko and Padutov1995; Larionova and Ekart, Reference Larionova and Ekart2005; Semerikova and Semerikov, Reference Semerikova and Semerikov2006; Larionova et al., Reference Larionova, Ekart and Kravchenko2007). Several studies were carried out also in Siberian fir on the dynamics of populations, population size and phylogeography using cytoplasmic DNA and amplified fragment length polymorphism (AFLP) markers (Semerikova and Semerikov, Reference Semerikova and Semerikov2014, Reference Semerikova and Semerikov2016; Semerikov et al., Reference Semerikov, Semerikova, Khrunyk and Putintseva2022). However, despite these studies, there is practically no information on the genetic diversity, structure and differentiation of Siberian fir populations in the Krasnoyarsk Territory and the Republic of Khakassia, as well as in many other large areas of its natural distribution. The genetic structure, subdivision and differentiation of populations of this species have not been studied under ecologically heterogeneous environmental conditions. This does not allow assessing the general state of the genetic resources of the species, their spatial distribution, which makes it difficult to develop programmes for the protection, rational use and reproduction of the genetic resources of the species.
Meanwhile, abundant distribution in the genome, high reproducibility, codominance and relatively easy identification have made microsatellite markers popular in modern studies of conifer population genetics. Several microsatellite markers with mostly dinucleotide motifs were previously developed for some fir species (Hansen et al., Reference Hansen, Vendramin, Sebastiani and Edwards2005; Cremer et al., Reference Cremer, Liepelt, Sebastiani, Buonamici, Michalczyk, Ziegenhagen and Vendramin2006; Cvrčková et al., Reference Cvrčková, Máchová and Malá2015). However, they are suitable for genotyping only using capillary gel-electrophoresis, while microsatellite markers with longer motifs can be easily genotyped in any laboratories with simple slab gel electrophoresis. Therefore, our main objective was to generate universal SSR markers suitable for reliable genotyping in any laboratories with any gel electrophoresis equipment, such as for either simple vertical electrophoresis in polyacrylamide slab gel or much more challenging capillary gel electrophoresis requiring more expensive instruments.
Fir is a good bioindicator of environmental conditions in the areas of their growth (Świercz et al., Reference Świercz, Świątek and Pietrzykowski2022). Therefore, in addition to the main goal of this study to develop new highly informative microsatellite markers that can be easily genotyped in A. sibirica based on the data of whole genome sequencing of this species, we also searched for homologous microsatellite loci in the genome of a closely related species, European silver fir (A. alba Mill.), tested them in population samples and developed a multiplex genotyping panel of 14 microsatellite loci, which were successfully tested and genotyped in the samples from eight A. sibirica populations, four A. alba populations and a small sample of eight trees representing Abies nordmanniana.
Both A. sibirica and A. alba are important species of the boreal and temperate forests in Eurasia. These trees are up to 30 m tall and up to 0.5 m in diameter, living up to 200–250 years in natural conditions. Fir is very shade-tolerant, has low frost resistance and often suffers from late spring frosts. It grows best on well-drained soddy-podzolic loam soils with close underneath limestone occurrence. It avoids strongly podzolized and stagnant-moistened soils and does not grow on poor sandy soils. It can form both pure and mixed (fir-spruce) stands. In the mountains it rises to 2000 m above sea level, where it is present in a bushy form (Mauri et al., Reference Mauri, de Rigo, Caudullo, San-Miguel-Ayanz, De Rigo, Caudullo, Houston Durrant and Mauri2016; Dobrowolska et al., Reference Dobrowolska, Bončina and Klumpp2017; Zaitsev et al., Reference Zaitsev, Kulagin and Davydychev2018).
Materials and methods
Search for microsatellite loci and design of PCR primers
Nucleotide reads obtained as a result of whole genome sequencing of A. sibirica Ledeb. with low coverage were used to search for microsatellite loci and design their polymerase chain reaction (PCR) primers. The reads of A. sibirica were generated additionally in a project dedicated mainly to the sequencing and assembly of the genome of Norway spruce, Picea abies (L.) Karst. (Nystedt et al., Reference Nystedt, Street, Wetterbom, Zuccolo, Lin, Scofield, Vezzi, Delhomme, Giacomello and Alexeyenko2013; https://www.ncbi.nlm.nih.gov/bioproject/PRJEB1894; the NCBI GenBank SRA accession number ERP002568). We assembled reads into contigs using CLC Assembly Cell v.4.4 (QIAGEN, Aarhus, Denmark). The obtained contigs were used to search for microsatellite loci using the GMATo v.1.2 software (Wang et al., Reference Wang, Lu and Luo2013). To increase the reliability of genotyping of the prospective microsatellite markers, the search was limited to the search for contigs containing tandem repeats of only three-, four-, five- and six-nucleotide long motifs with thresholds for minimal number of repeats 15, 10, 6 and 7, respectively.
The PCR primers for amplification of the found microsatellite loci within the size range of 140–280 bp were designed using the WebSat online tools (Martins et al., Reference Martins, Lucas, Neves and Bertioli2009). For successful PCR amplification of microsatellite loci, their primers must be locus-specific, that is, the PCR annealing sites matching primer sequence pairs for a given marker should not occur anywhere else in the genome. Therefore, to design unique, single locus-specific primers, their sequences were mapped to the newly generated assembly of the A. sibirica genome using BLAST. Primer pairs that had annealing sites for more than one locus were excluded from further analysis. Single locus-specific PCR primers selected for further testing were synthesized by Evrogen (Moscow, Russia). In addition, Siberian fir contigs containing successful microsatellite markers were used to search for homologous microsatellite loci in the European silver fir (A. alba Mill.) genome (Mosca et al., Reference Mosca, Cruz, Gómez Garrido, Bianco, Rellstab, Brodbeck, Csilléry, Fady, Fladung, Fussi, Gömöry, González-Martínez, Grivet, Gut, Hansen, Heer, Kaya, Krutovsky, Kersten, Liepelt, Opgenoorth, Sperisen, Ullrich, Vendramin, Westergren, Ziegenhagen, Alioto, Gugerli, Heinze, Höhn, Troggio and Neale2019). Then, PCR primers designed for the found homologous loci were tested in four populations of A. alba and a small sample of A. nordmanniana.
Plant material and DNA isolation
Total DNA was isolated from 100–200 mg of dried needles per individual tree sample collected from 240 Siberian fir trees in eight populations (30 trees per each population) in Central Siberia (Fig. 1) using the cetyltrimethylammonium bromide (CTAB) method (Doyle and Doyle, Reference Doyle and Doyle1990).

Figure 1. Area of Abies sibirica and geographic location of the eight populations genotyped in the study using microsatellite markers. Krasnoyarsk Region: Boguchanskaya (BB, 58°21' N, 97°30' E, 419), Ordzhonikidzevskaya (MO, 58°19' N, 94°56' E, 293), Kytatskaya (TK, 56°57' N, 91°33' E, 232), Maganskaya (MB, 55°40' N, 93°00' E, 333), Kesovskaya (IK, 55°18' N, 96°43' E, 423), Artemovskaya (KA, 54°23' N, 93°33' E, 542), Shushenskoe (SH, 52°57' N, 91°43' E, 642); Republic of Khakassia: Tabatskaya (BT,52°48' N, 90°46' E, 849).
About 50 mg of fresh needles per each sample were used for DNA isolation from 96 individual tree samples of A. alba representing four populations of anonymous origin (24 samples per each population, respectively) using the DNeasy®96 Plant Mini Kit and following the standard protocol (Qiagen, Hilden, Germany). The same kit was used to isolate DNA from germinated seeds of A. nordmanniana. The samples of A. alba were provided by Isogen GmbH (Göttingen, Germany; https://isogen.de) and the seed samples of A. nordmanniana by PlusBaum Samen GmbH (Nagold, Germany; https://plusbaum-samen.de).
PCR amplification and genotyping of microsatellite loci
GenePak PCR Core kits (IsoGene Laboratory Ltd, Moscow, Russia) containing hot-start Taq-DNA polymerase, deoxynucleoside triphosphates (dNTPs) and magnesium chloride were used for PCR amplification of selected nuclear microsatellite loci in the Axygen MaxyGene II Gradient Thermal Cycler (Axygen Scientific Inс., Union City, California, USA). A touchdown PCR program was used to reduce non-specific amplification, which included first DNA denaturation at 94°C for 1 min, then 9 cycles, including 30 s of denaturation at 94°С, annealing of primers for 30 s at 60°С, with a decrease by 1°С each cycle (up to 50°С), and 1 min of elongation at 72°С. The next 24 cycles included DNA denaturation at 94°С for 30 s, primer annealing at 50°С for 30 s and elongation at 72°C for 30 s. This was followed by an extension step at 72°C for 10 min, and the last stage was cooling at 4°C. Loci that showed stable interpretable PCR amplification spectra were selected for further use.
Amplification products were separated by 6% polyacrylamide gel electrophoresis using Tris-EDTA-borate electrode buffer in vertical electrophoresis chambers. The gel was stained in a solution of ethidium bromide followed by visualization in ultraviolet light. DNA fragments of the pBR322 E. coli plasmid digested by the HpaII restriction enzyme were used as standard length markers.
PCR primers that had annealing sites also in homologous microsatellite loci of A. alba were also tested and genotyped in samples of 96 trees from four natural populations of A. alba and eight seedlings germinated from seeds of eight different A. nordmanniana trees using fluorescent labelled primers synthesized by Sigma Aldrich Chemie GmbH (Taufkirchen, Germany) and capillary gel electrophoresis with ABI PRISM 3130 (Thermo Fisher Scientific Inc., Waltham, Massachusetts, USA). Visualization and processing of the results of fragment analysis (electropherograms) were carried out using the GeneMapper 4.0 program (Thermo Fisher Scientific Inc., Waltham, Massachusetts, USA).
Population genetics data analysis
Genetic variation parameters, such as average (N a) and effective (N e) number of alleles, observed (H o) and expected (H e) heterozygosity, fixation index (F IS) and different parameters of genetic differentiation (Nei's standardized GST (G'STN), Hedrick's standardized GST (G'STH and G''ST), Jost's estimate of differentiation Dest) and assessment of the Hardy–Weinberg equilibrium (HWE) were calculated using GeneAlex v. 6.503 (Peakall and Smouse, Reference Peakall and Smouse2006, Reference Peakall and Smouse2012). Polymorphic information content (PIC) was calculated according to Botstein et al. (Reference Botstein, White, Skolnick and Davis1980) using the MolMarker program (Jahnke et al., Reference Jahnke, Smidla and Poczai2022). The frequencies of null alleles were inferred and analysed using MICRO-CHECKER v. 2.2.3 (Van Oosterhout et al., Reference Van Oosterhout, Hutchinson, Wills and Shipley2004) with data exported from GeneAlex.
Results
Abies sibirica
A total of 264,864 contigs containing tandem microsatellite repeats with three-, four-, five- and six-nucleotide motifs with a specified minimum number of repeats were found in the partial genome assembly of Siberian fir. We specifically focused on selecting loci with longer than dinucleotide motifs in order to improve scorability and comparability. Initially, 475 microsatellite loci with long enough neighbouring sequences on both ends to design PCR primers were selected, 115 of them were used to design PCR primers, and PCR primer pairs were finally synthesized by Evrogen Co. (Moscow, Russia) and further tested for 64 of them (see online Supplementary Table S1 for details and original contig sequences).
An initial test of the selected primers on four DNA samples from each population of Siberian fir showed that out of 64 primer pairs, 11 lacked an amplified product and 7 did not have the expected size of amplified product. The remaining 46 pairs were further tested on an enlarged sample of trees. According to the results of this test, 22 more loci had to be excluded, because 12 of them turned out to be monomorphic and 10 showed unstable amplification. As a result, 24 loci showed stable amplification under the selected conditions and were further used for genotyping entire population samples of Siberian fir trees (Table 1, online Supplementary Table S1).
Table 1. Characteristics of 24 successfully amplified polymorphic microsatellite loci selected for Abies sibirica based on genome sequencing data
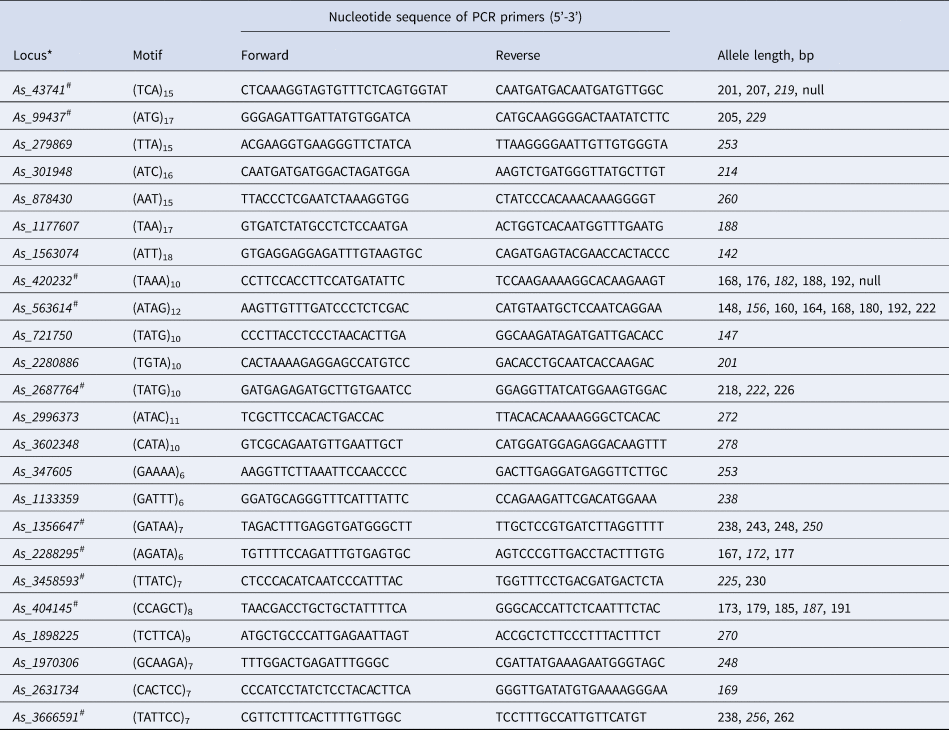
*Number in the name of the loci refers the contig number in the A. sibirica genome assembly. #Ten most reliable polymorphic microsatellite loci finally selected for genotyping eight A. sibirica populations. Allele length in the contig is italicized.
Based on the results of genotyping of 24 selected loci in eight geographically distant populations of A. sibirica, another 14 loci had to be excluded due to poor or nonspecific amplification and a large number of null alleles. Using the MICRO-CHECKER program (Van Oosterhout et al., Reference Van Oosterhout, Hutchinson, Wills and Shipley2004), hidden null alleles were identified for the following three loci: As_43741 in the TK and SH samples, As_563614 in the KA and MB samples and As_420232 in the BB sample. Hidden null allele frequencies were calculated based on the assumption that populations are in HWE (Chakraborty, Reference Chakraborty1992). Some of the loci demonstrated significant deviation from HWE, but it was not systematic across all populations. Neither of the loci demonstrated deviation from HWE for all or the majority of populations (online Supplementary Table S2).
Thus, the 10 most reliable loci were selected (Table 1, online Supplementary Table S1), which were easily and unambiguously genotyped using a simple polyacrylamide gel in vertical electrophoresis chambers (online Supplementary Fig. S1).
Abies alba and Abies nordmanniana
Based on the results of mapping nucleotide sequences of 64 primer pairs selected for A. sibirica to the A. alba genome assembly, 36 A. alba homologous loci were selected and the corresponding primers were tested on four A. alba samples. Of these, 23 were stably amplified and well genotyped; 14 turned out to be polymorphic and 9 monomorphic. The polymorphic 14 markers were further tested on a larger set of eight samples using capillary electrophoresis on an ABI PRISM 3130 sequencer (Thermo Fisher Scientific Inc., Waltham, Massachusetts, USA). To do this, one of the primers in the pair was labelled with either 6-FAM or HEX fluorescent labels. Then, 14 markers were grouped into four PCR multiplexes and genotyped in 96 trees from four A. alba populations and eight seedlings representing eight different A. nordmanniana trees. Multiplex PCR primer groups were organized in such a way as to avoid overlapping ranges of allele sizes of different amplified loci labelled with the same fluorescent dye in the same PCR reaction. A maximum of four primer pairs per group were pooled together using two different fluorescent dyes (Table 2). Among 14 selected microsatellite loci tested on samples of Nordmann fir, one was not amplified at all, nine turned out to be polymorphic and four were monomorphic (Table 2).
Table 2. PCR multiplex panels, number and size range of alleles of the best 14 microsatellite loci used for population genetic genotyping of Abies alba and Abies nordmanniana
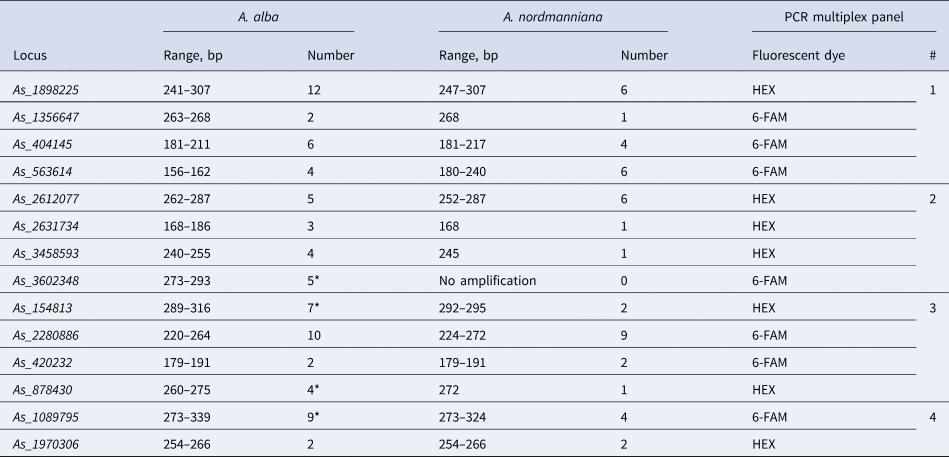
*Loci with null alleles according to MICRO-CHECKER.
Population genetic analysis
Polymorphism data for 10 microsatellite loci in eight populations of A. sibirica are presented in Table 3 (see also online Supplementary Table S2 for details).
Table 3. Genetic variation parameters of the 10 microsatellite markers averaged for eight populations of A. sibirica and mean for all markers
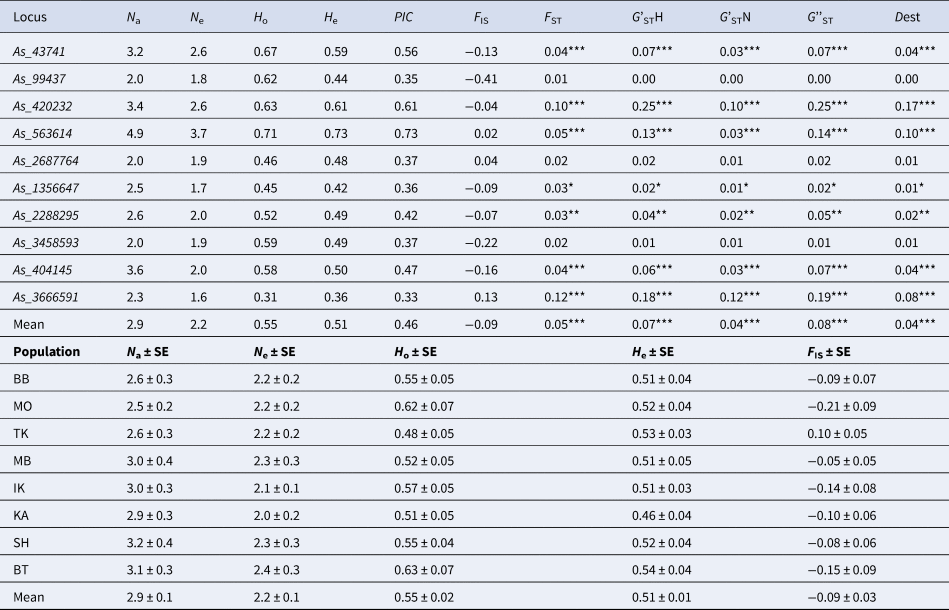
N a, average number of alleles; N e, effective number of alleles; H o, observed heterozygosity; H e, expected heterozygosity; PIC, polymorphic information content; F IS, fixation index; F ST, coefficient of differentiation between populations; G'STN, Nei's standardized G ST; G'STH, Hedrick's standardized G ST; G''ST, Hedrick's standardized G ST further corrected for bias when the number of populations is small; Dest, Jost's estimate of differentiation between populations; * P < 0.05, ** P < 0.01, *** P < 0.001.
The studied microsatellite markers for Siberian fir turned out to be moderately polymorphic with the number of alleles (N a) varying from 2 (As_99437, As_2687764, As_3458593) to 4.9 (As_563614) per locus on average for eight populations (Table 3). The effective number of alleles (N e) varied from 1.6 to 3.7 at the As_3666591 and As_563614 loci, respectively. Observed (H o) and expected (H e) heterozygosity varied from 0.31 to 0.71 and from 0.36 to 0.73 for As_3666591 and As_563614, respectively. The PIC was high and varied from 0.33 to 0.73 for the same pair of markers As_3666591 and As_563614, respectively. The lowest (0.01) and highest (0.12) F ST values were calculated for the As_99437 and As_3666591 loci, respectively. G'STH varied from 0.01 to 0.25 for the As_3458593 and As_420232 loci, respectively. The highest G'STN, G''ST and Dest values were 0.12, 0.25 and 0.17, respectively (Table 3). F IS values ranged from −0.41 to 0.13, but none of them was statistically significant (Table 3). However, it should be noted that the analysis for hidden null alleles using MICRO-CHECKER revealed null alleles at three loci (As_43741, As_420232, As_563614) in five populations, which were taken into account while calculating the parameters of genetic variation.
Some of the loci demonstrated significant deviation from HWE, but it was not systematic across all populations. Neither of the loci demonstrated deviation from HWE for all or the majority of populations (online Supplementary Table S3).
The results of population clustering are presented in Fig. 2. According to the results of the Mantel test, no significant correlation was found between genetic and geographic distances.
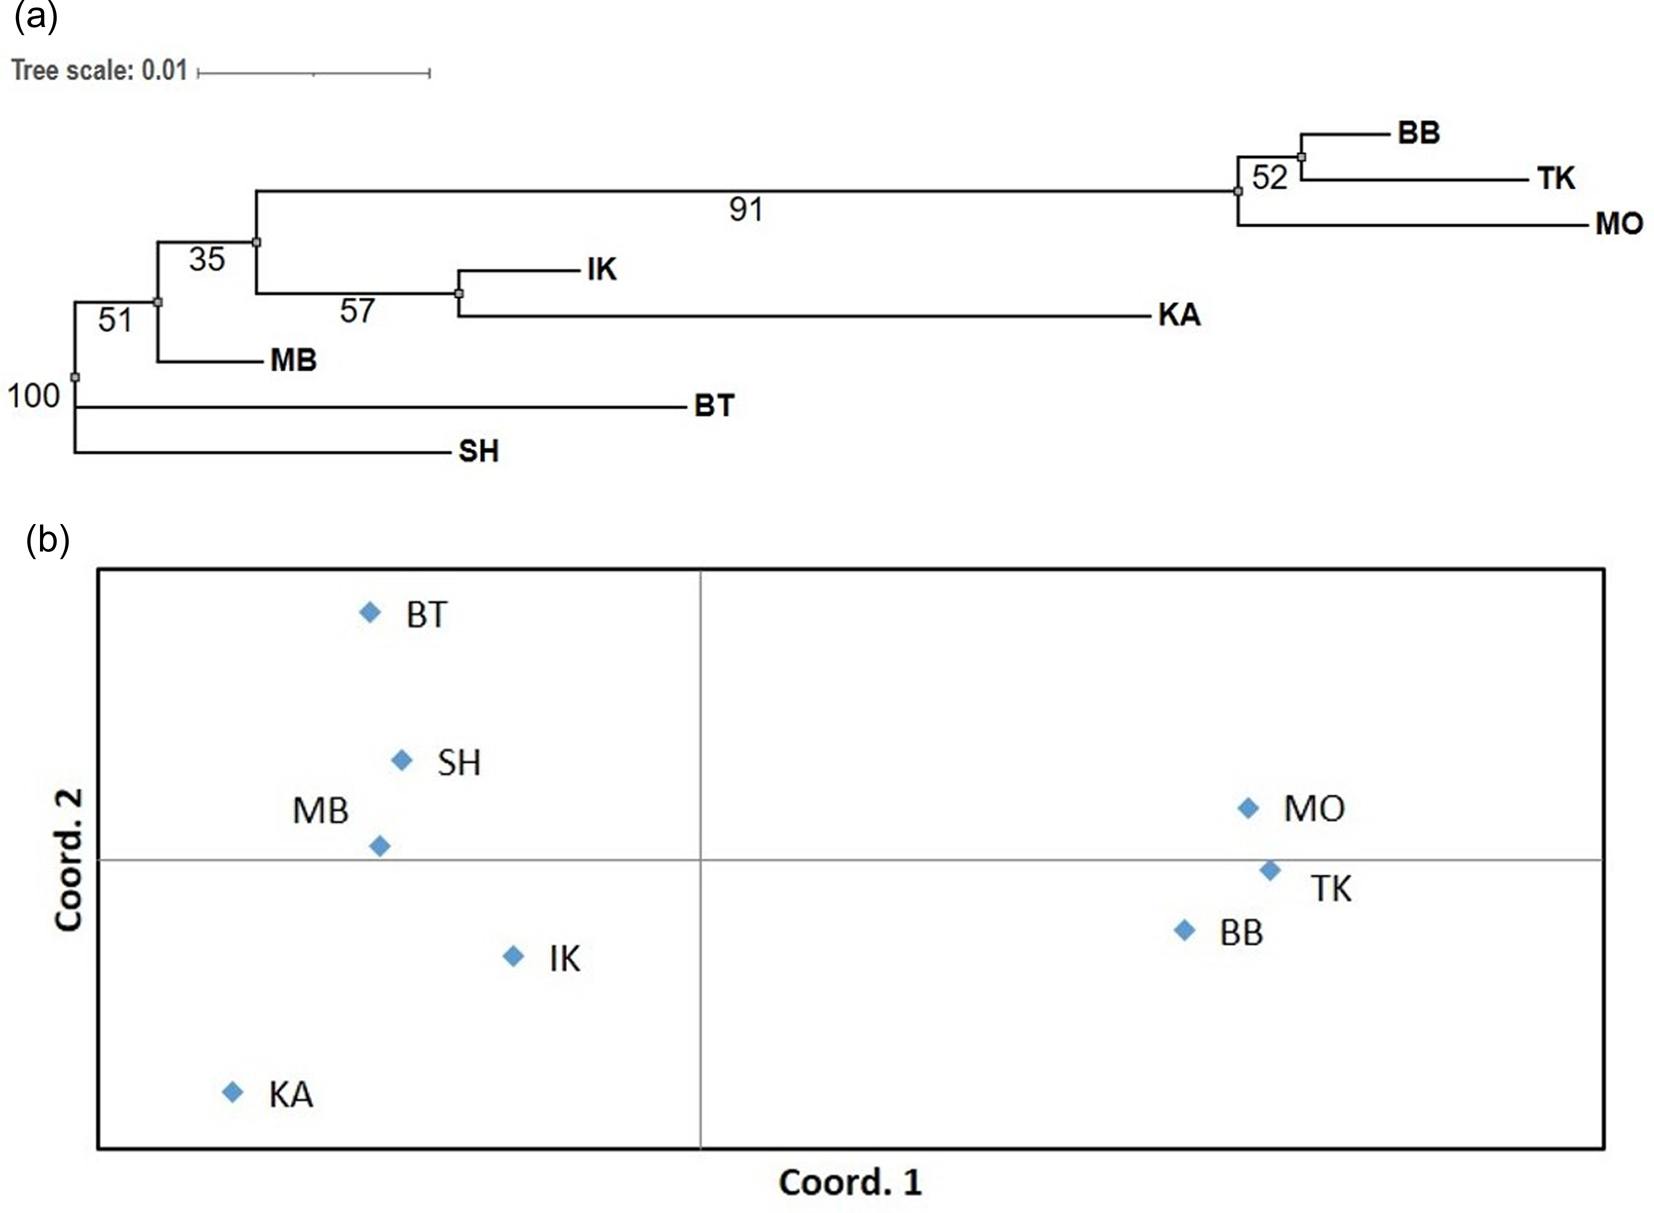
Figure 2. Neighbour-joining tree with bootstrap values at the nodes (A) and principal coordinates analysis (PCoA) (B) of eight populations of A. sibirica based on the standard Nei's genetic distances (D N). See Fig. 1 for the full names of the populations and their geographic location.
Polymorphism data for 14 microsatellite loci in four populations of A. alba and 13 microsatellite loci in a sample of eight trees of A. nordmanniana are presented in Table 4 (see also online Supplementary Tables S3 and S4 for details).
Table 4. Genetic variation and differentiation parameters of the 14 microsatellite markers averaged for four populations of A. alba (A, B, C and D) and one population of A. nordmanniana and mean for all markers
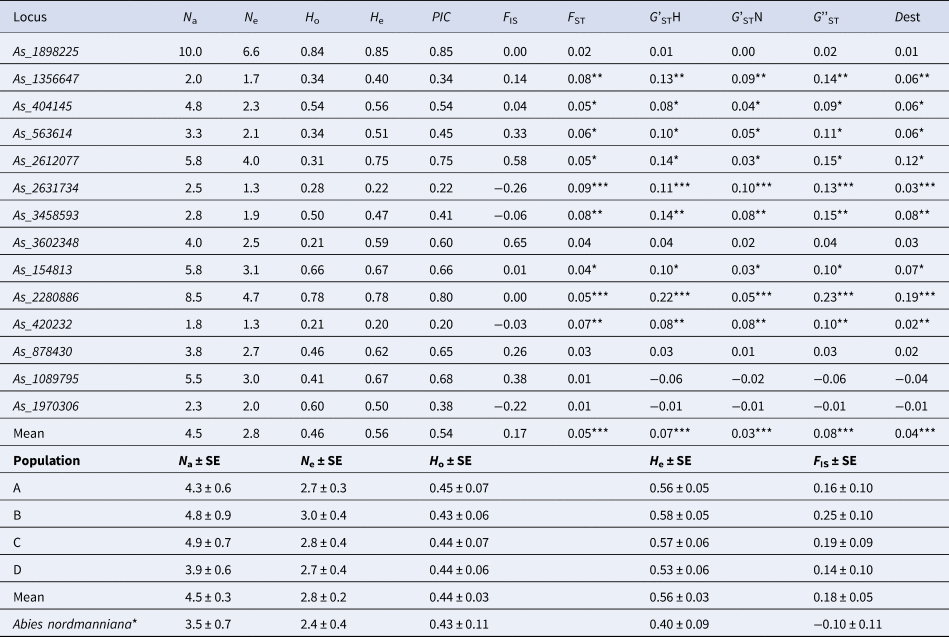
*Based on 13 loci (As_3602348 with no amplification was excluded).
Most of the microsatellite markers were highly polymorphic with number of alleles (N a) ranging from 1.8 (As_420232) to 10 (As_1898225) alleles per locus in four populations of A. alba on average (Table 4). The loci As_1998225 and As_2280886 showed the highest genetic variation in all populations (online Supplementary Table S3). The effective number of alleles (N e) varied from 1.3 to 6.6 in the As_420232 and As_1898225 loci, respectively. The observed (H o) and expected (H e) heterozygosities varied from 0.21 to 0.84 and from 0.20 to 0.85 for loci As_420232 and As_1898225. The PIC was high and varied from 0.20 to 0.85 for the same pair of markers As_420232 and As_1898225, respectively. The highest (0.09) and lowest (0.01) F ST values were calculated for As_2631734 and As_1970306, respectively. The G'STH varied from −0.01 to 0.22 for the As_1970306 and As_2280886 loci, respectively. The highest G'STN, G''ST and Dest were 0.10, 0.23 and 0.19, respectively (Table 4). In total, differentiation was not high ranging from 0.03 to 0.08 depending on the parameter, but significant for each parameter (Table 4).
The F IS values varied from −0.37 to 0.69, and significant deficiency of heterozygotes was observed for four loci in single populations, for As_563614 and As_1089795 in more than two populations (online Supplementary Table S5). It is likely caused mainly by a high frequency of hidden null alleles in these a few loci found by MICRO-CHECKER (online Supplementary Table S6).
Discussion
Abies sibirica
In general, the values of the main parameters of genetic polymorphism (N a = 2.9, N e = 2.2, H o = 0.55, H e = 0.51) of A. sibirica indicate a relatively lower level of diversity compared to studies of A. alba based on other microsatellite markers (Cremer et al., Reference Cremer, Liepelt, Sebastiani, Buonamici, Michalczyk, Ziegenhagen and Vendramin2006; Cvrčková et al., Reference Cvrčková, Máchová and Malá2015), but similar to the parameters for A. alba obtained in our study and based on a subset of markers used for A. sibirica (Table 4). The highest values of almost all parameters were found in the southern populations SH and BT, which are closely located to each other (Fig. 1).
Some of the loci demonstrated significant deviation from HWE, but it is likely due to relatively high self-pollination which is typical for Abies species that have a relatively high self-pollination rate among conifers [mean 11% for four populations of A. balsamea (Neale and Adams, Reference Neale and Adams1985), 11% for A. lasiocarpa (Shea, Reference Shea1987), 11% (Schroeder, Reference Schroeder1989) or 24% (Kormuťák and Lindgren, Reference Kormuťák and Lindgren1996) for A. alba, mean 13% for seven populations of A. amabilis (Davidson, Reference Davidson1990), 6% for A. borisii (Fady and Westfall, Reference Fady and Westfall1997), and 10–13% for A. sibirica (authors’ data, unpublished)], which is comparable to other conifers [2–17% (Adams and Birkes, Reference Adams, Birkes, Fineschi, Malvolti, Cannata and Hattemer1991) or mean ~15% (Table l in Muona, Reference Muona, Brown, Clegg, Kahler and Weir1990; Mitton, Reference Mitton1992)].
Based on clustering presented in Fig. 2 phylogenetic relationships between populations of A. sibirica reflect their geographic location in general (Fig. 1). Cluster analysis clearly separated the populations BB, TK and MO located in the northern regions with a high degree of confidence (bootstrap value of 99%) from the distant populations located to the south, among which the southern cluster of populations MB, BT and SH is also distinguished, but with less support (bootstrap value of only 60%).
However, according to the results of the Mantel test, no significant correlation was found between genetic and geographic distances, which may indicate that, in addition to geographic isolation, the genetic differentiation in the studied area of this species could be affected by the ecological heterogeneity of the habitat at different altitudes above sea level related to soil fertility, water availability and mineral nutrition. The obtained results are consistent with similar data obtained for A. sibirica using other genetic markers (Larionova et al., Reference Larionova, Ekart and Kravchenko2007; Semerikova and Semerikov, Reference Semerikova and Semerikov2016).
Abies alba and Abies nordmanniana
In general, the variation of 14 markers developed in this study for A. alba was similar to the variation of 11 microsatellite markers developed for this species by Cremer et al. (Reference Cremer, Liepelt, Sebastiani, Buonamici, Michalczyk, Ziegenhagen and Vendramin2006): N a = 5.2 vs 4.5 in our study (Table 4), H o = 0.31 vs 0.46, H e = 0.53 vs 0.56, and similar to N a = 9.2, H o = 0.43, and H e = 0.49 obtained in Postolache et al. (Reference Postolache, Leonarduzzi, Piotti, Spanu, Roig, Fady, Roschanski, Liepelt and Vendramin2014) based on 24 markers including 16 EST-SSRs (calculated from Table 1 in Postolache et al., Reference Postolache, Leonarduzzi, Piotti, Spanu, Roig, Fady, Roschanski, Liepelt and Vendramin2014), but slightly less than H e = 0.75 based on 11 microsatellite markers used by Hrivnák et al. (Reference Hrivnák, Paule, Krajmerová, Kulaç, Şevik, Turna, Tvauri and Gömöry2017), including four markers developed by Cremer et al. (Reference Cremer, Liepelt, Sebastiani, Buonamici, Michalczyk, Ziegenhagen and Vendramin2006), and values obtained for many other populations of A. alba (H o and H e = 0.5–0.8, see Dalmaris et al., Reference Dalmaris, Tourvas and Aravanopoulos2022 for references). The lower variation observed in our study can be explained by intentionally not using microsatellite loci with dinucleotide repeats that are mostly used in other studies but notoriously known for typical difficulty regarding consistent and reliable genotyping.
Although very preliminary, variation observed in a small sample of A. nordmanniana was less than variation observed in much larger sample in Hansen et al. (Reference Hansen, Vendramin, Sebastiani and Edwards2005) which was based only on five highly polymorphic markers: N a = 30.4 (calculated from Table 1 in Hansen et al., Reference Hansen, Vendramin, Sebastiani and Edwards2005) vs 3.5 in our study (Table 4), H o = 0.70 vs 0.43 and H e = 0.90 vs 0.40.
The null alleles detected in a few loci of both A. sibirica and A. alba can potentially lead to an underestimation of allelic richness and heterozygosity for these loci in populations and introduce biases in measures of population differentiation by reducing the observed number of alleles and heterozygosity estimates, but it is unlikely that they would significantly affect these parameters based on all markers, because only a few loci were affected. Moreover, to mitigate the impact of null alleles, we used MICRO-CHECKER program to statistically correct genetic diversity and differentiation parameters for null allele presence.
Conclusions
Based on whole genome sequencing data, 10 polymorphic microsatellite markers were developed for A. sibirica, 14 for A. alba and 13 for A. nordmanniana. Among them, at least five (As_1356647, As_404145, As_563614, As_3458593 and As_420232) can be used for all three species, but potentially more. The markers were tested on samples from eight natural populations of A. sibirica and four populations of A. alba, and preliminary data on the level of population genetic variation and differentiation were obtained. These markers can potentially be used also in other species in genus Abies with the ability to use simple gel electrophoresis, which is very convenient in field research. For genetic laboratories equipped with devices for capillary gel electrophoresis, we have developed multiplex panels of 14 loci. It should be noted that only eight tree samples were studied for A. nordmanniana; therefore, the data for this species are preliminary, and it is necessary to significantly increase the number of samples and accessions for more accurate estimates of the genetic variability of this species.
The proposed list of nuclear microsatellite loci will be very useful for studying the variability of natural and artificial populations of different fir species helping to address different problems and questions related to conservation, restoration and reproduction of fir forests.
Supplementary material
The supplementary material for this article can be found at https://doi.org/10.1017/S1479262123000552.
Acknowledgements
We thank Alexandra Dolynska, Dr Markus Müller and other colleagues at the Department of Forest Genetics and Forest Tree Breeding (Georg-August University of Göttingen, Germany) for their help with developing and testing microsatellite markers of A. alba and A. nordmanniana. Funds for the development and genotyping of nSSRs in A. alba were provided by the University of Göttingen. We thank also Dr Vladimir L. Semerikov (Laboratory of Molecular Plant Ecology, Institute of Plant and Animal Ecology, Ural Branch of Russian Academy of Science, Ekaterinburg, Russia) for help with preparing the manuscript.


