


I had a problem answering “Just to revisit, do you think that the federal estate tax should be kept in place or eliminated?,” because I said that I didn't know when the question was first asked but the second time it didn't give me an “I don't know” option. I did not change from not knowing to knowing the answer to that in the space of a few pages so I had no idea at all what to answer on that one so my answer to that question should be considered “forced and therefore invalid.” I have absolutely no idea if it should be kept in place or eliminated as I know very little about it.
— Message sent to us from an anonymous survey respondent
1. Introduction
The survey is an important tool in the social scientist's toolkit. To guide researchers, a large literature examines how best to design survey questionnaires. An important issue in this literature is whether respondents should be offered an opportunity to say “don't know” (DK) to attitudinal questions. Many survey organizations and researchers working with surveys follow the recommendations of Krosnick et al. (Reference Krosnick, Holbrook, Berent, Carson, Hanemann, Kopp, Mitchell, Presser, Ruud, Smith, Moody, Green and Conaway2002), and do not explicitly offer such an option. Those authors analyze survey data from face-to-face and telephone interviews conducted around 1990 and find that offering a DK response option encourages satisficing; that is, it discourages respondents from doing the cognitive work involved in formulating and expressing an opinion, causing reductions in the effective sample size and statistical power without improving the quality of responses.
Since the publication of Krosnick et al. (Reference Krosnick, Holbrook, Berent, Carson, Hanemann, Kopp, Mitchell, Presser, Ruud, Smith, Moody, Green and Conaway2002), it has become conventional wisdom that the DK response option primarily serves as an invitation to satisfice. Although we agree that respondents might satisfice, particularly on certain issues, we think the time is ripe to reassess the conventional wisdom, as many increasingly important questions remain unanswered. For example, we know little about how the DK option affects estimates of public opinion in the new digital age, where most organizations rely on online panels. We know even less about the consequences of the option for estimates of opinion differences between subgroups of the population, such as gender, education, or income. Considering the increasing number of opinion surveys being conducted every year, the growing interest in gauging public support for specific (and sometimes very technical) policies, and the increasing interest in estimating subgroup opinions—e.g., in the exploding literature on class and inequality (see below)—answering these questions is paramount for advancing social science research.
We begin by developing an argument explaining how omitting the DK option can affect not only estimates of public support for policies but also the confidence respondents have in their answers and, perhaps most importantly, the estimated socio-economic gradient of those expressed preferences. We contend that on issues where respondents have little information, omitting the DK response option leads to more random responses, decreasing confidence in responses and biasing the balance of public support downwards, toward 50–50, much as Converse (Reference Converse and David1964) would predict. And because respondents with low levels of political knowledge are more likely not to have an opinion, effectively forcing these respondents to provide a substantive answer has a larger impact on the estimate of their preferences compared to those of better-informed respondents. An important consequence of this differential measurement error bias is that the gap in preferences between different groups will be partly determined by the amount of information available to respondents on a given issue and whether a DK response option is offered. Where information is plentiful, we expect that offering the DK option will not substantially impact measured preferences across groups: while it might encourage satisficing, per Krosnick et al. (Reference Krosnick, Holbrook, Berent, Carson, Hanemann, Kopp, Mitchell, Presser, Ruud, Smith, Moody, Green and Conaway2002), reducing the percentage of respondents who express both support and opposition, it would not substantially alter the balance of public support. By contrast, where information is scarce, omitting the DK option can produce more random responses, particularly for less knowledgeable groups, biasing the observed level of public support for or against a policy and the gap in preferences between groups. Omitting the DK response option in these cases can be consequential.
To assess these arguments, we implement a survey on a large sample of the United States (US) population, in which we experimentally manipulate response options to attitudinal questions. For the analysis, we randomly assign respondents to either a control or treatment group. The respondents in the two groups are asked the exact same questions, but those in the treatment group are offered the possibility of answering “don't know” to the attitudinal questions. The survey includes eight questions about topical political issues that were selected to provide variation in the proportion of DK responses and the preference gaps between income groups on both economic and social issues. As such, we expect variation in responses and treatment effects across questions. We first compare the distributions of responses for the two treatment conditions across the eight questions. We then assess the subjective confidence respondents have in their responses to the items. Finally, we consider the resulting gaps in preferences across subgroups.
Consistent with previous research conducted using face-to-face and telephone survey modes (Krosnick et al., Reference Krosnick, Holbrook, Berent, Carson, Hanemann, Kopp, Mitchell, Presser, Ruud, Smith, Moody, Green and Conaway2002), we find that respondents surveyed using newer, online modes are more likely to provide non-responses when offered the DK option. This varies across questions seemingly in correspondence with the amount of information required to provide a response. We are also able to confirm that respondents with lower levels of political knowledge are more likely to choose “don't know.” Respondents offered the DK option are more confident in their responses, and this effect also varies across issues in expected ways. Yet, as we hypothesize, providing the DK option only affects estimates of public opinion on some issues, and generally in the range of one to three percentage points. Finally, while we observe substantial effects of including the DK response option on preference gaps on more demanding items; on other, more salient issues, the consequences are limited. This also is as we expect.
These findings are good news for researchers who analyze issues on which respondents have an attitude or can easily (and reliably) produce one on the spot. That is, the common, almost standard practice of not explicitly offering a DK response option does not meaningfully distort either the balance of aggregate public preferences or differences in opinions across groups. On other, seemingly less salient issues, things are quite different. Here, omitting the DK response option makes a difference that may misrepresent the alignment of subgroup preferences—for example, we may conclude that preferences of groups differ where they don't, at least not as much. This has direct implications for the growing body of research that examines opinion differences between subgroups of the population, such as gender, race, education, or income (see, e.g., Cavaillé and Trump, Reference Cavaillé and Trump2015; Häusermann et al., Reference Häusermann, Kurer and Schwander2015; Lizotte, Reference Lizotte2020; Lizotte and Carey, Reference Lizotte and Carey2021; Hansen, Reference Hansen2023). It has further implications for analysis using previously collected survey data, perhaps especially in research on inequality in political representation that heavily relies on accurate estimations of preference gaps (e.g., Bartels, Reference Bartels2008; Enns and Wlezien, Reference Enns and Wlezien2011; Gilens, Reference Gilens2012; Rigby and Wright, Reference Rigby and Wright2013; Gilens and Page, Reference Gilens and Page2014; Enns, Reference Enns2015; Branham et al., Reference Branham, Soroka and Wlezien2017; Lax et al., Reference Lax, Phillips and Zelizer2019; Elkjær and Iversen, Reference Elkjær and Iversen2020; Elsässer et al., Reference Elsässer, Hense and Schäfer2021; Schakel, Reference Schakel2021; Elkjær and Klitgaard, Reference Elkjær and Klitgaard2024). Such research should be mindful that on low salience issues, preference gaps are endogenous to information, which in turn suggests that estimates of policy representation also are endogenous to information, i.e., the inequality that we observe may be more apparent than real. Finally, even where the DK response option does not alter the preference gaps we observe, it does influence the distributions of responses and the confidence people have in the answers they give, sometimes in dramatic ways. These results, while not surprising, also are revealing about people's true preferences.
2. Previous research on “don't know” responses
Survey organizations typically do not offer a DK response option when registering people's preferences on policy issues. For example, the policy of the General Social Survey for self-administered surveys is to not provide a “don't know” response option on any attitudinal question but instead allow respondents to skip questions they do not wish to answer. Also consider Gilens' (Reference Gilens2012) work on inequality in representation in the US that draws on a large set of policy preference questions, most of which did not include a DK response option (Gilens, Reference Gilens2012: 90). As discussed, this practice in large part reflects scholarly research and advice, most notably Krosnick et al.'s (Reference Krosnick, Holbrook, Berent, Carson, Hanemann, Kopp, Mitchell, Presser, Ruud, Smith, Moody, Green and Conaway2002) study highlighting the tendency for respondents to provide DK answers when they actually have preferences. That work built on previous research by Krosnick (Reference Krosnick1991) on satisficing, particularly when attitudinal items require substantial cognitive effort (for a review of recent work on satisficing in surveys, see Roberts et al., Reference Roberts, Gilbert, Allum and Eisner2019). And there is other supporting research. Berinsky (Reference Berinsky2004) finds that a DK option introduces bias by allowing respondents to not provide socially unacceptable answers on (controversial) issues like racial integration.
A good amount of research challenges the seeming consensus. Some preceded Krosnick's (Reference Krosnick1991) original research. Schuman and Presser (Reference Schuman and Presser1979) found a large number of “floaters” who responded DK when offered the option but concluded that our understanding of them and their responses was “rudimentary,” something that was underscored by their later work (Reference Schuman and Presser1980). Smith's (Reference Smith, Turner and Martin1985) statement on the subject argued further that the inclusion of a DK response option helps to elicit “hidden” nonattitudes, i.e., random guesses, per Converse (Reference Converse and David1964). Luskin and Bullock's (Reference Luskin and Bullock2011) research on factual survey questions supports Smith's earlier claims, as they find that DK responses are more indicative of a lack of knowledge than obfuscation. Jessee (Reference Jessee2017) finds much the same and also that differences in (the Big Five) personality types do not matter. Purdam et al.'s (Reference Purdam, Sakshaug, Bourne and Bayliss2024) cross-national analyses of factual and attitudinal items also document that DK responses tend to reveal respondents' lack of information. There thus is growing evidence that DK responses really do mean “don't know,” at least to some extent, and research by Graham (Reference Graham2021) shows further that those responses are closely related to confidence in answers among those providing substantive responses.
Although the recent research implies that Smith (Reference Smith, Turner and Martin1985) was (largely) correct, and offering a DK option will help reveal nonattitudes, there is reason to think that this is most pronounced where people have weak preferences that are poorly informed. Indeed, on some high salience issues, where people have clear(er) preferences, it may be that the DK option mostly encourages people to behave as Krosnick (Reference Krosnick1991) argued, and satisfice. There also is reason to expect differences across individuals, possibly even on high salience issues, which may impact preference gaps across groups. We know that information matters for preferences, and it also correlates with other variables that are of special social and political importance, such as income. That actually was the motivation for our research.
3. Theory and implications
We suppose that the previous research is correct in stating that the DK response option encourages respondents with preferences to give a DK response; yet, at the same time, we think it downplays the possibility that omitting the option encourages respondents without preferences to offer one. Specifically, following Converse (Reference Converse and David1964) and Smith (Reference Smith, Turner and Martin1985), we expect the exclusion of a DK response option to lead respondents to guess, i.e., picking between two response options with 50–50 percent probability. Our conjecture has a set of clear predictions that guide the empirical analysis.
First, including the DK option should increase non-responses because it allows respondents who are uninformed or unsure about their opinion to express a nonattitude—and given the importance of information, we should see variation in the effect across individuals with differing levels of information:
H1: (a) Including a “don't know” response option in attitudinal survey questions leads to more “non-answers” compared to omitting it.
H1: (b) The effect of including a “don't know” response option on “non-answers” is stronger for respondents with lower levels of information.
H1 implies that excluding the DK option will increase the likelihood of observing majorities (as opposed to pluralities) in support of one option or another, with direct implications for conclusions about opinion-policy congruence. As discussed, however, we expect variation in the effect of the DK option across issues according to the amount of information available to people, which presumably is connected to the salience of an issue.
Although H1 has important implications for estimates of public opinion, it does not allow us to discriminate between satisficing theory and our argument: satisficing theory also predicts more non-responses when the DK option is offered, and it predicts variation in the use of the option across respondents according to individual ability and across issues according to task difficulty (see, e.g., Roberts et al., Reference Roberts, Gilbert, Allum and Eisner2019). Our basic conjecture has further implications for other features of public opinion, however, which contrast with those of satisficing theory. While satisficing theory says little about the effect of the DK option on the confidence respondents have in their answers, our argument implies that if (some) respondents use the DK option to convey nonattitudes or that they are unsure about their opinion, respondents who are not offered the option should be less confident about their answers (see also Graham Reference Graham2021). After all, they've been pressed to state a preference that they might not have or else hold only weakly. This informs our second hypothesis:
H2: Respondents who are not offered a DK response option will be more unsure about their responses compared to respondents who are offered the option and do not use it.
The natural implication of H1 and H2 is that omitting the DK response option will cause more balanced aggregate preferences because more (low information) respondents, who either have no opinion or are very unsure about it, answer the question at random. This will, in turn, alter the observed preference gap between groups with different levels of information upwards or downwards, depending on which group has more extreme preferences:
H3: (a) Omitting a “don't know” response option in attitudinal survey questions leads to more balanced aggregate preferences (the mean preference will be closer to 0.5 when there are two substantive response options).
H3: (b) This effect will be more pronounced for respondents with lower levels of information.
H3: (c) Accordingly, when a larger majority of the better-informed group support (oppose) a policy, omitting a “don't know” response option in attitudinal survey questions leads to larger differences in preferences between the groups; when a larger majority of the lesser-informed group support (oppose) a policy, omitting the “don't know” response option in attitudinal survey questions leads to smaller differences in preferences between the groups.
These predictions contrast directly with those of satisficing theory, according to which the balance of public support, and therefore also preference gaps, should be unaffected by the inclusion of the DK option (Krosnick et al., Reference Krosnick, Holbrook, Berent, Carson, Hanemann, Kopp, Mitchell, Presser, Ruud, Smith, Moody, Green and Conaway2002).
Another alternative is that respondents who do not actually have an opinion may rely on basic heuristics or considerations to provide answers if not offered an opportunity to answer DK, which can drive expressed support for a policy either upwards or downwards (Zaller and Feldman, Reference Zaller and Feldman1992; also see Althaus, Reference Althaus2003). It consequently is possible that we observe effects that contrast with our predictions even as respondents effectively guess, just not randomly. In the end, it is an empirical matter how expressed public opinion is affected by the presence of a DK response option.
Finally, we want to emphasize (again) that we expect to see considerable heterogeneity in effects across issues; it is implied by both our theory and the research design itself. Most importantly, information levels should matter, as these underpin preferences and their expression in survey responses. Where people have little information and are unsure about what they think, after all, omitting the DK response option should lead to more guesses. This produces variation across issues, as people have more information—and clearer preferences—on certain, high salience issues and less on other lower salience ones. In short, the consequences of (not) including the DK option for the distributions of opinion we observe should be most consequential on low salience issues.
4. Research design
To test the hypotheses, we conducted a pre-registered survey experiment on 4810 respondents recruited from Prolific's online panel using their representative sample option, which ensures that the sample reflects the US adult population on the dimensions of age, gender, and ethnicity.Footnote 1 It is not a probability sample, which actually may be an advantage in terms of comparability with typical opinion polls, given the rise of non-probability samples in survey research.
In the survey, we first asked respondents a range of demographic questions. They then were randomly allocated to either a control or treatment group.Footnote 2 Respondents in the treatment group were directly exposed to a “don't know” response option on all attitudinal questions, whereas those in the control group were not. Following typical survey practice, however, respondents in the control group had the option of skipping any question they did not wish to answer, as did respondents in the treatment group, which we informed them about before receiving their consent to take the survey. In both groups, we also randomized the order of the substantive response options on all attitudinal questions to ensure that any effects we observe are unaffected by the response order; in the treatment group, the DK option was always placed at the bottom, below the substantive response options.
The attitudinal questions asked about the respondents' opinions on abortion (specifically “Roe v. Wade”), border security, capital gains tax cuts, the estate tax, infrastructure, minimum wage, transgender military service, and vaccine mandates. Across all questions, the respondents were given two substantive response options; specifically, whether they “support” or “oppose” the policy.Footnote 3 The eight issues were chosen to provide variation in the proportion of “don't know” responses and in the preference gaps between income groups spanning economic and social policies (see Appendix A).Footnote 4 The (expected) variation in DK answers and preference gaps across issues implies that the treatment effect should vary across our questions.
After each attitudinal question, respondents who expressed a preference were asked a follow-up question about how sure they felt about their answer. The next part of the survey asked respondents to revisit their responses on three of the attitudinal questions—capital gains tax, estate tax, and abortion—where those in the control group received the DK treatment while those in the treatment group did not. This permits an additional test of H1 and H3 with experimental variation within respondents. In the interest of space, we report these results in Appendix C, but they are substantively similar to those presented below. The survey concluded by asking five factual questions about politics, which we use to derive a measure political knowledge (see Appendix A).Footnote 5 Each of the knowledge items—in both the control and treatment conditions—include a DK response option to discourage guessing, thus providing cleaner estimates of variation in actual knowledge.
5. Results
We begin the analysis by examining the distribution of responses for each treatment group in Figure 1. Two patterns stand out there. First, whereas respondents in the control group gave a no-opinion response, i.e., skipped the question, just 10 times out of 19,240 (0.05 percent of the time), respondents in the treatment group answered either “don't know” or skipped the question 2868 times, again out of 19,240 (15 percent of the time). This result is important, since it shows that the standard practice of allowing respondents to skip a question (while omitting the DK response option) has virtually no impact on non-responses, which appears to be revealing about the online survey mode or panel we use and others like it. Simply allowing respondents to skip a question does not seem to be an effective way of separating out respondents who truly do not have an opinion, unless literally everyone in our sample has preferences on all issues, regardless of their difficulty.
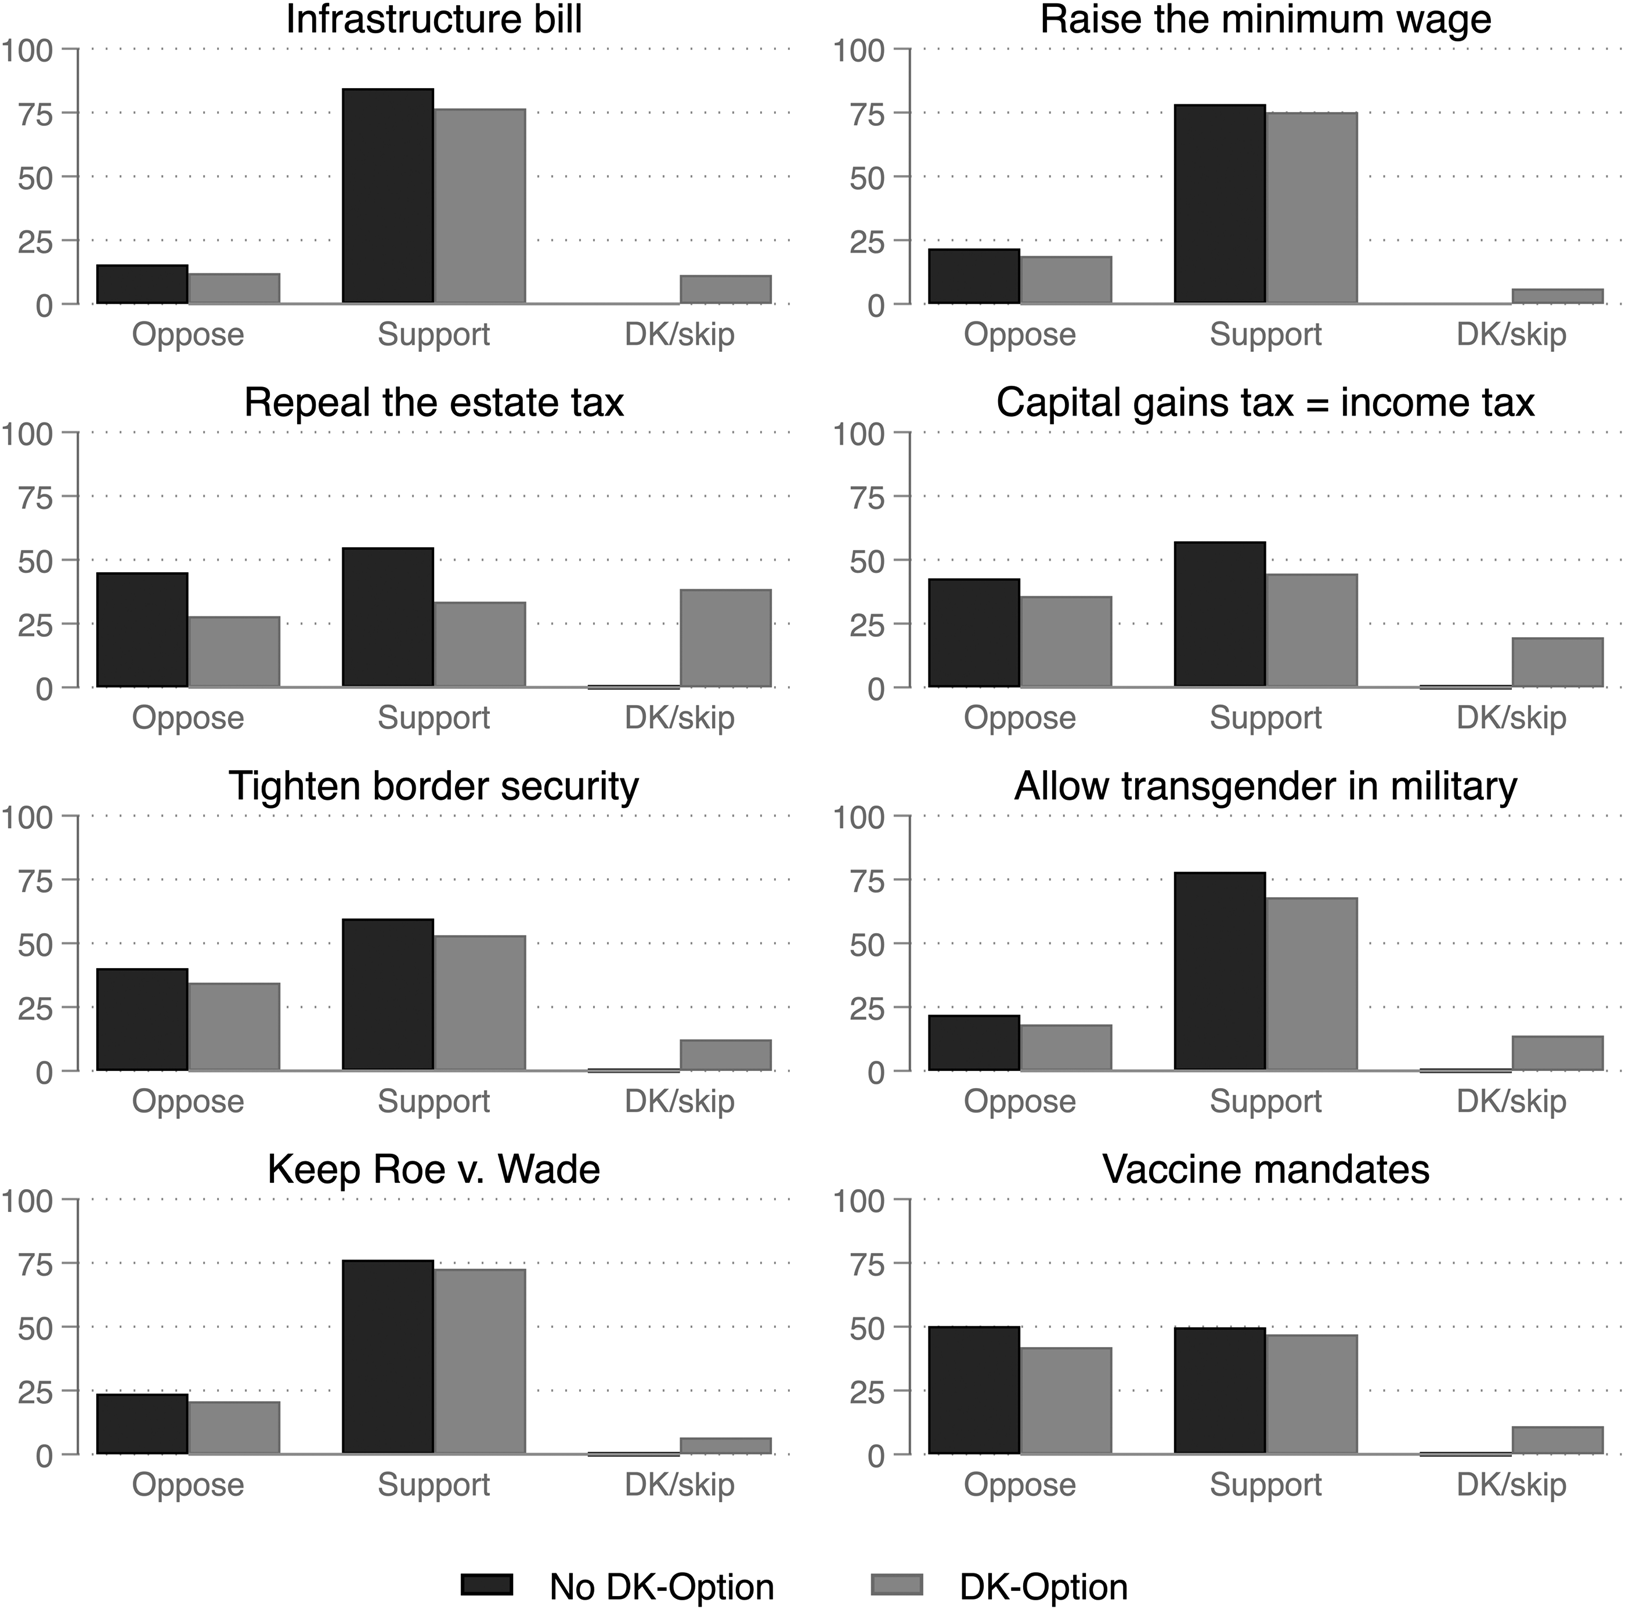
Figure 1. Distribution of responses (in percent), by policy and DK-treatment.
At the same time, we see significant variation in the effect of the DK treatment across questions. The effect is strongest on the capital gains and estate tax questions, where a whopping 20 and 38.5 percent of respondents answered “don't know” when given that option. That these questions attract the highest number of DK answers may be related to the difficulty many people have in understanding tax rules and policies (Stantcheva, Reference Stantcheva2021). For the other issues, DK responses are between approximately 6 and 13 percent.Footnote 6 These results corroborate H1a, demonstrating that including a DK option significantly increases the number of no-opinion responses, with important variation across issues seemingly in accordance with the difficulty of the question, which also is as Krosnick (Reference Krosnick1991) predicts.
Second, on three of the eight questions (estate tax, capital gains tax, and COVID vaccines) adding the DK response option eroded majority support for a policy option. The change is most pronounced on the estate tax, where a majority in the control group supported repealing the tax while a plurality of participants in the treatment group responded “don't know.” On average across the eight items, we observe a large decline in support for the different policies when the DK option is offered: from 67.3 percent in the control group to 58.8 percent in the treatment group. These results demonstrate that omitting the DK option can have direct implications for inferences about policy congruence, which are based on assessments of whether enacted policies receive majority backing from the public. Question wording matters for the support we observe, and that matters for the match we find between opinion and policy decisions.
We next test H1b—whether the effect of the DK treatment varies across individuals with differing levels of information. For this, we created a binary variable that takes the value “0” if the respondent provided a substantive answer and “1” if they answered “don't know” or else skipped the question. We then regressed this variable on an interaction between the treatment variable and our measure of political knowledge. Included in the equation are binary variables for the different policy questions. The model is estimated using OLS with standard errors clustered by respondent. Figure 2 displays the results. Consistent with H1b and previous research (Krosnick, Reference Krosnick1991; Krosnick et al., Reference Krosnick, Holbrook, Berent, Carson, Hanemann, Kopp, Mitchell, Presser, Ruud, Smith, Moody, Green and Conaway2002), the results show that respondents with low levels of political information are most likely to respond “don't know.” Whereas including the DK option increases DK answers by more than 20 percent among respondents with low levels of information (no or one correct answer), the increase is only about 10 percent among respondents with high levels of information (four or five correct answers).Footnote 7
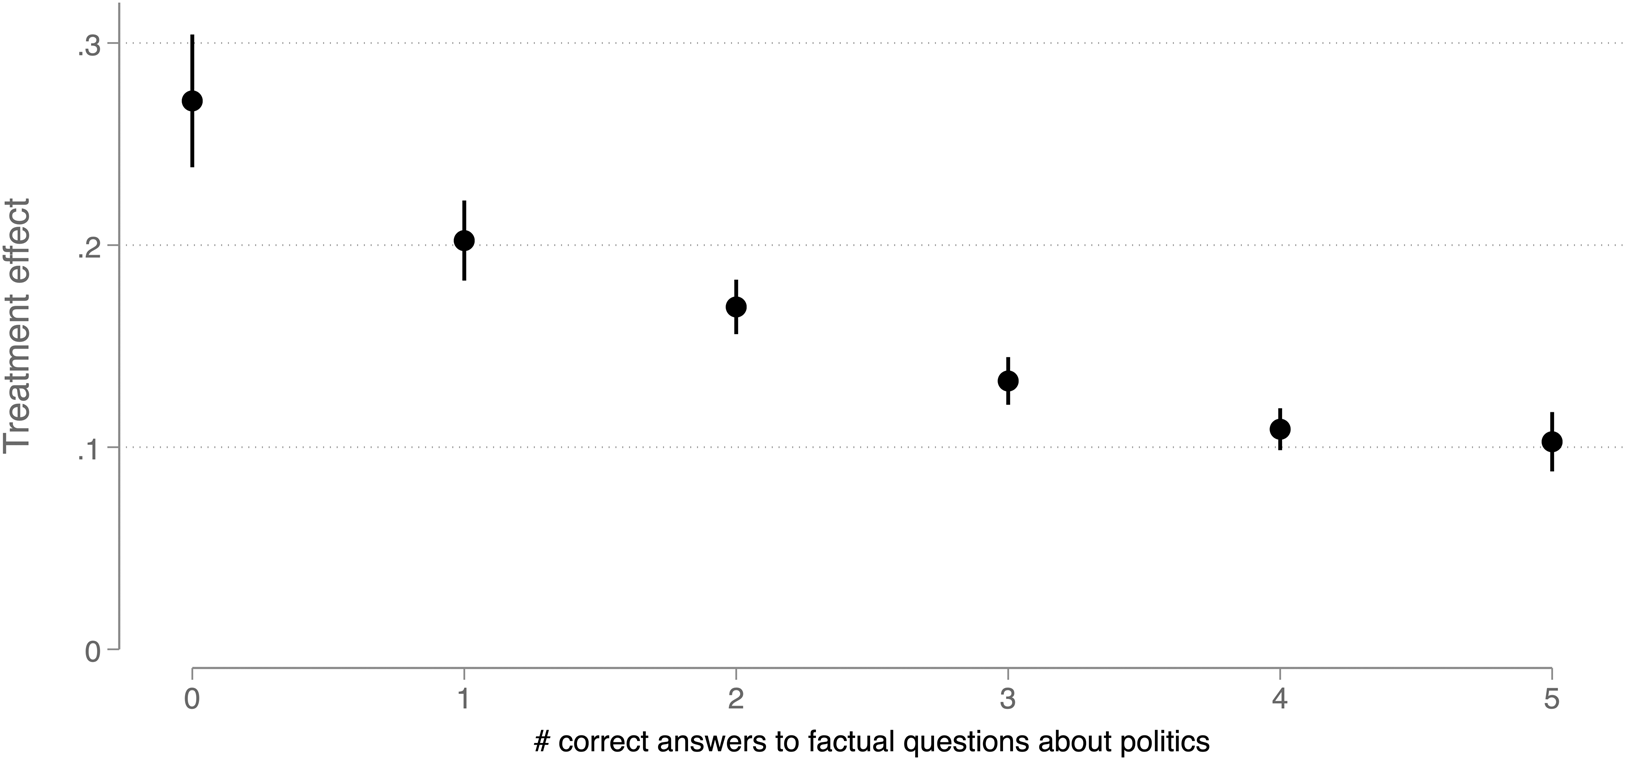
Figure 2. The effect of the “don't know” treatment on “non-answers” (with 95 percent CIs), by political knowledge.
Note: n = 38,480. The full set of results is shown in Appendix Table D1.
5.1 The don't know response option and confidence in answers
Having corroborated H1, we move on to test H2, which stipulates that including the DK response option in attitudinal survey questions should increase the confidence that respondents have in their answers. To remind, this hypothesis is important because, by contrast with H1, the expectation differs from what satisficing would predict, as it does not address the issue and there seems little basis in the model for such a connection.Footnote 8 Here, the dependent variable is a four-point categorical variable capturing how sure respondents were about their answers ranging from “not sure at all,” “not very sure,” “fairly sure,” and then “extremely sure.” We regress a standardized version of this variable (mean = 0, SD = 1) on the treatment variable interacted with policy item dummies, again using OLS with standard errors clustered by respondent. Figure 3 depicts the results.
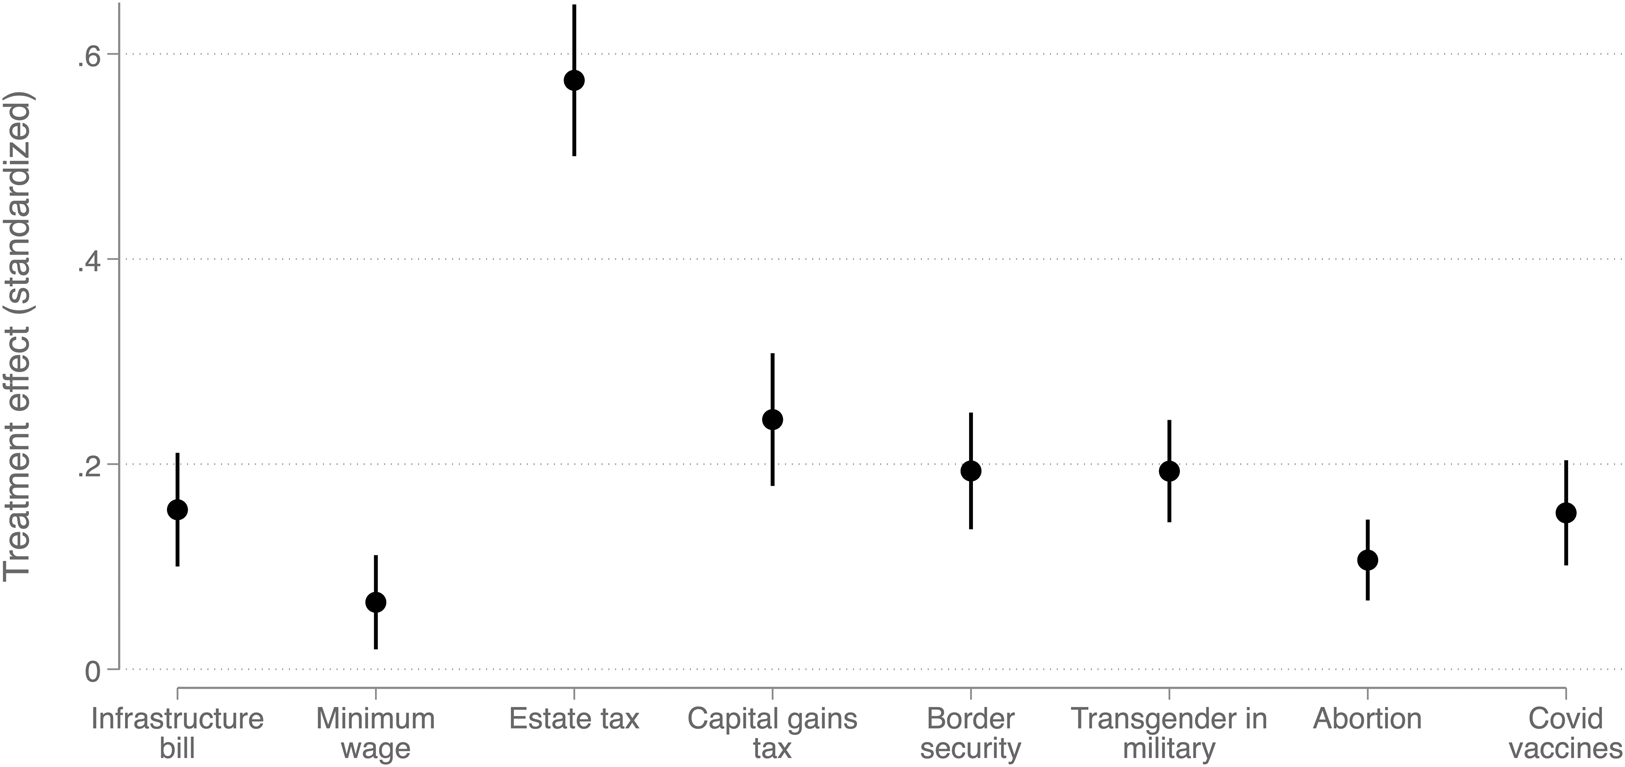
Figure 3. The effect of the “don't know” treatment on confidence in answers (with 95 percent CIs), by policy issue.
Note: n = 35,594. The full set of results is shown in Appendix Table D2.
Consistent with H2, Figure 3 shows that the DK treatment had a significant effect on the confidence that respondents had in their answers and that this effect varies substantially across the eight questions. On average, the DK treatment increased confidence in answers by 0.2 standard deviations, ranging from a substantively rather small effect of 0.07 on the minimum-wage question to a substantively large effect of 0.6 on the estate tax question.Footnote 9 At the same time, it is important to note that these effects are from high baseline levels of expressed confidence. On average across all questions, 91 percent of respondents stated that they felt either fairly or extremely sure about the answer they gave, from 79 and 84 percent on the estate and capital gains tax questions to 98 percent on abortion. These results suggest that the salience of an issue matters not only for the tendency to give DK answers but also for how sure respondents feel about their answers. This is exactly as we hypothesized, and it supports the supposition that including a DK response option helps reveal true preferences.
5.2 The don't know response option and estimates of public opinion
We have established that including a DK response option in attitudinal questions can have non-trivial effects on the number of no-opinion responses and the confidence that respondents have in their answers, and these seemingly are related. A natural implication of these findings is that some respondents who truly do not have an opinion on an issue will provide one when not offered the opportunity to answer “don't know.” If this is the case, our expectation (H3a) is that some of these respondents answer at random, picking one of two options with equal probability. If enough respondents do so, the estimate of public opinion will shift toward a 50–50 split between support and opposition to a policy.
To test this implication, we regress a binary variable indicating whether the respondent supported or opposed a certain policy on the treatment variable, interacted with the policy-item dummies. As before, we estimate the model using OLS with standard errors clustered by respondent. Figure 4 plots estimated policy support for each policy question and treatment condition. Because the baseline support for all eight issues is above 50 percent, positive effects of the DK treatment would imply that (some) respondents answer at random when the DK response option is omitted, and negative effects that support for or opposition against a policy strengthens. As discussed, the latter could result where respondents are uncertain about their opinion, but respond (when a DK response option is omitted) based on salient considerations (Zaller and Feldman, Reference Zaller and Feldman1992; Althaus, Reference Althaus2003). Non-effects would be consistent with the satisficing approach.
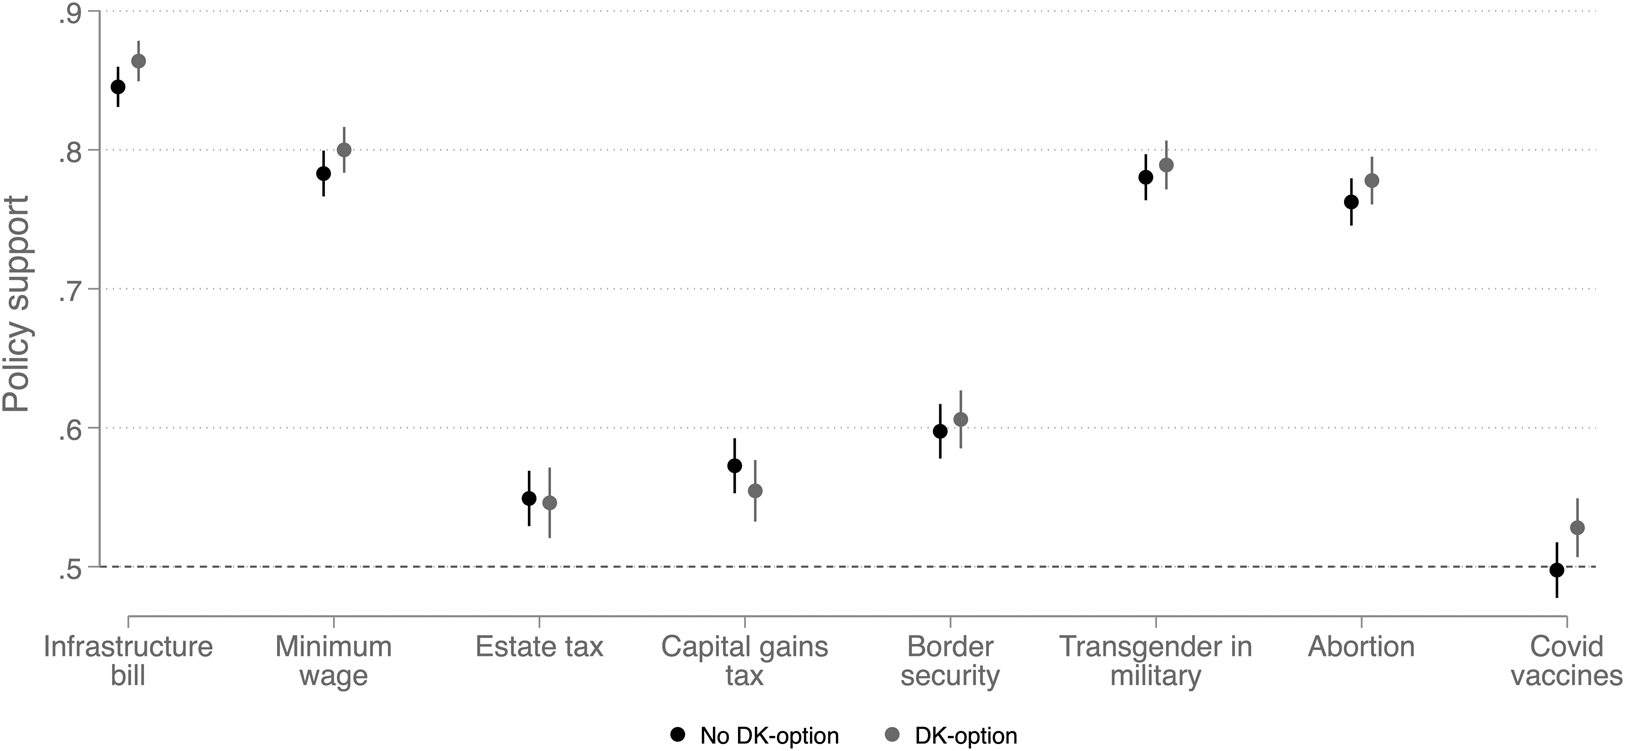
Figure 4. The effect of the “don't know” treatment on policy support (with 95 percent CIs), by policy issue.
Note: n = 35,602. The full set of results is shown in Appendix Table D3.
As can be seen from Figure 4, the effects we observe vary across questions. The largest effect is on COVID vaccines, where the inclusion of the DK response option shifted net support by 3 percent away from an equal 50–50 split (p = 0.04). On the infrastructure bill, minimum wage, and abortion questions, expressed preferences shifted by 1.5–1.9 percent in the expected direction, though these are not statistically significant (0.08 < p < 0.21). On the border security and transgender questions, the treatment effects are below 1 percent (0.47 < p < 0.56), and on the two tax questions, particularly for capital gains, the treatment effects were negative, though again not statistically significant (0.23 < p < 0.85).
Overall, these results only weakly corroborate H3a. The effect of the DK response option clearly differs across issues; on six of our eight questions, we observe effects in the expected direction, but they are mostly statistically insignificant. When pooling across issues, we obtain an average treatment effect of 1 percent (p = 0.12) in the expected direction, but it (also) fails to reach statistical significance at conventional levels. That said, do keep in mind that we expect variation across issues and designed the research to reflect this.
5.3 Differential effects of the don't know response option
Although the results only partly (and weakly) corroborate H3a, there may still be significant differences in effects across subgroups, particularly those with different levels of information. Indeed, we predict that the estimated preferences of respondents with low levels of information should be most affected by the omission/inclusion of the DK response option, per H3b.
To assess whether this is the case, we regress the policy support variable on the treatment dummy interacted with the respondent's level of political information. To allow for differential treatment effects across individual levels of information and across policy issues, we estimate this regression model separately for each policy question. To simplify the presentation, we rescale the original six-point categorial political information variable to three categories: the first group is “low-information” and includes respondents who correctly answered zero or one of the factual questions about politics (18 percent of respondents), the second is a “middle-information” group containing respondents who correctly answered two or three questions (46 percent of respondents), and the last group consists of “high-information” respondents who gave correct answers to four or all five questions (36 percent of respondents).
The results of these regressions are depicted in Figure 5. The figure shows that the omission of the DK response option can have dramatic effects on public opinion estimates for groups with low levels of political information. For example, we can see that on the question related to the recently adopted infrastructure bill, the responses of low-information respondents differ markedly depending on whether a DK option is offered. When it is omitted, a significant number of low-information respondents appear to answer at random to the extent that the estimate of their opinion is 5.6 percent (p = 0.023) lower than when the DK option is offered. For respondents with middling levels of information, the effect of including the DK option is weaker, at 2.6 percent (p = 0.099), and for high-information respondents it is close to zero (Δ = −0.7, p = 0.69). This is exactly the pattern predicted by H3b, which we would expect if respondents who truly do not have an opinion are pressed to provide one.
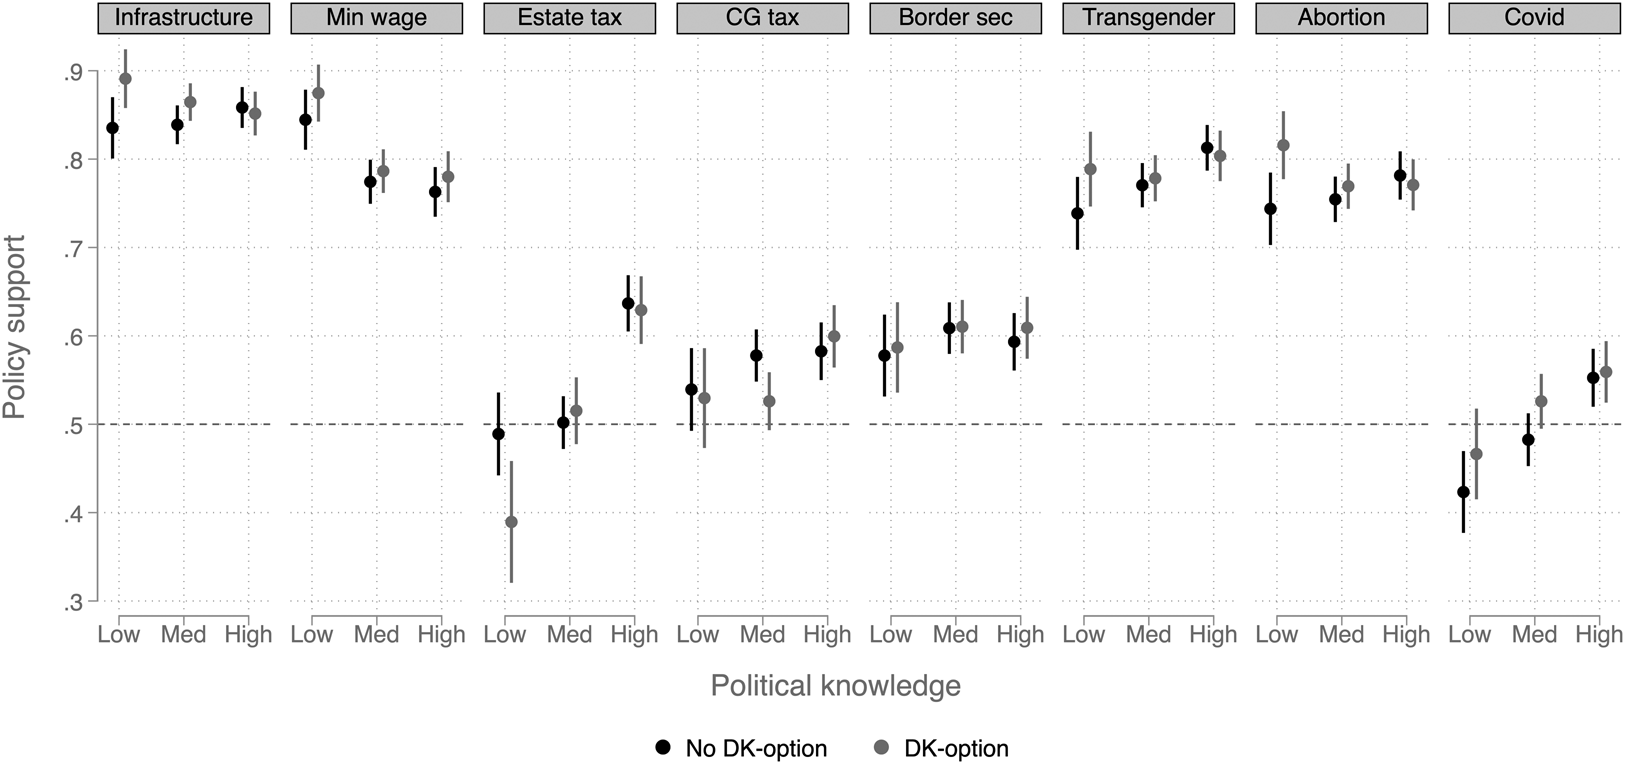
Figure 5. The treatment effect on policy support (with 95 percent CIs), by policy issue and political information.
Note: n varies between 3882 on the estate tax question to 4665 on the minimum wage question. The full set of results is shown in Appendix Table D4.
We see similar, substantively large effects on the questions related to transgender rights to serve in the US military and abortion (Roe v. Wade), where the effect of including a DK response option increases support for these policies among low-information respondents by 5.0 percent (p = 0.096) and 7.2 percent (p = 0.012), respectively. But, by far, the strongest effect of the DK treatment among low-information respondents is found on the estate tax question, a policy where respondents are known to possess (very) low levels of information (Slemrod, Reference Slemrod2006; Bartels, Reference Bartels2008; Stantcheva, Reference Stantcheva2021). Here, the inclusion of the DK option changed the estimate of the preferences of low-information respondents by a full 10 percent (p = 0.019). In the control group, there was an almost 50–50 split between those favoring retaining the estate tax or eliminating it, whereas in the treatment group only 39 percent of low-information respondents favored keeping the tax. On the minimum wage, the effect is in the expected direction but weaker and not as reliably estimated as those for the other questions (Δ = 3.0, p = 0.21). Also note that across these five questions, the preferences of high-information respondents are virtually unaffected by the inclusion of a DK-response option. This again supports H3b.
On the remaining three questions—capital gains taxes, border security, and COVID vaccine mandates—we do not find support for the hypothesis. On these items, the presence of a DK response option did not cause a shift in the expected direction among low-information respondents. As discussed, this could be due to respondents satisficing or answering these questions based on heuristics or salient considerations.
Overall, these results suggest that the presence of a DK response option can have important effects on public opinion, but mainly among respondents with low levels of political information and only on some issues.Footnote 10 This pattern is consistent with our argument that omitting the DK option forces some respondents who truly do not have enough information to provide a substantively meaningful answer to state a preference. The estimate of the preferences of groups with a large number of such respondents will be biased toward an even 50–50 split between support for and opposition against a policy. At the same time, the results are also consistent with satisficing theory: the presence of a DK response option is an invitation to satisfice, especially among respondents with sufficient levels of information (generally respondents with middle-to-high information levels). The balance of policy support for these respondents is very similar to that of their counterparts who were not offered an opportunity to say “don't know.”
5.4 The don't know response option and preference gaps
Having assessed and found (some) empirical support for all our hypotheses, we are now ready to test the final hypothesis, H3c. This hypothesis is implied by H1–H3b and predicts that the gap in preferences between subgroups of the population who differ in levels of information will partially be a function of whether “don't know” is included among the response options. The attentive reader will have noticed from Figure 5 that preference gaps indeed are affected by the presence (or absence) of a DK response option. But, we want to provide a more direct test.
We do so by estimating how the gaps in preferences between groups with low and high levels of information, shown in Figure 5, differ across the control and treatment groups. The results are presented in Figure 6. The figure shows that the presence of a DK response option can have substantial effects on the preference gaps between subgroups with different levels of information. Consistent with H3c, we see that preference gaps on the infrastructure bill, the estate tax, transgender rights, and abortion differ by more than five percentage points between the control and treatment groups. On these four issues, the absence of a DK response option drives the preferences of low-information respondents toward an even 50–50 split in preferences, which impacts the estimated gap in preferences. On infrastructure and the court decision legalizing abortion, the impact is strong enough to change the direction of the gaps; that is, the estimate of which group is more supportive of the policy. On transgender rights the preference gap increases when the DK response option is omitted; on the estate tax, the preference gap decreases. These patterns are as predicted by H3c and thus support the hypothesis.
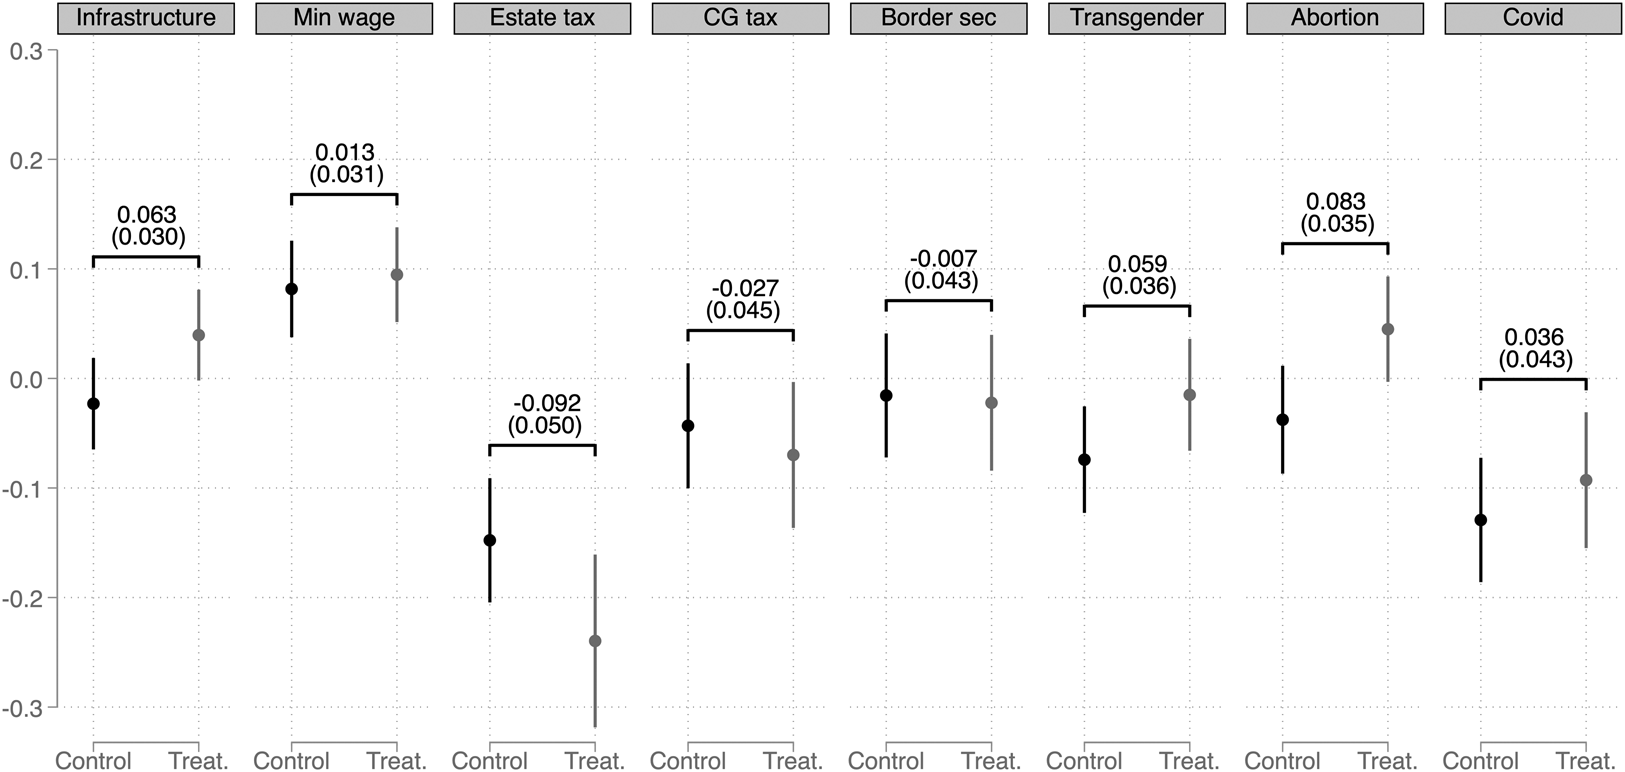
Figure 6. Preference gaps between low and high information groups (with 95 percent CIs), by policy and DK-treatment.
Note: n varies between 3882 on the estate tax question to 4665 on the minimum wage question. The preference gaps are calculated by subtracting the proportion of high-information respondents who support a policy option from that of low-information respondents, where DKs are omitted from these calculations. Positive (negative) values on the y-axis therefore mean that the low-information group is more (less) supportive of the policy than the high-information group. The numbers reported in the figure show the difference in preference gaps between low- and high-information respondents across the control and treatment groups, with the standard errors in the parentheses. The full set of results is shown in Appendix Table D4.
On the remaining questions, we either see little-to-no effect of the DK treatment (minimum wage and border security) or the effect goes against our expectation (capital gains and COVID vaccine mandates). In the latter cases, however, the changes in preference gaps are smaller than the effects we observe for the items where the effect is consistent with H3c.
All in all, we find support for our final hypothesis H3c, but again the results confirm that the effects of the DK option differ across issues. Satisficing theory appears to be correct on certain, more salient issues. But, on other, less salient ones, the omission of the DK response option can have important effects, not only on the overall estimate of public preferences but on confidence in answers, as well as the estimated gap in preferences between subgroups of the population who differ in levels of information.Footnote 11
6. Conclusion
It is well-known that question wording matters for survey responses to policy questions and in different ways (Schuman and Presser, Reference Schuman and Presser1996). Findings regarding the inclusion of a DK response option have been particularly influential on the behavior of survey organizations, who commonly do not include one. The research on which the practice is based demonstrates that including a DK option encourages respondents to satisfice, responding “don't know” even when they have preferences for or against a policy (Krosnick et al., Reference Krosnick, Holbrook, Berent, Carson, Hanemann, Kopp, Mitchell, Presser, Ruud, Smith, Moody, Green and Conaway2002). In this paper, we have reassessed this conventional wisdom through a pre-registered survey experiment using the newer, online survey mode and developed and tested new hypotheses regarding the impact of the DK option on estimates of public opinion.
In so doing, we make four contributions. First, we confirm that (especially low-information) respondents are more likely to provide no-opinion responses when given the opportunity to answer DK, especially on low-salience issues. Perhaps most novel here is the finding that providing respondents with the opportunity to skip attitudinal questions is no good substitute for the DK option in online surveys, as essentially no respondents made use of this possibility in our survey—10 responses out of 19,240! This result is important for two reasons: (i) simply allowing people to skip questions is not an effective way of separating out respondents who truly do not have an opinion on an issue; and (ii) since virtually no one gives non-responses when the DK option is not explicitly offered, researchers are left with less information about the confidence people have in their answers compared to traditional face-to-face and telephone surveys, where the proportion of DK responses is revealing of confidence among those who did answer the question (Graham, Reference Graham2021). To get a sense of confidence in answers in an online context, therefore, it appears necessary to ask questions that directly probe it.
Second, and related to the previous point, we find that including the DK option raises the expressed confidence respondents have in their answers, especially on low-salience issues. By omitting the option researchers therefore risk receiving answers containing more uncertainty, which can impact public opinion estimates for subgroups with many low-information respondents.
Third, although we find that the DK option can substantially impact estimates of majoritarian support for policies, particularly on low salience issues, it does not appear to have consistent effects on estimates of aggregate net support for policies. Across eight attitudinal questions, we mostly observe statistically insignificant differences in the balance of public support between groups that did or did not receive the DK response option. The largest effect is on a question related to COVID vaccine mandates and here the aggregate effect was a three-percentage point shift. In many cases, therefore, researchers interested (only) in the balance of public support among those offering preferences for different policy options appear to be able to omit the DK option to maximize statistical power, without much loss of precision. At the same time, given that omitting the option can alter majoritarian support, as in the case of estate and capital gains taxes and COVID vaccines, omitting the option may still be problematic, perhaps especially for scholars using responses in analyses of political representation.
Fourth, the effect of the DK treatment on the balance of public support does differ markedly across individuals, depending on the amount of information available to them. Because low-information respondents are more likely to answer at random when not given an opportunity to answer DK, the gaps in preferences across subgroups of the population with different levels of information are endogenous to whether attitudinal questions include a DK response option or not. This has implications for the estimated socio-economic gradient of public support for policies, especially on low-salience issues where information is scarce and people with high levels of information are better able to express a preference for or against a policy. Researchers interested in differences in subgroup preferences thus might consider the salience of an issue when deciding whether to include the DK option or not. On high salience issues, the omission of the DK option is likely to have only small effects on preference gaps, but on low salient issues, the option can have a large impact on estimated differences in preferences.
While we have provided some initial steps forward, the exact conditions under which the inclusion of the DK response option alters estimates of public opinion, and to what degree, remain unclear. We hope our results serve as useful guideposts moving forward, as scholarship further considers variation across issues and individuals, and also explores differences across survey mode and the spatial (and temporal) context itself.Footnote 12 These are important to understand, we think, because they have consequences for our understanding of public opinion, and perhaps most importantly for political representation. After all, the assessment of “congruence” between what the public wants and policy decisions depends on accurate estimation of public preferences (see Wlezien, Reference Wlezien2017). This matters both for broad macro-level comparisons involving the average person or voter, or analyses of who gets represented—e.g., the poor, middle, and rich—the evaluation of which can depend on whether the survey items used to produce the estimates of preferences include a DK response option. Given that most research in the area, e.g., Gilens (Reference Gilens2012), relies mostly on preferences elicited without that option, there is reason to think that it might exaggerate disparities in the representation of different groups.
In the meantime, we encourage scholars to be mindful of the possibility that a DK response option may reveal true nonattitudes—it may not only lead respondents to satisfice. This may be especially true with online panels, where respondents in our survey almost never provided a non-response unless they were explicitly offered the DK option.Footnote 13 Our estimates indicate that, on average across the policy questions we asked in the survey, 15 percent of respondents in the control group would have offered a DK response had such an option been available. This proportion varies substantially across issues, from 6 percent in the case of the minimum wage to 38.5 percent for the estate tax. The proportion also varies substantially with political information, from 10.7 percent (across all issues) among highly informed respondents to 22.5 percent among those with low levels of political information.Footnote 14 Even though not all of the additional DK responses reflect true nonattitudes, there is reason to expect more random responses when respondents are not offered a DK option, especially for those with low levels of political information, and particularly on low salience issues.Footnote 15 This introduces the random response bias in results we have seen, which can be at least partly averted by including the DK option. It does come at a price, however, as including the option reduces the number of respondents expressing preferences, partly due to satisficing itself, which reduces statistical power. Judging from our estimates, the effect of the latter (lower effective number of observations) is likely to be more consequential than the former (bias) for assessing public opinion on high salience issues, where the option matters little for response rates and the distribution of expressed preferences. On low salience issues, the random response bias in opinion estimates of groups with low levels of political information can be substantial, which poses a larger trade-off between statistical power and bias.
We realize that much research using surveys focuses on treatment effects, not point estimates per se. For scholars interested in the effect of an experimental treatment, we (again) believe that the salience of the examined issue is important to consider. For high salience issues, where most respondents already have an opinion, DKs are expected to be low and reflect mostly satisficing. In these cases, omitting the DK option is likely to be preferable, as it mostly serves to reduce statistical power in the experiment. For low salience issues, on the other hand, many respondents will either not have an opinion or be unsure about it. Adding a DK option might be more beneficial in these cases, at the very least because it yields a more precise estimate of public opinion in the control group, which matters for the treatment effect when expressed as a percentage change from the baseline. It can also add an additional layer to the analysis by enabling the researcher to examine whether the experimental treatment helped respondents formulate preferences, as exemplified by a decrease in DK answers (see e.g., Elkjær et al. (Reference Elkjær, Ansell, Bokobza, Cansunar, Haslberger and Nyrupforthcoming). But again, these considerations must be traded off against the decrease in statistical power that will result from more no-opinion responses.
Finally, scholarly information and knowledge can cumulate, where we all learn from the results of survey experiments we all are doing. To this end, we encourage more empirical research and publication (and archival) of results that probe the beliefs that drive current survey practice. The point is not to prove them wrong, but to assess where they are true and where they are not, and with what effect for our quantity of interest—public opinion.
Supplementary material
The supplementary material for this article can be found at https://doi.org/10.1017/psrm.2024.42.
To obtain replication material for this article, https://doi.org/10.7910/DVN/QQGCLX
Acknowledgements
Earlier versions of this article were presented at the Annual Meetings of the American Political Science Association, Montreal, 2022, the Midwest Political Science Association, Chicago, 2023, and the Texas Methods Group, Dallas, 2024, and at Nuffield College, Oxford. We thank Bethany Albertson, Michael Alvarez, Amanda Austin, Noah Bacine, Curtis Bram, Patrick Brandt, Siravam Cheruvu, Elias Cisneros, Scott Clifford, Matthew Graham, Natalie Jackson, Stephen Jessee, Garrett vande Kamp, Ryan Kennedy, Robert Luskin, Ryan Shandler, and Guy Whitten.
Competing interests
None


 Open access