Introduction
Addressing health inequalities has been a key part of recent UK health policy. However, despite a range of national and local initiatives, differences in mortality rates have widened over the last 20 years (Department of Health, 2003). The recent Marmot review ‘Fair Society, Healthy Lives’ illustrates a continuing mortality gradient of seven years and a 17-year gradient in disability-free life expectancy, when comparing the richest and poorest areas in England (The Marmot Review, 2010).
Tower Hamlets in east London is one of the ‘spearhead localities’. These are areas with the highest levels of social deprivation, identified with the aim of exploring methods of reducing inequalities in health outcomes between these areas and the rest of the United Kingdom. In the context of this wider agenda, we implemented a quality improvement project in Tower Hamlets. The project focussed on three common chronic diseases: coronary heart disease (CHD), type 2 diabetes mellitus and chronic obstructive pulmonary disease (COPD). We had two major improvement strategies. The first was to work with general practice teams to develop health equity audits by age, gender and ethnicity for each of the target conditions, and provide practice-based facilitation on the basis of the findings of the reports. The second was to promote patient engagement in self-management by linking disease management groups to the patient pathway.
The characteristics of the populations registered with individual practices within a primary care trust (PCT) show considerable variation by age, gender and ethnic group; hence, data aggregated at the level of a PCT can mask the variation that exists between practices, both in terms of demography and clinical performance (Field and Briggs, Reference Field and Briggs2001). Although the Quality and Outcomes Framework (QOF) pay for performance scheme provides feedback on achievement of clinical targets, it does not provide with disagregate results by age, gender or ethnicity, hence the presence of potentially remediable inequalities may be rendered invisible (Van Herck et al., Reference Van Herck, De Smedt, Annemans, Remmen, Rosenthal and Sermeus2010; Sigfrid et al., Reference Sigfrid, Turner, Crook and Ray2006; Campbell et al., Reference Campbell, Reeves, Kontopantelis, Middleton, Sibbald and Roland2007; Reference Campbell, Reeves, Kontopantelis, Sibbald and Roland2009).
The population of Tower Hamlets includes 53% from ethnic minority groups (Office for National Statistics, 2008). Over the last five years, the recording of self-reported ethnicity at practice level has been supported by financial incentives through PCT-administered local schemes to support needs assessment for specific services, and to monitor disease management by ethnicity. Self-reported ethnicity recording in chronic disease registers has now reached over 90% (Hull et al., Reference Hull, Rivas, Bobby, Boomla and Robson2009). This enabled the development of health equity audits with by ensuring robust figures for the three major ethnic groups in each practice population. This represents a significant advance, as studies that directly address health inequalities by ethnicity are lacking (Fiscella et al., Reference Fiscella, Franks, Gold and Clancy2000). This project builds on a programme of annual audits of the management of chronic disease run by the Clinical Effectiveness Group, and on previous quality improvement work in east London, which includes initiatives using guidelines and educational facilitation to improve care (Feder et al., Reference Feder, Griffiths, Highton, Eldridge, Spence and Southgate1995).
In this paper, we describe the development and implementation of practice equity audits, and an evaluation of changing inequalities over time, for the three project conditions in the PCTs of inner east London.
Methods
Clinical data collection
Routine clinical and demographic data were collected from practice computer databases, using Morbidity Information Query and Export Syntax (MIQUEST) software and EMIS Web (Egton Medical Information Systems Ltd, 2010) from 148 of the 151 general practices in the three PCTs of Newham, City and Hackney and Tower Hamlets, with a combined GP-registered population of 829 710 in mid-2008. Practice data covered more than 98% of the GP-registered population in the three PCTs. Cross-sectional data were extracted in April of every year between 2007 and 2010 for all patients on the CHD, diabetes and COPD registers. All data were anonymous and managed according to UK National Health Service (NHS) information governance requirements (NHS, 2011). Detailed data for audits in Tower Hamlets (the intervention PCT) were also collected through EMIS web. Patient-level data on socio-economic status or a marker of deprivation were not available at the time of the study.
Ethnicity data
Self-reported ethnicity was recorded at the practice during registration or routine consultation (Dreyer et al., Reference Dreyer, Hull, Aitken, Chesser and Yaqoob2009). Ethnic categories based on the options from the 2001 UK Census were condensed into five categories: White (British, Irish, other White), Black (Black African, Black Caribbean, Black British, other Black and mixed Black), South Asian (Bangladeshi, Pakistani, Indian, Sri Lankan, British Asian, other South Asian or mixed Asian), other (Chinese, Other ethnic groups, other mixed groups) and unknown. Owing to small numbers, mixed ethnicity groups were included in the parent ethnic minority category.
Chronic disease indicators
GP-computerised disease registers are based on Read codes. For each of the three chronic diseases, CHD (G3%), Diabetes (C10E% F%) and COPD (H3%), clinical indicators were chosen, with target values linked to the National Institute for Health and Clinical Excellence guidance for each condition. Each indicator was chosen to be measurable, modifiable by the practice team and clinically important. This report will focus on a core cluster of the clinical performance indicators: for CHD, cholesterol ⩽4 mmol/L, for diabetes, systolic blood pressure (SBP) <140 mmHg, and glycated haemoglobin level, (HbA1c) <7.5 and for COPD, proportion of patients still smoking.
Developing and displaying audit data for practices
The challenge for the project team was to summarise a large volume of data for practices in a simple format without loss of precision, and to enable comparison of data from each practice with the population mean for the locality. In addition, we wished to display values for each segment of the population (ethnicity, age group and gender), taking account of the variability of estimates drawn from practice populations of different sizes. Historically, data provided by the PCTs to visualise practice performance have been in the form of bar charts and simple tables. A more informative method of display is the control chart (Mohammed et al., Reference Mohammed, Cheng, Rouse and Marshall2001), which aims to separate out random variation from special cause variation, and takes account of practice population size (see Figure 1). However, control charts only display a single variable, and a large number of control charts can be confusing. We wanted to display all variables relating to one disease in a single chart in a concise data format. For example, comparing indicators for CHD by ethnicity creates eight indicators by each ethnic group (three groups) creating 24 pieces of information. Using advice from statisticians alongside practitioner feedback, we created a control chart for each indicator, and combined all indicators from each chronic disease as bars on a single chart (see Figure 1). Individual practice performance could be compared with the average in all practices in the PCT. For example, BP control in men with CHD was compared with the control in men on the CHD registers across all practices in Tower Hamlets.

Figure 1 Developing a composite bar chart of indicators for practice equity reports. HbA1c = haemoglobin A1c; SBP = systolic blood pressure.
These data were categorised into good performance (more than two standard deviations above the mean) or cause for alert (two standard deviations below the mean) or alarm (more than three standard deviations below the mean). This was conducted separately for ethnic group, gender and by age band for all indicators in a disease and combined on the composite bar charts. This enabled us to display all of the indicators for one disease on the same graph. The appendix provided is the one supplied here, and it can be found in the on-line reference. The reference should be abbreviated to (Health Equity Project, 2011).
Facilitation of audit reports with practices
Over the course of the three-year project, each of the 39 practices in Tower Hamlets received two health equity reports. Clinical facilitation was available to all practices on request. In the first year, facilitation visits were concentrated on the 10 practice teams where there was most evidence of inequalities, and where intervention would have the greatest impact on improving practice performance. Visits involved a GP clinical lead working alongside PCT specialist nurses trained in facilitation and techniques to encourage change. The formats of the visits were designed to identify areas of expressed difficulty, and to engage teams in finding solutions.
Statistical methods
Stata 10 (Statacorp, 2007) was used for analysing the repeated cross-sectional data from each disease register. We first examined changes in performance over time for the intervention and neighbouring PCTs. Further analyses examined changes in performance by age, gender and ethnicity. For multivariable analyses, we used logistic regression to examine the odds of achieving clinical targets by ethnic group, age and gender. All logistic regression analyses were adjusted for ethnicity, age and gender and clustered by practice (using the cluster option in Stata) to account for intra-practice correlation. People of White ethnicity were considered as the reference ethnic group for all regression analyses. Patients aged 65–74 years were considered as the reference category for comparisons between age groups being the largest group, and we hypothesised that they would be more likely to receive optimal care compared with both younger and older cohorts.
Results
Baseline evidence of inequalities
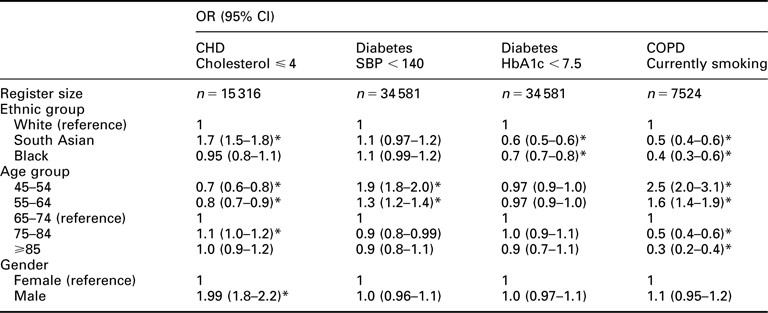
Baseline evidence, using data from the annual chronic disease audits for the three east London PCTs, shows inequalities in the delivery of chronic disease management by age, gender and ethnicity (Clinical Effectiveness Group; Mathur et al., Reference Mathur, Hull, Badrick and Robson2011). Table 1 illustrates that significant differences in chronic disease management are present for several groups across the three PCTs. In the CHD register (n = 15 316), South Asian patients are 50% more likely to achieve a target of cholesterol ⩽4 than either White or Black groups; male patients have increased odds of achieving this target, whereas younger patients have decreased odds compared with older groups. In the diabetic register (n = 34 581), South Asian and Black groups are less likely to achieve HbA1c control, whereas younger patients have higher odds of achieving the BP target. In the COPD register (n = 7524), both South Asian and Black groups have around 40% lower odds of being current smokers than White groups.
Table 1 Evidence for inequalities by ethnicity, age group and gender for the three project chronic diseases; inner east London GP practice data 2007 (total GP register size 817 927)a

OR = odds ratio; CI = confidence interval; CHD = coronary heart disease; SBP = blood pressure; HbA1C = haemoglobin A1c; COPD = chronic obstructive pulmonary disease; PCT = primary care trust.
ORs are adjusted for ethnicity, age, gender and PCT and clustered by practice.
*Indicates values significantly different from the reference value for the group.
aPCTs include Tower Hamlets, Newham and City and Hackney.
Reviewing health equity reports with GP practices
We provided support to the practices using cardiovascular nurse specialists from the locality. The practice teams welcomed the opportunity to identify inequalities in their practice populations, although the reports were considered complex to understand without guidance. In the course of facilitation visits, the following clinical concerns were most commonly voiced:
• Inexperience with more intensive BP and lipid-lowering management.
• Problems implementing structured patient recall, particularly with groups spending time in Bangladesh.
• Poor access to self-management groups, which provide courses in lifestyle change.
We collected written feedback from most practice visits. The second round of audit reports responded to practice feedback, and provided a more recent data set, along with a simplification of the data display. During the course of the project, we found a consistent view that PCT-level charts of age, gender and ethnic group differences were understandable and useful, but practice-level data were more difficult to interpret because of small numbers.
Assessing the impact of health equity reports
Over the period of the project, there was steady improvement in the majority of chronic disease indicators across all practices in east London. These changes can be seen both in the targeted practices in Tower Hamlets and the adjacent PCTs. Table 2 illustrates the changes in percentage achievement of each target during the course of the project for the three PCT populations on the chronic disease registers. For CHD, Tower Hamlets had smaller levels of improvement to the adjacent PCTs, although starting from a higher baseline. In the diabetic register, absolute changes were greatest in Tower Hamlets for the BP and HbA1c targets. Smoking rates among COPD patients decreased by a small but similar amount across the whole study population.
Table 2 Crude changes in chronic disease indicators in east London by PCT 2007–2010

PCT = primary care trust; CHD = coronary heart disease; SBP = systolic blood pressure; HbA1c = haemoglobin A1c; COPD = chronic obstructive pulmonary disease.
aAdjacent PCTs of Newham and City and Hackney.
The focus of our project was on the reduction of differences between groups in the intervention PCTs of Tower Hamlets. This is summarised in Table 3, which shows achievement of target values for each disease for 2007 and 2010. A reduction in health inequalities is indicated by odds ratios shifting towards the value for the reference group. An example of this is illustrated by the >85-year-old diabetic group, which shows a reduction in difference for achieving target BP control compared with the reference group over time. Most of the other groups show a persistence of inequalities, for example in the CHD register half as many women are likely to achieve a cholesterol value of ⩽4 compared with men in both 2007 and 2010. Some groups show a widening of inequalities, for example, in the CHD register, for 2010, South Asians have increased from 1.9 to 2.4 times as likely as White groups to have a cholesterol value ⩽4. Smoking rates in COPD show an increasing disparity between the White and other ethnic groups. The fall off in smoking rates with age reflects the differential early death rates in this group.
Table 3 Change in disease indicators, and inequalities between groups, for Tower Hamlets 2007–2010

OR = odds ratio; CI = confidence interval; CHD = coronary heart disease; SBP = systolic blood pressure; HbA1c = haemoglobin A1c; COPD = chronic obstructive pulmonary disease.
ORs mutually adjusted for ethnicity, age, gender and clustering by practice.
*Denotes OR, which is significantly different from the reference group value.
We then examined differences by ethnicity in the four disease indicator in Tower Hamlets, and to put these into context, we show these results alongside data from adjacent PCTs in east London. We found that differences by ethnicity did not change over time. Figure 2 illustrates the presence of persistent differences by ethnicity but in the context of overall improvement. For cholesterol control among CHD patients, the improvements ran in parallel for each of the three major ethnic groups in east London, and there was no convergence or ‘catch up’ between groups over time (Figure 2a). For hypertension, there are increasing differences in all PCTs (Figure 2b). For HbA1c control in the diabetic population, we see a convergence or reduction in differences by ethnic group for the neighbouring PCTs, whereas in Tower Hamlets we see overall improvement, but no reduction in inequalities (Figure 2c).

Figure 2 (a) Proportion of CHD patients with cholesterol ⩽4 mmol/L by ethnic group for Tower Hamlets compared with adjacent PCTs 2007–2010. (b) Proportion of diabetic patients with SBP <140 mmHg by ethnic group for Tower Hamlets compared with adjacent PCTs 2007–2010. (c) Proportion of diabetic patients with HbA1c ⩽ 7.4 by ethnic group for Tower Hamlets compared with adjacent PCTs 2007–2010. CHD = coronary heart disease; PCT = primary care trust; SBP = systolic blood pressure; HbA1c = haemoglobin A1c.
Discussion
Feasibility of health equity audits
In this quality improvement project, we have been able to implement health equity audits, but we have not able to demonstrate consistent changes in health inequalities. This project demonstrates that it is feasible to produce practice equity audits on the basis of the data collected from the routine clinical care of patients with common chronic diseases in general practice. Identifying differences in chronic disease management by age, ethnicity and gender is the first step to developing and implementing strategies to reduce some of the observed inequalities. Reports were received positively by practices, which were keen to reflect on their data and consider strategies for change; this process was aided by facilitation. There is good evidence that guidelines or audits delivered on their own have little impact on performance, whereas the addition of facilitation tailored to the educational or organisational needs of the practice has a greater impact on clinical performance (Miller and Archer, Reference Miller and Archer2007; Feder et al., Reference Feder, Eccles, Grol, Griffiths and Grimshaw1999; Lugtenberg et al., Reference Lugtenberg, Burgers and Westert2009; Phillips et al., Reference Phillips, Pearce, Hall, Travaglia, De Lusignan, Love and Kljakovic2010).
Public health impact
Between 2007 and 2010, there has been steady improvement in the majority of chronic disease indicators across the entire general practice population in east London, both in the targeted practices in Tower Hamlets and adjacent PCTs. We observed a welcome reduction in inequalities for older people in CHD and diabetes management (Table 3).
When considering initiatives to improve quality, it is important to consider contextual information on the absolute performance in the target PCTs before the intervention. Using data on QOF performance for 2010 for the 31 PCTs in London, we find that Tower Hamlets (the target PCT) was in the top three for target achievement of cholesterol control among patients with CHD and for BP control among diabetics. In contrast, all three of the study PCTs fall among the bottom five London PCTs for the proportion of diabetics with an HBA1c value ⩽8 (NHS, 2010).
In spite of such general improvement, differences in target achievement by ethnicity remain entrenched, and are often invisible to practising clinicians. Figure 2 illustrates the presence of persistent differences by ethnicity, in the context of overall improvement. These differences were often unexpected by clinicians, for example, South Asian patients doing best for cholesterol management and White groups doing worst for smoking cessation.
Strengths and weaknesses of the study
This study makes use of routinely collected data, which enables us to look at large populations, but depends on the accuracy of coding in multiple practice sites. Patient-level data on socio-economic status were not available at the time of the study. Although inner east London practices have high levels of deprivation, including a marker for deprivation would have enabled us to evaluate whether some observed differences between groups could have been explained by variances in deprivation. The health equity audits were part of a larger development project. The scale and broad scope of the project meant that, in the absence of a randomised intervention trial, the practice health equity audits were unlikely to demonstrate a clear impact among the ‘noise’ of a changing NHS and a culture of multiple local improvement initiatives. Other quality improvement projects in similar inner city areas have targeted highly specific interventions, and have required additional funding and structured organisational support to achieve results that are sustainable (Cockmann et al., Reference Cockmann, Dawson, Mathur and Hull2011)
Importance of ethnicity recording in primary care settings
This project actively supported self-reported ethnicity recording at practice level. East London currently has the highest level of ethnicity recording in the United Kingdom (Hull et al., Reference Hull, Mathur, Badrick, Robson and Boomla2011), with over 95% recording in chronic disease registers and 80% (in 2011) in the whole population. This provides a unique resource for monitoring inequalities in service delivery over time, as well as for identifying commissioning need and opportunity (Goddard and Smith, Reference Goddard and Smith2001). Building on the project equity reports, east London commissioners have incorporated the analysis into the Joint Strategic Needs Assessment, and are developing an ‘inequalities dashboard’ to track persisting inequalities in chronic disease management in primary care.
All UK commissioning organisations have responsibilities to reduce health inequalities, and all require robust ethnicity recording in primary care settings to support this role. It is surprising that the UK QOF, the largest experiment in pay for performance in Europe, takes no account of differences by age, gender or ethnicity within the clinical indicator framework. The introduction of ethnicity recording would be a simple way to provide practices and commissioners with a framework for examining performance alongside a tool to monitor health inequalities (Schofield et al., Reference Schofield, Saka and Ashworth2011).
In this project, we have succeeded in highlighting and tracking existing health inequalities both to primary care teams and to commissioning organisations. Effective strategies for reduction require further action both within and beyond the health sector.
Key project lessons:
(1) Differences by age, gender and ethnic group can be demonstrated in major indices of chronic disease management.
(2) A balance between a rigorous, complete analysis and a brief simple report is needed to reach the maximum practice audience.
(3) Monitoring inequalities by age, gender and ethnic group in chronic disease management should be a priority for commissioning organisations.
Acknowledgements
The authors thank the staff at the Clinical Effectiveness Group for collating the practice data. They also thank the Tower Hamlets PCT ethnicity working group, K. Boomla, M. Caulfield, A. Livingstone and M. Falshaw for developing a local enhanced service to promote ethnicity recording. Contributions of authors: S.H. and J.R. conceived the manuscript, E.B. and R.M. conducted the data analysis. E.B. and S.H. composed the document. All authors contributed to revising and editing the document. Funding: This work was supported by the Health Foundation and by partnership support from NHS Tower Hamlets and Social Action for Health. All authors are independent from the funding body.
Appendix: Example of a health equity report for a general practice
Health Equity: how are you doing?
Reducing Health Inequalities in East London
xxxxxxx Practice Network 4
The Health Equity project is based in the Clinical Effectiveness Group.
This Health Equity report aims to help you identify any inequalities of care by age, gender and ethnic group for people with CHD, COPD and diabetes in your practice.
This is the second report, and this year we have also included information on social deprivation.
These reports will enable practices to compare their performance on key indicators for three common chronic conditions with the average for your Network and for Tower Hamlets as a whole.
Data for this report were extracted on 31 November 2009
Purpose of the Health Equity Report
The purpose of the Health Equity Report is to show how each individual practice within Tower Hamlets is meeting targets for diabetes, cardiovascular disease and COPD. We have used key disease indicators to show how management is equitable for older and younger patients, for men and women and for different ethnic groups. We aim to show how your practice is doing compared with the rest of Tower Hamlets and with your network.
For the first time this year, we were able to use EMIS web for the searches. EMIS web has a facility, which allows us to include data on deprivation as well as age, gender and ethnicity. Deprivation is based on Townsend scores calculated for each individual (on the basis of census data amalgamated from super output areas – about 100–150 households) on the chronic disease register. Tower Hamlets is in the top six most deprived localities in England, with Townsend scores ranging from −4 to +9, where 0 is the national average score, and +9 represents high levels of deprivation.
What does the equity audit include?
• For each disease register, we present summary information for Tower Hamlets. We present odds ratios highlighting differences in the management of key indicators by age group, gender, ethnicity and deprivation.
• Second, we show individual practice-level data for the indicators in each of the three chronic diseases. This table compares the practices performance with that of the network it belongs to and Tower Hamlets as a whole.
• The tables are followed by a single graph, which focuses on a small cluster of indicators analysed by ethnic group.
Why is this report relevant to your practice?
• Targets are different to QOF – for example, we use a cholesterol threshold of 4 instead of 5 for coronary heart disease.
• We show Network and PCT comparisons to complement the information you will get from the primary care investment programme ‘dashboards’.
• Detailed ethnicity analysis enables your practice to see how you perform in comparison with other practices in the borough.
• We hope the report can help you to identify any area of difference or inequity in management between groups, and provide a basis for discussion and management change, which may improve practice performance.
Diabetes indicators
Summary Table for Tower Hamlets: Number of people on Diabetes register in Tower Hamlets: 11 571

What does this mean?
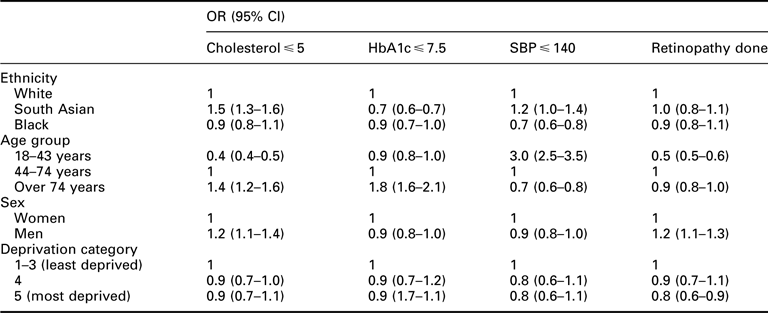
Using ethnicity as an example, if we look at HbA1c levels, we see that compared with White people, South Asian people are 30% less likely to have an HbA1c <7.5 and Black people are 10% less likely than White people to achieve this level. Similar trends can be seen for the other indicators.
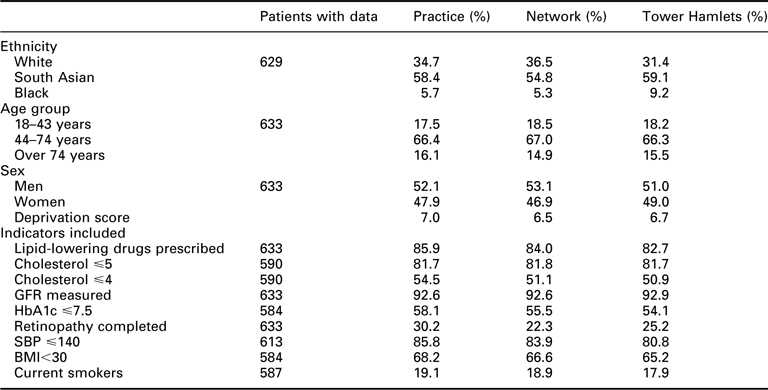
Summary Table for Practice: Number of patients on practice register: 633

Comparison of practice performance with PCT average for selected diabetes indicators
CHD indicators
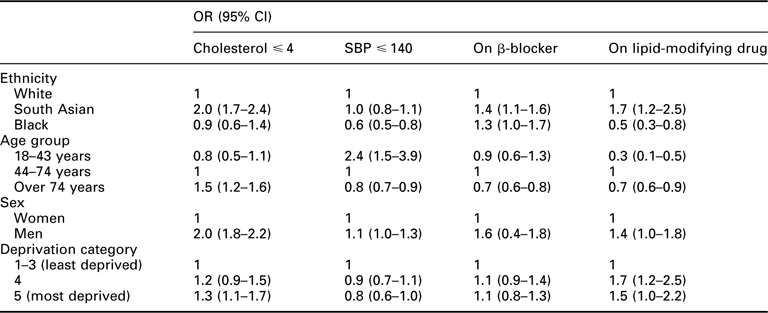
Summary Table for Tower Hamlets: Number of people on CHD register in Tower Hamlets: 4610

What does this mean?
Using ethnicity as an example, if we look at cholesterol levels, we see that compared with White people, South Asian people are twice as likely to have a cholesterol <5, whereas Black people are slightly less likely (0.9) than White people to achieve this level. Similar trends can be seen for the other indicators.
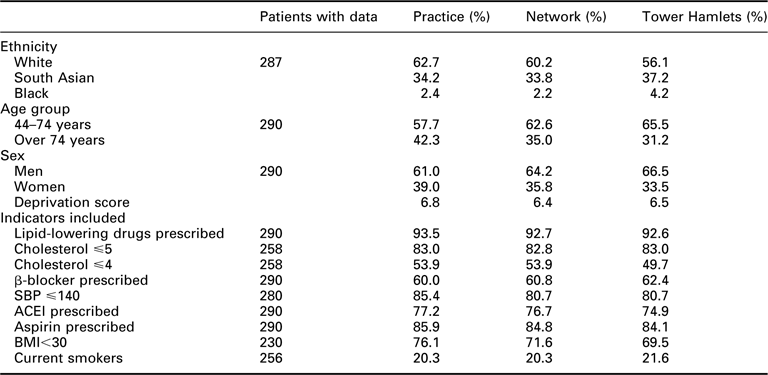
Summary Table for Practice: Number of patients on practice register: 290

Comparison of practice performance with PCT average for selected CHD indicators
COPD indicators
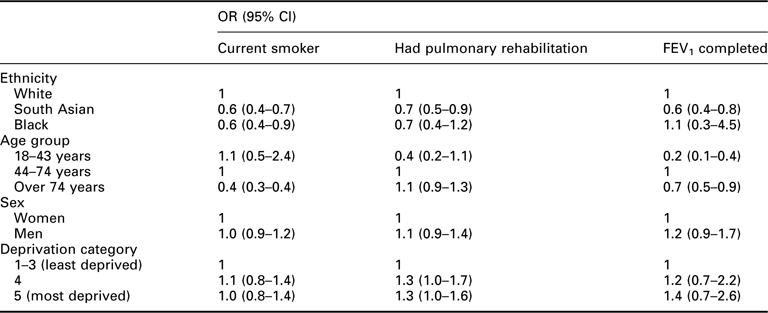
Summary Table for Tower Hamlets: Number of people on COPD register in Tower Hamlets: 2806

What does this mean?
Using ethnicity as an example, if we look at smoking rates, we see that compared with White people, both South Asian people and Black people are 40% less likely to be current smokers. Similar trends can be seen for the other indicators.
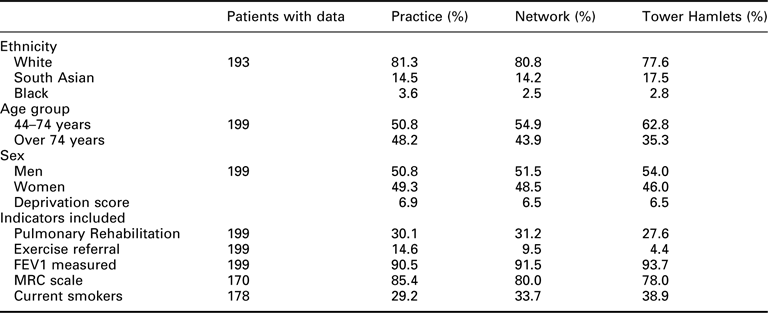
Comparison of practice performance with PCT average for selected COPD indicators
Summary Table for Practice: Number of patients on practice register: 199

What can be done to improve health inequalities?
From our first round of equity audit report practice facilitation, we received feedback on what kind of support practices need and have followed up on those suggestions. Some of the key issues highlighted were:
• Network/practice-level facilitation of the audit report achieved through working closely with CVD specialist nurses and diabetic nurses
• IT template/prompt support form CEG
• Internal practice audit
• Use of case studies in practice discussion.
What to expect next
We hope that the report will stimulate discussion, and act as a trigger to change your clinical management where necessary. Our team will attend Network PLT sessions to present and discuss the health equity audit report and the support provided by the CVD nurses for both the CVD LES9 and the CVD care package. Together with the nurses, we will discuss how CVD care might develop in the future and the support available.
Please contact the team on 020 7882 2553 or e-mail Ellena Badrick at e.badrick@qmul.ac.uk to discuss any immediate queries about the audit or how the report was developed. Contact Sharmin Shajahan at s.shajahan@qmul.ac.uk for any general queries about the Health Equity Project.
Health Equity Project
Centre for Primary Care and Public Health
Blizard Institute
Website: http://ceg.ihse.qmul.ac.uk

