Stigmatisation of psychiatric illness has been evident for as long as illness has existed (Reference BhugraBhugra, 1989). Despite efforts to try to change attitudes by both individuals and by groups such as Mind and the World Health Organization, it still exists (Reference CrispCrisp, 1999).
With this in mind, on 7 October 1998 the Royal College of Psychiatrists launched a 5-year campaign entitled ‘Changing Minds: Every Family in the Land’, which was aimed at trying to change this ongoing situation (Reference Cowan and HartCowan & Hart, 1998).
The College commissioned a study by the Office for National Statistics to look at the attitudes of a large random group of the public (Reference Crisp, Gelder and RixCrisp et al, 2000). Two groups where the attitudes are not fully clear are those of medical students and doctors.
To this end it was decided to look at the attitudes and opinions of these two groups as a baseline for future work in order to try to reduce stigma.
Method
An anonymous questionnaire based on the six target diagnoses set out in the College campaign was devised. A questionnaire was preferred because it was less intrusive into the work schedules of doctors and eliminated any possibility of observer bias. We used the same basic questions as seen in the national survey (Reference Crisp, Gelder and RixCrisp et al, 2000). As in the original paper, a five-point scale from ‘strongly agree’ to ‘strongly disagree’ was used.
Initially we piloted the questionnaire on a sample that was not to be included in the final trial. This was followed by brief amendments to the wording of the questions, as influenced by the comments received. The final version was passed before the local ethical committee as well as the local medical advisory panel on research. Once approval was gained, it was decided that in order to minimise selection bias, no specific sample should be selected.
We included all medical students in years 1-5 (832) as well as all permanent doctors of all grades and specialities (441) working at the selected London teaching hospital and medical school. We excluded any doctors not on permanent contracts and on intercalated BSc courses. We attempted to minimise our response bias by sending out the questionnaire on two separate occasions to the entire group. Accompanying the questionnaire was a covering letter explaining the purpose of the study. A 4-week gap was left between the two postings.
The questionnaire was returned in a self-labelled envelope via internal mail. Once the replies were received they were assessed using standard statistical packages (SPSS Version 9 and Microsoft Excel 97) to provide a set of descriptive results.
The combined data were separated out into various groups in order to look at the difference in attitude with experience gained during a medical career as well as between groups of specialities. The following groups were looked at: qualified doctors, which were broken down further into senior and junior doctors and medical and surgical specialities; and medical students, subdivided into clinical and preclinical students. We also looked at those people with and without prior knowledge of psychiatric patients.
Results
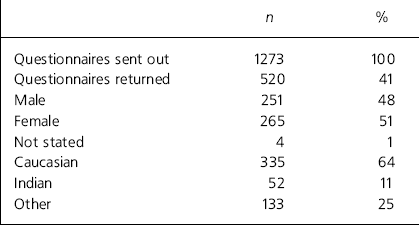
Table 1 highlights the breakdown of the demographic data received from the 520 returns from the original 1273 questionnaires sent out.
Table 1. Demographics of respondents

| n | % | |
|---|---|---|
| Questionnaires sent out | 1273 | 100 |
| Questionnaires returned | 520 | 41 |
| Male | 251 | 48 |
| Female | 265 | 51 |
| Not stated | 4 | 1 |
| Caucasian | 335 | 64 |
| Indian | 52 | 11 |
| Other | 133 | 25 |
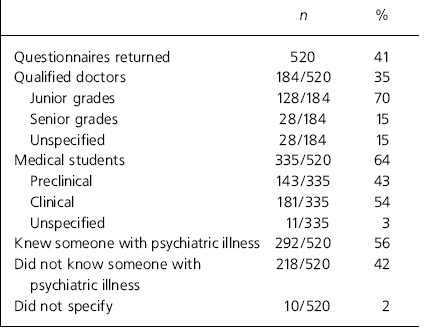
Table 2 summaries the response rates when broken down into qualified doctors and medical students. It also shows the proportions of respondents with and without prior knowledge of someone with a psychiatric illness.
Table 2. Replies obtained from original mailing of 1273 questionnaires

| n | % | |
|---|---|---|
| Questionnaires returned | 520 | 41 |
| Qualified doctors | 184/520 | 35 |
| Junior grades | 128/184 | 70 |
| Senior grades | 28/184 | 15 |
| Unspecified | 28/184 | 15 |
| Medical students | 335/520 | 64 |
| Preclinical | 143/335 | 43 |
| Clinical | 181/335 | 54 |
| Unspecified | 11/335 | 3 |
| Knew someone with psychiatric illness | 292/520 | 56 |
| Did not know someone with psychiatric illness | 218/520 | 42 |
| Did not specify | 10/520 | 2 |
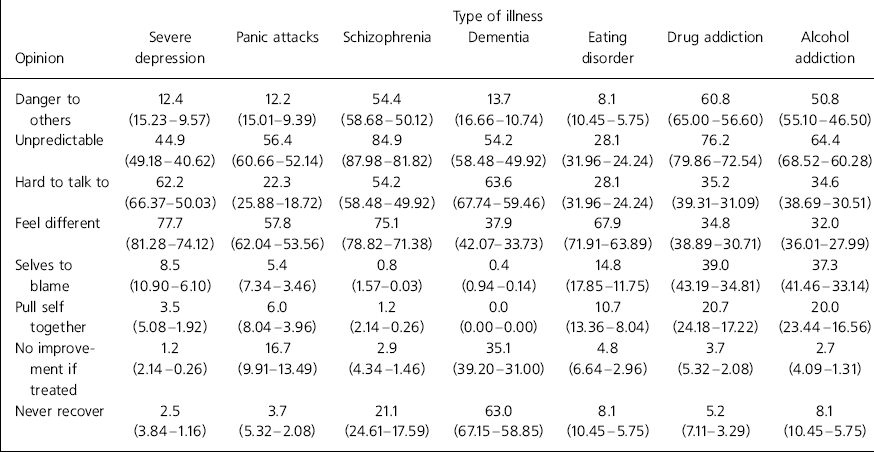
Table 3 gives a summary of the 520 results received. Respondents, as with the original survey on the general public (Reference Crisp, Gelder and RixCrisp et al, 2000), were classed as having negative opinions if they scored either of the two points on a five-point scale on the negative side of the midpoint (i.e. ‘strongly agree’ or ‘agree’). The table highlights that the most negative attitudes were directed at schizophrenia, drug addiction and alcohol addiction. More than 50% felt that people with any of these conditions were dangerous and unpredictable. More often doctors and medical students were less likely to blame the individual and, with the exception of dementia where there appears to be a general pessimism despite recent symptomatic advances, felt that the conditions listed would improve and the individual would eventually recover. There was also the feeling among more than 50% of the respondents that people with depression, dementia and schizophrenia were difficult to talk to.
Table 3. Combined data on the attitudes of doctors and medical students to mental illness by types of illness: percentage of respondents holding negative attitudes (95% CI)

| Opinion | Severe depression | Panic attacks | Schizophrenia | Type of illness Dementia | Eating disorder | Drug addiction | Alcohol addiction |
|---|---|---|---|---|---|---|---|
| Danger to others | 12.4 | 12.2 | 54.4 | 13.7 | 8.1 | 60.8 | 50.8 |
| (15.23-9.57) | (15.01-9.39) | (58.68-50.12) | (16.66-10.74) | (10.45-5.75) | (65.00-56.60) | (55.10-46.50) | |
| Unpredictable | 44.9 | 56.4 | 84.9 | 54.2 | 28.1 | 76.2 | 64.4 |
| (49.18-40.62) | (60.66-52.14) | (87.98-81.82) | (58.48-49.92) | (31.96-24.24) | (79.86-72.54) | (68.52-60.28) | |
| Hard to talk to | 62.2 | 22.3 | 54.2 | 63.6 | 28.1 | 35.2 | 34.6 |
| (66.37-50.03) | (25.88-18.72) | (58.48-49.92) | (67.74-59.46) | (31.96-24.24) | (39.31-31.09) | (38.69-30.51) | |
| Feel different | 77.7 | 57.8 | 75.1 | 37.9 | 67.9 | 34.8 | 32.0 |
| (81.28-74.12) | (62.04-53.56) | (78.82-71.38) | (42.07-33.73) | (71.91-63.89) | (38.89-30.71) | (36.01-27.99) | |
| Selves to blame | 8.5 | 5.4 | 0.8 | 0.4 | 14.8 | 39.0 | 37.3 |
| (10.90-6.10) | (7.34-3.46) | (1.57-0.03) | (0.94-0.14) | (17.85-11.75) | (43.19-34.81) | (41.46-33.14) | |
| Pull self together | 3.5 | 6.0 | 1.2 | 0.0 | 10.7 | 20.7 | 20.0 |
| (5.08-1.92) | (8.04-3.96) | (2.14-0.26) | (0.00-0.00) | (13.36-8.04) | (24.18-17.22) | (23.44-16.56) | |
| No improvement if treated | 1.2 | 16.7 | 2.9 | 35.1 | 4.8 | 3.7 | 2.7 |
| (2.14-0.26) | (9.91-13.49) | (4.34-1.46) | (39.20-31.00) | (6.64-2.96) | (5.32-2.08) | (4.09-1.31) | |
| Never recover | 2.5 | 3.7 | 21.1 | 63.0 | 8.1 | 5.2 | 8.1 |
| (3.84-1.16) | (5.32-2.08) | (24.61-17.59) | (67.15-58.85) | (10.45-5.75) | (7.11-3.29) | (10.45-5.75) |
Differences were seen also when comparing doctors at different points in their training. Preclinical students showed attitudes closer to that of the general population (Reference Crisp, Gelder and RixCrisp et al, 2000), whereas clinical students showed little difference in attitudes to that of junior doctors. Senior doctors appeared to be much less stigmatising and more optimistic towards outcome than all other groups.
When looking for differences between medical and surgical specialities, no significant difference could be found. All of the groups showed a similar pattern with regard to negative attitudes, as highlighted above.
Discussion
The combined data would suggest, as in the survey on the general public (Reference Crisp, Gelder and RixCrisp et al, 2000), that doctors and medical students tend to share the same negative opinions. Specifically, this is related to people with schizophrenia, drug addiction and alcohol addiction.
An area of contrast is seen with regard to the general air of optimism when considering the issue of treatability. When compared with the general population survey, there appear to be lower values for ‘resistance to treatment’ as well as ‘no recovery’. Whether this is due to an involvement by the medical profession with the treatment process in general or just a specific innate optimism towards the treatability of conditions in general remains unclear.
Another area in which there was a consistent difference compared with the general population survey was that of attributing blame. For all the different diagnostic criteria there appear to be lower values. It could be suggested that the overall better understanding by the medical profession of the pathological process of disease may lead to a lower attribution rate with regard to blame, compared with those without this understanding.
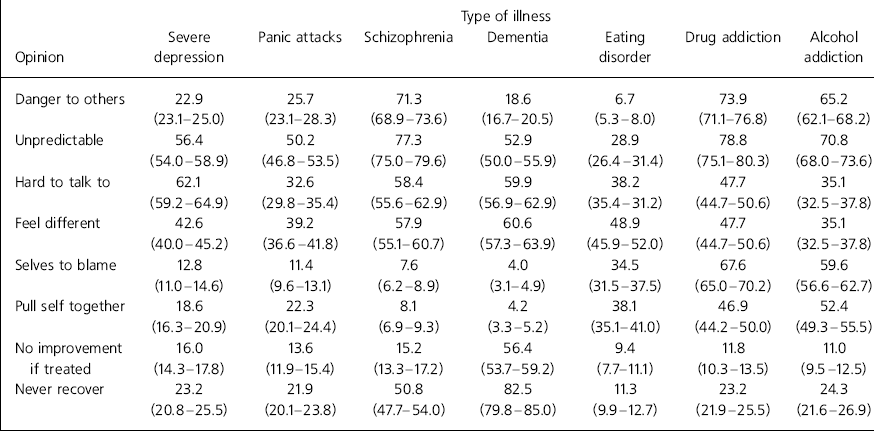
A remaining concern is that doctors still find it difficult to talk to patients with psychiatric disorder. There was also consistently more stigma on the part of doctors with regard to patients feeling different from themselves, which is an indicator of their empathy compared with the general study. This may lead to an unwillingness to approach and interact with people with these conditions. This in turn may lead to a concern for service provision on general wards by those doctors when looking after patients with concurrent physical and psychiatric illness. We include a copy of the original table (Table 4) to allow this comparison to be made (Reference Crisp, Gelder and RixCrisp et al, 2000).
Table 4. Attitudes to mental illness (with 95% CIs) as reproduced from the Office for National Statistics survey (Reference Crisp, Gelder and RixCrisp et al, 2000)

| Opinion | Severe depression | Panic attacks | Schizophrenia | Type of illness Dementia | Eating disorder | Drug addiction | Alcohol addiction |
|---|---|---|---|---|---|---|---|
| Danger to others | 22.9 | 25.7 | 71.3 | 18.6 | 6.7 | 73.9 | 65.2 |
| (23.1-25.0) | (23.1-28.3) | (68.9-73.6) | (16.7-20.5) | (5.3-8.0) | (71.1-76.8) | (62.1-68.2) | |
| Unpredictable | 56.4 | 50.2 | 77.3 | 52.9 | 28.9 | 78.8 | 70.8 |
| (54.0-58.9) | (46.8-53.5) | (75.0-79.6) | (50.0-55.9) | (26.4-31.4) | (75.1-80.3) | (68.0-73.6) | |
| Hard to talk to | 62.1 | 32.6 | 58.4 | 59.9 | 38.2 | 47.7 | 35.1 |
| (59.2-64.9) | (29.8-35.4) | (55.6-62.9) | (56.9-62.9) | (35.4-31.2) | (44.7-50.6) | (32.5-37.8) | |
| Feel different | 42.6 | 39.2 | 57.9 | 60.6 | 48.9 | 47.7 | 35.1 |
| (40.0-45.2) | (36.6-41.8) | (55.1-60.7) | (57.3-63.9) | (45.9-52.0) | (44.7-50.6) | (32.5-37.8) | |
| Selves to blame | 12.8 | 11.4 | 7.6 | 4.0 | 34.5 | 67.6 | 59.6 |
| (11.0-14.6) | (9.6-13.1) | (6.2-8.9) | (3.1-4.9) | (31.5-37.5) | (65.0-70.2) | (56.6-62.7) | |
| Pull self together | 18.6 | 22.3 | 8.1 | 4.2 | 38.1 | 46.9 | 52.4 |
| (16.3-20.9) | (20.1-24.4) | (6.9-9.3) | (3.3-5.2) | (35.1-41.0) | (44.2-50.0) | (49.3-55.5) | |
| No improvement if treated | 16.0 | 13.6 | 15.2 | 56.4 | 9.4 | 11.8 | 11.0 |
| (14.3-17.8) | (11.9-15.4) | (13.3-17.2) | (53.7-59.2) | (7.7-11.1) | (10.3-13.5) | (9.5-12.5) | |
| Never recover | 23.2 | 21.9 | 50.8 | 82.5 | 11.3 | 23.2 | 24.3 |
| (20.8-25.5) | (20.1-23.8) | (47.7-54.0) | (79.8-85.0) | (9.9-12.7) | (21.9-25.5) | (21.6-26.9) |
The overall comparisons between medical students and doctors suggest that there is no great difference in attitudes. When looking at the data between preclinical and clinical students, however, several areas of difference become apparent. Clinical medical students show values closer to qualified doctors, suggesting a shift in attitudes as the time spent in medical education progresses. This is borne out further with the continuing shift in attitude that occurs in the transition from junior to senior doctors. The change would suggest that as time is passed in medical careers a progressive change in attitude occurs. Less blame is attributed and an apparently more realistic attitude is taken.
Previous studies, including one by Singh et al in 1988, showed that good educational methods could decrease stigma. Other studies, however, have shown that favourable attitudes do not persist 1 year after work commences (Reference Sivakumar, Wilkinson and TooneSivakumar et al, 1986). This is in contrast to our findings. The lower number of replies received by the higher grades may have introduced a bias towards those with a more positive attitude already. Clearly this is an area that needs further investigation.
The project was designed with the original paper from the Royal College Of Psychiatrists' campaign in mind (Reference Crisp, Gelder and RixCrisp et al, 2000). To this extent we had tried to keep it as close as possible to the original in terms of the questions asked. Because of this, some of the criticisms of the questionnaire could not be changed because this would move it away from the original. This feedback highlighted points such as whether patients with schizophrenia were in the acute phase or treated phase when answering questions on dangerousness and unpredictability. This may have led to some confusion and possible ambiguity. Despite this, the majority of questionnaires were completed without problem.
Overall, the aim of the study was to provide a set of data to add to any future work on stigma as part of the College campaign. This specific group is currently being looked at by the College itself, but in smaller groups. We feel the information gathered here will be of use. In accepting that the low percentage of quesionnaires returned was possibly a result of lack of interest in the topic by a majority of senior doctors engrossed in their own busy lives (i.e. the higher the seniority, the more pressures on their time). We feel that the high number of questionnaires received provides meaningful information that may be used either in later comparisons or added to other collected data. This is why we tried to keep to the College parameters and we feel that this study goes some way to providing a starting point for further work in this area.
Acknowledgements
Thanks to Professor Crisp for his initial advice and direction in choosing this project and also to the people at Office Matters, Redhill, for help with packaging some of the questionnaires. Thanks also go to the secretarial staff working for Dr Checinski, who helped with administration of the project.


eLetters
No eLetters have been published for this article.