Taiwan has been an ageing society since 1993( Reference Lin 1 , Reference Wang and Tsay 2 ). People older than 65 years constituted 10·8 % of the total population in 2011( 3 ). The combined effect of the ageing post-war baby boomers in Taiwan and the low birth rate( Reference Hanson 4 , 5 ) is expected to increase the ageing rate of the population in the coming years; it is estimated that one-third of the Taiwanese population will be aged 65 years or older by 2043( 6 ). Data from 1996 to 2000 showed that the incidence of osteoporosis in Taiwan was 225 cases per 100 000 men aged >65 years and 505 cases per 100 000 women aged >65 years( Reference Chie, Yang and Liu 7 ); these incidence rates are comparable to those of their US counterparts and are higher than those in other Asian populations.
Osteoporosis is a global health concern, the incidence of which is increasing significantly with increasing life expectancy and the rise in the global population( Reference Gallagher, Riggs and Eisman 8 ). The osteoporotic process commences or accelerates in women soon after menopause; however, this phenomenon is not an indicator that the process is normal or physiological( Reference Nordin, MacGregor and Smith 9 ). The loss of postmenopausal bone mass depends largely on chronological age and time since the onset of menopause( Reference Rico, Revilla and Villa 10 ). The effect of body weight on bone is two-sided. Obesity is likely to adversely affect bone health( Reference Beresford, Bennett and Devlin 11 , Reference Cao 12 ). Moreover, underweight people tend to be easily susceptible to osteopenia( Reference Szklarska and Lipowicz 13 ). A positive association exists between BMI and bone mineral density( Reference Dytfeld, Ignaszak-Szczepaniak and Gowin 14 ).
Eating out frequently leads to insufficient dietary intake of nutrients such as Ca( Reference Zhai, Wang and Du 15 ). Because of rapid economic development and structural changes in the traditional diet in Taiwan( Reference Chen 16 ), the frequency with which modern nationals eat out is increasing. A 1996 survey revealed that 48 and 34 % of Taiwanese citizens eat out at lunchtime on weekdays and weekends, respectively( Reference Li 17 ). Ca is the major component of bones( Reference Vallet-Regi and González-Calbet 18 ). The typical Western diet consists of milk, cheese and bread, whereas rice is the primary component of a typical Eastern meal( Reference Yang and Zhang 19 ), and when Taiwanese people eat out, rice and starch-based foods remain the mainstay. No study has yet analysed Taiwanese citizens for their eating-out behaviour. Using a database derived from the 2004–2008 Nutrition and Health Survey in Taiwan (NAHSIT)( 20 ), the present study investigated the relationship among eating-out behaviour, related non-nutritional factors and incidence of osteopenia in Taiwanese nationals.
Materials and methods
Data sampling
The present study employed a cross-sectional research design and performed secondary data analyses. Data were collected from the 2004–2008 NAHSIT database mentioned above. First, data of 3670 individuals, including 862 children and 2808 adults, were drawn from the original databank, of which the data of 1140 (567 men and 573 women) adults who had been evaluated with dual-energy X-ray absorptiometry (Lunar Prodigy instrument; GE Healthcare, Milwaukee, WI, USA) were included. The data were analysed through descriptive and inferential statistics to determine the association of osteopenia with the frequency of eating out, demographic variables (i.e. age, sex, level of education, marital status and place of birth), BMI, waist circumference and food consumption. Using 24 h dietary recalls and dietary records and questionnaire data as the research foundation, the present study retrieved the test data of individuals who underwent dual-energy X-ray absorptiometry examinations for measurement of bone mineral density. We used the 2003 WHO criteria to classify bone mineral density as osteoporosis (T-score≤−2·5), osteopenia (T-score=−2·5 to 1·0) or normal (T-score≥−1·0). Twenty of the study participants were diagnosed with osteopenia. Both osteoporosis and osteopenia (T-score<−1·0) were collectively treated as the dependent variable, and the independent variables were the main meal type (breakfast, lunch or dinner), eating-out frequency per week (not more than six times weekly was termed ‘infrequent’ and more than seven times weekly was termed ‘frequent’), age (<40 years and >50 years; ages between 40 and 50 years were omitted due to the transition of menopausal period for females), sex, level of education, marital status, BMI (as defined by the Ministry of Health and Welfare, Taiwan; BMI<18·5 kg/m2 was categorized as underweight, BMI=18·5–24·0 kg/m2 as normal, BMI=24·0–27·0 kg/m2 as overweight and BMI>27·0 kg/m2 as obese), waist circumference (men and women with waist circumference ≥90 cm and ≥80 cm, respectively, were defined as obese( 21 )), individual monthly income and place of birth. The differences in the definition of underweight, normal, overweight and obese between Asian and Caucasian populations are due to the interaction of race and dietary patterns( Reference Pan, Dixon and Himburg 22 – Reference Lee, Sobal and Frongillo 24 ).
Statistical analyses
Statistical analyses were conducted using the statistical software package SPSS for Windows version 16.0. The χ 2 test, Fisher’s exact test, Mann–Whitney U test, multiple regression analysis and the Kruskal–Wallis H test were conducted with the level of significance set at P<0·05.
Results
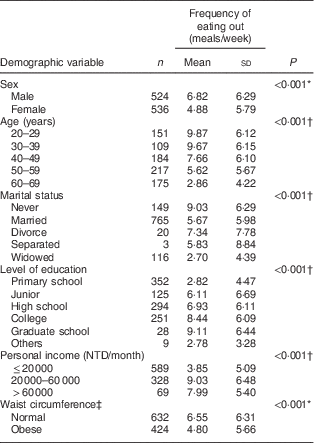
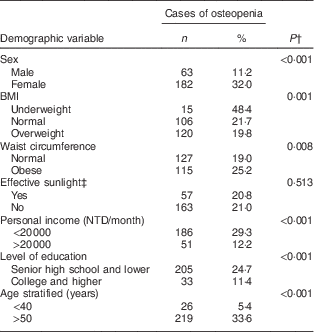
In total, 567 men (49·7 %) and 573 women (50·3 %) with a mean age of 52·43 years participated in the dual-energy X-ray absorptiometry examination. Linear correlation analyses indicated that the relationships between the frequency of eating out and demographic variables, namely sex, age, marital status, level of education, personal income and waist circumference, were significant (P<0·001, Table 1). The frequency of eating out was significantly higher in men than in women (P<0·001). Moreover, single and young participants and those with a higher education level or personal income ate out more frequently than did their corresponding counterparts. Age-based analyses revealed a decreasing eating-out trend with increasing age. We also observed that BMI (r=−0·75, P=0·014) and female waist circumference (r=−0·19, P<0·001) were significantly negatively correlated with eating-out frequency, while male waist circumference was not significantly correlated with eating-out frequency. As shown in Table 2, sex, BMI, waist circumference, personal income, level of education and age were all significant factors (P<0·05) affecting the incidence of osteopenia. Effective sunlight (slight redness of the skin from sunlight, at least two or three times weekly)( Reference Güler, Sivas and Başkan 25 ) was not a significant factor. Despite the reverse correlation between age and eating-out frequency, no significant difference in Ca intake across ages was observed (data not shown). Individuals with osteopenia ate out significantly less frequently (5·4 meals/week) than did those without osteopenia (6·1 meals/week, P=0·001). In addition, we found that males, over 50 years old, with a monthly income lower than NTD 20 000 had a significantly lower Ca intake (594·3 mg/d) compared with those (719·2 mg/d) whose was greater than NTD 20 000 (P=0·012).
Table 1 Demographic variables and eating-out frequency among Taiwanese adults, 2004–2008 Nutrition and Health Survey in Taiwan
NTD, new Taiwan dollars.
* Mann–Whitney U test.
† Kruskal–Wallis H test.
‡ Waist circumference <90 cm in men and <80 cm in women were used as the cut-off levels for central obesity.
Table 2 Relationships between osteopeniaFootnote * and demographic variables among Taiwanese adults, 2004–2008 Nutrition and Health Survey in Taiwan
NTD, new Taiwan dollars.
* Osteopenia is when bone mineral density T-score is <−1·0.
† Fisher’s exact test.
‡ Slight redness of the skin from sunlight, at least two or three times weekly.
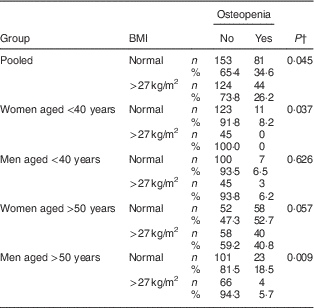
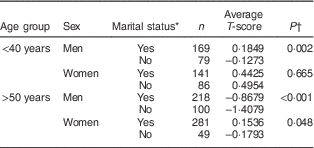
Table 3 shows that for those with normal BMI, the incidence rate of osteopenia was 34·6 %, which is significantly higher (P=0·045) than for those with BMI>27 kg/m2 (26·2 %); individuals older than 50 years with BMI>27 kg/m2 had a lower percentage of osteopenia compared with their counterparts with normal BMI (40·8 v. 52·7 %, P=0·057 for women; 5·7 v. 18·5 %, P=0·009 for men). Females aged less than 40 years exhibited a similar trend (0·0 v. 8·2 %, P=0·037). In addition, as shown in Table 4, bone mineral density T-scores in men without a spouse were significantly lower than those of men with a spouse for those aged both under 40 years and over 50 years. The association between eating-out frequency of the major daily meals and Ca intake in Taiwanese is shown in Table 5. The eating-out frequency of breakfast, especially in men, was significantly negatively associated with the daily Ca intake (P=0·006).
Table 3 Osteopenia incidence according BMI (normal and obeseFootnote *), sex and age among Taiwanese adults, 2004–2008 Nutrition and Health Survey in Taiwan
* Normal, BMI=18·5–24·0 kg/m2; obese, BMI>27·0 kg/m2.
† % Normal v. % obese by Mann–Whitney U test.
Table 4 Relationship of marital status and bone mineral density according to age and sex among Taiwanese adults, 2004–2008 Nutrition and Health Survey in Taiwan
* Includes married and cohabitating couples.
† Yes v. no by Mann–Whitney U test.
Table 5 Relationship between eating-out frequency of the major daily meals and calcium intake, overall and according to sex, among Taiwanese adults, 2004–2008 Nutrition and Health Survey in Taiwan
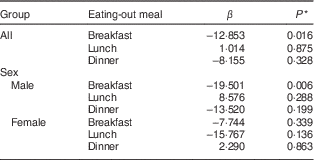
* Multiple regression analysis.
Discussion
At the beginning of the present investigation, BMI of 24 kg/m2 was used as the overweight cut-off point. However, the outcome was susceptible to potential interference by non-obese participants when analysing the relationships of obesity (using waist circumference and BMI values) with weekly frequency of eating out and bone density. Therefore, the decision was made to adopt targeted sampling; we therefore selected 483 participants with BMI<27 kg/m2 (42·5 %) and 262 participants with BMI>27 kg/m2 (23·1 %) for analysis and comparison. Being overweight (BMI>24 kg/m2) and high bone density have been found to be correlated. In addition, a reduction in body weight can lead to osteopenia( Reference Wardlaw 26 – Reference Radak 28 ). The present study demonstrated that participants with excessive waist circumference were less susceptible to osteopenia and a well-established statistical correlation exists between these two factors.
The average age of menopause onset in females is 51 years( Reference Daan and Fauser 29 ). In the present study, we did not include the ages between 40 and 50 years due to consideration of the transitional period of menopause in women, to minimize the age bias when some of the females had not yet been through the menopausal period. In our study we found that among women aged under 40 years and men aged over 50 years, the incidence rate of osteopenia in participants with obesity was significantly lower than that in participants with normal weight. Regardless of statistical significance, the incidence rate of osteopenia in obese participants across all strata was lower than that in participants with normal weight. Both obesity and osteoporosis are complex diseases and typically exhibit multifactorial aetiologies that are influenced by hereditary and environmental factors( Reference Zhao, Liu and Liu 30 ).
We found that the people with lower incomes had lower daily Ca intake and were more susceptible to osteopenia than were those with higher incomes, and they ate out less frequently than did those with higher incomes, suggesting that those with a higher socio-economic status are capable of eating out more frequently and have access to a wider range of food choices compared with those with a lower socio-economic status, which agrees with the assumption that people who frequently eat out typically have a higher socio-economic background( Reference Lachat, Nago and Verstraeten 31 ). In Taiwan, the major dietary Ca sources are vegetables, soya-, egg- and milk-containing foods, and fish products( Reference Wu, Chang and Chang 32 ). The fact that the Ca in vegetables and soya is not absorbed and utilized as efficiently as that from animal sources may be one of the reasons for the inefficient intake of Ca in Taiwan. We also found that single or divorced men may have an increased risk of osteopenia, which may be due to their imbalanced selection of food. It has been indicated that married men and women tend to follow dietary guidelines and are more balanced in their food selection( Reference Roos, Lahelma and Virtanen 33 ). In addition to Ca intake, bone density may also be affected by other factors such as the intake of vitamin D, the time of exposure to effective sunlight, and even the protein quality of food( Reference Cauley 34 – Reference Sahni, Broe and Tucker 36 ) since higher intakes of Ca (greater than 1100 mg/d) did not guarantee higher T-scores in the present study.
Although we have made a great effort to exclude some interfering variables that may have affected our conclusions, some limitations in the study still need to be addressed. First, due to the cross-sectional nature of the study, we can only find the associations at a point in time, and not cause-and-effect correlations. Second, due to the content of the questionnaires, we were not able to provide more details on the foods consumed more frequently when eating out compared with when eating at home. Third, although we excluded the data of females aged 40–50 years, there were still some possibilities that some of the females included had an early or a late menopausal condition, which can be one of the confounding variables.
Conclusion
In conclusion, in the current cross-sectional study, eating-out frequency affected Ca intake but was not associated with increasing the incidence of osteopenia in the Taiwanese population since Ca intake is not the only factor affecting bone density. Having a balanced selection of food is crucial to reduce the incidence of osteopenia. Improving nutritional knowledge for those with a higher risk of osteopenia is necessary to prevent osteopenia and Ca deficiency.
Acknowledgements
Financial support: This research received no specific grant from any funding agency in the public, commercial or not-for-profit sectors. Conflict of interest: Y.-H.H., C.-C.L., C.-I.L. and S.-H.L. declare that they have no competing financial interests and no conflicts of interest. Authorship: Y.-H.H. performed the data collection and analysis. C.-C.L. also performed the data analysis. C.-I.L. was involved in the discussion of results and commented on the manuscript. S.-H.L. conducted the study, interpreted the data, and completed the manuscript. Ethics of human subject participation: This article complies with ethical standards, and the data were used under the approval of Survey Research Data Archive of Academia Sinica, Taiwan.


