Diabetes has become a major public health problem in China. In a recent investigation, the prevalence of diabetes and pre-diabetes in Chinese adults was estimated to be 11·6 and 50·1 %, respectively, representing up to 113·9 million people with diabetes and 493·4 million people with pre-diabetes in China( Reference Xu, Wang and He 1 ). Insulin resistance plays a key role in the pathogenesis of type 2 diabetes mellitus( Reference Kahn 2 ), which is the predominant form of diabetes in adults.
The main source of 25-hydroxyvitamin D (25(OH)D) in the human body is from the cutaneous synthesis of vitamin D through UVB irradiation( Reference Webb and Holick 3 ) and only a very small proportion is obtained from dietary sources, such as milk and oily fish. Historically, 25(OH)D has been considered to be involved only in Ca homeostasis and bone metabolism. However, in recent years, increasing evidence has indicated that 25(OH)D may have additional functional roles. Several studies have indicated an association between low concentrations of serum 25(OH)D and insulin resistance( Reference Choi, Kim and Lim 4 – Reference Lu, Yu and Pan 6 ), although this relationship has been controversial( Reference Pilz, van den Hurk and Nijpels 7 – Reference Song, Kim and Choi 12 ). Moreover, BMI, blood glucose status and season are also known to influence the relationship between 25(OH)D and insulin resistance. Previous studies have demonstrated lower serum 25(OH)D concentrations in overweight and obese patients( Reference Mezza, Muscogiuri and Sorice 13 – Reference Blum, Dolnikowski and Seyoum 15 ). Furthermore, 25(OH)D was negatively associated with insulin resistance in Chinese patients with type 2 diabetes( Reference Zhang, Ye and Guo 16 ). Ning et al.( Reference Ning, Song and Miao 17 ) performed a cross-sectional study of a Chinese population and found higher 25(OH)D concentrations in autumn and summer than in winter and spring in both genders.
We performed a large clinical investigation, called the Survey on the Prevalence in East China of Metabolic Diseases and Risk Factors, 2014 (SPECT-China 2014), to analyse the serum 25(OH)D concentrations in China. Furthermore, we investigated the relationship between vitamin D and insulin resistance in this population.
Methods
Study population
SPECT-China 2014 was a population-based cross-sectional survey on the prevalence of metabolic diseases and risk factors in Eastern China. It was registered under number ChiCTR-ECS-14005052 at www.chictr.org. In that study we used a stratified cluster sampling method to select a sample of the general population. Random sampling was performed with the statistical software package IBM SPSS Statistics Version 22 prior to data collection. The study was conducted in three urban and three rural sites in Shanghai, one urban and six rural sites in Jiangxi Province, and three rural sites in Zhejiang Province. Adults who had lived in their current residence for 6 months or more were recruited and enrolled in the study from February to June 2014. Then we performed our investigation by cooperation with the local village and community administrators of residence registration. Participants were invited by providing information about our investigation through house-to-house visits. The overall response rate was 90·8 %. Participant data were collected in community centres by trained researchers.
The selection criteria were (i) age above 18 years and (ii) lack of clinical evidence of end organ damage, including heart failure, myocardial infarction, cerebral infarction, cerebral haemorrhage, hepatocirrhosis and chronic renal failure (chronic kidney disease stage 5). The exclusion criteria were: (i) a history of vitamin D or Ca supplementation; (ii) sarcoidosis, malabsorption, small gut disease or endocrine disease such as hyperparathyroidism; (iii) severe communication problems; and (iv) unwillingness to participate in the study.
We excluded participants who had missing laboratory results (n 183) or missing questionnaire data (n 112) and participants who were younger than 18 years old (n 6). Participants who lacked glycated Hb (HbA1c; n 2), insulin (n 14), fasting blood glucose (n 1), 25(OH)D (n 4) or BMI (n 240) values, participants who were taking Ca or vitamin D supplements (n 5) and those who were undergoing insulin treatment (n 36) were also excluded. A total of 6597 participants were thus included (Fig. 1). The study was approved by the ethics committee of Shanghai Ninth People’s Hospital, which is affiliated with Shanghai Jiaotong University School of Medicine. Written consent was obtained from all participants and the procedures were implemented in accordance with the approved guidelines.
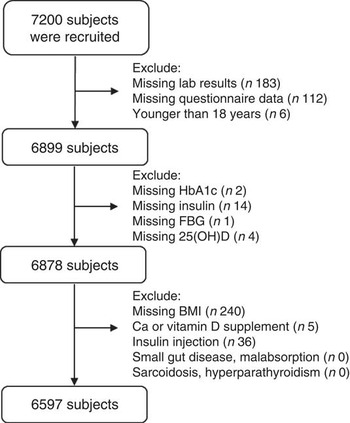
Fig. 1 Flowchart of the current study. A total of 7200 subjects from the SPECT-China 2014 study were enrolled; after excluding participants who had missing data, were younger than 18 years and received calcium/vitamin D/insulin supplementation, 6597 individuals were included (SPECT-China 2014, Survey on the Prevalence in East China of Metabolic Diseases and Risk Factors, 2014; HbA1c, glycated Hb; FBG, fasting blood glucose; 25(OH)D, 25-hydroxyvitamin D)
Measurements
In our study, diabetes was defined as a self-reported history of diabetes or HbA1c level of 6·5 % or more. Pre-diabetes was defined as HbA1c concentration between 5·7 and 6·4 %. Normal glucose tolerance was defined as HbA1c less than 5·7 %( 18 ). Insulin resistance was evaluated by the homeostasis model assessment of insulin resistance (HOMA-IR), which was calculated as [fasting glucose (mmol/l)×fasting insulin (mIU/l)]/22·5( Reference Matthews, Hosker and Rudenski 19 ). BMI was calculated as [weight (kg)]/[height (m)]2. Overweight was defined as 25 kg/m2≤BMI<30·0 kg/m2. Obesity was defined as BMI≥30·0 kg/m2. Blood pressure and heart rate were measured three times by a sphygmomanometer (TERUMO-Elemano); the mean of the three measurements was used in the analysis. Mean arterial pressure was calculated as (systolic blood pressure +2×diastolic blood pressure)/3. Vitamin D deficiency was defined as serum 25(OH)D concentration less than 50 nmol/l( Reference Holick, Binkley and Bischoff-Ferrari 20 ). Waist circumference was measured at a level midway between the lowest rib and the iliac crest. Demographic information and lifestyle risk factors were obtained from standardized questionnaires administered by trained staff. Drinking and smoking status were divided into never drinker/smoker and past or current drinker/smoker.
Assessment of biomarkers
Venous blood samples were drawn from all participants after they had fasted for at least 8 h and were immediately centrifuged (2000 rpm for 15 min) at room temperature. Blood samples were stored at −20°C when collected and then shipped by air in dry ice to a central laboratory certified by the College of American Pathologists within 2–4 h of collection. All plasma and serum samples were frozen at −80°C after laboratory testing. Biochemical indices were analysed by a Beckman Coulter AU 680 analyser. HbA1c was detected using HPLC by an MQ-2000 PT analyser (Medconn Technology, Shanghai, China) using commercial reagents (HuaChen Biological Reagent Co., Ltd, Shanghai, China).
Serum 25(OH)D was measured by a Siemens ADVIA Centaur XP immunoassay system. This system detects vitamin D with a one-step competitive immunoassay, using anti-fluorescein monoclonal mouse antibody covalently bound with paramagnetic particles, acridine ester-labelled anti-25(OH)D monoclonal mouse antibodies and fluorescein-labelled 25(OH)D analogues. The intra- and inter-assay CV were 6·25 and 8·33 %, respectively.
Insulin was tested by an Abbott ARCHITECT i2000 SR immunoassay analyser. This insulin assay is a one-step immunoassay that determines the presence of human insulin. The sample, anti-insulin-coated paramagnetic microparticles and anti-insulin acridinium-labelled conjugate are combined. The insulin present in the sample binds to the anti-insulin-coated microparticles and the anti-insulin acridinium-labelled conjugate. After washing, pre-trigger and trigger solutions are then added to the reaction mixture; the resulting chemiluminescent reaction is measured as relative light units. The intra- and inter-assay CV were 6·25 and 8·33 %, respectively.
Statistical analysis
Statistical analysis was performed using the statistical software package SAS for Windows version 9.4. Continuous variables were expressed as the mean and standard deviation. As HOMA-IR was not normally distributed, we used logarithmic transformation (log10) to normalize the variable. Multiple linear regression analyses were conducted to investigate the independent associations of 25(OH)D with HOMA-IR. Three models were constructed. Model 1 was unadjusted; model 2 included age, sex, and smoking and drinking status; and model 3 included the terms in model 2 plus HbA1c (not in subgroup analyses by glucose status) and BMI (not in subgroup analyses by weight). All analyses were two-sided and P<0·05 was considered significant.
Results
Comparison between genders
The present study analysis included 539 participants with diabetes (male 273, female 266), 1009 with pre-diabetes (male 516, female 493) and 5049 with normal glucose tolerance (male 2024, female 3025). In total, there were 2813 males (mean age 52·7 (sd 13·5) years) and 3784 females (52·3 (sd 13·5) years).
The baseline characteristics are shown in Table 1. Serum 25(OH)D concentrations of all participants ranged from 19·0 to 123·7 nmol/l. Additionally, 25(OH)D concentrations differed significantly between males and females in all seasons (both P<0·001). However, there were no significant differences in 25(OH)D concentrations according to season. Of the 6597 participants, 5496 (83·3 %) were vitamin D deficient. There were also significant differences between males and females in HbA1c, serum creatinine, waist-to-hip ratio, aspartate aminotransferase, alanine transaminase, TAG, HDL cholesterol and BMI (P<0·001).
Table 1 Characteristics of participants according to gender, SPECT-China 2014 study
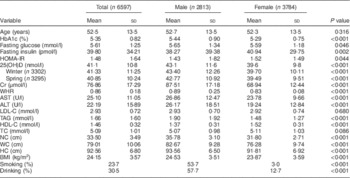
SPECT-China 2014, Survey on the Prevalence in East China of Metabolic Diseases and Risk Factors, 2014; HbA1c, glycated Hb; HOMA-IR, homeostasis model assessment of insulin resistance; 25(OH)D, 25-hydroxyvitamin D; Cr, creatinine; WHR, waist-to-hip ratio; AST, aspartate aminotransferase; ALT, alanine aminotransferase; LDL-C, LDL cholesterol; HDL-C, HDL cholesterol; TC, total cholesterol; NC, neck circumference; WC, waist circumference; HC, hip circumference.
Comparison between 25-hydroxyvitamin D quartiles
Serum 25(OH)D was categorized into quartiles and the different indices were compared between quartiles. As 25(OH)D increased, HbA1c, age, waist circumference, BMI, smoking and drinking also increased, and fasting insulin, HOMA-IR and TAG decreased. However, fasting blood glucose, LDL cholesterol and HDL cholesterol did not differ significantly (Table 2).
Table 2 Comparison of participant characteristics according to 25-hydroxyvitamin D (25(OH)D) quartiles, SPECT-China 2014 study
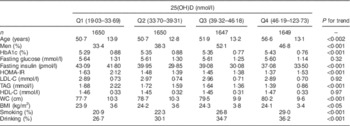
SPECT-China 2014, Survey on the Prevalence in East China of Metabolic Diseases and Risk Factors, 2014; HbA1c, glycated Hb; HOMA-IR, homeostasis model assessment of insulin resistance; LDL-C, LDL cholesterol; HDL-C, HDL cholesterol; WC, waist circumference.
Regression analysis of 25-hydroxyvitamin D and insulin resistance in different subgroups
The analysis of the total population showed that serum 25(OH)D concentration was significantly associated with log10HOMA-IR in all three models. In all subgroup analyses, 25(OH)D was significantly associated with log10HOMA-IR in the unadjusted model. Participants with pre-diabetes showed an association between 25(OH)D and log10HOMA-IR in models 2 and 3 in the subgroup analysis by glucose status. When analysed by BMI, overweight participants showed an association between 25(OH)D and log10HOMA-IR in models 2 and 3. Finally, in the analysis by season, 25(OH)D in winter was associated with log10HOMA-IR in both model 2 and model 3 (Table 3).
Table 3 Association of 25-hydroxyvitamin D (25(OH)D) with insulin resistance, SPECT-China 2014 study
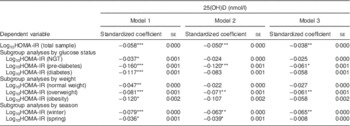
SPECT-China 2014, Survey on the Prevalence in East China of Metabolic Diseases and Risk Factors, 2014; HOMA-IR, homeostasis model assessment of insulin resistance; NGT, normal glucose tolerance; HbA1c, glycated Hb.
Linear regression analyses were used.
Model 1 was unadjusted. Model 2 included terms for age, sex, smoking, drinking. Model 3 included terms for model 2, HbA1c (not in subgroup analyses by glucose status), BMI (not in subgroup analyses by weight) and season (not in subgroup analyses by season).
*P<0·05, **P<0·01, ***P<0·001.
Correlations of 25-hydroxyvitamin D with age
We divided participants into five age groups (18–40, 41–50, 51–60, 61–70 and 71–93 years) and found that serum 25(OH)D concentration was positively correlated with age. We observed a significant association between 25(OH)D and increasing age after adjusting for smoking, drinking, HbA1c and BMI in both males (P<0·001) and females (P<0·001; data not shown). Further adjusting for aspartate aminotransferase, alanine transaminase and creatinine did not change this association appreciably (Fig. 2). This trend was more evident in males than in females.
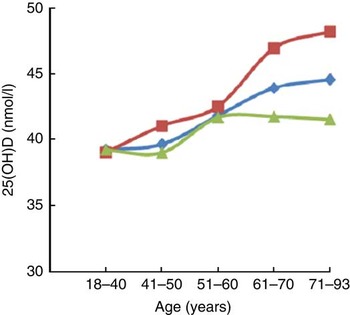
Fig. 2 Trends of increasing serum 25-hydroxyvitamin D (25(OH)D) concentration with age among participants of the SPECT-China 2014 study. Associations of vitamin D status with age overall (![]() ; n 6597) and in men (
; n 6597) and in men (![]() ; n 2813) and women (
; n 2813) and women (![]() ; n 3784) separately after adjusting for smoking, drinking, HbA1c, BMI, AST, ALT and Cr (SPECT-China 2014, Survey on the Prevalence in East China of Metabolic Diseases and Risk Factors, 2014; HbA1c, glycated Hb; AST, aspartate aminotransferase; ALT, alanine transaminase; Cr, creatinine)
; n 3784) separately after adjusting for smoking, drinking, HbA1c, BMI, AST, ALT and Cr (SPECT-China 2014, Survey on the Prevalence in East China of Metabolic Diseases and Risk Factors, 2014; HbA1c, glycated Hb; AST, aspartate aminotransferase; ALT, alanine transaminase; Cr, creatinine)
Discussion
Vitamin D has attracted widespread interest beyond its effects on Ca and bone metabolism. Low 25(OH)D concentrations have been detected in diabetes mellitus, metabolic syndrome, hypertension, CVD and dyslipidaemia( Reference Boucher 21 – Reference Jorde and Grimnes 25 ). Furthermore, circulating 25(OH)D may affect the prognosis of cancer patients; Li et al.( Reference Li, Chen and Li 26 ) indicated that tumour patients with higher circulating 25(OH)D concentrations at or near the time of diagnosis had better outcomes.
Previous studies have focused on the relationship between vitamin D supply and insulin resistance. In New Zealand, von Hurst et al.( Reference von Hurst, Stonehouse and Coad 27 ) showed that vitamin D supplementation reduced insulin resistance in South Asian women who were insulin resistant and vitamin D deficient. Mitri et al.( Reference Mitri, Dawson-Hughes and Hu 28 ) also reported that vitamin D supplements could increase insulin sensitivity in a pre-diabetic population. Furthermore, Harinarayan et al.( Reference Harinarayan, Arvind and Joshi 29 ) indicated that vitamin D supplements could improve pancreatic β-cell function in vitamin D-deficient non-diabetic individuals, and Sepehrmanesh et al.( Reference Sepehrmanesh, Kolahdooz and Abedi 30 ) showed that vitamin D supplementation could have beneficial effects on insulin resistance in patients with major depressive disorder. However, a recent meta-analysis found that vitamin D supplementation had no significant effect on insulin resistance( Reference Jamka, Woźniewicz and Jeszka 31 ). This inconsistency might be related to the characteristics of the specific study populations, as they differed in ethnicity, sex, age and place of residence.
In the present study we found a negative correlation of serum 25(OH)D concentration with insulin resistance in the general population. In subgroup analyses, HOMA-IR was significantly associated with 25(OH)D in the overweight or pre-diabetic population. This result indicates that BMI and glucose status are important factors in evaluating the relationship between insulin resistance and 25(OH)D. Thus prospective studies of vitamin D supplementation should be performed in this kind of population.
Serum 25(OH)D concentrations of different ethnic populations have been reported. In the UK population, Forouhi et al.( Reference Forouhi, Luan and Cooper 32 ) indicated that the average 25(OH)D concentration was 64·7 and 57·1 nmol/l in 214 men and 310 women, respectively. Gupta et al.( Reference Gupta, Brashear and Johnson 33 ) found that the mean serum 25(OH)D concentration was 65·0 nmol/l (64·4 nmol/l in men and 65·7 nmol/l in women) in 1711 healthy Caucasian adults. Chiu et al.( Reference Chiu, Chu and Go 34 ) enrolled 126 healthy persons in the USA including Asian Americans, African Americans, Whites and Mexican Americans, and found that the mean 25(OH)D concentration in these groups was 47·03, 47·35, 69·55 and 50·28 nmol/l, respectively. Hyppönen and Power reported 25(OH)D concentrations of 41·1 nmol/l in winter and spring and 60·3 nmol/l in summer and autumn in a 45-year-old white British population( Reference Hyppönen and Power 35 ). In an East Asian population of 136 healthy Japanese males, Sun et al.( Reference Sun, Cao and Tanisawa 36 ) found that the median 25(OH)D concentration was 36·5 nmol/l and that 78·7 % of the men were 25(OH)D deficient (<50 nmol/l). In 807 rural Korean adults, the mean serum 25(OH)D concentration was 64·5 nmol/l (75·25 nmol/l in men and 57·25 nmol/l in women)( Reference Song, Kim and Choi 12 ). Choi et al.( Reference Choi, Oh and Lee 37 ) studied 260 Korean adolescents and found a mean concentration of 25(OH)D of 39·5 nmol/l (42·5 nmol/l in males and 36 nmol/l in females), while Tao et al.( Reference Tao, Zhang and Ke 38 ) found that the mean 25(OH)D concentration was 51·75 nmol/l in 1382 non-diabetic Chinese female participants. However, in our cohort, the average 25(OH)D concentration was 41·09 nmol/l (43·10 nmol/l in males and 39·60 nmol/l in females), and 78·5 % of the males were 25(OH)D deficient; this finding is similar to the prevalence in the Japanese population. The average 25(OH)D concentration in Caucasians was higher than the average in this East Asian population, and older individuals had higher serum 25(OH)D concentrations than younger ones.
There were several limitations to our study. The study lacked an intervention and follow-up results. We measured serum 25(OH)D concentrations over a span of five months in winter and spring. In addition, we did not obtain related indices such as 2 h oral glucose tolerance tests and concentrations of parathyroid hormone and Ca. We found that vitamin D status increased with age, which conflicts with other studies. Therefore, further studies are needed to verify the underlying mechanisms of the relationship between vitamin D status and insulin resistance.
Conclusion
The majority of this Eastern Chinese population had deficient concentrations of vitamin D. Vitamin D deficiency was inversely correlated with HOMA-IR in the general population. After adjusting for different variables, 25(OH)D and HOMA-IR were significantly associated in the pre-diabetic and overweight populations. The associations identified might be more evident in winter.
Acknowledgements
Acknowledgements: The authors thank all team members and participants from Shanghai, Zhejiang and Jiangxi Provinces in the SPECT-China 2014 study. Financial support: The SPECT-China 2014 study was supported by the National Natural Science Foundation of China (grant numbers 81200416, 81270885, 81400796, 81070677 and 81670717); the Clinical Potential Subject Construction of Shanghai Jiaotong University School of Medicine (2014); the ‘973’ fund of the Ministry of Science and Technology in China (grant number 2012CB524906); the major project of the Science and Technology Commission of Shanghai Municipality from the Yangtze River Delta epidemiological and intervention studies of environmental pollution and type 2 diabetes (grant number 14495810700); the Shanghai Municipal Health Bureau (grant number 20124262); and funding for the young teacher’s training programme in Shanghai Colleges (grant number ZZjdyx13114). Conflict of interest: None of the authors have conflict of interest. Authorship: B.H., X.W., N.W. and Q.L. contributed equally to this work. The authors’ responsibilities were as follows. Y.L. and B.W. designed the research; B.H., N.W., Q.L., Y.C., C.Z., Y.C., F.X., X.P., Z.C., C.Z., M.L., Y.M., H.G. and C.C. collected the data; W.T., B.L. and L.H. provided essential reagents and materials; B.W., X.W., Y.L. and B.H. analysed the data; B.H. and Y.L. wrote the manuscript. Ethics of human subject participation: The ethics committee of Shanghai Ninth People’s Hospital, which is affiliated with Shanghai Jiaotong University School of Medicine, approved the study. Written consent was obtained from all participants and the procedures were implemented in accordance with the approved guidelines.


