Bipolar disorder, characterised by frequent relapses, imposes a high economic burden on society (Reference Rice and MillerRice & Miller, 1995; Reference Gupta and GuestGupta & Guest, 2002; Reference PatelPatel, 2003). In our study of relapse prevention (Lam et al, Reference Lam, Watkins and Hayward2003, Reference Lam, Hayward and Watkins2005), the group receiving cognitive therapy had significantly better clinical outcomes than those receiving standard National Health Service (NHS) care. However, the cost of such intervention should be evaluated in the context of other NHS services used. An economic evaluation will enable healthcare providers to make procurement and policy decisions. This paper reports health economic data for the first 12 months (when patients were receiving cognitive therapy and up to two booster sessions), as well as for the whole 30-month study period. It is hypothesised that cognitive therapy may be cost-effective because the costs may be offset by the less-frequent use of other NHS services.
METHOD
Procedure
The details of the study have been reported elsewhere (Lam et al, Reference Lam, Watkins and Hayward2003, Reference Lam, Hayward and Watkins2005). Only a summary of the procedure will be given here. After the study had been fully explained to participants, written informed consent was obtained. Those who fulfilled the study criteria were randomly allocated to cognitive therapy (n=51) or the comparison group (treatment as usual; n=52) using sequentially numbered and sealed opaque envelopes. The allocation sequence was generated by a computer program prior to recruitment. The cognitive therapists were all clinical psychologists. Independent assessors, who were masked to the group status, performed assessments every 6 months to collect information on primary clinical outcomes and resource usage.
Participants
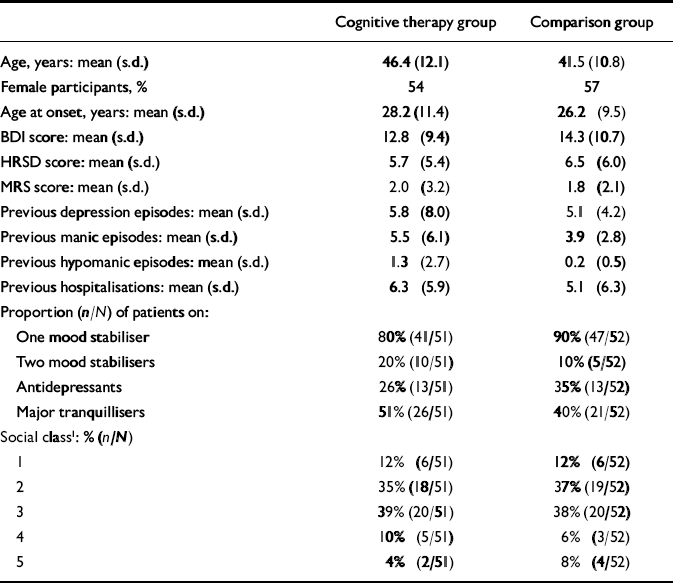
Participants, aged 18-70 years, were out-patients of the Maudsley and Bethlem NHS Trust with DSM-IV bipolar I disorder (American Psychiatric Association, 1994). They experienced frequent relapses despite the prescription of mood stabilisers. Prophylactic medication was prescribed at adequate doses according to the British National Formulary (British Medical Association & Royal Pharmaceutical Society of Great Britain, 2001). Because of relapse prevention, individuals were currently not fulfilling criteria for a bipolar episode: Beck Depression Inventory (BDI; Reference Beck, Ward and MendelsonBeck et al, 1961) score <30, Mania Rating Scale (Reference Bauer, Crits-Christoph and BallBauer et al, 1991) score <7. This avoided therapists having to use the majority of therapy sessions to treat an acute episode. In order to identify a sub-group vulnerable to relapses, participants had to have had at least two episodes in the previous 2 years or three episodes in the previous 5 years. Exclusion criteria were: actively suicidal (BDI suicide item scored 3) and currently fulfilling criteria for substance use disorders. There were no significant differences between the two groups in any of the initial demographic characteristics or clinical features (Table 1).
Table 1 Initial characteristics of those receiving cognitive therapy and standard treatment (comparison group)
| Cognitive therapy group | Comparison group | |
|---|---|---|
| Age, years: mean (s.d.) | 46.4 (12.1) | 41.5 (10.8) |
| Female participants, % | 54 | 57 |
| Age at onset, years: mean (s.d.) | 28.2 (11.4) | 26.2 (9.5) |
| BDI score: mean (s.d.) | 12.8 (9.4) | 14.3 (10.7) |
| HRSD score: mean (s.d.) | 5.7 (5.4) | 6.5 (6.0) |
| MRS score: mean (s.d.) | 2.0 (3.2) | 1.8 (2.1) |
| Previous depression episodes: mean (s.d.) | 5.8 (8.0) | 5.1 (4.2) |
| Previous manic episodes: mean (s.d.) | 5.5 (6.1) | 3.9 (2.8) |
| Previous hypomanic episodes: mean (s.d.) | 1.3 (2.7) | 0.2 (0.5) |
| Previous hospitalisations: mean (s.d.) | 6.3 (5.9) | 5.1 (6.3) |
| Proportion (n/N) of patients on: | ||
| One mood stabiliser | 80% (41/51) | 90% (47/52) |
| Two mood stabilisers | 20% (10/51) | 10% (5/52) |
| Antidepressants | 26% (13/51) | 35% (13/52) |
| Major tranquillisers | 51% (26/51) | 40% (21/52) |
| Social class1: % (n/N) | ||
| 1 | 12% (6/51) | 12% (6/52) |
| 2 | 35% (18/51) | 37% (19/52) |
| 3 | 39% (20/51) | 38% (20/52) |
| 4 | 10% (5/51) | 6% (3/52) |
| 5 | 4% (2/51) | 8% (4/52) |
Assessment and primary clinical outcome
The Structured Clinical Instrument for DSM-IV (SCID; Reference First, Gibbon and SpitzerFirst et al, 1996) was used to determine any episode that fulfilled DSM-IV criteria for major depression, mania or hypomania. The number of days with bipolar episodes was defined as days during which individuals fulfilled DSM-IV criteria for bipolar episodes from the SCID interview. Hospital computerised records were used to confirm the exact length of hospital stays.
Service utilisation
Participants were interviewed using the Client Service Receipt Inventory (CSRI; Reference Beecham, Knapp and ThornicroftBeecham & Knapp, 2001) at baseline and at 3-monthly follow-up visits. The CSRI asks about specific health and social care service use. Services measured included contacts with mental healthcare services (psychiatrists, psychologists, community mental health nurses, day centres, counsellors and other therapists), general practitioners, social workers, hospital services (out-patient care, day hospital contacts and accident and emergency attendances), support groups and residential care.
Details of in-patient stays for mental health and physical health reasons and medication were checked from case notes. Medication use was only recorded every 6 months, and therefore it was assumed that the same level of medication was used in the 3 months prior to this.
Service costs
Unit and hospital costs (which aim to reflect the long-term marginal costs) for most services were obtained from a recognised national source (Reference Netten and CurtisNetten & Curtis, 2000), where staff costs are calculated by dividing the total cost (salary, oncosts, overheads, capital, land and training) of the service over 1 year by an appropriate unit of activity. Medication costs were taken from the British National Formulary (British Medical Association & Royal Pharmaceutical Society of Great Britain, 2001). The cost of a cognitive therapy session was assumed to be equal to 1 h of a psychologist's time (£61). Unit costs were multiplied by the service utilisation data to generate service costs per patient.
Statistical analyses
Clinical outcome
The main clinical outcome (days with bipolar episodes), which was a continuous scale, was assessed for group differences using a multivariate analysis of covariance, covarying the number of previous bipolar episodes and medication compliance. All analyses were on an intention-to-treat basis. The primary measure of cost-effectiveness was the number of bipolar-free days (days without a bipolar episode) in the period following randomisation to 12-month and 30-month follow-up. Bipolar episodes are not a sensitive measure of relapse prevention, as they can vary tremendously in length.
Resource use data
Comparisons were made between the cognitive therapy and comparison groups for use of community services (i.e. non-in-patient services combined), psychiatric in-patient care, general in-patient care and medication. Tests of significance were only conducted when comparing total costs for each of the 3-month time periods. Hospital use and medication data were available for most participants. Information on the use of community services was less complete. Where missing, the cost of community services was imputed by taking the mean of the costs for the other time periods.
Total cost differences between the groups were tested for statistical significance using a regression model with cost as the dependent variable and the group indicator as the independent variable. Regression analysis allowed us to deal with the expected non-normality of the costs distribution. Non-parametric bootstrapping with 1000 resamples was used to address the skewness in the cost data (Reference Mooney and DuvallMooney & Duval, 1993). Confidence intervals were constructed at the 90% level because we assumed that it is more acceptable to make a type II error with economic data than with clinical data.
Cost-effectiveness analysis
The incremental cost-effectiveness of cognitive therapy compared with standard care was determined using the net-benefit approach (Reference BriggsBriggs, 2001). There is theoretical, but unknown, value (represented by the term λ below) that society would place on a 1-unit improvement in outcome, as measured by the number of bipolar-free days. The net benefit to society of cognitive therapy can be defined as:
where NB=net benefit, E=effectiveness (i.e. days free of bipolar episodes over 12 and 30 months) and SC=service costs. For example, if a bipolar-free day is assumed to have a value of £10 and if a particular individual has 50 of these, then their gross benefit is £500. However, it is assumed that is achieved at a cost, and if that is, say, £300 then a net benefit of £200 is achieved. The trial provided us with data on effectiveness and service costs. Therefore to estimate a net benefit for each individual we had to make an assumption regarding the level of λ.
We estimated net benefits for all participants by assuming different values for λ ranging between £0 and £50 in £10 increments. A regression model was then used to determine the mean difference in net benefit between the cognitive therapy and standard care (treatment as usual) groups for every value of λ, controlling for baseline costs. For each model, 1000 regression coefficients for the cognitive therapy/standard care variable were generated using bootstrapping, and the proportion of these greater than zero indicated the probability that cognitive therapy was cost-effective (i.e. resulted in a mean incremental net benefit greater than zero) for that value of λ. These probabilities were subsequently used to generate a cost-effectiveness acceptability curve.
Sensitivity analysis
The only addition to the standard package of care was sessions of cognitive therapy. The unit cost of this was based on that for a clinical psychologist from a national source. However, it may be that the actual unit cost could be different if other professionals (such as mental health nurses) provide the service, if more or less experienced psychologists deliver the service or if differences in supervision and general infrastructure affect the costs. To take into account such possibilities we recalculated the total costs by assuming that (i) the unit cost of cognitive therapy was 50% lower (£30.50 per hour) and (ii) 50% higher (£91.50 per hour).
RESULTS
Summary of primary clinical outcome
Those receiving cognitive therapy spent 62.3 fewer days with bipolar episodes than the comparison group (26.6 days, s.d.=46.0 v. 88.4 days, s.d.=108.9; 95% CI of difference 27.31-96.99) in the first 365 days. Over the whole 30 months, they also spent 110 fewer days (95.3 days, s.d.=152.1 v. 201.0 days, s.d.=95.3; 95% CI of difference 32-189 days) with bipolar episodes out of about 900 days in total. The differences were significant after controlling for the number of previous bipolar episodes and medication compliance. The actuarial cumulative relapse rates for bipolar episodes in the cognitive therapy and comparison groups were 64% (30/47) and 84% (43/51), respectively. After controlling for the previous number of episodes and medication compliance during the whole 30 months, the differences were significant for bipolar episodes (hazard ratio=0.50, 95% CI 0.29-0.85, P=0.012).
A total of 47% (21/45) in the comparison group v. 38% (18/47) of those receiving cognitive therapy were admitted to hospital for bipolar episodes. The difference was not significant. There was also a non-significant trend for patients receiving cognitive therapy to have fewer days in hospital over the whole 30-month period (mean 31.3 days, s.d.=84.6 v. mean 35.7 days, s.d.=69.8).
Service utilisation
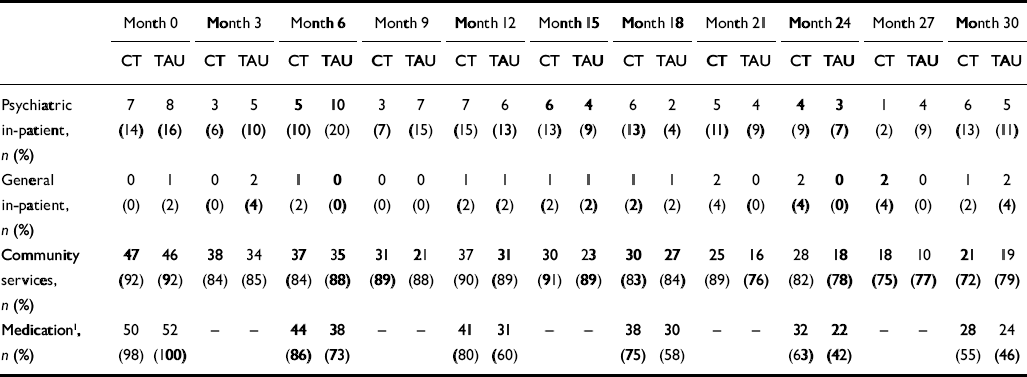
Table 2 summarises service use for the cognitive therapy and comparison groups in the 3 months prior to baseline and each follow-up assessment. During the 3 months prior to randomisation (baseline), 14% (7/51) of the cognitive therapy group received psychiatric in-patient treatment and 16% (8/52) of the comparison group; 92% of individuals also received some community services. Virtually all participants were prescribed medication.
Table 2 Use of services during the 3 months prior to baseline and follow-up assessments
| Month 0 | Month 3 | Month 6 | Month 9 | Month 12 | Month 15 | Month 18 | Month 21 | Month 24 | Month 27 | Month 30 | ||||||||||||
|---|---|---|---|---|---|---|---|---|---|---|---|---|---|---|---|---|---|---|---|---|---|---|
| CT | TAU | CT | TAU | CT | TAU | CT | TAU | CT | TAU | CT | TAU | CT | TAU | CT | TAU | CT | TAU | CT | TAU | CT | TAU | |
| Psychiatric | 7 | 8 | 3 | 5 | 5 | 10 | 3 | 7 | 7 | 6 | 6 | 4 | 6 | 2 | 5 | 4 | 4 | 3 | 1 | 4 | 6 | 5 |
| in-patient, | (14) | (16) | (6) | (10) | (10) | (20) | (7) | (15) | (15) | (13) | (13) | (9) | (13) | (4) | (11) | (9) | (9) | (7) | (2) | (9) | (13) | (11) |
| n (%) | ||||||||||||||||||||||
| General | 0 | 1 | 0 | 2 | 1 | 0 | 0 | 0 | 1 | 1 | 1 | 1 | 1 | 1 | 2 | 0 | 2 | 0 | 2 | 0 | 1 | 2 |
| in-patient, | (0) | (2) | (0) | (4) | (2) | (0) | (0) | (0) | (2) | (2) | (2) | (2) | (2) | (2) | (4) | (0) | (4) | (0) | (4) | (0) | (2) | (4) |
| n (%) | ||||||||||||||||||||||
| Community | 47 | 46 | 38 | 34 | 37 | 35 | 31 | 21 | 37 | 31 | 30 | 23 | 30 | 27 | 25 | 16 | 28 | 18 | 18 | 10 | 21 | 19 |
| services, | (92) | (92) | (84) | (85) | (84) | (88) | (89) | (88) | (90) | (89) | (91) | (89) | (83) | (84) | (89) | (76) | (82) | (78) | (75) | (77) | (72) | (79) |
| n (%) | ||||||||||||||||||||||
| Medication1, | 50 | 52 | — | — | 44 | 38 | — | — | 41 | 31 | — | — | 38 | 30 | — | — | 32 | 22 | — | — | 28 | 24 |
| n (%) | (98) | (100) | (86) | (73) | (80) | (60) | (75) | (58) | (63) | (42) | (55) | (46) | ||||||||||
There were few differences in the proportions of those using these groups of services in the follow-up periods. However, in the 3 months preceding the 6- and 9-month follow-up assessments, around twice as many from the comparison group were admitted compared with those receiving cognitive therapy. However, this was reversed in the period before the 18-month follow-up. Community services continued to be used by the majority of participants throughout the study. Medication also continued to be used by many, but the numbers did decline slightly.
Service cost
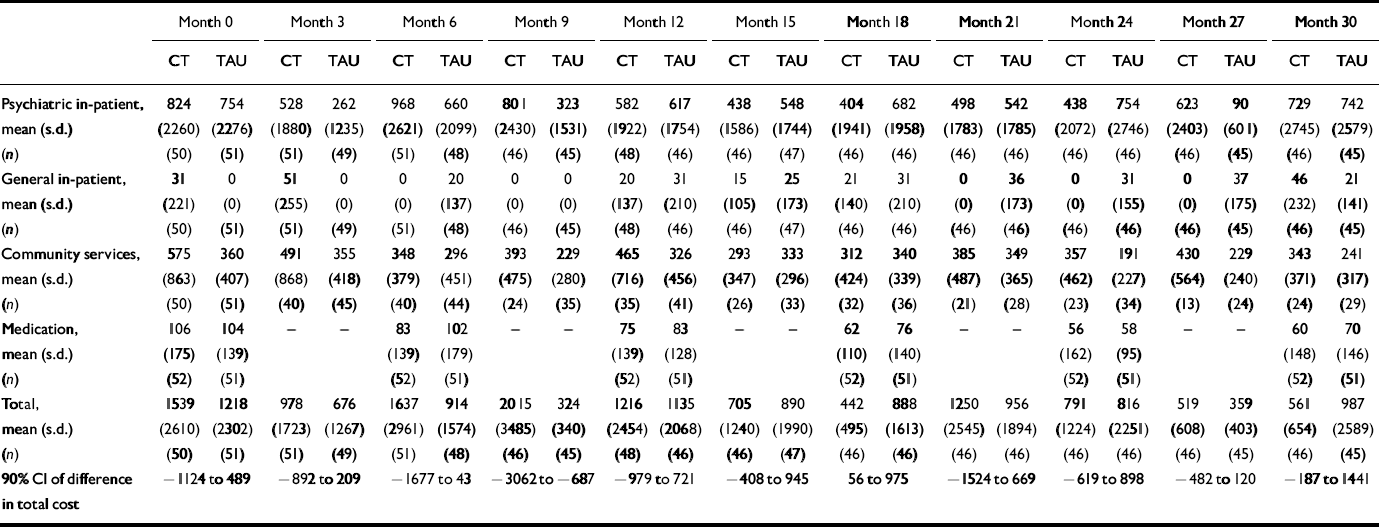
Table 3 shows the average costs at baseline and for each follow-up period. There was much variation in resource use throughout the study period. Significance tests were only carried out on the difference between the groups in total costs. For most periods, there were no statistically significant differences; the exceptions were for the period up to the 9-month assessment, when the cognitive therapy group was significantly less costly, and at the 18-month assessment, when the cognitive therapy group used significantly more resources. These findings were consistent with the clinical outcomes (Lam et al, Reference Lam, Watkins and Hayward2003, Reference Lam, Hayward and Watkins2005).
Table 3 Service costs (£) for cognitive therapy and standard treatment groups during the 3 months prior to baseline and follow-up assessments
| Month 0 | Month 3 | Month 6 | Month 9 | Month 12 | Month 15 | Month 18 | Month 21 | Month 24 | Month 27 | Month 30 | ||||||||||||
|---|---|---|---|---|---|---|---|---|---|---|---|---|---|---|---|---|---|---|---|---|---|---|
| CT | TAU | CT | TAU | CT | TAU | CT | TAU | CT | TAU | CT | TAU | CT | TAU | CT | TAU | CT | TAU | CT | TAU | CT | TAU | |
| Psychiatric in-patient, | 824 | 754 | 528 | 262 | 968 | 660 | 801 | 323 | 582 | 617 | 438 | 548 | 404 | 682 | 498 | 542 | 438 | 754 | 623 | 90 | 729 | 742 |
| mean (s.d.) | (2260) | (2276) | (1880) | (1235) | (2621) | (2099) | (2430) | (1531) | (1922) | (1754) | (1586) | (1744) | (1941) | (1958) | (1783) | (1785) | (2072) | (2746) | (2403) | (601) | (2745) | (2579) |
| (n) | (50) | (51) | (51) | (49) | (51) | (48) | (46) | (45) | (48) | (46) | (46) | (47) | (46) | (46) | (46) | (46) | (46) | (46) | (46) | (45) | (46) | (45) |
| General in-patient, | 31 | 0 | 51 | 0 | 0 | 20 | 0 | 0 | 20 | 31 | 15 | 25 | 21 | 31 | 0 | 36 | 0 | 31 | 0 | 37 | 46 | 21 |
| mean (s.d.) | (221) | (0) | (255) | (0) | (0) | (137) | (0) | (0) | (137) | (210) | (105) | (173) | (140) | (210) | (0) | (173) | (0) | (155) | (0) | (175) | (232) | (141) |
| (n) | (50) | (51) | (51) | (49) | (51) | (48) | (46) | (45) | (48) | (46) | (46) | (47) | (46) | (46) | (46) | (46) | (46) | (46) | (46) | (45) | (46) | (45) |
| Community services, | 575 | 360 | 491 | 355 | 348 | 296 | 393 | 229 | 465 | 326 | 293 | 333 | 312 | 340 | 385 | 349 | 357 | 191 | 430 | 229 | 343 | 241 |
| mean (s.d.) | (863) | (407) | (868) | (418) | (379) | (451) | (475) | (280) | (716) | (456) | (347) | (296) | (424) | (339) | (487) | (365) | (462) | (227) | (564) | (240) | (371) | (317) |
| (n) | (50) | (51) | (40) | (45) | (40) | (44) | (24) | (35) | (35) | (41) | (26) | (33) | (32) | (36) | (21) | (28) | (23) | (34) | (13) | (24) | (24) | (29) |
| Medication, | 106 | 104 | - | - | 83 | 102 | - | - | 75 | 83 | - | - | 62 | 76 | - | - | 56 | 58 | - | - | 60 | 70 |
| mean (s.d.) | (175) | (139) | (139) | (179) | (139) | (128) | (110) | (140) | (162) | (95) | (148) | (146) | ||||||||||
| (n) | (52) | (51) | (52) | (51) | (52) | (51) | (52) | (51) | (52) | (51) | (52) | (51) | ||||||||||
| Total, | 1539 | 1218 | 978 | 676 | 1637 | 914 | 2015 | 324 | 1216 | 1135 | 705 | 890 | 442 | 888 | 1250 | 956 | 791 | 816 | 519 | 359 | 561 | 987 |
| mean (s.d.) | (2610) | (2302) | (1723) | (1267) | (2961) | (1574) | (3485) | (340) | (2454) | (2068) | (1240) | (1990) | (495) | (1613) | (2545) | (1894) | (1224) | (2251) | (608) | (403) | (654) | (2589) |
| (n) | (50) | (51) | (51) | (49) | (51) | (48) | (46) | (45) | (48) | (46) | (46) | (47) | (46) | (46) | (46) | (46) | (46) | (46) | (46) | (45) | (46) | (45) |
| 90% CI of difference in total cost | − 1124 to 489 | − 892 to 209 | − 1677 to 43 | − 3062 to −687 | − 979 to 721 | − 408 to 945 | 56 to 975 | − 1524 to 669 | − 619 to 898 | − 482 to 120 | − 187 to 1441 | |||||||||||
The costs for the 12- and 30-month periods following randomisation are shown in Table 4. For the first 12 months of the study and the whole of the 30 months, the group receiving cognitive therapy had lower service costs. However, the differences were not statistically significant.
Table 4 Mean (s.d.) service costs (£) for 12 months and 30 months following randomisation (1999/2000)

| Time | 0-12 months | 0-30 months | ||
|---|---|---|---|---|
| Cognitive therapy (n=45) | Standard treatment (n=46) | Cognitive therapy (n=43) | Standard treatment (n=40) | |
| Intervention | 863 (310) | NA | 854 (314) | NA |
| Psychiatric in-patient | 1786 (4918) | 2968 (5937) | 5151 (12 476) | 5940 (10739) |
| General in-patient | 53 (353) | 77 (298) | 248 (1273) | 183 (602) |
| Community services | 1263 (1487) | 1974 (2218) | 3178 (3142) | 4921 (6169) |
| Medication | 419 (600) | 338 (496) | 921 (1017) | 680 (1015) |
| Total | 4383 (5264) | 5356 (6599) | 10 352 (13 464) | 11 724 (12 061) |
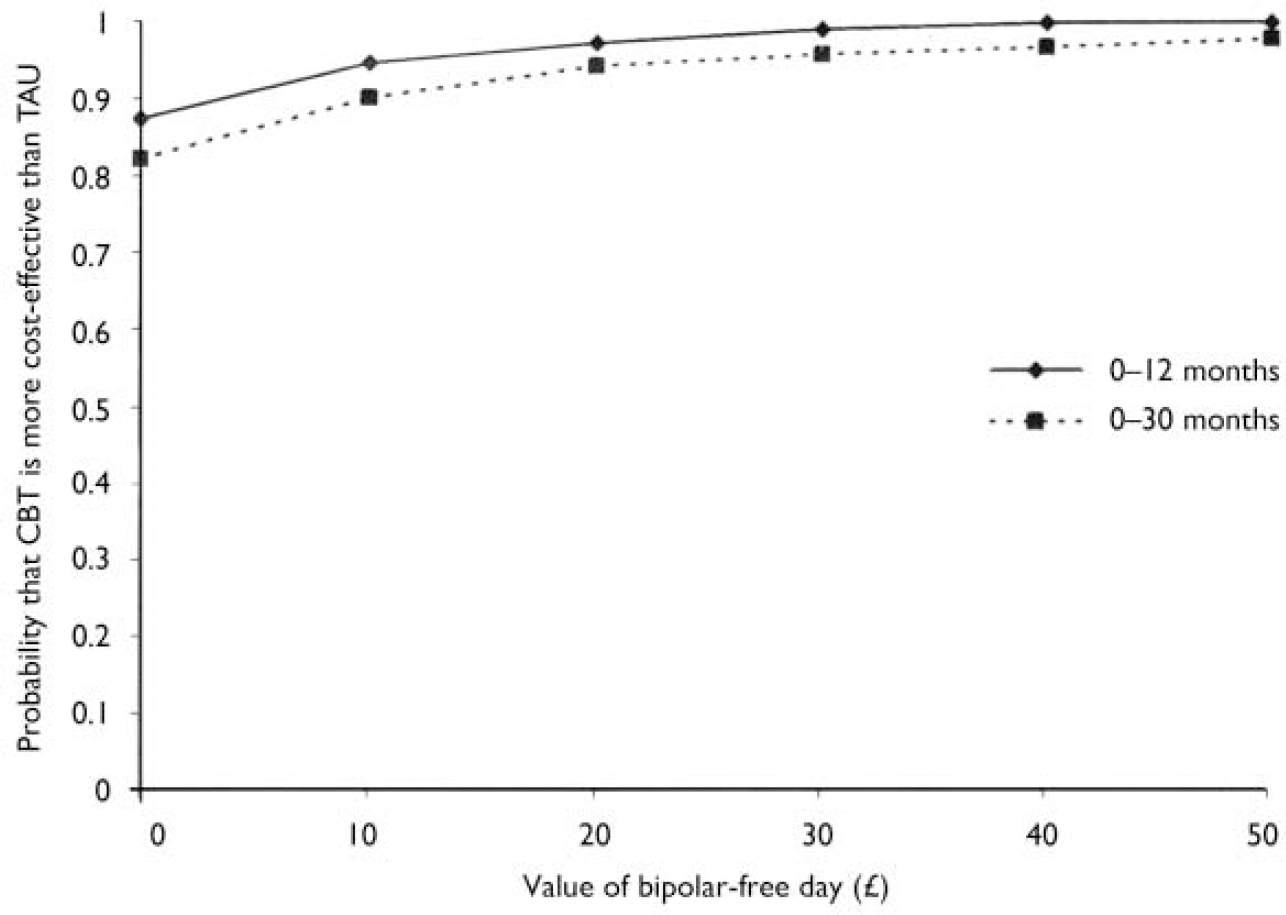
Fig. 1 Cost-effectiveness acceptability curves; CBT, cognitive-behavioural therapy; TAU, treatment as usual.
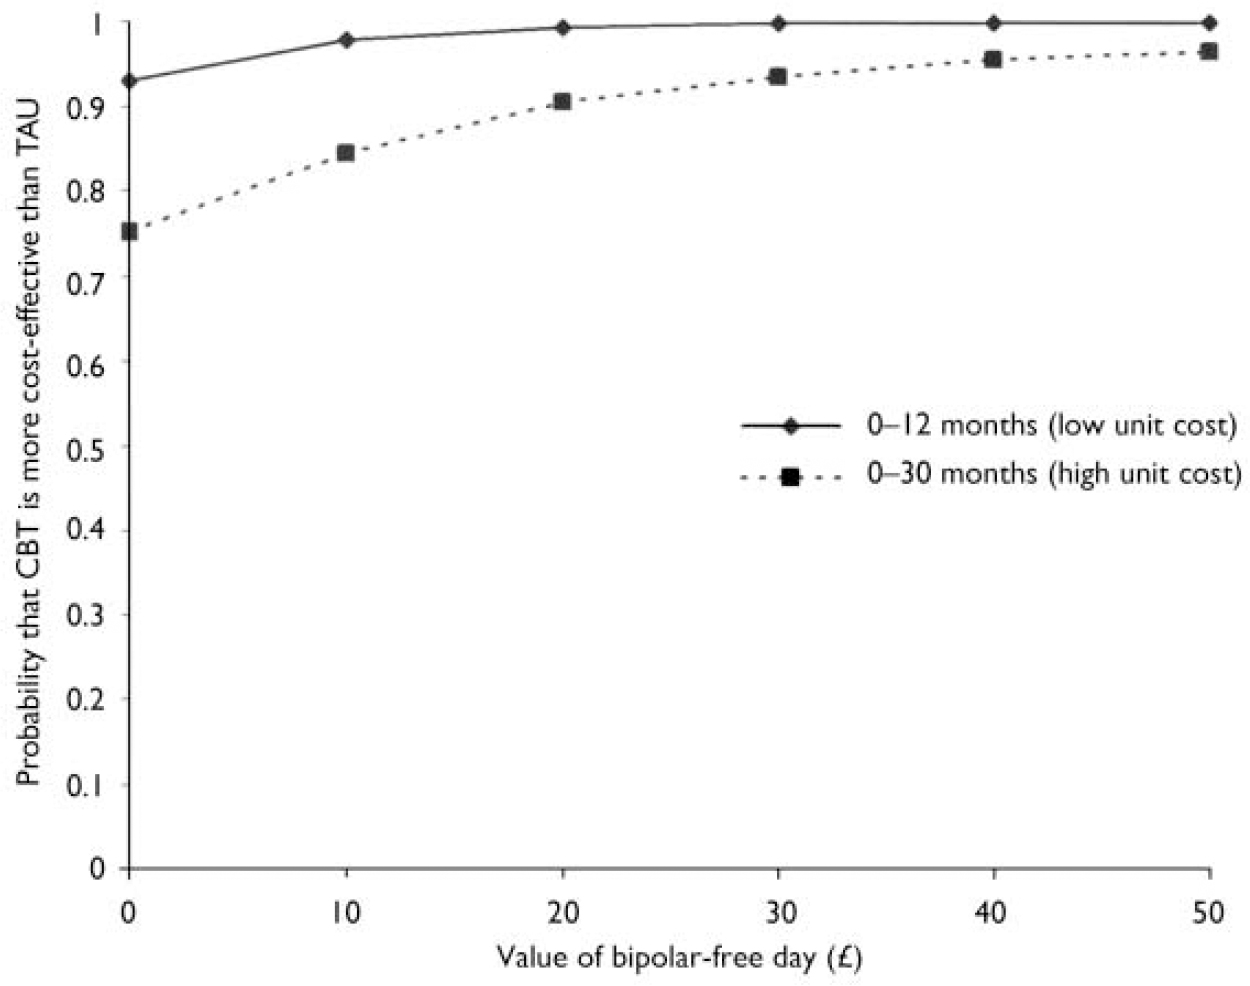
Fig. 2 Sensitivity analysis; CBT, cognitive-behavioural therapy; TAU, treatment as usual.
Cost-effectiveness analysis
Figure 1 shows cost-effectiveness acceptability curves, which show the probability that cognitive therapy is more cost-effective than standard care for a range of different values placed on a day free of bipolar symptoms. Even with a zero value, the probability of cognitive therapy being cost-effective is in excess of 0.85 for the first 12 months and 0.80 for the whole study period of 30 months. However, at a value of £10 and above per day free from bipolar episode, the probability of cognitive therapy being cost effective is in excess of 0.90 for the first 12 months and 0.85 for the whole study period of 30 months.
Sensitivity analysis
If the cost of the intervention is reduced by 50%, the total mean cost for the cognitive therapy group falls to £3952 over the 12-month period following randomisation but if the cost is increased by 50% the mean rises to £ 4815. These changes represent a 10% shift in the average cost. Over the 30-month follow-up period the total cost for the cognitive therapy group falls to £9925 with the lower unit cost and increases to £10 729 with the upper bound. This represents a smaller proportional shift (4%).
Figure 2 shows the impact of these new costs on the cost-effectiveness acceptability curves. For clarity only the most extreme results are shown. The best result for cognitive therapy is where the therapy cost is lower by 50% and the outcomes and costs are measured only for the first 12 months. In this situation there is a 93% chance that cognitive therapy is more cost-effective than standard NHS care even if a zero value is placed on a bipolar-free day. The worst case for cognitive therapy is with therapy costs raised by 50% and outcomes and costs measured over the longer period of 30 months. Even here there is a 75.2% chance of cognitive therapy being the more cost-effective option with a zero value placed on a bipolar-free day, and the figure rapidly rises to more than 90% as the value of a bipolar-free day increases.
DISCUSSION
Clinical outcome
In this study, the comparison group received standard treatment, which consisted of mood stabilisers and psychiatric follow-up, and the other group received cognitive therapy in addition to standard treatment. Combination of cognitive therapy and mood stabilisers produced better clinical outcomes, particularly in the first 12 months. However, as therapy became more distant, the effect of therapy was less robust (Reference Lam, Hayward and WatkinsLam et al, 2005).
Cost effectiveness
The group receiving cognitive therapy incurred £1000 less service costs for the first 12 months and £1300 less over the whole 30 months. However, the difference in total service cost between the cognitive therapy and comparison group was not significant. As expected, the bulk of the service cost was for psychiatric in-patient care. Psychiatric in-patient care was very expensive, leading to highly skewed data. The analysis showed that cognitive therapy was highly cost-effective compared with standard care alone. Even if no value is placed on a bipolar-free day, the probability of cognitive therapy being more cost-effective than standard treatment was more than 80% during the first year and the whole study period of 30 months. The probability of cognitive therapy being cost-effective was slightly lower if the whole 30-month period was considered. However, if society is willing to attribute a value of even £5 to one bipolar-free day, the probability of cognitive therapy being cost-effective increases to beyond 85% for both time periods. There are very few cost-effectiveness analyses of interventions for bipolar disorder; the few there are use outcome measures and methods that differ from the analyses presented here. Comparisons are not therefore possible. Finally, the probability of cognitive therapy being more cost effective than standard psychiatric care is robust in the sensitivity analysis. Even if the cost of cognitive therapy is increased by 50% (from £863 to £1295), the probability of cognitive therapy being cost-effective is still high.
Clinical implications
Our results support the addition of cognitive therapy for relapse prevention in bipolar disorder, particularly for those who are vulnerable to relapses despite the prescription of mood stabilisers. Clinically, the combined treatment was significantly more effective. The cost of adding cognitive therapy to the routine treatment with mood stabilisers and psychiatric follow-up was offset by fewer costs for other services.
Limitations
There were a number of limitations in this study. First, data on service use were collected using a self-report questionnaire. Although this allows a far greater breadth of service use to be measured, it may not be as accurate. However, the recall period was relatively short (3 months) and data on therapy and in-patient episodes were collected from other sources. We did not address the reliability of the service use measures. However, other studies have found self-report to be an appropriate way of measuring resource use (Reference Calsyn, Allen and MorseCalsyn et al, 1993; Reference Goldberg, Seybolt and LehmanGoldberg et al, 2002). Second, although a broad range of services was included, there were others that were not measured, such as informal care from family and friends; also participant time was not costed. Third, we did not have the health economy data prior to randomisation. However, there was no significant difference between the two groups in terms of previous hospitalisation, which incurred most of the health costs. Finally, the study showed that cognitive therapy had a high probability of being cost-effective but of course it is unknown what value society places on this. However, the cost-effectiveness acceptability curves do show the range of values beyond which further increases have a negligible impact on the probability. Although valuing a bipolar-free day may have more practical meaning than valuing a point change on a particular outcome scale, it is still a rather nebulous concept. Further research should be conducted to determine the views of users, family members and clinicians as to whether bipolar-free days are meaningful as an outcome measure and, if so, exactly how they might be valued.
Clinical Implications and Limitations
CLINICAL IMPLICATIONS
-
▪ Cognitive therapy is a useful addition to standard National Health Service (NHS) treatment of patients with bipolar disorder, at no extra overall cost.
-
▪ The cost of a course of cognitive therapy is offset by lower costs for other services.
-
▪ Even if the cost of cognitive therapy is increased by 50% (from £863 to £1295), the probability of cognitive therapy being cost-effective is still high.
LIMITATIONS
-
▪ There was no protocol for standard NHS treatment. Decisions on drugs and frequency of psychiatric follow-up were left to the clinicians responsible for day-to-day care.
-
▪ Service use was based on self-report and hospital records, both of which have problems.
-
▪ There is no general agreement on the value of a bipolar-free day.
Acknowledgement
This study was funded from the South London and Maudsley Hospital's research and development fund.


eLetters
No eLetters have been published for this article.