Prebiotics have become more prevalent in foodstuffs with the growing interest in functional foods and their role in health and disease prevention. Non-digestible oligosaccharides meet the FAO and the WHO definition of a prebiotic( 1 ) as they are thought to influence indigenous bacteria and have beneficial physiological effects, including a role in bone health. Adolescence is an important time period for maximising peak bone mass to prevent the development of osteoporosis later in life. The high bone mineral accrual velocity that occurs during adolescence presents a unique opportunity to influence peak bone mass through modifiable lifestyle factors, such as diet and exercise. Current Ca consumption is well under the recommended 1300 mg/d for adolescents in the USA( Reference Bailey, Dodd and Goldman 2 ). An alternative approach to improving Ca nutrition is to increase Ca bioavailability. A growing body of literature suggests that non-digestible oligosaccharides, including galacto-oligosaccharides (GOS), have beneficial effects on Ca metabolism and bone health through increasing Ca absorption( Reference Park and Weaver 3 ).
GOS are non-digestible carbohydrates consisting of chains of galactose with a glucose end piece, varying in chain length from two to eight monomers. They are produced by means of enzymatic conversion of lactose, and are being used on a large scale in infant nutrition, dairy products and beverages. Other terms being used for GOS are transgalacto-oligosaccharides or β-GOS. GOS are believed to resist digestion, allowing it to be fermented in the large intestine, in particular by bifidobacteria to produce SCFA and decrease pH. In healthy adults, consumption of 10 g/d of GOS for 21 d resulted in significant increases in faecal bifidobacteria content( Reference Bouhnik, Flourie and D'Agay-Abensour 4 ), while in vitro work has shown increased production of SCFA in the presence of GOS( Reference Durand, Cordelet and Hannequart 5 ). Changes in the intestinal surface area have also been associated with prebiotic consumption resulting in caecal hypertrophy( Reference Rémésy, Levrat and Gamet 6 , Reference Levrat, Rémésy and Demigné 7 ). In rats fed GOS diets, increased crypt depth and cell density in the proximal and distal colon were observed( Reference Pérez-Conesa, López and Ros 8 ).
Fermentation may directly increase Ca absorption through hydrogen ion exchange( Reference Rashka and Daniel 9 ) or indirectly through hypertrophy of the intestinal mucosa to increase the surface area for greater mineral diffusion. Several studies have shown a positive effect of GOS on Ca absorption( Reference Pérez-Conesa, López and Ros 8 , Reference Pérez-Conesa, López and Abellán 10 ) and bone density( Reference Chonan, Matsumoto and Watanuki 11 , Reference Chonan and Watanuki 12 ) in rats. Recently, we have shown that GOS increased Ca absorption and bone mineral density through decreased pH, increased bifidobacteria composition and increases in caecal wall and content weight( Reference Weaver, Martin and Nakatsu 13 ). Work in human subjects has been scarce with varying results. Supplementation with a gradually increasing dose from 5 to 10 g/d of GOS twice per d for 9 d increased Ca absorption by 16 % in postmenopausal women( Reference van den Heuvel, Schoterman and Muijs 14 ). Conversely, a similar study in young men has found no effect of 15 g/d of GOS for 21 d on Ca absorption( Reference van den Heuvel, Schaafsma and Muijs 15 ); however, this study did not allow enough gut transit time of the Ca tracer to include colonic absorption. No studies of GOS on Ca absorption have been reported in children and adolescents. Ca absorption fraction is up-regulated during pubertal growth, yet other prebiotics including fructo-oligosaccharides enhance Ca absorption efficiency during this life stage( Reference Abrams, Griffin and Hawthorne 16 ).
The aims of the present study were to assess the effect of GOS given in a smoothie drink on Ca absorption in healthy premenarcheal girls, and to evaluate the timing of Ca absorption and changes in gut microbiota to speculate on the mechanism of action. We hypothesised that GOS would increase colonic Ca absorption in a dose–response manner associated with changes in the total number of microbiota and bifidobacteria.
Experimental methods
Subjects
Through local advertising, thirty-one premenarcheal girls between the ages of 10 and 13 years were enrolled in the present study. All subjects were healthy and were not taking any medications that could alter bone and Ca metabolism or gut microbial profiles. Additional inclusion criteria included consuming greater than 700 mg Ca/d as measured with a validated dietary assessment tool. Scores from this FFQ were previously associated with total hip bone mineral content (BMC) and femoral neck BMC after adjustment for covariates( Reference Yang, Martin and Boushey 17 ). Dietary assessment tool scores measured at baseline were also predictive of BMC after 12 months( Reference Yang, Martin and Boushey 17 ). Exclusion criteria included disordered Ca or bone homeostasis, BMI greater than the 90th percentile for age, smoking or drug use, autoimmune or inflammatory gastrointestinal diseases, broken bone within last 6 months, disease affecting kidney function, dislike of smoothie drinks and regular consumption of foods containing prebiotics or probiotics. Subjects were asked to discontinue the use of vitamin and mineral supplements before consuming the smoothies and while participating in the study. They were also asked to avoid consuming products that contained probiotics and/or prebiotics over the course of the intervention. The present study was conducted according to the guidelines laid down in the Declaration of Helsinki, and all procedures involving human subjects were approved by the Institutional Review Board of Purdue University. Written informed consent was obtained from all subjects. The study was registered at ClinicalTrials.gov (ID: NCT01263847).
Study design
The present study was a randomised, double-blind cross-over trial with three treatments. Treatments consisted of smoothie drinks supplemented with 0, 2·5 or 5 g GOS (Vivinal® GOS Syrup containing 59 % GOS (percentage of DM); see Table 1 for the typical composition of Vivinal® GOS; FrieslandCampina Domo) that were consumed twice per d, amounting to total GOS intakes of 0, 5 and 10 g/d.
Table 1 Typical composition of Vivinal® GOS Syrup

Smoothie drinks (International Food Network Inc.) (see Table 2 for composition of smoothies) were consumed at breakfast and dinner for 3 weeks, followed by a clinical visit at Purdue which included a controlled diet, Ca absorption test, collection of all excreta and a breath test to identify methane producers, who lack or have a lower number of sulphate-reducing bacteria compared with non-methanogenic individuals( Reference Gibson, Macfarlane and Macfarlane 18 ). Each phase was separated by a 2-week period to washout any effect of the intervention on gut colonisation. A baseline blood sample was taken at the start of the study to assess markers of health including Hb, haematocrit, C-reactive protein, serum Zn, Fe-soluble transferrin receptor and serum ferritin levels. Anthropometric measurements, bone strength measures by peripheral quantitative computer tomography and physical fitness assessments were also performed during one of the three treatment periods in order to check whether the children had normal bone characteristics based on a sex-specific reference. Clinical visits occurred Friday evening through Sunday night, during which time subjects were accommodated in either a Purdue University residence hall or a local hotel.
Table 2 Composition of smoothie drinks (%)
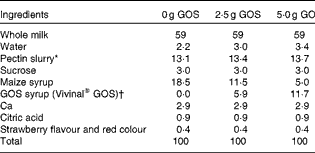
GOS, galacto-oligosaccharides.
* Pectin slurry in each smoothie contained 2·6, 3 and 3·2 % sucrose and 3·45, 3·35 and 3·30 % pectin in 0, 2·5 and 5 g GOS smoothies, respectively.
† Confirmed by analyses with high-performance anion exchange chromatography with pulsed amperometric detection( Reference Slegte 55 ).
Diets
During the clinical visit, subjects were provided with controlled diets containing approximately 700 mg Ca plus the two smoothies with 300 mg Ca each (total Ca in the diet approximately 1300 mg/d). The diets were also controlled for fibre content, providing 15 g dietary fibre/d (with the exception of the prebiotics). Energy needs were calculated at baseline and were kept equal during the three clinical visits. Calculations were based on estimated resting and moderate activity energy expenditures using the Harris–Benedict equation( Reference Harris and Benedict 19 ). During one washout period between the treatments, subjects were asked to complete a 6 d diet record to calculate habitual macro- and micronutrient intakes.
Bone health assessment
Baseline bone strength parameters were assessed on each subject using a series of peripheral quantitative computer tomography (XCT-2000; Stratec Medizintechnik GmbH) scans of the tibia and radius. In total, three sites were scanned on the tibia (4, 38 and 66 %) in addition to the 4 and 20 % sites on the radius. Non-dominant arms and legs were measured unless the subject had experienced a fracture in that limb (one participant had experienced a fracture in her non-dominant arm). Analyses of these scans were used to measure cortical and trabecular bone parameters (total area, bone mineral density, BMC, periosteal and endosteal circumferences). Normalised scores were calculated based on bone geometric parameters at the distal radius measured in 629 Caucasian males and females between the ages of 5 and 25 years using lambda, mu, sigma techniques( Reference Ashby, Ward and Roberts 20 ).
Compliance
A total of forty-two smoothie drinks (two smoothies per d for 3 weeks) were provided to the subjects during each of the three study phases, and subjects were asked to return unconsumed drinks at the start of each clinical visit. Compliance of smoothie consumption was measured with compliance calendars and confirmed by counting the number of unopened smoothie bottles returned at each clinical visit. To complete the calendars, subjects were asked to place a sticker on a calendar for each smoothie they consumed. Collection of urine and faecal samples was monitored at all times throughout the clinical visit by research personnel. Staff accompanied participants to the restroom to assure that samples were collected and labelled appropriately. The counsellor:participant ratio was 1:3.
Fractional calcium absorption
Following an overnight fast, participants provided a rising urine collection, followed by a fasting collection, on Saturday morning. After these initial urine collections, a stable Ca isotope, 44Ca (15 mg), was given orally with a standardised breakfast meal that provided a total of 300 mg Ca. 44CaCl2 was added to the smoothies for each treatment and allowed to equilibrate overnight before consumption. A second stable isotope, 43Ca (3·5 mg) as 43CaCl2, was given intravenously 1 h after the oral isotope. All urine samples were collected over the 48 h following isotope administration.
Urine samples were combined to form four 12 h urine aliquots (0–12, 12–24, 24–36 and 36–48 h). Urine samples were analysed for 44Ca and 43Ca enrichment by measuring isotope ratios (44Ca:42Ca and 43Ca:42Ca) via inductively coupled plasma MS (inductively coupled plasma-MS, Finnegan Element2; Thermo Scientific) and total Ca using atomic absorption spectrometry (AAS, AAnalyst 300; Perkin-Elmer) as described previously( Reference Weaver, Rothwell and Wood 21 ). Ca absorption was calculated using enrichment values to calculate the Δ excess for 44Ca and 43Ca as a ratio of 44Ca:43Ca after accounting for natural abundance and doses given. The equation for fractional Ca absorption for each 12 h urine aliquot is shown below.
 $$\begin{eqnarray} Fractional\ Ca\ absorption = \left (\left [\left (\frac {^{44}Ca/^{42}Ca\ \Delta \ excess}{^{43}Ca/^{42}Ca\ \Delta \ excess}\right )\times \left (\frac {0.02\,083}{0.00\,135}\right )\right ]\times \left [\frac {intravenous\ dose}{oral\ dose}\right ]\right ). \end{eqnarray}$$
Kinetic modelling was used to calculate total Ca absorption over the 48 h treatment period for subjects where all data time points were collected (n 15, 15 and 16 for 0, 5 and 10 g GOS, respectively). Tracer ratios were converted to the percentage of the dose given, and the tracer in the urine as well as total Ca in the urine were fitted by a three-compartment model using the WINSAAM program and average parameter values for teen girls( Reference Wastney, Ng and Smith 22 ). Parameters for absorption, excretion and exchange between the compartments were allowed to adjust for each subject so that the model fitted data for each subject.
Methane production
Only 30–50 % of Western populations produce methane( Reference McKay, Eastwood and Brydon 23 – Reference Bond, Engel and Levitt 25 ). Methane producers have little to no sulphate-reducing bacteria. It was found that these bacteria have a greater metabolic diversity and capacity when compared with methanogenic bacteria, leading to differences in the turnover of fatty acids in the colon( Reference Gibson, Macfarlane and Macfarlane 18 ). We hypothesised that those children who are identified as methane producers may show a higher GOS-induced enhancement of Ca absorption, possibly due to higher SCFA metabolism within the colon. During each clinical visit, subjects were asked to exhale into a Quin Tron™ sample bag (QuinTron Instrument Company) at least 2 h after consuming a meal. This test was performed during each clinical visit to assure that the results were accurate, as participants sometimes had difficulties breathing into the bags correctly. Breath samples were then analysed for methane content using a Quin Tron™ Breath Analyzer (QuinTron Instrument Company). The threshold to identify methane production was >1 parts per million and participants were identified as methane producers when methane was detected in breath samples during two or more of the three clinical visits.
Weekly self-reported gastrointestinal symptoms
During each 3-week GOS intervention, subjects were asked to complete a weekly symptom survey over the phone. Data collected from these surveys included free-response answers and rankings on a scale of 0–5 (0 = absent or no symptom; 5 = severe occurrence of symptom) for the following symptoms associated with dietary fibre consumption: abdominal pain, bloating, flatulence, diarrhoea, bowel movement frequency and bowel movement consistency.
DNA extraction
Community DNA was extracted from all faecal samples collected from the subjects during their clinical visit to Purdue at the end of each of the three different GOS treatment tests. Subjects who did not defecate during any of their clinical visits were excluded from this part of the study. In total, faecal samples were collected from twenty-three subjects for DNA extraction. Subjects also collected faecal samples at home (labelled N) before beginning their first treatment. Subjects stored the baseline samples in their freezers until research personnel were notified to pick up and transport the samples to the clinical facility where they were stored in a freezer until processed. Extractions were done using the FastDNA Spin Kit for Soil (MP Biomedicals) adapted for human faecal samples as described previously( Reference Ariefdjohan, Savaiano and Nakatsu 26 ). DNA quality and quantity was assessed using a NanoDrop 1000 spectrophotometer and NanoDrop 3000 fluorospectrometer (Thermo Scientific), respectively.
PCR–denaturing gradient gel electrophoresis
DNA was used to compare the bacterial communities between subjects by means of 16S ribosomal RNA (rRNA) gene PCR-denaturing gradient gel electrophoresis (DGGE), as described in detail previously( Reference Weaver, Martin and Nakatsu 13 ). The 16S rRNA gene was amplified by bacterial primers PRBA338F with a GC clamp and PRUN518R( Reference Lane, Stackebrandt and Goodfellow 27 , Reference Muyzer, de Waal and Uitterlinden 28 ). Agarose gel electrophoresis was used to determine the quality and quantity of PCR products before loading in equivalent quantities in DGGE gels. DGGE (DCode™ Universal Mutation Detection System; Bio-Rad Laboratories) was performed using 8 % (w/v) polyacrylamide gels (40 % acrylamide–bis solution, 37·5:1) in 1 × Tris-acetate-EDTA (TAE) buffer with denaturing gradients (30–50, 35–55 and 45–65 %). Then, three different gradients were used for bacterial community analysis of each sample to optimise band separation to facilitate profile comparisons. All gels included DGGE band migration markers, made from rRNA gene PCR products from individual microbes, to aid in between-gel comparisons. Electrophoresis was initiated at 15 V for 10 min and then increased to 200 V for 5 h. Electrophoresis buffer (1 × TAE) was maintained at 60°C throughout. Gels were stained using SYBR Green I (Cambrex Bio Science), visualised on a UV transilluminator and photographed (UVP BioImaging system; UVP LLC).
Quantitative PCR
Quantitative PCR was performed using bifidobacteria and bacteria-specific primer sets using a My iQ thermal cycler (Bio-Rad), as described previously( Reference Weaver, Martin and Nakatsu 13 ). Bacterial 16S rRNA gene copy number assessment was performed as described for PCR-DGGE previously with the exception that the GC clamp was excluded from the primer. For bifidobacteria quantification, the primers Bif164F and Bif662R( Reference Satokari, Vaughan and Akkermans 29 ) were used and annealing was performed at 62 °C, otherwise all conditions were the same as those used for bacteria. Quantitative PCR of each sample was performed in triplicate using the iQ SYBR Green Supermix (Bio-Rad) and 1 ng of template DNA. Positive controls and standard curves for quantification were made from the 16S rRNA gene of Bifidobacterium bifidum cloned into the pGEM-T easy vector (Promega). Standard curves were generated from 10-fold serial dilutions of plasmid DNA. Gene copy numbers were calculated based on total DNA and the percentage of bifidobacteria gene copies in total bacteria.
Statistical analysis
Statistical analysis was performed using SAS version 9.2 (SAS Institute). To understand the GOS effects on Ca absorption over time, a general linear model based on the following parameters was used: sequence, participant identifier (ID) nested within sequence, treatment, time and phase. ID nested within sequence was treated as a random variable with ID representing the subjects unique identifier and sequence, the order in which treatments were received. Variables were assessed for potential interactions including time × treatment and sequence × treatment interactions. The time × treatment interaction term in our general linear model was not significant; therefore, conclusions made about treatment differences apply equally to all time periods. Similarly, the interaction between sequence and treatment was also not significant. Group mean differences were determined using least significant difference post hoc comparisons when a variable was significant in the model. The sample size of twenty-three was calculated with an α error of 0·05 and 80 % power to detect a difference in Ca absorption of 5·9 %, assuming a standard deviation of 2·9 (sd 9·6) %( Reference Griffin, Hicks and Heaney 30 ).
To explore the effects of usual Ca absorption on the response to GOS, Pearson's correlations were used to evaluate correlations between the change in fractional Ca absorption on 5 or 10 g/d of GOS from control and fractional Ca absorption during the control period. Correlations were observed when all data were combined together and individually by urine collection time point.
Digital gel images were analysed and PCR-DGGE fingerprint profiles compared using BioNumerics software (version 5.01; Applied Maths). Gels were scored for the presence or absence of DNA bands and all scores from different gradients were combined using the composite dataset function in BioNumerics (Applied Maths) to make a complete profile. Only bands with intensities of 3 % or more were scored as present. DNA banding patterns were compared using Dice similarity indices to identify major contributors to the variation in fingerprints. Quantitative PCR results for bifidobacteria were compared independent of fractional absorption to look for treatment effects. This separate analysis was needed because faecal samples could not be collected in 12 h time intervals like urine. A general linear model including sequence, ID nested within sequence, treatment and phase was used for this analysis.
Data were removed from analyses in the event of antibiotic use, fractional Ca absorption resulting in values < 0 or >1·0 for specific 12 h urine samples and non-compliant sample collection. In the event of antibiotic use, subject data were excluded for the phase during which antibiotics were prescribed as well as the following phase to account for any residual effects on faecal bacteria. Statistical significance was set at P< 0·05.
Results
A total of thirty-one healthy girls participated in the present study (Fig. 1). Of these, six subjects withdrew from the study (four were lost before treatment randomisation and two dropped out after the second treatment phase). Physical and clinical health characteristics of these participants were within normal ranges (Table 3).
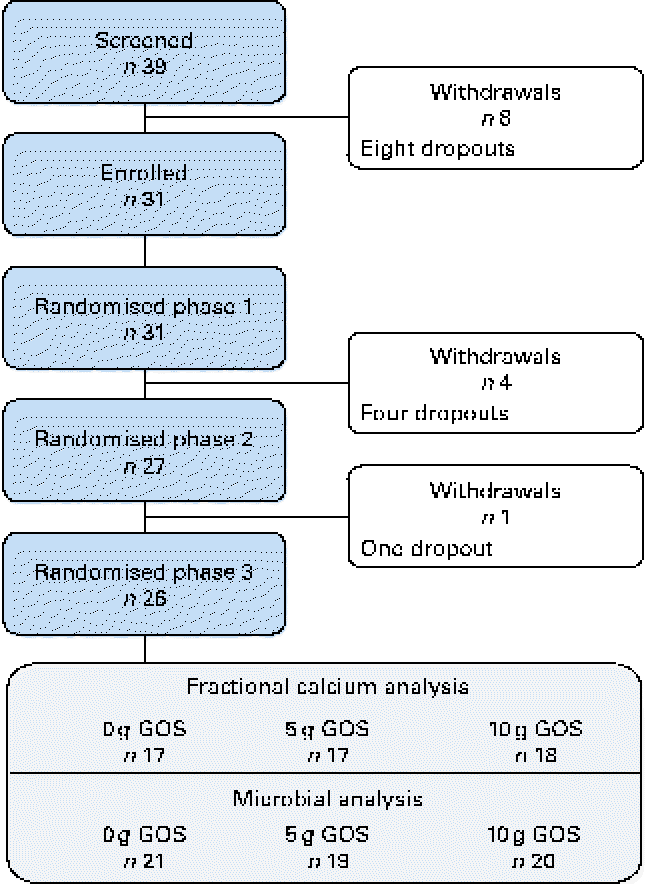
Fig. 1 Flow of participants through each phase of the study. Fractional calcium analysis: variation in the number of subjects is due to the omission of data from phases in which participants were non-compliant, taking antibiotics (subject data were excluded for the phase during which antibiotics were prescribed as well as the following phase to account for residual effects) or if calculated fractional calcium absorption was >1·00. Microbial analysis: difference in the final number of subjects due to non-compliant faecal sample collection. GOS, galacto-oligosaccharides. (A colour version of this figure can be found online at http://www.journals.cambridge.org/bjn.)
Table 3 Baseline anthropometric and biochemical characteristics of the participants (Mean values and standard deviations, n 31)
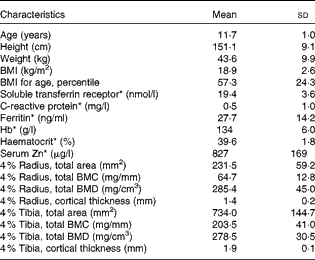
BMD, bone mineral density.
* Reference ranges: soluble transferrin receptor, 8·8–28·1 nmol/l; C-reactive protein, 0·0–4·0 mg/l; ferritin, 10·0–291·0 ng/ml; Hb, 120–150 g/l; haematocrit, 35·0–45·0 %; serum Zn, 700–1500 μg/l.
Habitual dietary intakes
Diet records showed that participants habitually consumed approximately 1010 mg/d Ca and 13·8 (sd 7·4) g/d dietary fibre (Table 4). Habitual Ca intakes fell below the RDA of 1300 mg/d, but were higher than intakes reported from National Health and Nutrition Examination Survey (NHANES) data (988 6 (sd 47·1) mg/d) for girls 9–13 years of age( Reference Bailey, Dodd and Goldman 2 ).
Table 4 Habitual dietary intakes of participants from 6 d diet records* (Mean values and standard deviations; minimum and maximum values)

* Only values for individuals who completed the 6 d diet record were included (n 27).
† Average intake was estimated by averaging daily values from the 6 d diet record.
Fracture history and peripheral quantitative computer tomography
Of the study subjects, nine reported a fracture history during screening, having incurred one or more fractures >6 months before the study. Table 3 summarises bone density results of the distal radius, measured by peripheral quantitative computer tomography. The mean radius total density and trabecular density, for which there are reference data, were within the normal range based on sex-specific reference centile curves for age and height. The ranges in z-scores for total density and trabecular density of the radius were − 2·2 to 2·5 and − 0·2 to 3·7, respectively.
Self-reported gastrointestinal symptoms
Mean scores for abdominal pain, bloating, flatulence and diarrhoea were all below 1, which represented hardly any gastrointestinal symptom (Fig. 2). There were no significant differences among the groups receiving 0, 5 or 10 g/d of GOS, for any of these symptoms. Bowel movement frequency was reported as every other day to once per d for all treatment groups and did not change with weekly surveys. Mean bowel movement consistency was reported normal across all the three phases with no differences across the 3 weeks of each treatment period.
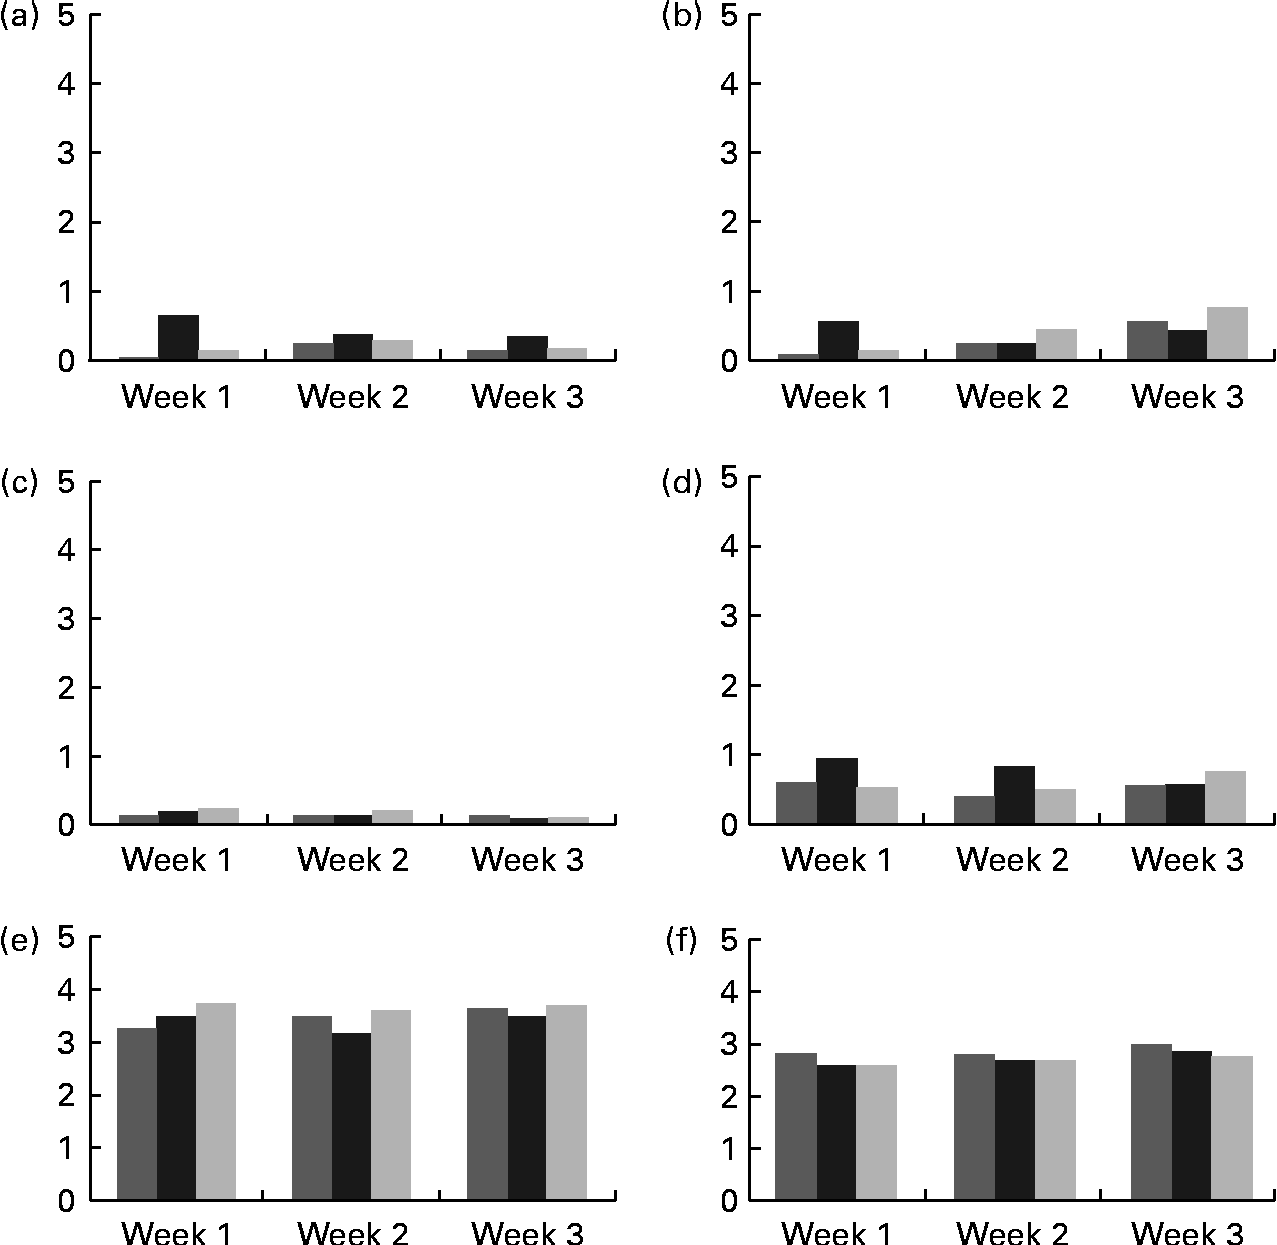
Fig. 2 Self-reported mean gastrointestinal symptoms collected from weekly surveys. (a) Bloating, (b) abdominal pain, (c) diarrhoea, (d) flatulence, (e) bowel movement frequency and (f) bowel movement consistency. Scoring key for (a)–(d): 0, none; 1, slight; 2, mild; 3, moderate; 4, moderately severe; 5, severe. Frequency scoring key for (e) and (f): 0, no bowel movement; 1, once/week; 2, twice/week; 3, every other day; 4, once/d; 5, more than once/d. Consistency key for (e) and (f): 0, diarrhea; 1, soft, semi-solid; 2, soft, solid; 3, normal; 4, hard but passes easily; 5, hard with constipation. ![]() , 0 g GOS;
, 0 g GOS; ![]() , 5 g GOS; ■, 10 g GOS.
, 5 g GOS; ■, 10 g GOS.
Methane producers
Of the study participants, eight were confirmed as methane producers with a methane threshold >1 parts per million. χ2 analysis indicated that the GOS-induced increase or decrease of fractional Ca absorption was not related to the methane status (P= 0·71).
Fractional calcium absorption
Fractional Ca absorption data, determined in four consecutive 12 h urine aliquots, suggested a significant (P= 0·0132) treatment effect (Table 5). Over all time points, 5 and 10 g GOS/d had significantly greater effects on fractional Ca absorption, but the response was not dose-dependent. Three-compartment kinetic modelling resulted in mean fractional Ca absorption over the 48 h test period for control, 5 and 10 g GOS of 0·393 (sd 0·092), 0·444 (sd 0·086) and 0·419 (sd 0·099), respectively. In turn, the improvements to fractional Ca absorption with the 5 g and 10 g treatments accounted for increases of 13·0 and 6·6 %. Linear analysis also revealed a significant time effect (P< 0·0001) for fractional Ca absorption (Fig. 3). Ca absorption peaked in the 24–36 h urine aliquot, resulting in significantly greater absorption than the earlier time points. Fractional Ca absorption remained elevated in the final urine aliquot (36–48 h), but did not differ significantly from the 24–36 h aliquot. Urinary total Ca excretion was unaffected by the presence of GOS (Table 5).
Table 5 Comparison of mean calcium absorption from the general linear model evaluating all 12 h urine aliquots together* (Mean values and standard deviations)

GOS, galacto-oligosaccharides.
* Urine sample aliquots are 12 (0–12), 24 (12–24), 36 (24–36) and 48 (36–48) h. Four subjects were treated with antibiotics during phase 2. Data from phase 2 and phase 3 were excluded from the analysis for these participants. Phases where subjects were non-compliant, measured by urine creatinine levels, were excluded from the analysis. Six subjects were excluded for non-compliance measured by urine creatinine. Two specific time points were excluded from the analysis for individual subjects when fractional absorption values were physiologically implausible (fractional absorption that was negative or greater than 1·00).
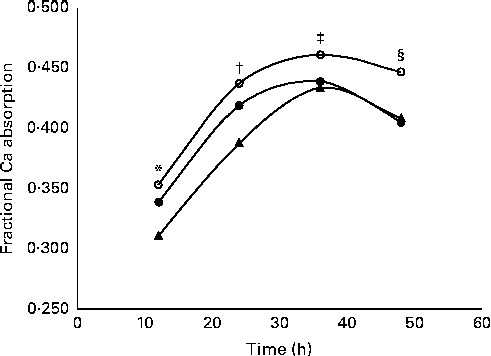
Fig. 3 Effect of time on mean fractional calcium absorption measured in 12 h urine aliquots. Girls treated twice daily with 2·5 g galacto-oligosaccharides (GOS, 5 g, ![]() ); girls treated twice daily with 5 g GOS (10 g,
); girls treated twice daily with 5 g GOS (10 g, ![]() ); girls treated twice daily with 0 g GOS (0 g,
); girls treated twice daily with 0 g GOS (0 g, ![]() ). General linear analysis was used to assess the effect of time on fractional calcium absorption (P< 0·0001) and least significant difference post hoc comparisons were used to compare differences in fractional calcium absorption by time point (time effect for all treatments: * 12 h, † 24 h, ‡ 36 h, § 48 h; P< 0·05).
). General linear analysis was used to assess the effect of time on fractional calcium absorption (P< 0·0001) and least significant difference post hoc comparisons were used to compare differences in fractional calcium absorption by time point (time effect for all treatments: * 12 h, † 24 h, ‡ 36 h, § 48 h; P< 0·05).
Microbial analysis and bacterial community
There were only twenty subjects included in the microbial analysis section because some subjects did not produce any faecal samples during the clinic visits or they were taking antibiotics. Of these twenty subjects, all but one submitted a faecal sample before the start of the study treatments (N). This subject was kept in the present analysis. During the clinic visit, the number of samples collected from each subject for each treatment varied from one to three, and the total number of samples available for microbiota analysis varied from three to eight per subject across all treatments and baseline.
PCR-DGGE profiles from twenty adolescent girls were produced from samples collected before (N) and after 3 weeks of consuming the GOS treatments (0, 5 and 10 g/d) using 16S rRNA gene universal primers. Regardless of the treatment, the number of bands in a faecal bacterial community profile was similar, ranging from 16 to 35 (Table 6). There was no significant difference in average band numbers in profiles from subjects after they consumed the different GOS treatments, indicating that total dominant bacterial population numbers within communities were not influenced by GOS.
Table 6 Average number of bands in bacterial PCR–denaturing gradient gel electrophoresis fingerprint profiles before (N) and after the dietary galacto-oligosaccharide treatments (0, 5 and 10 g/d)* (Number of bands and standard deviations)
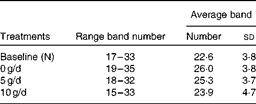
* No significant difference in band numbers (P>0·05).
Similarities between fingerprint profiles within and between the subjects are illustrated in the dendrogram (using UPGMA; Unweighted Pair Group Method with Arithmetic Mean) of Dice similarity values (Fig. 4). A comparison of PCR-DGGE profiles from all subjects indicates that there is more similarity within each individual than by treatments (Fig. 4). Although specific bands distinguished treatments within an individual, these bands were not common to all subjects undergoing similar GOS treatments.
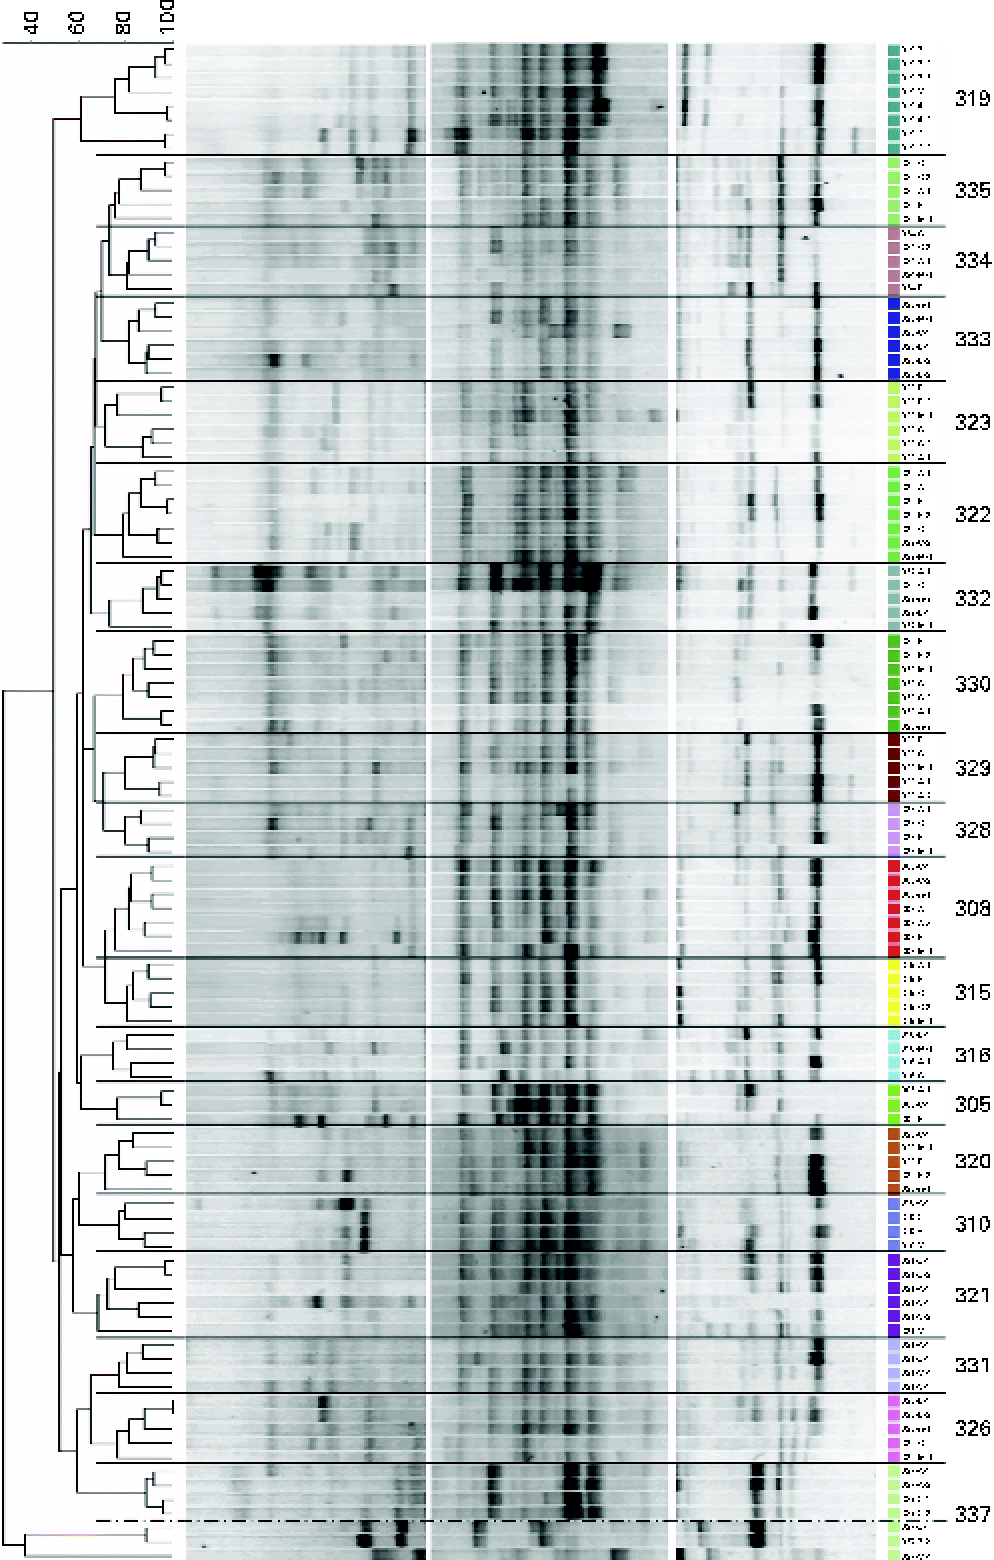
Fig. 4 Dendrogram of the denaturing gradient gel electrophoresis profiles of adolescent girls before (N) and after the three galacto-oligosaccharides treatments (A, 5 g GOS/d; B, 10 g GOS/d; C, control). Cluster analysis (UPGMA) using the Dice similarity index. Profiles were from all faecal samples collected on the last 3 d of each treatment. Bands were separated using the denaturing gradients 35–56 and 25–75 %. (A colour version of this figure can be found online at http://www.journals.cambridge.org/bjn).
Dice similarity values between subjects typically ranged from 15 to 87 % after the treatment and 19 to 74 % before starting any treatment. Dice similarity values within subjects typically ranged from 55 to 100 %, with the exception of one subject showing a similarity of 34 %. In addition, the UPGMA clustering of the PCR-DGGE profiles within each subject indicated that the patterns were grouped by treatment (Fig. 4). This trend was seen in all the subjects examined.
Bifidobacteria quantification
Quantitative PCR using bifidobacteria-specific primers indicated that all subjects in the present study contained detectable levels of this bacterial group before and after the dietary treatment. After the dietary intervention, significant increases in bifidobacteria occurred (Table 7). The change in bifidobacteria, independent of the unit used, was significantly greater in subjects consuming the 5 g/d of GOS treatment compared with the control and 10 g/d of GOS treatments. The total bacterial copies were only significantly different when expressed as copies/ng faeces (P= 0·0043) with the 5 g/d of GOS treatment resulting in greater amounts than the 10 g GOS and control treatments.
Table 7 Changes in bifidobacteria and total bacteria 16S ribosomal RNA gene copy numbers in subjects after the treatment with galacto-oligosaccharides (GOS)† (Mean values and standard deviations)

a,b,cMean values with unlike superscript letters were significantly different for treatment effects (P< 0·05).
* Mean values were not significantly different for treatment effects (P>0·05).
† Comparisons were performed using linear models and post hoc t test. Quantitative PCR efficiencies >90 %, R 2 of standard curves >0·996 with slopes ranging from − 3·181 to − 3·586.
Determinants of calcium absorption
Over all time points, the difference in fractional Ca absorption between the GOS and control treatments was inversely correlated with fractional Ca absorption during the control period (r − 0·51, P< 0·0001). Fractional Ca absorption on the control was significantly correlated with fractional Ca absorption response to 5 g/d of GOS at 12 h (r − 0·65, P= 0·03), 24 h (r − 0·70, P= 0·02) and 48 h (r − 0·66, P= 0·03) (Table 8) but not for the fractional Ca absorption response to 10 g/d of GOS.
Table 8 Galacto-oligosaccharides (GOS) response and fractional calcium absorption correlations*
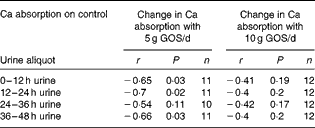
* Pearson's correlations (P< 0·05).
Discussion
Adaptation to GOS supplementation for 3 weeks significantly affected Ca absorption and faecal microbe profiles in pre-adolescent girls habitually consuming at or near the daily recommended Ca intake. There was no dose–response effect; treatment with 5 g/d of GOS elicited maximal benefit on fractional Ca absorption and bifidobacteria levels in the lower gut.
Calcium absorption
We observed a significant increase in Ca absorption with the consumption of 5 g/d of GOS. This suggests that a dose of 5 g GOS/d may be more effective at increasing Ca absorption in growing, pre-menarcheal girls than 10 g/d of GOS.
Mean fractional Ca absorption values from our model that used all time points for the control, 5 and 10 g/d of GOS treatments were 0·393 (sd 0·092), 0·444 (sd 0·086) and 0·419 (sd 0·099), respectively. The benefit of treatment with 5 and 10 g/d of GOS was 13·0 and 6·6 %, respectively. This is of similar magnitude to the 8·3 % increase in fractional Ca absorption in postmenopausal women consuming 5 g/d of lactulose( Reference Van den Heuvel, Muijs and van Dokkum 31 ). This study is the only other study to investigate a dose–response using 5 and 10 g non-digestible oligosaccharide treatments, but unlike the present study in girls, the postmenopausal women consuming 10 g/d of lactulose had an additional 16·2 % increase over the 5 g treatment( Reference Van den Heuvel, Muijs and van Dokkum 31 ). Whether the lack of a dose–response effect in girls was due to the difference in age of the two study groups or is an anomaly requires further research.
In animals, dose-dependent effects on Ca absorption have been reported for inulin-type fructans( Reference Levrat, Rémésy and Demigné 7 ), lactulose( Reference Brommage, Binacua and Antille 32 ) and galacto-oligosaccharides( Reference Weaver, Martin and Nakatsu 13 ). Although GOS effects on Ca absorption were not dose-dependent in the present study, data in rats have shown that GOS treatment has positive effects on bone independent of Ca absorption( Reference Chonan, Matsumoto and Watanuki 11 – Reference Weaver, Martin and Nakatsu 13 ). Trabecular-rich bones received the greatest benefit among 4-week-old male rats fed 0–8 % GOS through decreased caecal pH, increased caecal wall and content weight, and a greater proportion of bifidobacteria( Reference Weaver, Martin and Nakatsu 13 ). In addition, we previously reported that soluble maize fibre and soluble fibre dextrin positively influenced measures of bone geometry and strength in growing rats, independent of changes in Ca absorption( Reference Weaver, Martin and Story 33 ). Lactulose stimulated Ca absorption in caecectomised rats( Reference Brommage, Binacua and Antille 32 ), as the caecum is not essential for the stimulatory effects of vitamin D( Reference Brommage, Binacua and Carrié 34 ). In relation to prebiotics, fructo-oligosaccharide influences Ca absorption in the caecum of rats( Reference Ohta, Ohtuki and Takizawa 35 ), but adaptation to the treatment has been reported in rats after 28–30 d of fructo-oligosaccharide feeding( Reference Pérez-Conesa, López and Abellán 10 ), presumably through the down-regulation of the vitamin D endocrine system. Perhaps the independent bone effects seen in rats fed soluble fibres are the result of adaptation of the vitamin D system after 12 weeks of treatment. Effects on bone changes are not available in the present study cohort as bone measures were only assessed at baseline, and longer study duration is necessary to measure changes in human bone, making it difficult to speculate on the skeletal effects of GOS in the present study. Similarly, while vitamin D status did not differ after the treatment, other markers of the vitamin D endocrine system were not assessed.
The measurement of fractional Ca absorption in the urine over 48 h by 12 h urine samples allowed us to determine how absorption was affected by GOS as Ca was transported along the gut. Previous research has suggested that non-digestible oligosaccharides are poorly absorbed in the small intestine and later undergo acidic fermentation in the caecum and colon of rats which improves Ca absorption in the large intestine( Reference Younes, Coudray and Bellanger 36 ). Van den Heuvel et al. ( Reference Van den Heuvel, Muys and van Dokkum 37 ) found that a 36 h, rather than 24 h( Reference van den Heuvel, Schaafsma and Muijs 15 ), urine collection was necessary to measure this late fraction of absorbed Ca. We observed a peak in fractional Ca absorption in the urine pool collected between 24 and 36 h, which supports lower gut effects.
The approximate 10 % increase in absorption with 5 and 10 g/d of GOS in the present study equates to an additional 130 mg/d or 49 g/year of Ca being absorbed and available for deposition into the bone. Assuming that total body Ca in an adult skeleton is about 900 g, the increase we observed with GOS would account for approximately 5·4 % of the total skeleton. A long-term intervention reported a 6 % increase in Ca absorption in boys and girls consuming 8 g/d of Synergy1® (Orafti), which accounted for an additional absorption of 55 mg Ca/d( Reference Abrams, Griffin and Hawthorne 16 ). This study also resulted in a 35 g difference in bone mineral content after 1 year.
Mean Ca excretion measured in the 12 h urine aliquots ranged from 32 to 44 mg and was unaffected by treatment (P= 0·25). Thus, the increased Ca absorbed is not excreted and should lead to improved Ca retention. In rats, GOS increased Ca absorption dose-dependently, which led to increased Ca retention( Reference Weaver, Martin and Nakatsu 13 ). In postmenopausal women, Ca excretion was not altered with transgalacto-oligosaccharide intakes of 20( Reference van den Heuvel, Schoterman and Muijs 14 ) or 5 g/d and 10 g/d of lactulose( Reference Van den Heuvel, Muijs and van Dokkum 31 ). Similarly, no relationship was seen between Ca absorption and urinary Ca excretion in adolescent boys consuming 15 g/d of oligofructose( Reference Van den Heuvel, Muys and van Dokkum 37 ).
Few studies have investigated Ca absorption in response to modest prebiotic consumption such as the 5 g treatment used in the present study and the lactulose study described above in postmenopausal women( Reference Van den Heuvel, Muijs and van Dokkum 31 ). Griffin et al. ( Reference Griffin, Davila and Abrams 38 ) reported an 18 % increase in Ca absorption in 11–14-year-old girls in response to consuming 8 g/d of an inulin–oligofructose mixture. Similarly, Ca absorption in 9–13-year-old girls and boys consuming 8 g/d of a mixed short- and long-chain inulin-type fructan was 8·5 % greater than that on the control( Reference Abrams, Griffin and Hawthorne 16 ). Conversely, cereal fortified with 9 g/d of oligofructose-enriched inulin as part of a diet containing approximately 1500 mg/d of Ca in 11–13-year-old girls did not increase Ca absorption compared with a cereal without the non-digestible oligosaccharides( Reference Martin, Braun and Wigertz 39 ). Most studies have used >10 g fibre( Reference van den Heuvel, Schoterman and Muijs 14 , Reference van den Heuvel, Schaafsma and Muijs 15 , Reference Younes, Coudray and Bellanger 36 , Reference Coudray, Bellanger and Castiglia-Delavaud 40 – Reference Tahiri, Tressol and Arnaud 45 ). Fructan fibres have also been proven effective in lower amounts between 1·1 and 1·75 g/d in postmenopausal women and young adults( Reference Adolphi, Scholz-Ahrens and Vrese 46 , Reference Lopez-Huertas, Teucher and Boza 47 ). However, these fructans were combined with other possible absorption enhancers such as casein phosphopeptides. Therefore, further study of low prebiotic doses is important to translate to practical levels for consumers.
Gut microbe analysis
Bifidobacteria as a percentage of total bacteria increased with GOS treatment. Others have reported increases in faecal bifidobacteria and Lactobacillus species in animal models( Reference Tzortzis, Goulas and Gee 48 , Reference Rodriguez-Cabezas, Camuesco and Arribas 49 ) and human subjects( Reference Ben, Li and Feng 50 , Reference Bouhnik, Raskine and Simoneau 51 ) in response to prebiotic consumption generally, and specifically with GOS consumption( Reference Bouhnik, Flourie and D'Agay-Abensour 4 , Reference Weaver, Martin and Nakatsu 13 , Reference Walton, van den Heuvel and Kosters 52 , Reference Moro, Minoli and Mosca 53 ), and a dose–response effect was observed in both rats( Reference Weaver, Martin and Nakatsu 13 ) and adult human subjects( Reference Davis, Martinez and Walter 54 ). Our lack of a dose–response effect of the microbiota to GOS may represent a difference between adolescents and adults or a spurious observation. A potential threshold effect may also explain the lack of a dose–response where the difference in bifidobacteria proportion between the GOS and control treatments was inversely correlated with bifidobacteria proportions during the control period (r − 0·54, P= 0·0001). While GOS increased the proportion of bifidobacteria, inverse correlation suggests that individuals with naturally higher quantities of bifidobacteria may only experience an increase up to a certain threshold level.
Determinants of calcium absorption
Few studies have attempted to explore potential determinants of Ca absorption in relation to prebiotic consumption. Using multiple regression analysis, Griffin et al. ( Reference Griffin, Hicks and Heaney 30 ) found Ca absorption on placebo as the only factor that explained the difference in fractional absorption with Synergy1® and placebo. Other factors included in the model, which have known associations with Ca absorption including, weight, height, age, race and Tanner stage, did not explain the beneficial response of Synergy1®. This finding is similar to the results from the present study as the fractional absorption response with 5 g/d of GOS was inversely correlated with fractional Ca absorption on control at 12, 24 and 48 h (r< − 0·65, P< 0·05), but not in response to 10 g/d of GOS over all time intervals. No correlations between the benefit of GOS and variables related to diet, anthropometrics, physical fitness and gut bacteria were found; however, this may be due to the small variable ranges and sample size.
The strengths of the present study included the cross-over design and controlled diets during the assessment of fractional Ca absorption by dual stable isotope techniques. Additionally, product compliance during the present study suggests the ease and feasibility of consuming GOS in daily life. This is especially important because prebiotics only cause transient changes in gut microbiota and therefore Ca absorption also. The high acceptance of GOS in the present study suggests that individuals could easily maintain consumption in the long term to obtain prolonged benefits for bone health. The limitations of the present study include the small sample size. Therefore, it was not possible to further explore the determinants of GOS-induced increases in Ca absorption in a multivariate model. Moreover, the number of faecal samples for microbiota fingerprint profiling was limited due to the shortened clinical visits.
Conclusion
In pre-menarcheal girls, twice daily consumption of GOS had positive, but no dose–response, effects on fractional Ca absorption and gut bifidobacteria. The response to GOS in fractional Ca absorption occurred as late phase absorption between 24 and 36 h, characteristic of lower gut absorption. Supplementation with 5 g/d of GOS improved Ca absorption and may increase peak bone mass accrual during adolescence by influencing microbial communities in the lower gut.
Acknowledgements
The present study was supported by FrieslandCampina, Stationsplein 4, Amersfoort, The Netherlands. The authors' responsibilities were as follows: C. M. Weaver, B. R. M., C. H. N., E. G. H. M. v. d. H., M. H. C. S., G. P. M. and L. D. M. designed the study; C. M. Whisner, B. R. M., C. H. N. and C. M. Weaver carried out the study; C. M. Whisner, B. R. M. and C. H. N. analysed the data; C. M. Whisner, C. M. Weaver and C. H. N. prepared the manuscript; B. R. M. assisted in writing the manuscript. All authors evaluated the manuscript and contributed their comments. E. G. H. M. v. d. H. and M. H. C. S. are employees of FrieslandCampina and C. M. Weaver serves on the Advisory Board of Pharmavite. All other authors have no conflicts of interest.


