Introduction
Palmer amaranth (Amaranthus palmeri S. Watson) is one of the most troublesome weeds in North America (Van Wychen Reference Van Wychen2016) and has the capacity to rapidly evolve resistance to herbicides. Resistance to 5-enolpyruvylshikimate-3-phosphate synthase (EPSPS), acetolactate synthase (ALS), and photosystem II (PSII) inhibitors has become widespread (Meyer et al. Reference Meyer, Norsworthy, Young, Steckel, Bradley, Johnson, Loux, Davis, Kruger, Bararpour, Ikley, Spaunhorst and Butts2015), and protoporphyrinogen oxidase (PPO) inhibitors (WSSA Group 14) have become a herbicide option for growers interested in controlling A. palmeri and waterhemp [Amaranthus tuberculatus (Moq.) J. D. Sauer] in soybean [Glycine max (L.) Merr.] (Owen and Zelaya Reference Owen and Zelaya2005; Rousonelos et al. Reference Rousonelos, Lee, Moreira, VanGessel and Tranel2012). PPO-inhibiting herbicides prevent the conversion of protoporphyrinogen IX to protoporphyrin IX by the plastid-localized PPO (PPX2), a dual-targeting (chloroplast and mitochondria) enzyme in Amaranthus species (Dayan et al. Reference Dayan, Barker and Tranel2017; Jacobs and Jacobs Reference Jacobs and Jacobs1993; Matringe et al. Reference Matringe, Camadro and Scalla1989). However, as with other sites of action (SOAs), repeated use of PPO inhibitors for A. palmeri control has resulted in the evolution of resistance to this class of herbicides. PPO-inhibitor resistance in A. palmeri was first reported in Arkansas (Salas et al. Reference Salas, Burgos, Tranel, Singh, Glasgow, Scott and Nichols2016).
Amaranthus tuberculatus and A. palmeri have evolved resistance to herbicides through target-site or non–target site mechanisms, and being closely related, have the propensity to evolve the same resistance mechanisms (Heap Reference Heap2018; Ma et al. Reference Ma, Kaundun, Tranel, Riggins, McGinness, Hager, Hawkes, McIndoe and Riechers2013; Nakka et al. Reference Nakka, Godar, Thompson, Peterson and Jugulam2017a, Reference Nakka, Godar, Wani, Thompson, Peterson, Roelofs and Jugulam2017b; Oliveira et al. Reference Oliveira, Gaines, Dayan, Patterson, Jhala and Knezevic2017). The more common target-site resistance (TSR) mechanism involves a single amino acid change in the target enzyme preventing herbicide binding (Powles and Yu Reference Powles and Yu2010; Tranel and Wright Reference Tranel and Wright2002) or could be due to target-site gene amplification or overexpression resulting in the large-scale production of target-site protein by the resistant plant (Gaines et al. Reference Gaines, Zhang, Wang, Bukun, Chisholm, Shaner, Nissen, Patzoldt, Tranel, Culpepper, Grey, Webster, Vencill, Sammons, Jiang, Preston, Leach and Westra2010). Because of its complex nature, non–target site resistance (NTSR) is poorly understood and is considered a greater threat to herbicide sustainability. In plants, NTSR can be due to decreased herbicide uptake; reduced herbicide translocation; increased herbicide detoxification (metabolism) due to cytochrome P450 monooxygenases (P450s), glutathione S-transferases (GSTs), or glucosyltransferases; or sequestration into vacuoles (Powles and Yu Reference Powles and Yu2010; Yuan et al. Reference Yuan, Tranel and Stewart2007). Out of these, metabolic resistance is the most commonly reported non–target site mechanism (Ma et al. Reference Ma, Kaundun, Tranel, Riggins, McGinness, Hager, Hawkes, McIndoe and Riechers2013; Yu and Powles Reference Yu and Powles2014). The NTSR mechanisms in weeds have been reported for several herbicides, including acetyl coenzyme A carboxylase, PSII, 4-hydroxyphenylpyruvate dioxygenase (HPPD), EPSPS, and ALS inhibitors (Guo et al. Reference Guo, Riggins, Hausman, Hager, Riechers, Davis and Tranel2015; Han et al. Reference Han, Yu, Owen, Cawthray and Powles2016; Kaundun et al. Reference Kaundun, Hutchings, Dale, Howell, Morris, Kramer, Shivrain and Mcindoe2017; Ma et al. Reference Ma, Kaundun, Tranel, Riggins, McGinness, Hager, Hawkes, McIndoe and Riechers2013; Nakka et al. Reference Nakka, Godar, Thompson, Peterson and Jugulam2017a, Reference Nakka, Godar, Wani, Thompson, Peterson, Roelofs and Jugulam2017b; Preston and Wakelin Reference Preston and Wakelin2008; Yu et al. Reference Yu, Abdallah, Han, Owen and Powles2009).
In the case of PPO inhibitors, resistance has only been reported as a target-site mechanism. The first target-site mechanism conferring PPO-inhibitor resistance was initially reported in A. tuberculatus and involved a codon deletion in the PPX2 gene, resulting in the loss of a glycine residue at the 210th position (ΔG210) of the PPO enzyme (Lee et al. Reference Lee, Hager and Tranel2008; Patzoldt et al. Reference Patzoldt, Hager, McCormick and Tranel2006). The codon deletion was subsequently found in A. palmeri (Salas et al. Reference Salas, Burgos, Tranel, Singh, Glasgow, Scott and Nichols2016); however, several missense mutations have since been reported. First, an arginine to glycine/methionine at position 128 in the PPO enzyme (R128G/M) was reported to confer PPO-inhibitor resistance (Giacomini et al. Reference Giacomini, Umphres-Lopez, Nie, Mueller, Steckel, Young and Tranel2017). More recently, glycine to alanine (G399A), glycine to glutamic acid (G114E), and serine to isoleucine (S149I) substitutions in the PPX2 gene were shown to confer broad-spectrum resistance to PPO inhibitors in A. palmeri (Rangani et al. Reference Rangani, Salas, Aponte, Landes and Roma-Burgos2018). A statewide survey recently conducted in Arkansas revealed widespread fomesafen resistance in A. palmeri, and the mechanism was predominantly target-site based (Varanasi et al. Reference Varanasi, Brabham, Norsworthy, Nie, Young, Houston, Barber and Scott2018). High frequencies of the ΔG210 and R128G mutations were reported (49% and 28% of accessions, respectively) in Arkansas (Varanasi et al. Reference Varanasi, Brabham, Norsworthy, Nie, Young, Houston, Barber and Scott2018). However, several accessions with no known target-site mutations for fomesafen resistance were found, indicating the presence of an NTSR mechanism. Recently, the mechanism for carfentrazone-ethyl resistance in an A. tuberculatus population from Illinois was suggested to be NTSR based (Obenland et al. Reference Obenland, Ma, O’Brien, Lygin and Riechers2017). However, there are no reports of any NTSR mechanism for PPO inhibitors in A. palmeri. The objectives of this study were therefore (1) to confirm the NTSR mechanism in a fomesafen-resistant accession, (2) to determine the level of fomesafen resistance in the putative NTSR accession, and (3) to characterize the NTSR mechanism present in the accession.
Materials and Methods
Plant Materials
The putative resistant accession was originally collected in 2016 from a soybean field in Randolph County, AR (RCA). Throughout this paper, the term “RCA” will be used to refer to the putative resistant accession. To create a homogeneous RCA population, about 200 seedlings of the original accession and a susceptible check (S) were sprayed with fomesafen (Flexstar® 1.88 EC, Syngenta, Greensboro, NC) at 395 g ai ha−1. The RCA survivors were allowed to grow and produce seed in the growth chamber. Seed produced from surviving plants was used for conducting cytochrome P450- and GST-inhibitor studies in the greenhouse.
Experiments were conducted in greenhouses located at the Altheimer Laboratory, University of Arkansas, Fayetteville. In all the experiments, seeds were germinated in plastic trays (25 cm by 55 cm), and at 1 wk after germination, seedlings at the 1- to 2-leaf stage were transplanted into 50-well plastic trays (25 cm by 55 cm) filled with potting mix (Sunshine® premix No. 1, Sun Gro Horticulture, Bellevue, WA). Plants were grown in the greenhouse under a 16-h photoperiod and 35/25 C day/night temperature.
Whole-Plant Fomesafen Dose–Response Experiments
To determine the level of resistance in the RCA accession, seedlings generated in the greenhouse from the field-collected seed lot were treated at the 4- to 6-leaf stage with increasing rates of fomesafen. The following rate structures were used for the RCA and a known susceptible based on the 1X rate of 395 g ai ha−1: 0.06X, 0.12X, 0.25X, 0.5X, 1X, 2X, 4X, 8X, and 0.003X, 0.007X, 0.015X, 0.03X, 0.06X, and 0.12X, respectively. A nonionic surfactant was included at 0.25% v/v in all treatments. Treatments were applied using a research track sprayer equipped with two flat-fan spray nozzles (TeeJet® spray nozzles, Spraying Systems, Wheaton, IL) calibrated to deliver 187 L ha−1 of herbicide solution at 269 kPa, moving at 1.6 km h−1. Experiments were conducted three times with 15 plants evaluated per treatment in each run. Aboveground dry biomass was collected at 3 wk after treatment (WAT), and data were expressed as a percentage of the nontreated control. Data were analyzed using the ‘drc’ package in R v. 3.1.2 (R Development Core Team 2017). The relationship between herbicide rate and aboveground dry biomass was established using a four-parameter log-logistic model (Seefeldt et al. Reference Seefeldt, Jensen and Fuerst1995) described as follows:
where Y is the response (aboveground dry biomass) expressed as a percentage of the nontreated control, C is the lower limit of Y, D is the upper limit of Y, b is the slope of the curve around the GR50 (effective herbicide dose for 50% biomass reduction), and x is the herbicide dose. The resistance index (Resistance/Susceptibility [R/S]) was calculated using GR50 values.
Screening for Target-Site Resistance in the PPX Genes
Young leaf tissue from the survivors of a fomesafen treatment (395 g ai ha−1) were collected in 1.5-ml microfuge tubes (Thermo Fisher Scientific, Waltham, MA) and stored at −80 C until use. Genomic DNA (gDNA) was isolated from the leaves using a modified CTAB (cetyl trimethylammonium bromide) protocol (Doyle and Doyle Reference Doyle and Doyle1987). The quantity and quality of gDNA was determined with a spectrophotometer (NanoDrop 1000, Thermo Fisher Scientific) and agarose gel electrophoresis.
For RNA, the frozen leaf tissue was homogenized in liquid nitrogen using a prechilled mortar and pestle to prevent thawing. The powdered tissue was transferred to a 1.5-ml microcentrifuge tube, and total RNA was isolated using a TRIzol® reagent (Thermo Fisher Scientific). Ribonucleic acid was treated with DNase 1 enzyme (Thermo Fisher Scientific) to remove gDNA contamination. The isolated RNA was stored at −80 C. The quantity and quality (integrity) of total RNA was determined using a spectrophotometer (NanoDrop 1000, Thermo Fisher Scientific) and agarose gel (1%) electrophoresis. Complementary DNA (cDNA) was synthesized from 1 μg of the total RNA using a RevertAid First Strand cDNA Synthesis Kit (Thermo Fisher Scientific).
A TaqMan® quantitative polymerase chain reaction (qPCR) allelic discrimination assay was conducted to detect the presence or absence of the ΔG210 and R128G/M mutations in the PPX2 gene. TaqMan® qPCR was performed using a CFX 96 real-time detection system (Bio-Rad, Hercules, CA). For each assay, the qPCR reaction mix (10 μl) consisted of 2 μl of GoTaq® Flexi buffer (Promega, Madison, WI), 1.2 μl of 25 mM MgCl2 (Promega), 0.5 μl of 10 mM dNTP mix (Promega), 0.5 μl of primer-probe mix (custom TaqMan® SNP genotyping assay, Thermo Fisher Scientific), 0.1 μl GoTaq® Flexi DNA polymerase (Promega), 2 μl of gDNA (50 to 100 ng µl−1), and 3.7 μl of molecular-grade water. The qPCR conditions were 95 C for 3 min, 40 cycles of 95 C for 15 s, and 60 C for 1 min followed by a plate read on every cycle. The Bio-Rad CFX software was used to analyze the qPCR allelic discrimination data expressed in relative fluorescence units (RFUs). The TaqMan primer and probe combinations used for detection of the ΔG210 and R128G/M mutations were previously reported in Giacomini et al. (Reference Giacomini, Umphres-Lopez, Nie, Mueller, Steckel, Young and Tranel2017) and Varanasi et al. (Reference Varanasi, Brabham, Norsworthy, Nie, Young, Houston, Barber and Scott2018), respectively.
To validate the TaqMan data and determine whether the RCA accession contained any novel target-site mutation(s), the coding sequences (~1,500 bp) of the PPX2 and PPX1 genes were amplified from cDNA, sequenced, and analyzed by comparison with a known susceptible. Primers for PPX2 and PPX1 genes were designed using OligoAnalyzer v. 3.1 (IDT SciTools 2017; Integrated DNA Technologies, Coralville, IA), based on the sequence information available for A. tuberculatus (DQ386116.1 and DQ386115.1) (Table 1).
Table 1 Primers used for amplifying and sequencing the two isoforms of the protoporphyrinogen oxidase–coding gene PPX in Amaranthus palmeri, with the quantitative PCR primers used for measuring PPX2 gene expression in fomesafen-resistant (from Randolph County, AR) and susceptible biotypes also shown.

PCR was performed in a T100 thermal cycler (Bio-Rad). The 50-µl reaction consisted of 10 µl of 5X GoTaq Flexi buffer, 4 µl of 25 mM MgCl2, 1 µl of 10 mM dNTP mix, 0.25 µl of GoTaq Flexi DNA Polymerase, 1 µl each of forward and reverse gene-specific primers (Table 1), 2 µl of cDNA, and 30.75 µl of nuclease-free water. PCR conditions for amplifying the PPX2 gene were 95 C for 3 min, 35 cycles of 95 C for 30 s, 52 C for 30 s, and 72 C for 2 min, followed by 72 C for 8 min. The amplifying conditions for the PPX1 gene were similar, except for the annealing temperature of 55 C. The PCR products were purified using a GeneJet PCR purification kit (Thermo Fisher Scientific), and quantified with a NanoDrop spectrophotometer. The purified PCR products (50 ng ml−1) were sent for Sanger DNA sequencing (Genewiz, South Plainfield, NJ), and the resulting RCA and susceptible PPX1 and PPX2 sequences were aligned using MultAlin (Corpet Reference Corpet1988). The sequence data from this study have been submitted to GenBank under accession numbers MH160787 and MH160788, respectively.
Table 2 Effects of cytochrome P450 (malathion, PBO, amitrole) and glutathione S-transferase (NBD-Cl) inhibitors on the percent survival and biomass reduction of the RCA (fomesafen-resistant from Randolph County, AR) and susceptible (S) Amaranthus palmeri. a b

a Abbreviations: NBD-Cl, 4-chloro-7-nitrobenzofurazan; PBO, piperonyl butoxide.
b Means with no common letter(s) within a column are significantly different according to Fisher’s protected LSD test, where P<0.05.
c Survival % for RCA biotype was calculated based on the dead/alive counts of 150 plants (50 plants replication−1) taken 2 wk after fomesafen and P450- and GST-inhibitor treatments.
d Percent biomass reduction relative to nontreated control.
e Survival % for S biotype was calculated based on the dead/alive counts of 50 plants (10 plants replication−1) taken 2 wk after fomesafen and P450- and GST-inhibitor treatments.
An SYBR Green assay was also performed to study the expression of PPX2 gene in the RCA and S biotypes. Fresh leaf tissue was collected from the RCA biotype 3 d after the fomesafen treatment (survivors). Similarly, tissue from a known S biotype was collected and stored at −80 C. Total RNA was isolated and cDNA was synthesized using the protocol discussed earlier. The synthesized cDNA was used in a qPCR reaction for measuring the PPX2 gene expression. The qPCR reaction mix (10 µl) consisted of 5 µl of PowerUP SYBR Green mastermix (Applied Biosystems, Waltham, MA), 1 µl each of forward and reverse primers (5 µM), 1 µl of molecular-grade water, and 2 µl of cDNA. Primers for amplifying the PPX2 gene were designed based on the A. tuberculatus sequence information (DQ386116.1) available online (Table 1). PPX2 gene expression was normalized using β-tubulin as a reference gene (Godar et al. Reference Godar, Varanasi, Nakka, Prasad, Thompson and Jugulam2015). The qPCR conditions were 50 C for 2 min, 95 C for 2 min, and 40 cycles of 95 C for 30 s and 59 C for 1 min. A melt-curve profile was included following the thermal cycling protocol to determine the specificity of the qPCR reaction. PPX2:β-tubulin expression was determined using the 2ΔCt method, where Ct is threshold cycle and ΔCt is CtReference gene (β-tubulin) − CTTarget gene (PPX2). Gene expression was studied using three biological and three technical replicates.
Metabolic Resistance Screen
To test whether fomesafen resistance in the RCA accession is metabolic in nature, seedlings (4- to 6-leaf stage) were treated with the following cytochrome P450 inhibitors with or without fomesafen: malathion (Hi-Yield® Malathion, Hi-Yield Chemical, Bonham, TX) at 1,500 g ai ha−1; piperonyl butoxide (PBO; Exponent®, MGK, Minneapolis, MN) at 1,500 g ai ha−1; and amitrole (3-amino-1,2,4-triazole, Sigma-Aldrich, St Louis, MO) at 13.1 g ai ha−1. The rates selected for the cytochrome P450 inhibitors were based on the study conducted by Oliveira et al. (Reference Oliveira, Gaines, Dayan, Patterson, Jhala and Knezevic2017). All the cytochrome P450 inhibitors were applied 2 h before fomesafen treatment. Additionally, seedlings were treated with the GST inhibitor 4-chloro-7-nitrobenzofurazan (NBD-Cl; Sigma-Aldrich) at 270 g ai ha−1, either alone or in combination with fomesafen. NBD-Cl was applied to seedlings 2 d before fomesafen treatment. The NBD-Cl rate of 270 g ai ha−1 was chosen based on a study conducted in atrazine-resistant A. tuberculatus (Ma et al. Reference Ma, Evans and Riechers2016). A known S biotype (2001) was included as a check and treated with the above P450 and GST inhibitors. Based on the whole-plant dose−response experiments (discussed earlier), a 0.06X fomesafen rate was chosen for the S biotype. The experiment was conducted in three runs, each run consisting of five replications (10 plants replication−1). Aboveground dry biomass (oven-dried at 65 C for 3 d) was collected at 2 WAT and converted into biomass reduction (%) relative to the nontreated control. Additionally, percent survival was calculated based on dead/alive counts of 150 plants (50 plants replication−1) taken at 2 WAT.
ANOVA for biomass reduction (%) and survival (%) was performed using JMP Pro v. 13.1 software (SAS Institute, Cary, NC) after confirming normality and homogeneity of the data. The interaction between treatment and run was not significant; therefore, data for all runs were pooled for subsequent analysis. Fisher’s protected LSD test (where P<0.05) was used to separate the means.
Results and Discussion
Fomesafen Dose–Response Assay
Based on whole-plant dose–response studies, the RCA accession was confirmed resistant to the PPO inhibitor fomesafen (Figure 1). The fomesafen rate that caused 50% reduction in the aboveground dry biomass (GR50) of the susceptible biotype was 4.3 g ha−1, whereas for the RCA accession it was 77.8 g ha−1. Thus, based on the GR50 values, the resistance index (RCA/S) was estimated to be 18-fold. The level of fomesafen resistance due to ΔG210 deletion in A. palmeri was reported to be 21-fold (Salas et al. Reference Salas, Burgos, Tranel, Singh, Glasgow, Scott and Nichols2016). A recent study by Brabham et al. (Reference Brabham, Varanasi and Norsworthy2018) using a homozygous population revealed higher GR50 values (~2,500) for the ΔG210 genotype, indicating higher levels of fomesafen resistance. A broad range of R/S ratios (3 to 90) have been reported for A. tuberculatus and A. palmeri biotypes with metabolic resistance to ALS, HPPD, and PSII inhibitors, indicating that levels of NTSR could vary depending on the class of herbicide and weed species under investigation (Guo et al. Reference Guo, Riggins, Hausman, Hager, Riechers, Davis and Tranel2015; Hausman et al. Reference Hausman, Singh, Tranel, Riechers, Kaundun, Polge, Thomas and Hager2011; Kaundun et al. Reference Kaundun, Hutchings, Dale, Howell, Morris, Kramer, Shivrain and Mcindoe2017; Ma et al. Reference Ma, Kaundun, Tranel, Riggins, McGinness, Hager, Hawkes, McIndoe and Riechers2013; Oliveira et al. Reference Oliveira, Gaines, Dayan, Patterson, Jhala and Knezevic2017).
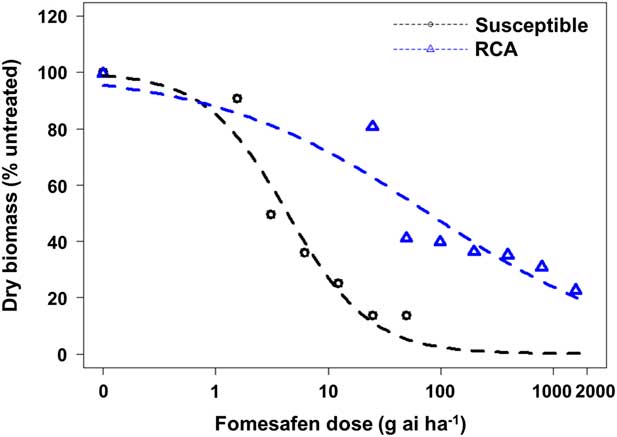
Figure 1 Dose–response assay using four-parameter log-logistic model for the Amaranthus palmeri RCA (fomesafen-resistant from Randolph County, AR) and susceptible accessions.
Screening for Target-Site Resistance
In plants, the PPX gene exists as two different orthologues, the plastidic PPX1 and the mitochondrial PPX2; both encode a PPO enzyme important for heme and chlorophyll biosynthesis (Beale and Weinstein Reference Beale and Weinstein1990; Lermontova et al. Reference Lermontova, Kruse, Mock and Grimm1997; Watanabe et al. Reference Watanabe, Che, Iwano, Takayama, Yoshida and Isogai2001). To date, all the target-site mutations (ΔG210, R128G/M, G399A, etc.), known to confer PPO-inhibitor resistance in broadleaf weeds have been reported in PPX2 and not PPX1 (Giacomini et al. Reference Giacomini, Umphres-Lopez, Nie, Mueller, Steckel, Young and Tranel2017; Patzoldt et al. Reference Patzoldt, Hager, McCormick and Tranel2006; Rangani et al. Reference Rangani, Salas, Aponte, Landes and Roma-Burgos2018). In this study, both PPX1 and PPX2 isoforms were analyzed for possible target-site mutations.
A TaqMan qPCR assay to screen for the target-site mutations ΔG210 and R128G/M was conducted on 40 plants from the RCA accession that survived fomesafen at 395 g ai ha−1. The assay revealed no ΔG210 and R128G/M mutations (Figure 2). Furthermore, sequencing of the PPX2 gene (~1,500 bp) from five RCA plants and one S plant confirmed the TaqMan results; no known (including G399A, G114E, and S149I; Rangani et al. Reference Rangani, Salas, Aponte, Landes and Roma-Burgos2018) or novel mutations conferring PPO-inhibitor resistance were identified (Figure 3). Similarly, no mutations were discovered in the PPX1 gene of the five RCA plants (unpublished data).
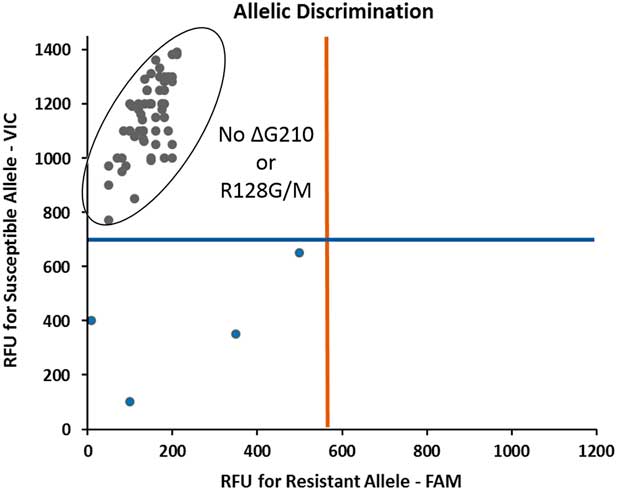
Figure 2 TaqMan quantitative PCR assay for detection of ΔG210 and R128G/M mutations in the PPX2 gene of the Amaranthus palmeri RCA (fomesafen-resistant from Randolph County, AR) biotype. Each of the gray dots at the top left corner of the scatter plot represents an individual plant that survived the field rate of fomesafen (Flexstar® at 395 g ha−1). Note the absence of any resistant alleles for ΔG210 and R128G/M mutations. The strength of the amplification signal is measured in terms of relative fluorescence units (RFU). Blue dots at the bottom left indicate no signal from the genomic DNA.

Figure 3 Sequencing of the PPX2 gene from five fomesafen-resistant (numbered 1, 2, 5, 10, and 11) Amaranthus palmeri individuals from the RCA (from Randolph County, AR) accession. Note the absence of ΔG210 (no glycine deletion) and R128G/M (no arginine substitutions) in the PPX2 gene sequence. cDNA sequences from the resistant plants were compared with a known susceptible (SUS).
The level of target-site PPX2 gene expression was analyzed in the RCA and S biotypes using qPCR (Figure 4). No significant difference in PPX2 gene expression was observed between the RCA and S biotypes, strongly suggesting a non–target site based fomesafen resistance mechanism in the RCA accession.

Figure 4 PPX2 gene expression levels in the RCA (fomesafen-resistant from Randolph County, AR) and susceptible (S) biotypes of Amaranthus palmeri. Gene expression was measured relative to the reference gene (β-tubulin). Data represent means of three biological samples, and errors bars represent SE.
Cytochrome P450 and GST Inhibitor Assays
The cytochrome P450 inhibitors (malathion, PBO, and amitrole) used in this study are known to target different P450 genes (Oliveira et al. Reference Oliveira, Gaines, Dayan, Patterson, Jhala and Knezevic2017). Increased biomass reduction and herbicide efficacy were observed in HPPD-resistant A. tuberculatus when malathion was applied in combination with mesotrione, tembotrione, or topramezone, indicating enhanced metabolism as an NTSR mechanism (Ma et al. Reference Ma, Kaundun, Tranel, Riggins, McGinness, Hager, Hawkes, McIndoe and Riechers2013; Oliveira et al. Reference Oliveira, Gaines, Dayan, Patterson, Jhala and Knezevic2017). Here, the cytochrome P450 inhibitors followed by (fb) fomesafen treatments showed varied effects on the survival and biomass reduction of the RCA accession (Table 2; Figure 5). PBO and amitrole treatments caused initial injury to the plants; however, the injury was transient, and plants recovered within a week. There were no injury symptoms due to malathion or NBD-Cl application alone. Malathion fb fomesafen resulted in 33% survival rate (P<0.05) and the greatest biomass reduction (86%, P<0.05) when compared with fomesafen applied alone (55% survival and 66% biomass reduction, P<0.05) (Table 2; Figure 6). Similarly, applications of PBO or amitrole fb fomesafen caused reductions in biomass (77% and 78%, respectively), even though survival rates (56% and 59%, respectively) were not different from fomesafen alone (Table 2; Figure 5). In contrast, no significant reduction in biomass and survival rates was observed in the S biotype after treatment with P450 inhibitors fb fomesafen (Table 2).
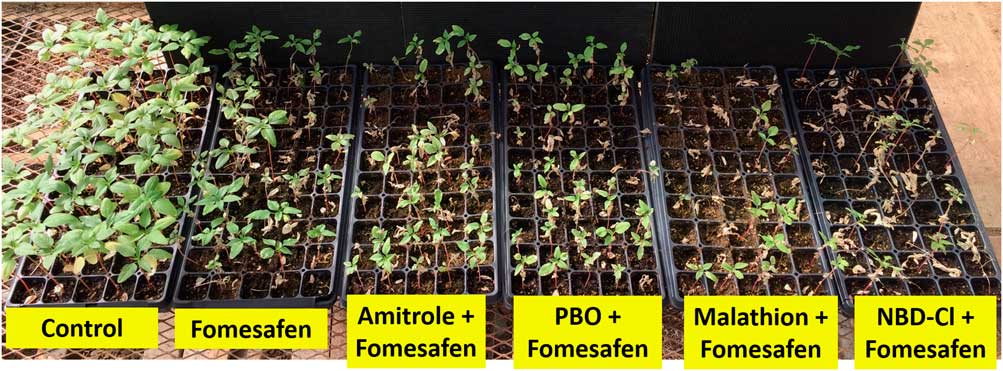
Figure 5 RCA (fomesafen-resistant Amaranthus palmeri biotype from Randolph County, AR) plants treated with P450 (amitrole, PBO, malathion) and glutathione S-transferase (NBD-Cl) inhibitors. The treatments included fomesafen (Flexstar® at 263 g ai ha−1) alone, amitrole (13.1 g ha−1) followed by (fb) fomesafen, PBO (1,500 g ai ha−1) fb fomesafen, malathion (1,500 g ha−1) fb fomesafen, and NBD-Cl (270 g ai ha−1) fb fomesafen. Amitrole, 3-amino-1,2,4-triazole; NBD-Cl, 4-chloro-7-nitrobenzofurazan; PBO, piperonyl butoxide.
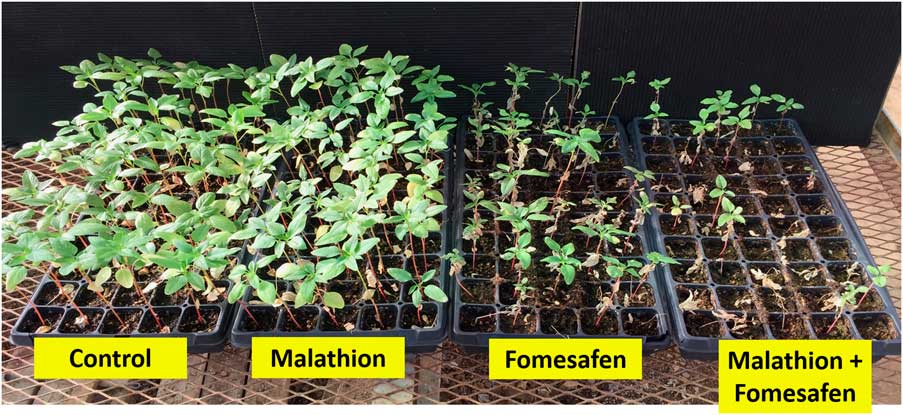
Figure 6 RCA (fomesafen-resistant Amaranthus palmeri biotype from Randolph County, AR) plants treated with the P450 inhibitor malathion (1,500 g ha−1), fomesafen (Flexstar® at 263 g ha−1), or malathion followed by fomesafen. Picture taken at 2 wk after treatment.
The compound NBD-Cl was shown to cause strong inhibition of the pi class of GSTs expressed in human cancer cells (Ricci et al. Reference Ricci, De Maria, Antonini, Turella, Bullo, Stella, Filomeni and Caccuri2005) and the phi (F) class of GSTs expressed in herbicide-resistant blackgrass (Alopecurus myosuroides Huds.) (Cummins et al. Reference Cummins, Wortley, Sabbadin, He, Coxon, Straker, Sellars, Knight, Edwards, Hughes, Kaundun, Hutchings, Steel and Edwards2013). Interestingly, NBD-Cl fb fomesafen treatment resulted in low survival rate (35%, P<0.05) and reduced biomass by 71%, but the reduction in biomass was not different from fomesafen alone (66%) (Table 2; Figure 7). The lack of biomass reduction could be due to the longer interval (2 d) between the NBD-Cl and fomesafen treatments instead of the 2-h delay between P450 inhibitors and fomesafen. The low survival rate (35%) after NBD-Cl plus fomesafen application points to a possible role for a GST-mediated mechanism, in addition to the cytochrome P450–based resistance in the RCA accession.
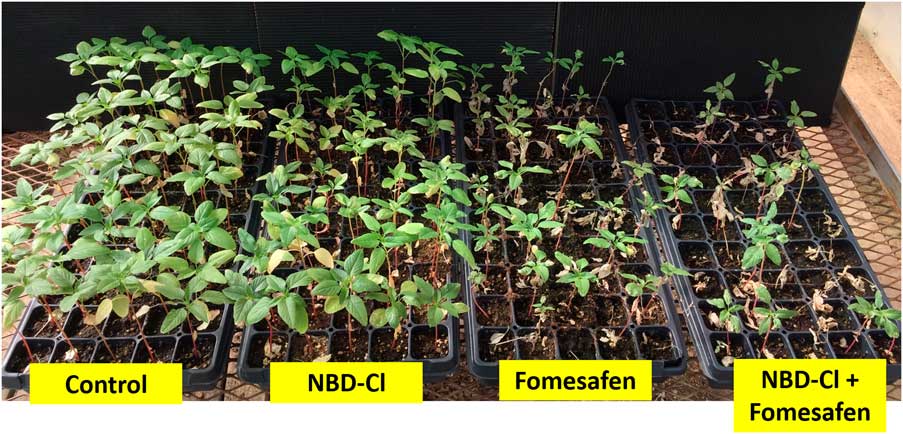
Figure 7 RCA (fomesafen-resistant Amaranthus palmeri biotype from Randolph County, AR) plants treated with the glutathione S-transferase inhibitor 4-chloro-7-nitrobenzofurazan (NBD-Cl; 270 g ha−1), fomesafen (Flexstar® at 263 g ha−1), or NBD-Cl followed by fomesafen. Picture taken at 2 wk after treatment.
Herbicide metabolism in general involves an activation phase, mediated by cytochrome P450s, followed by a conjugation phase mediated by GSTs (Ghanizadeh and Harrington Reference Ghanizadeh and Harrington2017). Preliminary experiments on treating the RCA accession with both GST and P450 inhibitors preceding the fomesafen application (NBD-Cl+malathion+fomesafen) indicated no increase in control compared with the NBD-Cl or malathion plus fomesafen treatments (unpublished data). Hence, there might not be any additional benefit from mixing both malathion and NBD-Cl with fomesafen to control resistant A. palmeri. Further metabolic studies using radioisotopes (14C) are needed to provide more insights into the P450- and GST-based PPO-inhibiting resistance mechanism in the RCA accession.
In summary, this study reports the first documented case of NTSR to fomesafen in A. palmeri. The study shows that resistance could partially be reversed by using synergists such as malathion and NBD-Cl, indicating metabolic resistance. It is unknown whether a similar response would be observed under field conditions. Confirmation of these results in the field could lead to better strategies for managing PPO-inhibitor resistance in A. palmeri. Use of synergists for reversing herbicide resistance could be one of the tools necessary to counter the growing threat of metabolic resistance in weeds. One of the major reasons attributed to the evolution of metabolic resistance is the use of low or suboptimal rates of herbicides, resulting in the accumulation of metabolic genes over several generations. An important downside of having metabolic resistance in weeds is that it can confer multiple resistance to different chemical families, SOAs, or even compounds that have yet to be commercially developed. Therefore, future studies on the resistance patterns of the fomesafen-resistant RCA accession will be critical to understand the implications of the metabolic resistance.
Acknowledgments
Funding for this research was provided by the Arkansas Soybean Promotion Board. No conflicts of interest have been declared.


