INTRODUCTION
There are up to 17 million episodes of infectious intestinal disease (IID) in the UK every year [Reference Tam1], of which around 1 in 4 are estimated to be caused by indigenous foodborne infection [Reference Adak, Long and O'Brien2]. The epidemiology of the two most important bacterial causes, Salmonella and Campylobacter infection, has changed considerably in the UK over the past two decades. Salmonella incidence has fallen sharply from a peak of around 35 000 infections in 1997, largely due to an 80% decline in Salmonella Enteritidis phage-type 4 infections between 1997 and 2008 [Reference Adak, Long and O'Brien2]. Campylobacter incidence reached a peak of around 60 000 infections in 2000 and thereafter declined, but has been rising again since 2004 particularly in older people [Reference Gillespie, O'Brien and Bolton3]. Similar trends have been observed elsewhere in Europe [Reference Jore4, Reference Newell5] and the USA [6]. It is not known to what extent these changes are real or a consequence of surveillance artefacts.
Public health surveillance of IID and foodborne infection usually depends on reporting of laboratory-confirmed cases, and physicians who request stool samples are essential contributors to this process. However, reported infections represent only a small fraction of cases occurring in the community. In order to be ascertained, a patient must first seek medical care, a stool sample must be submitted to the laboratory, the laboratory must identify an organism, and the test result must be reported to national surveillance. Several epidemiological studies in the UK [Reference Tam1], The Netherlands [Reference de Wit7], the USA [Reference Scallan8], Canada [Reference Majowicz9], Australia [Reference Hall10], and New Zealand [Reference Lake11] have investigated the relationship between components of this surveillance pyramid in order to provide better estimates of the true burden of IID. For example, in the UK in 2008–2009, for every case of Salmonella or Campylobacter infection reported to national surveillance there are estimated to be 4·7 and 9·3 cases, respectively, in the community [Reference Tam1].
Disparities in surveillance systems, such as differences in health-seeking behaviour or stool sampling practices, may account for some of the variation in the incidence of disease that is observed between regions or countries. Similarly, secular disease trends might also be affected by variation in surveillance parameters over time rather than by true change in disease incidence. We analysed data from a microbiology laboratory network to investigate whether changes in the epidemiology of Campylobacter or Salmonella infection over the past decade might be explained by changes in stool sampling rates.
METHODS
Laboratory surveillance system
Surveillance for Campylobacter and Salmonella infections in Wales is based on laboratory reports of culture-confirmed cases. The Wales laboratory surveillance network comprises all 13 microbiology laboratories that are located in Wales (population 3 million) providing complete population coverage. They perform stool sample tests for general practices, hospitals, and a variety of other users such as occupational health and environmental health departments. Laboratories follow a common standard operating procedure and test all stool specimens for Campylobacter spp., Salmonella spp., Shigella spp., Escherichia coli O157, and Cryptosporidium spp. [12]. Every sample is given a unique patient identification number and a unique specimen identification number by the laboratory. Multiple samples obtained from the same patient can be linked by means of the patient identification number. Data accompanying the sample include age, sex, place of residence, date of sampling, source of specimen, date of test result, and details of test result (including species and serotype, if determined).
All microbiology laboratories in Wales participate in a national database (DataStore) which is coordinated by Public Health Wales. This includes records on all specimens processed by each laboratory from around 1996 onwards. DataStore electronically extracts data directly from each laboratory information management system and compiles the data into one large dataset with a common range of data codes. Data were obtained from DataStore on all stool samples submitted in the period 1998–2008 and on all stool samples testing positive for Campylobacter or Salmonella infection.
Data analysis
For our analyses we used only data from laboratories which could deliver complete data for the full period and where there had been no change in the laboratory information management system that might influence data quality. Data were checked for duplicates and any records relating to laboratory quality control samples were removed.
A sample was considered positive if culture confirmed the presence of either Campylobacter or Salmonella infection. A patient episode was defined as a single positive sample test result. If two or more positive results occurred within a 90-day period, the date of the first positive test was assigned to the episode and all other positive results within the period were omitted. The sample yield (proportion positive) was defined as the number of patient episodes per 100 stool samples tested.
We used Stata version 10 (StataCorp, USA) to analyse time trends (using univariate linear regression of the number of samples or episodes over time) and to calculate risk ratios (RR). Since samples submitted from general practice most closely reflect rates of disease in the community, we analysed data separately by sample source (general practice, hospital, other). Data were also stratified according to sex and age group (0–4, 5–14, 15–44, 45–64, ⩾65 years). Popu-lation denominator data for Wales for the census year 2001 were obtained from the Office for National Statistics [13], and we used this as the reference year to calculate annual incidence rates per 100 000 population, with 95% confidence intervals (CI) as required.
RESULTS
Data were available on 585 843 stool samples tested between 1998 and 2008 from nine laboratories, representing 80% of the catchment population for Wales. Four laboratories with incomplete data were excluded: two small laboratories that had only recently been incorporated into the national database and two laboratories that had previously had a policy of deleting all negative test results because of lack of storage space on their laboratory management system. Details of age, sex, and sample source were available for 96·6%, 98·4% and 86·9% of patient samples, respectively.
Campylobacter and Salmonella incidence and trends
Between 1998 and 2008, there were 26 281 episodes of Campylobacter infection, a mean annual rate of 103/100 000 population (95% CI 95–111) and 5767 episodes of Salmonella infection, a mean annual rate of 23/100 000 population (95% CI 18–27) (Table 1). For Campylobacter, there was a slight excess in the number of episodes in males (53% males, 47% females) and a higher incidence (males 88/100 000, females 74/100 000, RR 1·19, 95% CI 1·16–1·22, P<0·001). For Salmonella there was a slight excess in the number of episodes in males (51% male, 49% female) but a similar incidence (males 17·9/100 000, females 17·4/100 000, RR 1·03, 95% CI 0·98–1·09, P=0·3). Both Campylobacter (120/100 000) and Salmonella (40/100 000) incidence was highest in the 0–4 years age group. Salmonella incidence declined from 43/100 000 to 19/100 000 population between 1998 and 2008 but Campylobacter incidence, after declining from 111/100 000 in 1998 to 84/100 000 in 2003, rose to 119/100 000 in 2008. Salmonella incidence declined in all age groups over the study period. However, Campylobacter incidence, after an initial decline, increased steadily between 2003 and 2008, especially in the 45–64 years (81–122/100 000) and ⩾65 years (55–96/100 000) age groups.
Table 1. Stool sample rates and Campylobacter and Salmonella incidence by age group and by year, Wales, 1998–2008

* Number/100 0000 population.
† Mean annual rate/100 000 population.
Stool sampling trends
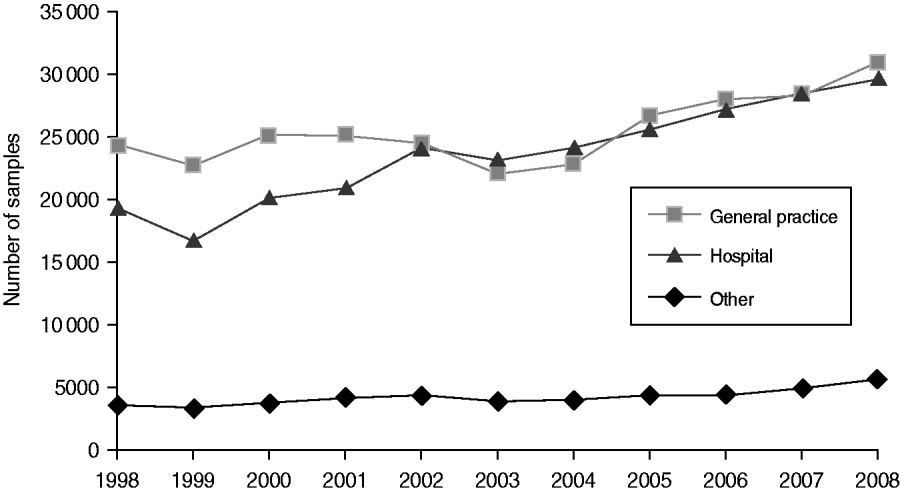
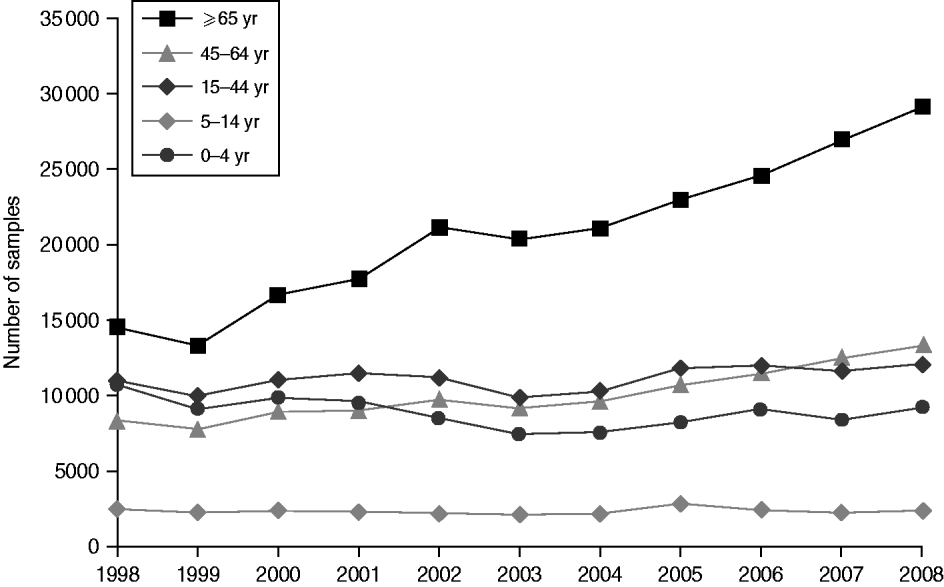
Around 1 in 44 of the population submitted a stool sample each year, a mean annual stool sampling rate of 2256/100 000 (95% CI 2068–2445). The proportion of the population submitting a stool sample increased by 40% from 2·0% in 1998 (47 144 samples, 2027/100 000 population) to 2·8% in 2008 (66 140 samples, 2843/100 000 population) (Table 1). Most samples were submitted by general practices (48%) compared to 44% from hospitals and 8% from other sources. However, the proportion of samples from hospital patients increased from 41% to 45% over the study period (Fig. 1). Sampling rates were higher for females (males 43%, females 57%) and varied considerably by age group, with highest mean annual sampling rates in the 0–4 years (6654/100 000) and ⩾65 years (5145/100 000) age groups, Over the study period, the male:female sampling ratio (1:1·2) remained the same as did sampling rates in children and young adults. However, sampling rates rose in older adults (⩾65 years) from 3592 to 7203/100 000, particularly from 2004 onwards (Fig. 2). This rise was seen in samples originating from both general practice and hospital sources.

Fig. 1. Number of faecal samples submitted to microbiology laboratories in Wales by sample source and year, 1998–2008.

Fig. 2. Number of faecal samples submitted to microbiology laboratories in Wales by age group and year, 1998–2008.
Stool sampling patterns and yield
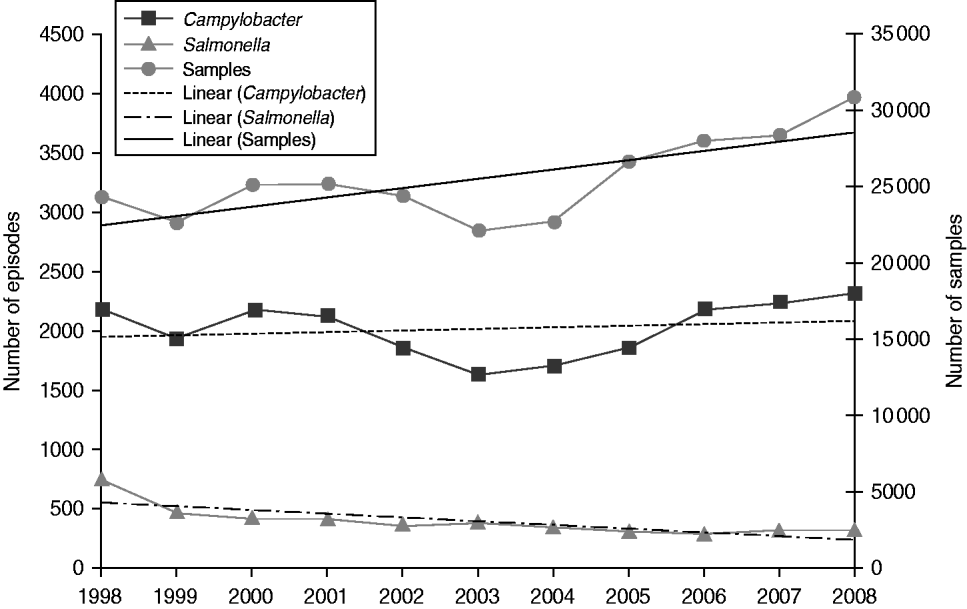
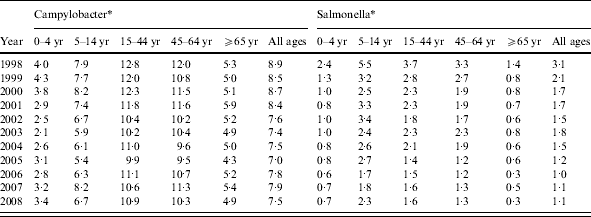
The yield (proportion positive) varied by source of specimen from 9·5% in general practice samples to 1·5% in hospital samples. Campylobacter was detected in 7·9% of general practice samples and 1·1% of hospital samples, while Salmonella was detected in 1·6% and 0·4%, respectively. In general practice samples, yield was higher in males than females for both Salmonella (1·7% vs. 1·5%) and Campylobacter (9·4% vs. 6·8%). Overall, the proportion positive for Salmonella declined throughout the study period with the steepest decline occurring between 1998 and 2001 while the proportion positive for Campylobacter declined from 1998 to 2005 but has risen slightly since. In general practice samples, the proportion positive for Salmonella declined from 3·1% to 1·1% (from 3·4% to 1·2% in males and from 2·8% to 1·0% in females), and the proportion positive for Campylobacter declined from 8·9% to 7·5% (from 10·6% to 9·1% in males and from 7·6% to 6·2% in females) (Table 2). Salmonella yield declined in all age groups (by between 58·4% and 80·1% according to age group) and Campylobacter yield declined by between 13·2% and 14·8% in every age group, apart from the ⩾65 years age group where it only declined by 7·5%. Thus, while the annual number of general practice samples increased on average by 2·7% per year throughout the study period, the number of Salmonella episodes declined by 7·8% per year, while the number of Campylobacter episodes increased only very slightly by 0·6% each year (Fig. 3).

Fig. 3. Number of faecal samples, Campylobacter episodes and Salmonella episodes with trend lines by year, general practitioner samples, Wales, 1998–2008.
Table 2. Proportion of stool samples positive for Campylobacter and Salmonella by age group and by year, general practitioner samples, Wales, 1998–2008

* Proportion positive/100 sample.
DISCUSSION
Stool sampling rates have risen steadily since 1998, particularly samples from hospital patients and from people aged ⩾65 years. In spite of this, Salmonella incidence has continued to decline. By contrast, Campylobacter incidence after declining between 1998 and 2003 has risen since 2004, particularly in older people, although the proportion of samples positive has remained almost constant. Most of this increase may therefore be explained by higher sampling rates in older people.
Our study captured data on stool samples submitted for testing in all laboratories in Wales. It does not take account of cross-boundary flows, although we know (from other data sources) that the proportion of Welsh residents tested outside Wales is small. Data from four laboratories were incomplete and were discarded, but examination of the available data did not show any differences from the nine laboratories included in the study. Laboratory testing practices may vary between laboratories or change over time, for example the choice of culture media used, duration of incubation of culture plates, and how plates are read [Reference Voetsch14, Reference Lake15]. These can influence test sensitivity, particularly for a fastidious organism like Campylobacter. However, all laboratories in Wales follow a standard operating procedure for investigation of stool samples for bacterial pathogens [12] and there was no change in testing procedures throughout the study period. The main limitation of our study is that only a minimum of variables are routinely captured by laboratories on stool samples. Therefore we were unable to investigate whether changes in stool sampling rates were due to factors associated with seeking medical care or reasons for submitting a stool sample.
Other studies have examined factors associated with consulting a general practitioner (GP) and with having a stool sample taken. In England, during the mid-1990s, around 1 in 6 patients presented to a GP following an episode of IID and around 1 in 4 of these had a sample taken [Reference Wheeler16]. The decision to consult a doctor is influenced by age, illness severity, recent travel abroad, pre-existing poor health, educational attainment and socioeconomic status [Reference Tam, Rodrigues and O'Brien17, Reference Evans18]. Similar factors influence the decision by a GP to request a stool sample for culture particularly diarrhoea duration, bloody diarrhoea, and recent travel abroad [Reference Scallan8, Reference Hennessy19, Reference van den Brandhoff20]. There are also well-documented differences between countries in rates for seeking medical care which are higher in the USA, Canada, and Australia compared to the UK and The Netherlands [Reference Scallan8]. One recent study investigated the almost tenfold difference in Campylobacter infection rates in Australia compared to the USA and found that these could not be explained by differences in healthcare systems [Reference Vally21]. Nevertheless, these differences in surveillance parameters potentially affect between-country comparisons of the incidence and burden of foodborne disease.
Relatively few studies have documented stool sampling rates or used laboratory denominators when quantifying incidence rates of gastrointestinal pathogens. In a study in four laboratories in England from 1983 to 1984 the stool sampling rate was around 1100/100 000 population and the yield (proportion positive) for Campylobacter and Salmonella was 5·5% and 3·4%, respectively [Reference Skirrow22]. More recently, a study from a single English laboratory reported a sampling rate ranging from 1700/100 000 in 1991 to 2300/100 000 in 2000 with a yield of 5·7% for Campylobacter between 2000 and 2004 [Reference Dingle, Clarke and Bowler23]. This suggests that stool sampling rates may have been increasing throughout the 1990s. Stool sampling rates may also vary in different countries. For example, they appear to be considerably lower in The Netherlands, which had a mean stool sampling rate of 1037/100 000 population between 1996 and 2000 and yields of 3·5% and 2·3% for Campylobacter and Salmonella, respectively [Reference van Pelt24].
There has been a large decline in Salmonella incidence in the UK over the past decade [Reference Adak, Long and O'Brien2], and this has been so substantial that it cannot be masked even by increased stool sampling rates. Until recently, there was a similar but less marked decline in Campylo-bacter incidence [Reference Adak, Long and O'Brien2, Reference Gillespie, O'Brien and Bolton3]. However, a recent increase in Campylobacter incidence, particularly in people aged >60 years, has been described [Reference Gillespie, O'Brien and Bolton3]. Interestingly, this has occurred in spite of an almost 50% decrease in GP consultation rates for IID between 1994–1996 and 2008–2009 [Reference Tam1, Reference Lake15]. Our analysis of laboratory data suggests that the apparent rise in Campylobacter incidence may partly be a surveillance artefact due to increased stool sampling in older people. This could be due to demographic changes such as an increase in the number of older people (the population of Wales grew by 2% during the study period and the proportion aged ⩾65 years increased from 17·3% to 18·0%), but a more likely explanation is a selective increase in sampling of older people, particularly in hospital, because of concern about norovirus outbreaks or antibiotic-associated diarrhoea. This is borne out by reports of increases in hospital admissions of older people with norovirus [Reference Haustein25], and changes in laboratory workload for Clostridium difficile infection [Reference Reddy, Taori and Poxton26]. However, our study cannot exclude the possibility that some of the increase in Campylobacter incidence is real. A recent major increase in Campylobacter incidence in New Zealand, which has one of the highest rates in the world, was confirmed by comparing surveillance data with data on hospitalization [Reference Baker, Sneyd and Wilson27]. Similar studies are required in order to investigate Campylobacter trends in the UK.
In general, there are several alternative explanations for apparent changes in disease incidence detected through surveillance, for example changes in demography, health-seeking behaviour, diagnostic criteria, diagnostic practices, or reporting practices. Trends in IID are most efficiently monitored using surveillance data based on laboratory-confirmed infections. However, this assumes that surveillance multipliers for each step of the surveillance pyramid remain constant over time [Reference Hardnett28]. We have shown that this is not the case, at least for stool sampling rates. The recent introduction of new infectious disease legislation in Wales that obliges diagnostic laboratories, for the first time, to notify organisms of public health concern may also affect surveillance data in future [29]. This illustrates the importance of denominator data on surveillance parameters such as stool sampling practices, and the need for exercising caution when interpreting laboratory surveillance data as a marker of disease incidence.
ACKNOWLEDGEMENTS
The data used in this study were generated by microbiology laboratories as part of routine surveillance. We are grateful to M. Roberts for assistance in extracting data from the DataStore database. We also thank the coordinators of the European Programme for Intervention Epidemiology Training (EPIET) for their support, particularly Dr V. Bremer for her com-ments on the manuscript. There was no specific funding for this study.
DECLARATION OF INTEREST
None.


