


1. Introduction
Surface gravity waves (SGWs) propagate through currents resulting from ocean meso- and submesoscale turbulence and from the surface expression of tides and internal gravity waves. Much work, both historical and recent, has focused on the effect of internal waves and tides on SGWs (e.g. Barber Reference Barber1949; Perry & Schimke Reference Perry and Schimke1965; Phillips Reference Phillips1977; Osborne & Burch Reference Osborne and Burch1980; Tolman Reference Tolman1990; Hao & Shen Reference Hao and Shen2020; Ho, Merrifield & Pizzo Reference Ho, Merrifield and Pizzo2023). Recognition of the role of meso- and submesoscale turbulence in shaping the open-ocean surface wave field is comparatively recent and relies on ocean observations and modelling (Holthuijsen & Tolman Reference Holthuijsen and Tolman1991; Ardhuin et al. Reference Ardhuin, Gille, Menemenlis, Rocha, Rascle, Chapron, Gula and Molemaker2017; Romero, Lenain & Melville Reference Romero, Lenain and Melville2017; Romero, Hypolite & McWilliams Reference Romero, Hypolite and McWilliams2020; Villas Boâs et al. Reference Villas Boâs, Cornuelle, Mazloff, Gille and Ardhuin2020). In this work we develop a theoretical framework that can be used to understand the effect of meso- and submesoscale turbulence on SGWs.
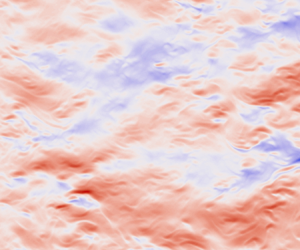
Refraction and scattering of open-ocean deepwater SGWs by eddies, fronts, filaments and vortices results in fluctuations in significant wave height (SWH) with length scales reflecting those of the underlying turbulent field, see figure 1. Fluctuations in SWH modulate SGW breaking and thus affect all aspects of air–sea exchange (Cavaleri, Fox-Kemper & Hemer Reference Cavaleri, Fox-Kemper and Hemer2012; Villas Bôas et al. Reference Villas Bôas2019). There are also implications for the formation of extreme waves and remote sensing.

Figure 1. (a) Surface current speed in an MITgcm simulation of the California Current system (Villas Boâs et al. Reference Villas Boâs, Cornuelle, Mazloff, Gille and Ardhuin2020), with the arrow indicating the primary direction of wave propagation; SWH anomaly computed using (b) WW3 and (c) the U2H map. (d) Difference between (c) and (b). The background wave action spectrum, described in Appendix B, is narrow banded in frequency (with periods around 10.3 s and wavelength 165.5 m) and angle (with peak angle  $\theta _p=0$ and width parameter $s=10$). Panels (a,c) can be produced from the notebook accessible at https://www.cambridge.org/S0022112024009649/JFM-Notebooks/files/U2Hmap.
Scale separation between SGW wavelengths and the larger spatial scale of the currents makes it possible to adopt a phase-averaged description, focusing on the density of wave action  $\mathcal {A}({\boldsymbol {x}},{\boldsymbol {k}},t)$ in the position–wavevector $({\boldsymbol {x}},{\boldsymbol {k}})$-space. Action density satisfies a transport equation which, because of its high dimensionality, poses analytic and numerical challenges, even when linearised by neglecting wave–wave interactions. As a result, numerous open questions remain about the relation between the currents and the fluctuations in SWH they induce. Some of these questions can be addressed by numerical solution of the transport equation (Villas Boâs et al. Reference Villas Boâs, Cornuelle, Mazloff, Gille and Ardhuin2020). These computations are costly and the results can be difficult to interpret.
In § 2 we develop an alternative approach that directly links SGW amplitude to current, reducing computational costs and providing new insights. This approach relies on the smallness of the ratio  $\varepsilon$ between the typical current speed $U$ and the SGW group speed ${c_g}$:
 \begin{equation} \varepsilon =U/{c_g} \ll 1. \end{equation}
The SGWs with wavelengths greater than 10 m have group speed in excess of 2 m s $^{-1}$. For these relatively long waves $\varepsilon \ll 1$ holds in all but the most extreme ocean conditions. In a steady-state scenario and in the absence of current, that is, for $\varepsilon = 0$, the action density $\mathcal {A}({\boldsymbol {x}},{\boldsymbol {k}})$ can be taken as spatially uniform, $\bar{\mathcal {A}} ({\boldsymbol {k}})$ say. For $0 < \varepsilon \ll 1$ and neglecting wind forcing, dissipation and wave–wave interactions, the current induces a small, $O(\varepsilon )$ ${\boldsymbol {x}}$-dependent modulation so that the current-perturbed action spectrum is $\mathcal {A}({\boldsymbol {x}},{\boldsymbol {k}})= \bar{\mathcal {A}}({\boldsymbol {k}})+a({\boldsymbol {x}},{\boldsymbol {k}})$. At leading order, the anomaly $a({\boldsymbol {x}},{\boldsymbol {k}})$ is linearly related to both the surface current $\boldsymbol {U}({\boldsymbol {x}})$ and the background wave action spectrum $\bar{\mathcal {A}}$. Similarly, the anomaly of any measure of wave amplitude deduced from $\mathcal {A}({\boldsymbol {x}},{\boldsymbol {k}})$ is linearly related to $\boldsymbol {U}({\boldsymbol {x}})$ and $\bar{\mathcal {A}}({\boldsymbol {k}})$.
We focus on SWH and obtain an explicit form for the linear map that relates the SWH anomaly  $h_s({\boldsymbol {x}})$ to the current velocity $\boldsymbol {U}({\boldsymbol {x}})$. This map, which we term U2H map, turns out to be a convolution, best expressed as
 \begin{equation} \frac{\hat{h}_s}{{\bar {H}_s}}= \hat{\boldsymbol{L}} \boldsymbol{\cdot} \hat{\boldsymbol{U}},\end{equation}
in terms of the Fourier transforms  $\hat {h}_s$ of $h_s$ and $\hat {\boldsymbol {U}}$ of $\boldsymbol {U}$, and of the mean SWH $\bar {H}_s$.
In § 3 we obtain several alternative and approximate expressions for the transfer function  $\hat {\boldsymbol {L}}$ that embodies the U2H map. Depending on details of the currents $\boldsymbol {U}$ and the background wave action spectrum $\bar{\mathcal {A}}({\boldsymbol {k}})$ one of these different expressions of $\hat {\boldsymbol {L}}$ may be most effective.
We show a complicated example in figure 1. Figure 1(a) shows the surface current speed in a simulation of the California Current system. Figure 1(b) shows the SWH anomaly  $h_s$ computed using WAVEWATCH III (WAVE height, WATer depth and Current Hindcasting third generation wave model, hereafter WW3) which solves the four-dimensional transport equation satisfied by the action $\mathcal {A}({\boldsymbol {x}},{\boldsymbol {k}},t)$ (Tolman et al. Reference Tolman2009). Figure 1(c) shows the result of applying the U2H map to the current in figure 1(a). The computational details for figure 1(b,c) are described in § 4.1. The match between the results of the (computationally expensive) WW3 computation in (b) and of the (much cheaper) application of U2H in (c) is excellent. Throughout the paper we assess the accuracy of the U2H map (1.2) by comparing its predictions against numerical simulations using WW3.
In § 4 we examine the SWH anomaly  $h_s$ induced by realistic flows and by simple flows such as vortices. In § 5 we consider $h_s$ produced by special wave spectra. We show, in particular, that $h_s$ vanishes (to leading order in $\varepsilon$) for isotropic wave spectra. The complementary limit is highly directional wave spectra, characteristic of ocean swell. Swell produces strongly anisotropic SGW anomalies aligned with the dominant direction of wave propagation, i.e. streaks in SWH. The limit of highly directional wave spectra is delicate in that it is non-uniform in the small parameter $\delta$, characterising the directional width. The results of the present paper require that $\delta \gg \varepsilon$. For $\delta = O(\varepsilon )$, the SWH response is nonlinear in the current and the assumptions leading to the U2H map break down. An asymptotic form for the SWH in this case is derived in Wang et al. (Reference Wang, Villas Boâs, Young and Vanneste2023) under the additional assumption of a localised current.
2. Formulation
We start with the conservation equation
 \begin{equation} \partial_t \mathcal{A} + \boldsymbol{\nabla}_{\boldsymbol{k}} \omega \boldsymbol{\cdot} \boldsymbol{\nabla}_{\boldsymbol{x}} \mathcal{A} - \boldsymbol{\nabla}_{\boldsymbol{x}} \omega \boldsymbol{\cdot} \boldsymbol{\nabla}_{\boldsymbol{k}} \mathcal{A} = 0,\end{equation}
for the wave action density per unit mass  $\mathcal {A}({\boldsymbol {x}},{\boldsymbol {k}},t)$ in position–wavevector space (e.g. Komen et al. Reference Komen, Cavaleri, Donelan, Hasselmann, Hasselmann and Janssen1996; Janssen Reference Janssen2004). Here $\omega$ is the absolute frequency of deep-water SGWs, related to the intrinsic frequency
 \begin{equation} {\sigma(k) = \sqrt{gk}}, \end{equation}
with  $k = | {\boldsymbol {k}}|$, by
 \begin{equation} \omega({\boldsymbol{x}},{\boldsymbol{k}}) = \sigma(k) + \boldsymbol{k} \boldsymbol{\cdot} \boldsymbol{U}({\boldsymbol{x}}), \end{equation}
where  $\boldsymbol {U}({\boldsymbol {x}})$ is the surface velocity of the ocean current, taken to be horizontal and time independent. The wave energy per unit mass spectrum is related to the action density according to
 \begin{equation} \mathcal{E}({\boldsymbol{x}},{\boldsymbol{k}},t)=\sigma(k) \mathcal{A}({\boldsymbol{x}},{\boldsymbol{k}},t).\end{equation}
With equipartition between kinetic and potential energy of deep-water SGWs the root mean square sea-surface displacement is related to the wave energy spectrum by
 \begin{equation} g \eta^2_{rms} = \int \mathcal{E}({\boldsymbol{x}},{\boldsymbol{k}},t) \, \mathrm{d} {\boldsymbol{k}}. \end{equation}
The polar representation of the wavenumber vector  ${\boldsymbol {k}}$ is
 \begin{equation} {\boldsymbol{k}} = k \begin{pmatrix}\cos \theta \\ \sin \theta\end{pmatrix},\end{equation}
and integrations in the form of  $\int ({\cdot })\mathrm {d} {\boldsymbol {k}}$ (as in (2.5)) can be expressed as $\iint ({\cdot }) k\mathrm {d} k \mathrm {d} \theta$. Compared with conventions adopted in wave-modelling communities, our definitions of the wave action density per unit mass $\mathcal {A}({\boldsymbol {x}},{\boldsymbol {k}},t)$ and wave energy per unit mass spectrum $\mathcal {E}({\boldsymbol {x}},{\boldsymbol {k}},t)$ are related to the definitions of wave action density $N(k,\theta ;{\boldsymbol {x}},t)$ and surface elevation spectrum $F(k,\theta ;{\boldsymbol {x}},t)$ that appear in WW3 (The Wavewatch III Development Group 2016) via $\mathcal {A}({\boldsymbol {x}},{\boldsymbol {k}},t)=gN(k,\theta ;{\boldsymbol {x}},t)$ and $\mathcal {E}({\boldsymbol {x}},{\boldsymbol {k}},t) = g F(k,\theta ;{\boldsymbol {x}},t)$.
Our focus is on the spatial distribution of wave energy, obtained by integrating (2.4) in  ${\boldsymbol {k}}$ and conventionally reported in terms of the SWH defined as $H_s({\boldsymbol {x}},t) = 4 \eta _{rms}({\boldsymbol {x}},t)$. The SWH can be obtained from the action spectrum with
 \begin{equation} H_s({\boldsymbol{x}},t) = 4 \left( g^{{-}1} \int \sigma(k) \mathcal{A}({\boldsymbol{x}},{\boldsymbol{k}},t) \, \mathrm{d} {\boldsymbol{k}} \right)^{1/2}.\end{equation}
The action equation (2.1) relies on an assumption of spatial scale separation between SGWs and currents. It also neglects forcing, dissipation and wave–wave interactions. We make three further assumptions:
(i) in the absence of currents, the wave action spectrum takes a background value $\bar{\mathcal {A}}({\boldsymbol {k}})$ that is independent of space and time;
(ii) the current is steady and we restrict our attention to the steady-state wave-action response;
(iii) the typical current velocity is small compared with the typical group speed of SGWs, so that the Doppler shift
$\boldsymbol {k} \boldsymbol {\cdot } \boldsymbol {U}({\boldsymbol {x}})$ is a small correction to the intrinsic frequency $\sigma (k)$.


As preparation for a perturbation expansion we make assumption (iii) explicit by writing
 \begin{equation} \omega({\boldsymbol{x}},{\boldsymbol{k}}) = \sigma(k) + \varepsilon \boldsymbol{k} \boldsymbol{\cdot} \boldsymbol{U}({\boldsymbol{x}}). \end{equation}
Here we avoid a formal scaling analysis and retain dimensional variables. Thus,  $\varepsilon$ should from now on be regarded as a bookkeeping parameter that identifies terms that are $O(U/c_g)$ and is ultimately set to $1$. We expand the action as
 \begin{equation} \mathcal{A}({\boldsymbol{x}},{\boldsymbol{k}},t) = \bar{\mathcal{A}}({\boldsymbol{k}}) + \varepsilon a({\boldsymbol{x}},{\boldsymbol{k}},t) + O(\varepsilon^2),\end{equation}
assuming that the leading-order action  $\bar{\mathcal {A}}({\boldsymbol {k}})$ is independent of space and time. The presence of the currents leads to anomalies at order $\varepsilon$ captured by $a({\boldsymbol {x}},{\boldsymbol {k}},t)$. We relate $a({\boldsymbol {x}},{\boldsymbol {k}},t)$ to $\boldsymbol {U}({\boldsymbol {x}})$ by introducing (2.9) into (2.1) to obtain
 \begin{equation} \partial_t a + \boldsymbol{c}_{\boldsymbol{g}} \boldsymbol{\cdot} \boldsymbol{\nabla}_{{\boldsymbol{x}}} a = (\boldsymbol{\nabla}_{{\boldsymbol{k}}} \bar{\mathcal{A}} \boldsymbol{\cdot} \boldsymbol{\nabla}_{\boldsymbol{x}}) \boldsymbol{U} \boldsymbol{\cdot} {\boldsymbol{k}},\end{equation}
where  $\boldsymbol {c}_{\boldsymbol {g}}(k)= \sqrt {g/4k^3} {\boldsymbol {k}}$ is the group velocity. We focus on the steady-state response $a({\boldsymbol {x}},{\boldsymbol {k}})$, independent of $t$. This satisfies (2.10) where the time derivative term is omitted. Causality is enforced by adding a linear dissipation term to find
 \begin{equation} (\boldsymbol{c}_{\boldsymbol{g}} \boldsymbol{\cdot} \boldsymbol{\nabla}_{{\boldsymbol{x}}} + \mu) a = (\boldsymbol{\nabla}_{{\boldsymbol{k}}} \bar{\mathcal{A}} \boldsymbol{\cdot} \boldsymbol{\nabla}_{\boldsymbol{x}}) \boldsymbol{U} \boldsymbol{\cdot} {\boldsymbol{k}}. \end{equation}
The non-dissipative, causal solution is then obtained in the limit  $\mu \to 0^+$.
We solve (2.10) in terms of the Fourier transforms
 \begin{equation} \hat
a(\boldsymbol{q},{\boldsymbol{k}}) \mathop=^{\rm def} \int
a({\boldsymbol{x}},{\boldsymbol{k}}) \,
\mathrm{e}^{-\mathrm{i} \boldsymbol{q}\ \boldsymbol{\cdot}\
{\boldsymbol{x}}} \, \mathrm{d}{\kern0.9pt}{\boldsymbol{x}}
\quad \textrm{and} \quad
\hat{\boldsymbol{U}}(\boldsymbol{q}) \mathop=^{\rm def} \int
\boldsymbol{U}({\boldsymbol{x}}) \, \mathrm{e}^{-\mathrm{i}
\boldsymbol{q}\ \boldsymbol{\cdot}\ {\boldsymbol{x}}} \,
\mathrm{d}{\kern0.9pt}{\boldsymbol{x}}.
\end{equation}
\begin{equation} \hat
a(\boldsymbol{q},{\boldsymbol{k}}) \mathop=^{\rm def} \int
a({\boldsymbol{x}},{\boldsymbol{k}}) \,
\mathrm{e}^{-\mathrm{i} \boldsymbol{q}\ \boldsymbol{\cdot}\
{\boldsymbol{x}}} \, \mathrm{d}{\kern0.9pt}{\boldsymbol{x}}
\quad \textrm{and} \quad
\hat{\boldsymbol{U}}(\boldsymbol{q}) \mathop=^{\rm def} \int
\boldsymbol{U}({\boldsymbol{x}}) \, \mathrm{e}^{-\mathrm{i}
\boldsymbol{q}\ \boldsymbol{\cdot}\ {\boldsymbol{x}}} \,
\mathrm{d}{\kern0.9pt}{\boldsymbol{x}}.
\end{equation}
We emphasise the distinction between the newly introduced wavevector  $\boldsymbol {q}$, which captures spatial variations at the current scale, and the original wavevector ${\boldsymbol {k}}$, which represents spatial variations of the wave phase. Introducing (2.12a,b) into (2.11) leads to
 \begin{equation} \hat a(\boldsymbol{q},{\boldsymbol{k}}) = \lim_{\mu \to 0^+} \frac{({\boldsymbol{k}} \boldsymbol{\cdot} \hat{\boldsymbol{U}}) (\boldsymbol{q} \boldsymbol{\cdot} \boldsymbol{\nabla}_{{\boldsymbol{k}}} \bar{\mathcal{A}})}{\boldsymbol{c}_{\boldsymbol{g}} \boldsymbol{\cdot} \boldsymbol{q} - \mathrm{i} \mu}. \end{equation}
The limit  $\mu \to 0^+$ above is taken in all expressions involving $\mu$ and we proceed with lighter notation in which the limit is understood.
Our focus is on the SWH, which we expand as
 \begin{equation} H_s({\boldsymbol{x}}) = \bar {H}_s + \varepsilon h_s({\boldsymbol{x}}) + O(\varepsilon^2).\end{equation}
The leading-order term  $\bar {H}_s$ is a constant. The anomaly $h_s({\boldsymbol {x}})$ is deduced from $a({\boldsymbol {x}},{\boldsymbol {k}})$ by Taylor expanding (2.7):
 \begin{equation} h_s({\boldsymbol{x}}) = \frac{8}{g \bar {H}_s} \int \sigma(k) a({\boldsymbol{x}},{\boldsymbol{k}}) \, \mathrm{d} {\boldsymbol{k}} .\end{equation}
An analogous formula relates the Fourier transform  $\hat {h}_s(\boldsymbol {q})$ of $h_s({\boldsymbol {x}})$ to $\hat a(\boldsymbol {q},{\boldsymbol {k}})$. Substituting (2.13) into (2.15) gives
 \begin{equation} {\frac{\hat{h}_s(\boldsymbol{q})}{\bar {H}_s}} = \hat{\boldsymbol{L}}(\boldsymbol{q}) \boldsymbol{\cdot} \hat{\boldsymbol{U}}(\boldsymbol{q}),\end{equation}
where
 \begin{equation} \hat{\boldsymbol{L}}(\boldsymbol{q}) = \frac{8}{g {\bar {H}_s^2}} \int\frac{ \boldsymbol{q} \boldsymbol{\cdot} \boldsymbol{\nabla}_{{\boldsymbol{k}}} \bar{\mathcal{A}}}{\boldsymbol{c}_{\boldsymbol{g}} \boldsymbol{\cdot} \boldsymbol{q} - \mathrm{i} \mu} \sigma {\boldsymbol{k}} \, \mathrm{d} {\boldsymbol{k}}. \end{equation}
 Equation (2.16) shows that  $h_s$ is obtained from $\boldsymbol {U}$ via a linear map – the U2H map. This map is naturally expressed in terms of Fourier transforms, with the complex vector $\hat {\boldsymbol {L}}(\boldsymbol {q})$ acting as a transfer function. It is clear from (2.17) that $\hat {\boldsymbol {L}}$ depends on the wavevector $\boldsymbol {q}$ only through its orientation: introducing the polar representation
 \begin{equation} \boldsymbol{q} = q \boldsymbol{e}_{\boldsymbol{q}} \mathop=^{\rm def} q \begin{pmatrix}\cos \varphi\\ \sin\varphi\end{pmatrix},\end{equation}
with  $\boldsymbol {e}_{\boldsymbol {q}}$ the unit vector in the direction of $\boldsymbol {q}$ and $-{\rm \pi} < \varphi \le {\rm \pi}$, we can rewrite (2.17) as
 \begin{equation} \hat{\boldsymbol{L}}(\boldsymbol{q}) = \hat{\boldsymbol{L}}(\varphi) = \frac{8}{g {\bar {H}_s^2}} \int\frac{ \boldsymbol{e}_{\boldsymbol{q}} \boldsymbol{\cdot} \boldsymbol{\nabla}_{{\boldsymbol{k}}} \bar{\mathcal{A}}}{\boldsymbol{c}_{\boldsymbol{g}} \boldsymbol{\cdot} \boldsymbol{e}_{\boldsymbol{q}} - \mathrm{i} \mu} \sigma {\boldsymbol{k}} \, \mathrm{d} {\boldsymbol{k}}.\end{equation}
It follows from the reality of  $h_s({\boldsymbol {x}})$ that $\hat {h}_s(- \boldsymbol {q}) = \hat {h}_s^*(\boldsymbol {q})$ and hence
 \begin{equation} \hat{\boldsymbol{L}}(-\varphi) = \hat{\boldsymbol{L}}^*(\varphi).\end{equation}
 Equation (2.19) implies that, in physical space,  $h_s({\boldsymbol {x}})$ is expressed as a convolution of $\boldsymbol {U}({\boldsymbol {x}})$ with a kernel $\boldsymbol {L}({\boldsymbol {x}})$ – the inverse Fourier transform of $\hat {\boldsymbol {L}}(\boldsymbol {q})$ – that is homogeneous of degree $-2$, that is, $\boldsymbol {L}(\lambda {\boldsymbol {x}}) = \lambda ^{-2} \boldsymbol {L}({\boldsymbol {x}})$. Linear maps of this type are known as (two-dimensional) Calderón–Zygmund transforms (e.g. Stein (Reference Stein1970), Ch. 2). While the right-hand side of (2.19) appears ambiguous for $\boldsymbol {q}=0$ (since $\varphi$ is then not defined), we simply take $\hat {h}_s(0)=0$, corresponding to the vanishing of the spatial mean of $h_s({\boldsymbol {x}})$, consistent with the definition of $h_s({\boldsymbol {x}})$ as an anomaly.
From (2.16) and (2.19) we draw the important conclusion that patterns in  $h_s$ have scales set by the scales of $\boldsymbol {U}$ (not vorticity). But the angular dependence of $h_s$ depends (linearly) on the wave spectrum. In the next sections we refine this conclusion by obtaining alternative and approximate expressions for $\hat {\boldsymbol {L}}(\boldsymbol {q})$.
3. The U2H map
3.1. Alternative forms of $\hat {\boldsymbol {L}}(\varphi )$

A useful expression for  $\hat {\boldsymbol {L}}(\varphi )$ is obtained by substituting the identity $(\boldsymbol {q} \boldsymbol {\cdot } \boldsymbol {p}) {\boldsymbol {k}} = ({\boldsymbol {k}} \boldsymbol {\cdot } \boldsymbol {q}) \boldsymbol {p} - ({\boldsymbol {k}}^\perp \boldsymbol {\cdot } \boldsymbol {p}) \boldsymbol {q}^\perp$ with $\boldsymbol {p}=\boldsymbol {\nabla }_{{\boldsymbol {k}}} \bar{\mathcal {A}}$ in (2.17) to obtain
 \begin{equation} \hat{\boldsymbol{L}}(\varphi) = \frac{8}{g {\bar {H}_s^2}} \left( \int \frac{\sigma {\boldsymbol{k}} \boldsymbol{\cdot} \boldsymbol{q}}{\boldsymbol{c}_{\boldsymbol{g}} \boldsymbol{\cdot} \boldsymbol{q} - \mathrm{i} \mu} \boldsymbol{\nabla}_{\boldsymbol{k}} \bar{\mathcal{A}} \, \mathrm{d} {\boldsymbol{k}} - \int \frac{\sigma {\boldsymbol{k}}^\perp \boldsymbol{\cdot} \boldsymbol{\nabla}_{\boldsymbol{k}} \bar{\mathcal{A}}}{\boldsymbol{c}_{\boldsymbol{g}} \boldsymbol{\cdot} \boldsymbol{q} - \mathrm{i} \mu} \, \mathrm{d} {\boldsymbol{k}} \, \boldsymbol{q}^\perp \right). \end{equation}
Noting that  $\boldsymbol {c}_{\boldsymbol {g}} = \sigma {\boldsymbol {k}}/(2 k^2)$, and that the multiplication of $\mu$ by a positive factor is irrelevant, we rewrite (3.1) as
 \begin{equation} \hat{\boldsymbol{L}}(\varphi) = \frac{16}{g {\bar {H}_s^2}} \left( \int \frac{k^2 {\boldsymbol{k}} \boldsymbol{\cdot} \boldsymbol{q}}{{\boldsymbol{k}} \boldsymbol{\cdot} \boldsymbol{q} - \mathrm{i} \mu} \boldsymbol{\nabla}_{\boldsymbol{k}} \bar{\mathcal{A}} \, \mathrm{d} {\boldsymbol{k}} - \int \frac{k^2 {\boldsymbol{k}}^\perp \boldsymbol{\cdot} \boldsymbol{\nabla}_{\boldsymbol{k}} \bar{\mathcal{A}}}{{\boldsymbol{k}} \boldsymbol{\cdot} \boldsymbol{q} - \mathrm{i} \mu} \, \mathrm{d} {\boldsymbol{k}} \, \boldsymbol{q}^\perp \right). \end{equation}
Now,  $\mu$ can be safely set to $0$ in the first integral which, on integrating by parts, reduces to
 \begin{equation} \int k^2 \boldsymbol{\nabla}_{\boldsymbol{k}} \bar{\mathcal{A}} \, \mathrm{d} {\boldsymbol{k}} ={-} 2 \boldsymbol{P}, \end{equation}
where
 \begin{equation} \boldsymbol{P} \mathop=^{\rm def} \int \bar{\mathcal{A}}({\boldsymbol{k}}) {\boldsymbol{k}} \, \mathrm{d} {\boldsymbol{k}},\end{equation}
is the wave momentum. For the second integral we use the polar representation (2.6) of the SGW wavevector. Noting that  $\boldsymbol {\nabla }_{\boldsymbol {k}} \bar{\mathcal {A}} = \partial _k \bar{\mathcal {A}}\, {\boldsymbol {k}}/k + \partial _\theta \bar{\mathcal {A}}\, {\boldsymbol {k}}^\perp /k^2$ and that ${\boldsymbol {k}} \boldsymbol {\cdot } \boldsymbol {q} = k q \cos (\theta -\varphi )$ we obtain
 \begin{equation} \hat{\boldsymbol{L}}(\varphi) ={-}\frac{16}{g {\bar {H}_s^2}} \left( 2 \boldsymbol{P} + \int \frac{k \partial_\theta \bar{\mathcal{A}}}{\cos(\theta-\varphi) - \mathrm{i} \mu} \, \mathrm{d} {\boldsymbol{k}} \boldsymbol{e}_{\boldsymbol{q}}^\perp \right), \end{equation}
where
 \begin{equation} \boldsymbol{e}_{\boldsymbol{q}}^\perp \mathop=^{\rm def} \begin{pmatrix}-\sin \varphi \\ \cos\varphi\end{pmatrix}, \end{equation}
is the unit vector perpendicular to the wavevector  $\boldsymbol {q}$.
Starting from (3.5) we can derive an explicit expression for the transfer function  $\hat {\boldsymbol {L}}(\varphi )$ as a Fourier series in $\varphi$. We rewrite (3.5) as
 \begin{equation} \hat{\boldsymbol{L}}(\varphi) ={-}\frac{16}{g {\bar {H}_s^2}} \left( 2 \boldsymbol{P} + \boldsymbol{e}_{\boldsymbol{q}}^\perp \partial_\varphi \int_0^{2{\rm \pi}} \frac{\mathcal{P}(\theta)}{\cos(\theta-\varphi) - \mathrm{i} \mu} \, \mathrm{d} \theta \right) ,\end{equation}
where
 \begin{equation} \mathcal{P}(\theta) \mathop=^{\rm def} \int_0^\infty \bar{\mathcal{A}}(k,\theta) k^2 \, \mathrm{d} k. \end{equation}
The wave momentum in (3.4) is
 \begin{equation} \boldsymbol{P} = \int_0^{2\pi} \mathcal{P}(\theta) \begin{pmatrix} \cos \theta \\ \sin \theta\end{pmatrix} \mathrm{d} \theta. \end{equation}
 With the results above,  $\hat {\boldsymbol {L}}(\varphi )$ depends on the leading-order action spectrum $\bar{\mathcal {A}}({\boldsymbol {k}})$ only through the function $\mathcal {P}(\theta )$. This function can be expanded in Fourier series as
 \begin{equation} \mathcal{P}(\theta) = \sum_{n={-}\infty}^\infty p_n \, \mathrm{e}^{n \mathrm{i} \theta}, \quad \text{with } 2 {\rm \pi}p_n = \int_0^{2{\rm \pi}} \mathcal{P}(\theta) \, \mathrm{e}^{{-}n \mathrm{i} \theta} \, \mathrm{d} \theta.\end{equation}
Computations detailed in Appendix A express the integral in (3.7) (as  $\mu \to 0^+$) in terms of the $p_n$. This puts the transfer function into the form
 \begin{equation} \hat{\boldsymbol{L}}(\varphi) = \frac{16}{g {\bar {H}_s^2}} \left(\boldsymbol{e}_{\boldsymbol{q}}^\perp \sum_{n={-}\infty}^\infty n (-\mathrm{i})^{|n|} 2 {\rm \pi}p_n \, \mathrm{e}^{n \mathrm{i} \varphi} - 2 \boldsymbol{P}\right),\end{equation}
where the wave momentum is
 \begin{equation} \boldsymbol{P} = \begin{pmatrix} +\mathop{\mathrm{Re}} 2 {\rm \pi}p_1 \\ -\mathop{\mathrm{Im}} 2 {\rm \pi}p_1 \end{pmatrix}.\end{equation}
Equation (3.11) provides the transfer function  $\hat {\boldsymbol {L}}(\varphi )$ in a form readily computable from any given background wave action spectrum $\bar{\mathcal {A}}(k,\theta )$.
3.2. Contributions of the divergent and vortical parts of current
The two-dimensional Helmholtz decomposition of  $\boldsymbol {U}$ into divergent and vortical parts is
 \begin{equation} \boldsymbol{U} = \underbrace{\boldsymbol{\nabla} \phi}_{\boldsymbol{U}_\phi} + \underbrace{\boldsymbol{\nabla}^{{\perp}} \psi}_{\boldsymbol{U}_\psi} ,\end{equation}
where  $\phi$ and $\psi$ are the potential and stream function, and $\boldsymbol {\nabla }^\perp = (-\partial _y,\partial _x)$. The corresponding decomposition of the Fourier transform $\hat {\boldsymbol {U}}$ is
 \begin{equation} \hat{\boldsymbol{U}}(\boldsymbol{q}) = \mathrm{i} q\hat \phi(\boldsymbol{q}) \boldsymbol{e}_{\boldsymbol{q}} + \mathrm{i} q \hat \psi(\boldsymbol{q}) \boldsymbol{e}_{\boldsymbol{q}}^\perp. \end{equation}
In view of (2.16), we can separate the contributions of the divergent and vortical parts of the currents by expressing the transfer function  $\hat {\boldsymbol {L}}(\boldsymbol {q})$ in terms of its components along $\boldsymbol {e}_{\boldsymbol {q}}$ and $\boldsymbol {e}_{\boldsymbol {q}}^\perp$. Projecting (3.11) on $\boldsymbol {e}_{\boldsymbol {q}}$ and $\boldsymbol {e}_{\boldsymbol {q}}^\perp$ gives
 \begin{equation} \hat{\boldsymbol{L}}(\varphi) = \hat{L}_{{\parallel}} \boldsymbol{e}_{\boldsymbol{q}} + \hat{L}_{{\perp}} \boldsymbol{e}_{\boldsymbol{q}}^\perp,\end{equation}
where
 \begin{equation} \hat{L}_{{\parallel}}(\varphi) ={-}\frac{32}{g {\bar {H}_s^2}}\boldsymbol{P} \boldsymbol{\cdot} \boldsymbol{e}_{\boldsymbol{q}},\end{equation}
and
 \begin{equation} \hat{L}_{{\perp}}(\varphi) = \frac{16}{g {\bar {H}_s^2}} \left( \sum_{n={-}\infty}^\infty n (-\mathrm{i})^{|n|} 2 {\rm \pi}p_n \, \mathrm{e}^{n \mathrm{i} \varphi} - 2 \boldsymbol{P} \boldsymbol{\cdot} \boldsymbol{e}_{\boldsymbol{q}}^\perp \right). \end{equation}
Because  $\boldsymbol {e}_{-\boldsymbol {q}} = -\boldsymbol {e}_{\boldsymbol {q}}$, the symmetry property (2.20) implies that $\hat {L}_{\parallel }(-\varphi )=- \hat {L}_{\parallel }^*(\varphi )$ and $\hat {L}_{\perp }(-\varphi )=-\hat {L}_{\perp }^*(\varphi )$.
Combining the contributions proportional to  $p_{\pm 1}$ (stemming from $n=\pm 1$ in the series and from $2 \boldsymbol {P} \boldsymbol {\cdot } \boldsymbol {e}_{\boldsymbol {q}}^\perp$), we can rewrite (3.17) as
 \begin{equation} \hat{L}_{{\perp}}(\varphi) =\frac{16}{g {\bar {H}_s^2}} \sum_{n={-} \infty}^\infty n (-\mathrm{i})^{|n|} 2 {\rm \pi}\tilde p_n \, \mathrm{e}^{\mathrm{i} n\varphi}, \end{equation}
where
 \begin{equation} \tilde p_n = \begin{cases} 2 p_{{\pm} 1} \quad & \text{if } n={\pm} 1;\\ p_n \quad & \text{if } n \not={\pm} 1. \end{cases}\end{equation}
With the form (3.15) for  $\hat {\boldsymbol {L}}(\varphi )$ and the Helmholtz decomposition (3.14), the linear map (2.16) becomes
 \begin{equation} \frac{\hat{h}_s(\boldsymbol{q})}{{\bar {H}_s}} = \mathrm{i} q \hat{L}_{{\parallel}}(\varphi) \hat \phi(\boldsymbol{q}) + \mathrm{i} q \hat{L}_{{\perp}}(\varphi) \hat\psi(\boldsymbol{q}) . \end{equation}
Here  $\hat {L}_{\parallel }$ and $\hat {L}_{\perp }$ control the dependence of $h_s$ on, respectively, the divergent and vortical parts of the current. In general, $\hat {L}_{\parallel }, \hat {L}_{\perp } \not = 0$, and both the divergent and vortical parts of the current induce modulations in SWH. However, we show in § 5.3 that for highly directional SGW spectra $\hat {L}_{\perp } \gg \hat {L}_{\parallel }$, i.e. the vortical part of the current is dominant.
4. Application to specific currents
Given the background wave action spectrum  $\bar {\mathcal {A}}({\boldsymbol {k}})$ and the current $\boldsymbol {U}({\boldsymbol {x}})$, the U2H map $\hat {h}_s {/\bar {H}_s} = \hat {\boldsymbol {L}} \boldsymbol {\cdot } \hat {\boldsymbol {U}}$, with $\hat {\boldsymbol {L}}$ in (3.11) or (3.15)–(3.17), enables the computation of $h_s$. In this section, we carry out this computation. We first use a numerical procedure suitable for arbitrary currents which we apply to two realistic configurations. We then consider the idealised cases of purely divergent and purely vortical currents for which we obtain analytic results. In all cases we compare the U2H predictions with the results of WW3 simulations.
4.1. Numerical implementation for arbitrary current
The velocity field  $\boldsymbol {U}({\boldsymbol {x}})$ is discretised on a regular grid and its Fourier transform $\widehat {\boldsymbol {U}}(\boldsymbol {q})$ is obtained on the dual Fourier grid by a fast Fourier transform. To prevent numerical artefacts due to the non-periodicity of the currents, we use a large computational domain, zero-padding $\boldsymbol {U}$ in the periphery. The inverse fast Fourier transform of the product $\hat {h}_s(\boldsymbol {q}) {/\bar {H}_s}= \hat {\boldsymbol {L}}(\varphi ) \boldsymbol {\cdot } \widehat {\boldsymbol {U}}(\boldsymbol {q})$ yields $h_s({\boldsymbol {x}})$ on the spatial grid. A Jupyter Notebook of this implementation is available at https://shorturl.at/bef14, where users can customise the input currents and background wave spectrum. We refer the reader to this Notebook for complete implementation details.
For the examples of this paper, we take the background wave action spectrum  $\bar{\mathcal {A}}(k,\theta )$ of the separable (in $k$ and $\theta$) form detailed in Appendix B. The wavenumber dependence is defined by a truncated Gaussian in $\sigma (k)$ and the angular dependence $D(\theta )$ follows the model of Longuet-Higgins, Cartwright & Smith (Reference Longuet-Higgins, Cartwright and Smith1963, LHCS hereafter)
 \begin{equation} D(\theta) \propto \cos^{2s} ( (\theta-\theta_p)/2), \end{equation}
where  $\theta _p$ is the primary angle of wave propagation, measured from the $x$-axis and in the direction of ${\boldsymbol {k}}$, and the parameter $s$ controls the directional spread. Large values, say $s \gtrsim 10$, correspond to swell-like sea states. For integer $s$, the coefficients $p_n$ in (3.10) required for $\hat {\boldsymbol {L}}(\varphi )$ have a simple closed form and vanish for $|n|>s$ (see Appendix B).
For comparison with U2H, we carry out WW3 simulations that approximate a steady solution of the linear action (2.1). The set-up is as described in Wang et al. (Reference Wang, Villas Boâs, Young and Vanneste2023) except for two aspects of the wave forcing. First, the forcing imposes the background wave action spectrum  $\bar {\mathcal {A}}({\boldsymbol {k}})$ on the entire boundary, i.e. waves enter the rectangular domain from all four sides. This improved formulation ensures that the wave spectrum in the absence of currents is uniform even for spectra with broad directional spread. (In Wang et al. (Reference Wang, Villas Boâs, Young and Vanneste2023) waves enter the computational domain only from the western boundary. Even in the complete absence of currents the resulting steady-state solution decreases with $x$ as ‘wave shadows’ from the northern and southern boundaries encroach into the centre of the domain.) Second, to ensure consistency with U2H, we zero-pad the domain of the currents in strips with widths of four grid spacings so that waves are forced at current-free boundaries. For both U2H and WW3 we report SWH anomalies obtained by subtracting the spatial average over the (unpadded) domain shown in the figures.


Figure 3. (a) Surface current speed in an MITgcm simulation of the Gulf Stream, with the arrow indicating the primary direction of wave propagation; SWH anomaly computed using (b) WW3 and (c) the U2H map. (d) Difference between (c) and (b). The background wave action spectrum uses the LHCS model spectrum (B1) with  $s=16$ and peak angle $\theta _p=191 ^{\circ }$.
We apply the U2H and the WW3 implementations on two examples of realistic currents. The first example, already shown in figure 1, uses a snapshot of currents in the California Current system simulated from MITgcm, as configured in Villas Boâs et al. (Reference Villas Boâs, Cornuelle, Mazloff, Gille and Ardhuin2020). The current speed reaches  $0.65\ {\rm m}\ {\rm s}^{-1}$ at its maximum. The waves are forced with peak period $10.3$ s corresponding to a wavelength of 166 m and a group speed of 8 m s $^{-1}$. The waves are swell-like with parameter $s=10$, and propagate primarily in the direction $\theta _p=0$. The U2H prediction of $h_s$ (figure 1c) is in good agreements with that from WW3 (figure 1b), with difference field (figure 1d) lower than $7\,\%$ in amplitude of $h_s/\bar {H}_s$. The SWH anomalies predicted by U2H have larger overall amplitudes than of WW3. This is reflected in the probability densities shown in figure 2(a), which confirm that U2H predicts more extreme values than WW3. We tentatively attribute this to numerical damping effects from WW3.
The second example, shown in figure 3, uses a Gulf Stream current's snapshot from the MITgcm simulation in figure 1 of Ardhuin et al. (Reference Ardhuin, Gille, Menemenlis, Rocha, Rascle, Chapron, Gula and Molemaker2017). The current speed reaches  $2.9\ {\rm m}\ {\rm s}^{-1}$ at their maximum. The waves are forced with peak period of $14.3$ s corresponding to a wavelength of $319$ m and group speed of $11\ {\rm m}\ {\rm s}^{-1}$, and are swell-like, with parameter $s=16$ and $\theta _p=191^{\circ }$. These parameters are estimated from buoy data for the same time as for figure 1 in Ardhuin et al. (Reference Ardhuin, Gille, Menemenlis, Rocha, Rascle, Chapron, Gula and Molemaker2017). Although we use a similar current snapshot and wave forcing as Ardhuin et al. (Reference Ardhuin, Gille, Menemenlis, Rocha, Rascle, Chapron, Gula and Molemaker2017), our WW3 configuration is different from theirs, and disagreements in $h_s$ are expected. In this example, the SWH anomalies are large, with $h_s/\bar {H}_s$ exceeding 50 % in some locations, challenging our assumption of linearity. Nonetheless, there is a good qualitative match between the WW3 and U2H results. The largest differences arise in regions of high-speed currents. The probability density functions from the U2H and WW3 outcomes (figure 2b) are skewed differently. These differences may be attributed to higher-order terms neglected by U2H.
We now consider idealised scenarios to gain insight into the dependence of  $h_s$ on $\boldsymbol {U}$.
4.2. Divergent current
For a purely divergent current, with  $\boldsymbol {U}_{\psi }=\boldsymbol{0}$, (3.20) reduces to
 \begin{equation} \hat{h}_s(\boldsymbol{q}) ={-}\frac{32}{g \bar {H}_s} \mathrm{i} q \hat \phi(\boldsymbol{q})\, \boldsymbol{P} \boldsymbol{\cdot} \boldsymbol{e}_{\boldsymbol{q}} .\end{equation}
Since  $\mathrm {i} q \boldsymbol {e}_{\boldsymbol {q}} = \mathrm {i} \boldsymbol {q}$, the inverse Fourier transform of (4.2) is
 \begin{equation} h_s ={-}\frac{32}{g \bar {H}_s} \boldsymbol{U}_{\phi}\boldsymbol{\cdot} \boldsymbol{P} .\end{equation}
Thus, the SWH anomaly that arises in response to a divergent current is proportional to the component of current velocity along the wave momentum. In particular, the response is local and vanishes where the current vanishes.
We illustrate (4.3) with a simple axisymmetric, divergent current whose divergence is the Gaussian
 \begin{equation} \boldsymbol{\nabla} \boldsymbol{\cdot} \boldsymbol{U} = \nabla^2 \phi =\frac{\kappa}{2{\rm \pi} r_{v}^2} \, \mathrm{e}^{{-}r^2/2r_{v}^2},\end{equation}
where  $r_{v}=25\ \text {km}$ is the characteristic radius and $\kappa$ is the area flux, set such that the maximum current speed $U_m=\sqrt {U^2+V^2}$ is $0.8\ {\rm m}\ {\rm s}^{-1}$.
Figure 4 compares the U2H prediction (4.3) for this current with results from WW3 simulations for three values of the directionality parameter  $s$. Figure 4 confirms the validity of the U2H prediction and the local nature of the SWH response. This response to divergent currents has a spatial structure independent of the directional spread of wave energy, i.e. $h_s$ in (4.3) depends only on $\boldsymbol {P}$. This striking result is in sharp contrast with the response to vortical currents as we show next.

Figure 4. The SWH anomaly for the divergent flow with Gaussian divergence (4.4) with characteristic radius  $r_v = 25$ km (indicated by the dashed circle) and maximum speed $0.8\ {\rm m}\ {\rm s}^{-1}$. The results of WW3 simulations (a,c,e) are compared with the U2H prediction (4.3) (b,d,f) for three values of the parameter $s$ characterising the directional width of the wave spectrum.


4.3. Vortical current
For a purely vortical currents,  $\boldsymbol {U}_{\phi }=\boldsymbol {0}$ in (3.13) and the U2H map in (3.20) is determined by the scalar transfer function $\hat {L}_{\perp }(\varphi )$, which is explicitly computed from the series in (3.18). As a demonstration, we consider a Gaussian vortex, with zero divergence and vorticity in physical and Fourier space given by
 \begin{equation} \zeta({\boldsymbol{x}})=\frac{\kappa}{2{\rm \pi} r_{v}^2} \mathrm{e}^{{-}r^2/(2r_{v}^2)} \quad \textrm{and} \quad \hat \zeta (\boldsymbol{q}) = \kappa \mathrm{e}^{{-}r_{v}^2 q^2/2}, \end{equation}
where  $\kappa$ is the circulation. We take advantage of the axisymmetry of this flow to carry out the Fourier inversion leading to $h_s({\boldsymbol {x}})$ analytically. Calculations detailed in Appendix D yield the explicit expression
 \begin{equation} h_s({\boldsymbol{x}})={-}\frac{16 \mathrm{i}}{g \bar {H}_s } \frac{\kappa}{r_{v}} \sqrt{\frac{\rm \pi}{2}} \mathrm{e}^{{-}r^2/4 r_v^2} \sum_{n={-}\infty}^\infty n \, \tilde p_n \, I_{|n|/2}(r^2/4 r_v^2) \, \mathrm{e}^{\mathrm{i} n \nu}, \end{equation}
where  ${\boldsymbol {x}} = r (\cos \nu,\sin \nu )$ and the $I_{|n|}$ are modified Bessel functions. The coefficients $\tilde p_n$ depend only on the wave spectrum and are related to the already obtained $p_n$ according to (3.19). Equation (4.6) has the advantage over the general implementation of the U2H map described in § 4.1 in that it gives $h_s({\boldsymbol {x}})$ at any location without the need for entire computational domains in both physical and Fourier domains.
Figure 5 compares the SWH anomaly (4.6) with that obtained in WW3 simulations. The parameters  $r_v = 25$ km and $U_m = 0.8\ {\rm m}\ {\rm s}^{-1}$ are the same as those of the divergent flow in § 4.2. The SWH response in figure 5 is very different from the response to divergent currents in figure 4. The SWH anomaly in figure 5 extends beyond the vortex. For the swell-like case $s=10$ there is a wake-like feature decaying slowly in the direction of wave propagation. This physically important limiting case is discussed in § 5.3 and in Wang et al. (Reference Wang, Villas Boâs, Young and Vanneste2023).
5. Particular wave spectra
In this section we examine the role of the background wave action spectrum  $\bar {\mathcal {A}}({\boldsymbol {k}})$ in shaping the SWH anomaly by considering special and limiting cases.

Figure 6. The SWH anomaly computed using WW3 for an isotropic wave spectrum ( $s=0$ in the LHCS model) with the Gaussian vortex $\zeta (r)$ in (4.5a,b). (a) Contour of $h_s$ for $U_m=0.8\ {\rm m}\ {\rm s}^{-1}$, with the dashed circle indicating the vortex radius $r_{v}$. (b) Cross-section of $h_s$ at $x=0$ (slicing through the centre of the vortex) for $U_m=1.6\ {\rm m}\ {\rm s}^{-1}$ (blue solid curve) and $U_m=0.8\ {\rm m}\ {\rm s}^{-1}$ (yellow solid curve). The yellow dashed curve is obtained by multiplying $h_s$ for $U_m=0.8\ {\rm m}\ {\rm s}^{-1}$ by 4.
5.1. Isotropic wave spectrum
Equation (3.5) shows that  $\hat {\boldsymbol {L}}(\varphi )=0$ if the background wave action (or energy) spectrum is isotropic since $\partial _\theta \bar {\mathcal {A}}({\boldsymbol {k}})= 0$ and $\boldsymbol {P}=0$ as a consequence. Thus, if the wave spectrum is isotropic, currents do not induce modulations of the SWHs (at the order we consider).
To verify this, we run WW3 simulations with the isotropic wave spectrum obtained by setting  $s=0$ in the LHCS model of Appendix B and the currents from either the MITgcm simulation in figure 1 or the Gaussian vortex of figure 5. The SWH anomaly $h_s$ in both cases is at most 3 %, much smaller than found for anisotropic spectra. The small but non-zero $h_s$ for isotropic spectra is the result of effects quadratic in $\boldsymbol {U}$. This $O(\epsilon^2)$-term is not captured by the linear U2H map. We confirm this by increasing the velocity of the Gaussian vortex by a factor of 2 (setting $U_m= 1.6\ {\rm m}\ {\rm s}^{-1}$ instead of 0.8 m s $^{-1}$) so that $h_s$ increases by a factor 4, see figure 6. (The MITgcm outcome is not shown.)
5.2. Mildly anisotropic wave spectrum
The U2H map is particularly simple for the spectrum
 \begin{equation} \bar{\mathcal{A}}({\boldsymbol{k}}) = \mathcal{A}_0(k) + \mathcal{A}_c(k) \cos \theta,\end{equation}
e.g. as in the LHCS spectrum with  $s=1$ used for figures 4(a,b) and 5(a,b). For the action spectrum in (5.1) the wave momentum (3.4) can be written as
 \begin{equation} \boldsymbol{P} = |\boldsymbol{P}| \begin{pmatrix} 1 \\ 0 \end{pmatrix}= |\boldsymbol{P}| \cos \varphi \boldsymbol{e}_{\boldsymbol{q}} - |\boldsymbol{P}| \sin \varphi \boldsymbol{e}_{\boldsymbol{q}}^\perp, \end{equation}
where
 \begin{equation} | \boldsymbol{P} | = {\rm \pi}\int \mathcal{A}_c(k) k^2 \mathrm{d} k. \end{equation}
The function  $\mathcal {P}(\theta )$ defined in (3.8) is then
 \begin{equation} \mathcal{P}(\theta) = \int \mathcal{A}_0(k) k^2 \mathrm{d} k + \frac{|\boldsymbol{P}|}{\rm \pi} \cos \theta, \end{equation}
and  $2 {\rm \pi}p_1 = 2 {\rm \pi}p_{-1} = |\boldsymbol {P}|$. The transfer function in (3.11) reduces to
 \begin{equation} \hat{\boldsymbol{L}}(\varphi) = \frac{32 }{g {\bar {H}_s^2}} |\boldsymbol{P}| (2 \sin \varphi \boldsymbol{e}_{\boldsymbol{q}}^\perp- \cos \varphi \boldsymbol{e}_{\boldsymbol{q}}). \end{equation}
With the Helmholtz decomposition (3.14), the U2H map is
 \begin{align} \frac{\hat{h}_s(\boldsymbol{q})}{{\bar {H}_s}}&= \hat{\boldsymbol{L}}(\boldsymbol{q}) \boldsymbol{\cdot} \hat{\boldsymbol{U}}(\boldsymbol{q}), \end{align}
 \begin{align} &= \frac{32 }{g {\bar {H}_s^2}}(2|\boldsymbol{P}|\, \mathrm{i} q \sin \varphi\, \hat \psi - |\boldsymbol{P}|\, \mathrm{i} q\cos \varphi\, \hat \phi ). \end{align}
The inverse Fourier transform can be taken by inspection and the result written as
 \begin{equation} h_s ={-}\frac{32}{g\bar {H}_s} (2 \boldsymbol{U}_\psi \boldsymbol{\cdot} \boldsymbol{P} + \boldsymbol{U}_\phi \boldsymbol{\cdot} \boldsymbol{P} ).\end{equation}
 In this simple case, only the component of current along  $\boldsymbol {P}$ produces a SWH anomaly which turns out to be local, vanishing where the current vanishes. In (5.8) the vortical part of the current, $\boldsymbol {U}_\psi$, is twice as effective as the divergent part, $\boldsymbol {U}_\phi$. The divergent contribution in (5.8) is identical to that in (4.3) which applies to arbitrary wave spectra. This example, which corresponds to figures 4(a,b) and 5(a,b), shows that the response to divergent currents is not always negligible relative to the vortical response. This is in contrast with Villas Boâs et al.'s (Reference Villas Boâs, Cornuelle, Mazloff, Gille and Ardhuin2020) suggestion that only the vortical part of the current affects $h_s$. The next section, however, shows that the imprint of the vortical part of the current is much larger than that of the divergent part for highly directional wave spectra.
5.3. Highly directional wave spectrum
We conclude above that  $h_s$ is small for an isotropic wave spectrum. It is of interest to examine the opposite limit of a highly directional wave spectrum. This limit corresponds to an action spectrum of the form
 \begin{equation} \bar{\mathcal{A}}(k,\theta) = \delta^{{-}1} \bar{\mathcal{A}}(k,\varTheta), \quad \text{where } \varTheta = \theta/\delta, \end{equation}
with  $\delta \ll 1$ the relevant small parameter, and we assume that $\theta =0$ is the primary propagation direction. The prefactor $\delta ^{-1}$ ensures that the action spectrum integrated over $\theta$ is $O(1)$. Correspondingly, we have
 \begin{equation} \mathcal{P}(\theta) = \delta^{{-}1} \mathcal{P}(\varTheta).\end{equation}
For simplicity, we abuse notation by using the same symbols  $\bar{\mathcal {A}}$ and $\mathcal {P}$ on both sides of (5.9) and (5.10), distinguishing them by their arguments. Similar to the treatment of $\varepsilon$ in (2.8), we use $\delta$ as a bookkeeping parameter that is set to $1$ in the end.
Taking (3.7) as a starting point, we obtain an asymptotic approximation to  $\hat {\boldsymbol {L}}(\varphi )$ in Appendix C. There we show that the dominant contribution to $\hat {\boldsymbol {L}}(\varphi )$ comes from the integral term and is large in small regions around $\varphi = \pm {\rm \pi}/2$. In terms of the rescaled variable
 \begin{equation} \varPhi_\pm= (\varphi \mp {\rm \pi}/2)/\delta=O(1),\end{equation}
the leading-order approximation to the transfer function in these regions is
 \begin{equation} \hat{\boldsymbol{L}}(\varphi) \sim \hat{L}_{{\perp}}(\varphi) \begin{pmatrix} \mp 1 \\ 0 \end{pmatrix} \sim \frac{16}{g {\bar {H}_s^2} \delta^2} \, \partial_{\varPhi_\pm} \int_{-\infty}^\infty \frac{\mathcal{P}(\varTheta)}{\varTheta - \varPhi_\pm \mp \mathrm{i} \mu} \, \mathrm{d} \varTheta \, \begin{pmatrix}1 \\ 0 \end{pmatrix}. \end{equation}
Thus,  $\hat {\boldsymbol {L}}(\varphi )$ is dominant and $O(\delta ^{-2})$ in narrow, $O(\delta )$, sectors around $\varphi = \pm {\rm \pi}/2$. We conclude the following.
(i) For typical
$\hat {\boldsymbol {U}}(\boldsymbol {q})$, patterns of $h_s$ take the form of structures elongated in the direction of propagation of the waves, i.e. streaks, with an $O(\delta )$ aspect ratio.(ii) Magnitudes of the two scalar transfer functions are related via
$\hat {L}_{\perp } = O(\delta ^{-2}) \hat {L}_{\parallel }$, since $\hat {L}_{\parallel } = O(1)$ (see (C4)). According to (3.20), this implies that the divergent-free, vortical part of the velocity field $\boldsymbol {U}$ has an asymptotically larger impact on $h_s$ than the potential part.(iii) Highly directional waves produce SWH anomalies larger by a factor
$\delta ^{-1}$ than those induced for spectra with $O(1)$ directional spread. (This estimate accounts for both the factor $\delta ^{-2}$ in (C4) and the $O(\delta )$ width of the support of $\hat {L}_{\perp }(\varphi )$ implied by (5.11).)(iv) As a result of (iii), the linear approximation that underpins U2H requires that
$\varepsilon \ll \delta$ in addition to $\varepsilon \ll 1$. We discuss this further at the end of the section.


We illustrate the asymptotic result (C4) by considering the limit  $s \to \infty$ of the LHCS spectrum. Taking this limit in (B2) gives
 \begin{equation} \mathcal{P}(\varTheta) = \frac{\alpha}{\sqrt{2{\rm \pi}}} \mathrm{e}^{-\varTheta^2/2}, \quad \text{where } \delta =\sqrt{2/s},\end{equation}
and  $\alpha$ a constant determined by the dependence of the spectrum on $k$. Using (5.13) and the Sokhotski–Plemelj theorem, we rewrite the integral term in (C4) as
 \begin{align} \int_{-\infty}^\infty \frac{\mathcal{P}(\varTheta)}{\varTheta - \varPhi_\pm \mp \mathrm{i} \mu} \, \mathrm{d} \varTheta &= \frac{\alpha}{\sqrt{2 {\rm \pi}}} \left({\pm} \mathrm{i} {\rm \pi}\, \mathrm{e}^{-\varPhi_{{\pm}}^2/2} + {\unicode{x2A0D}}_{-\infty}^\infty \frac{\mathrm{e}^{-\varTheta^2/2}}{\varTheta-\varPhi_{{\pm}}}\,\mathrm{d}\varTheta \right) \nonumber\\ &= \alpha ({\pm} \mathrm{i} \sqrt{{\rm \pi}/2} \, \mathrm{e}^{-\varPhi_{{\pm}}^2/2} - \sqrt{2} \, \mathrm{daw}(\varPhi_{{\pm}}/\sqrt{2}) ), \end{align}
where  ${\unicode{x2A0D}}$ denotes the Cauchy principal value and $\mathrm {daw}({\cdot })$ denotes the Dawson function (DLMF 2023). Using that $\mathrm {daw}'(x)=1-2x \, \mathrm {daw}(x)$ (DLMF 2023) we can evaluate the right-hand side of (C4) to find
 \begin{equation} \hat{L}_{{\perp}}(\varphi) = \frac{16 \alpha}{g {\bar {H}_s^2}\delta^2} \begin{cases} \mathrm{i} \sqrt{{\rm \pi}/2} \varPhi_+ \,\mathrm{e}^{-\varPhi_+^2/2} + 1 - \sqrt{2}\varPhi_+ \, \mathrm{daw}(\varPhi_+{/}\sqrt{2}), & \text{for } 0\leq\varphi<{\rm \pi};\\ \mathrm{i} \sqrt{{\rm \pi}/2} \varPhi_{-} \,\mathrm{e}^{-\varPhi_{-}^2/2} - 1+ \sqrt{2}\varPhi_{-} \, \mathrm{daw}(\varPhi_{-}/\sqrt{2}), & \text{for } -{\rm \pi}<\varphi<0 . \end{cases}\end{equation}
Figure 7. Magnitudes of the transfer functions  $\hat {L}_{\perp }(\varphi )$ (a) and $\hat {L}_{\parallel }(\varphi )$ (b) associated with the vortical and potential part of the current as functions of $\varphi$ for the LHCS spectrum with directionality parameter $s=1, 10$ and $15$. The exact values computed from (3.16) and (3.17) are shown by the dashed lines; the solid lines in (a) show the large- $s$ approximation (5.15) for $\hat {L}_{\perp }(\varphi )$. We take advantage of the symmetry (2.20) to show only the range $\varphi \in [0,{\rm \pi} ]$.

Figure 8. The SWH anomaly for a highly directional ( $s=10$) wave spectrum and MITgcm current of figure 1 computed with the full U2H map (panel (a) identical to figure 1c), and with the $s \gg 1$ asymptotic approximation (b). This figure can be produced from the notebook accessible at https://www.cambridge.org/S0022112024009649/JFM-Notebooks/files/U2Hmap.
Figure 7 compares the asymptotic approximation (5.15) of  $\hat {L}_{\perp }$ with the exact values obtained from (3.17) for $s=1$, $10$ and $15$. It shows the asymptotic approximation to be reasonably accurate for $s = 10$. We have checked that the error scales as $O(\delta ^2)$. The figure also shows $\hat {L}_{\parallel }$ in (3.16) to confirm that $\hat {L}_{\perp } \gg \hat {L}_{\parallel }$, and hence that vortical part of the current dominates over the divergent part, for $s \gg 1$.
As an application of (5.15), in figure 8 we compare the predictions of the U2H map for the MITgcm simulation current of figure 1 computed with the exact  $\hat {\boldsymbol {L}}$ and with the asymptotic approximation (5.15). The match is very good, even though for $s=10$, $\delta \approx 0.45$ is only marginally small. The code applying the expression (5.15) is available on the Jupyter Notebook https://shorturl.at/bef14, where readers can also experiment with different choices of the parameter $s$ to observe how the agreements get better/worse with larger/smaller $s$.
$s$.
We conclude by connecting the results of this section with those of Wang et al. (Reference Wang, Villas Boâs, Young and Vanneste2023). They focus on the regime  $\delta \ll 1$ and on localised currents. Using matched asymptotics, they obtain an asymptotic expression for the total SWH, $H_s = \bar {H}_s + h_s$, in the presence of currents. This expression holds without the linearity assumption $h_s \ll \bar {H}_s$ that underpins the U2H map. Specifically, they consider the distinguished limit $\delta = O(\varepsilon )$ which leads to $h_s/\bar {H}_s = O(1)$. Wang et al. (Reference Wang, Villas Boâs, Young and Vanneste2023) give a simplified form valid when $\varepsilon \ll \delta \ll 1$. In Appendix C we show that U2H in the approximation (C4) reduces to this form for localised currents.
6. Discussion and conclusion
In the oceanographic regime with  $U/{c_g} \ll 1$ the effect of currents on an underlying spatially uniform action spectrum $\bar{\mathcal {A}}({\boldsymbol {k}})$ can be determined by solving the linear problem in (2.10) and (2.11) for the anomaly in action density $a({\boldsymbol {x}},{\boldsymbol {k}})$. We have focused on extraction of the anomaly in SWH, $h_s({\boldsymbol {x}})$, via the weighted ${\boldsymbol {k}}$-integral of $a({\boldsymbol {x}},{\boldsymbol {k}})$ in (2.15). The results are in good agreement with numerical solutions of WW3. There is a significant generalisation of this procedure: given $a({\boldsymbol {x}},{\boldsymbol {k}})$, other important SGW properties, such as the current-induced anomaly in the Stokes drift, are only a ${\boldsymbol {k}}$-integral away.
Assumptions involved in the U2H map, listed in § 2, are violated in several ocean-relevant scenarios: interactions of surface waves with tidal and near-inertial currents violate the assumption of steady current (e.g. Tolman Reference Tolman1988, Reference Tolman1990; Gemmrich & Garrett Reference Gemmrich and Garrett2012; Ho et al. Reference Ho, Merrifield and Pizzo2023; Halsne et al. Reference Halsne, Benetazzo, Barbariol, Christensen, Carrasco and Breivik2024); short surface waves in the saturation range of the wave spectrum violate the assumptions of scale separation and large group speed (e.g. Rascle et al. Reference Rascle, Molemaker, Marié, Nouguier, Chapron, Lund and Mouche2017; Lenain & Pizzo Reference Lenain and Pizzo2021; Vrećica, Pizzo & Lenain Reference Vrećica, Pizzo and Lenain2022); and conditions of active wave generation and dissipation make the source terms non-negligible (e.g. Holthuijsen & Tolman Reference Holthuijsen and Tolman1991; Chen et al. Reference Chen, Price, Zhao, Donelan and Walsh2007; Romero et al. Reference Romero, Lenain and Melville2017). These scenarios are not explored in this work. Nevertheless, for relatively long surface waves interacting with open-ocean currents, our assumptions are often satisfied.
Linearity of the partial differential equation (2.10) implies that there is a linear map from  $\boldsymbol {U}$ to $h_s$. Can this U2H map be inverted to produce an H2U map? Not in general: U2H maps a vector field to a scalar field, so cannot be expected to have an inverse. The non-invertibility of U2H is illustrated by considering the mildly anisotropic spectrum of § 5.2: (5.7) implies that $h_s=0$ for a velocity field with potential and stream function satisfying $2 \psi _y - \phi _x = 0$, demonstrating the non-uniqueness of $\boldsymbol {U}$ for a given $h_s$. Observations of $h_s$, however, provide partial information about $\boldsymbol {U}$. For swell-like waves, in particular, § 5.3 shows that $h_s$ can be approximated by a linear operator acting on the vortical component of the current; in this case, we can infer vorticity from $h_s$.
An important qualitative result emerging quickly from the analysis is that the transfer function,  $\hat {\boldsymbol {L}}$ in (2.19), does not depend on the magnitude $q$ of the current wavenumber $\boldsymbol {q}$, but only on its direction $\varphi$. This implies that the spatial scale of variations in $h_s$ is set by those of the current $\boldsymbol {U}$, e.g. power-law $\boldsymbol {U}$-spectra result in power-law $h_s$-spectra with the same slope (Ardhuin et al. Reference Ardhuin, Gille, Menemenlis, Rocha, Rascle, Chapron, Gula and Molemaker2017; Romero et al. Reference Romero, Hypolite and McWilliams2020; Villas Boâs et al. Reference Villas Boâs, Cornuelle, Mazloff, Gille and Ardhuin2020). Using (3.20) we are now exploring the ramifications of this result.
Supplementary material
Computational Notebook files are available as supplementary material at https://doi.org/10.1017/jfm.2024.964 and online at https://www.cambridge.org/S0022112024009649/JFM-Notebooks and https://github.com/hannnwang/The-U2H-map.
Acknowledgements
The authors thank F. Ardhuin for providing the Gulf Stream current field used in figure 3. Comments from the reviewers have substantially improved the manuscript.
Funding
J.V. and H.W. are supported by the UK Natural Environment Research Council (grant NE/W002876/1). A.B.V.B. is supported by NASA award 80NSSC23K0979 through the International Ocean Vector Winds Science Team, NASA award 80NSSC24K1640 through the SWOT science team and NASA award 80NSSC24K0411 through the S-MODE Science Team. W.R.Y. is supported by the National Science Foundation award 2048583.
Declaration of interests
The authors report no conflict of interest.
Data availability statement
The customisable Jupyter Notebook that computes the U2H map from  $\boldsymbol {U}$ to $h_s$ under an LHC incoming wave spectrum is available on https://www.cambridge.org/S0022112024009649/JFM-Notebooks and https://github.com/hannnwang/The-U2H-map. The configuration files used to produce the outputs from WW3 used in this work are available at https://github.com/biavillasboas/U2H.
Appendix A. Computable form of the transfer function $\hat {\boldsymbol {L}}$

Introducing (3.10) into the integral in (3.7) and changing the integration variable from  $\theta$ to $\theta + \varphi$ gives
 \begin{equation} \int_0^{2{\rm \pi}} \frac{\mathcal{P}(\theta)}{\cos(\theta-\varphi) - \mathrm{i} \mu} \, \mathrm{d} \theta =\sum_{n={-}\infty}^\infty \left( \int_0^{2{\rm \pi}} \frac{\mathrm{e}^{n \mathrm{i} \theta}}{ \cos \theta - \mathrm{i} \mu} \, \mathrm{d} \theta \right) \, p_n \, \mathrm{e}^{n\mathrm{i} \varphi}. \end{equation}
The integrals on the right-hand side can be evaluated explicitly using contour integration in the complex plane. Consider first  $n\ge 0$ and let $z=\mathrm {e}^{\mathrm {i} \theta }$ so that
 \begin{equation} \int_0^{2{\rm \pi}} \frac{\mathrm{e}^{n \mathrm{i} \theta}}{ \cos\theta - \mathrm{i} \mu} \, \mathrm{d} \theta ={-} 2 \mathrm{i} \oint \frac{z^n}{z^2-2\mathrm{i} \mu z +1} \, \mathrm{d} z.\end{equation}
We can now use the residue theorem, noting that the integrand has the two poles  $z_\pm = \pm \mathrm {i} + \mathrm {i} \mu + O(\mu ^2)$ and that only $z_-$ is enclosed by the integration contour since $\mu \to 0^+$. This leads to
 \begin{equation} \lim_{\mu \to 0^+} \int_0^{2{\rm \pi}} \frac{\mathrm{e}^{n \mathrm{i} \theta}}{ \cos \theta - \mathrm{i} \mu} \, \mathrm{d} \theta = 2 {\rm \pi}(-\mathrm{i})^{n-1} \quad \textrm{for}\ n \ge 0. \end{equation}
For  $n<0$, we can let $\theta \mapsto - \theta$ on the left-hand side of (A2) to conclude that (A3) holds with $n \mapsto -n$. Hence, for any $n$,
$n$,
 \begin{equation} \lim_{\mu \to 0^+} \int_0^{2{\rm \pi}} \frac{\mathrm{e}^{n \mathrm{i} \theta}}{ \cos \theta - \mathrm{i} \mu} \, \mathrm{d} \theta = 2 {\rm \pi}(-\mathrm{i})^{|n|-1}, \end{equation}
and (A1) reduces in the limit  $\mu \to 0^+$ to
 \begin{equation} \lim_{\mu \to 0^+} \int_0^{2{\rm \pi}} \frac{\mathcal{P}(\theta)}{\cos(\theta-\varphi) - \mathrm{i} \mu} \, \mathrm{d} \theta = 2 {\rm \pi}\sum_{n={-}\infty}^\infty (-\mathrm{i})^{|n|-1} p_n \, \mathrm{e}^{n\mathrm{i} \varphi}.\end{equation}
Taking the derivative in  $\varphi$ leads to the coefficient in front of $\boldsymbol {e}_{\boldsymbol {q}}^\perp$ in (3.11).
The computation of the wave momentum  $\boldsymbol {P}$ in terms of the Fourier coefficients of the action spectrum is straightforward: using (3.4), (2.6), (3.8) and (3.10) we find
 \begin{align} \boldsymbol{P} &= \int_0^\infty \int_0^{2{\rm \pi}} \mathcal{A}(k,\theta) k^2 \begin{pmatrix} \cos \theta \\ \sin \theta \end{pmatrix} \, \mathrm{d} k \mathrm{d} \theta = \int_0^{2{\rm \pi}} \mathcal{P}(\theta) \begin{pmatrix} \cos \theta \\ \sin \theta \end{pmatrix} \, \mathrm{d} \theta \nonumber\\ &= \sum_{n={-}\infty}^\infty \int_0^{2{\rm \pi}} \begin{pmatrix} \cos \theta \\ \sin \theta \end{pmatrix} \, \mathrm{e}^{n \mathrm{i} \theta} \, \mathrm{d} \theta \,p_n = \begin{pmatrix} +\mathop{\mathrm{Re}} 2 {\rm \pi}p_1 \\ - \mathop{\mathrm{Im}} 2 {\rm \pi}p_1 \end{pmatrix}. \end{align}
Appendix B. The LHCS spectrum
We use the spectrum proposed by Longuet-Higgins et al. (Reference Longuet-Higgins, Cartwright and Smith1963). This takes the separable form
 \begin{equation} \bar{\mathcal{A}}(k,\theta)= f(k) \times \underbrace{\frac{\varGamma(s+1)}{2 \sqrt{\rm \pi} \varGamma(s+1/2)} \cos^{2s}((\theta-\theta_p)/2)}_{D(\theta)}.\end{equation}
For convenience, we assume that the peak angle  $\theta _p = 0$ in this appendix. (For $\theta _p \neq 0$, the final expression for $p_n$ should be multiplied by $\mathrm {e}^{-\mathrm {i} n \theta _p}$.) In (B1) the parameter $s \ge 0$ controls the directional spread around the primary direction of wave propagation conventionally taken along the positive $x$-axis. The wavenumber function $f(k)$ is chosen so that the frequency spectrum is a truncated Gaussian with standard deviation of $0.040\ {\rm rad}\ {\rm s}^{-1}$ and peak angular frequencies at $\sigma = 0.44\ {\rm rad}\ {\rm s}^{-1}$ (corresponding to peak period at $14.3$ s) for the Gulf Stream example in figure 2, or at $\sigma = 0.61\ {\rm rad}\ {\rm s}^{-1}$ (corresponding to peak period at $10.3$s) for all the other examples.
We take advantage of linearity to report all numerical results in terms of the relative SWH anomaly  $h_s/\bar {H}_s$ so the amplitude of the Gaussian in (B1), proportional to $\bar {H}_s$, is unimportant in this paper.
With (B1), the function  $\mathcal {P}(\theta )$ in (3.8) becomes
 \begin{equation} \mathcal{P} (\theta) = \alpha D(\theta), \quad \textrm{where } \alpha \mathop=^{\rm def} \int_0^\infty f(k) k^2 \mathrm{d} k. \end{equation}
The Fourier coefficients of  $D(\theta )$, denoted $p_n$ in (3.10), are real and satisfy $p_{-n}=p_{n}$. When $s$ is an integer, $\varGamma (s+1/2)$ can be expressed in terms of factorials and then these coefficients are
 \begin{equation} p_n = \frac{\alpha}{2{\rm \pi}} \begin{cases} \displaystyle{\frac{(s!)^2}{(s+n)!(s-n)!}} & \text{for} \ |n| \le s ;\\ 0 & \text{for} \ |n| >s. \end{cases} \end{equation}
The wave momentum is
 \begin{equation} \boldsymbol{P} = \frac{\alpha s}{s+1} \begin{pmatrix} 1 \\ 0\end{pmatrix}. \end{equation}
Appendix C. The U2H map for highly directional spectra
We derive an asymptotic approximation for  $\hat {\boldsymbol {L}}(\varphi )$ in (3.7) for a spectrum (5.9) in the limit $\delta \to 0$. We first note that
 \begin{equation} \boldsymbol{P} = \int_{-{\rm \pi}/\delta}^{{\rm \pi}/\delta} \mathcal{P}(\varTheta) \begin{pmatrix} \cos(\delta \varTheta) \\ \sin(\delta \varTheta) \end{pmatrix} \, \mathrm{d} \varTheta = 2{\rm \pi} p_0 \begin{pmatrix} 1 \\ 0 \end{pmatrix} + O(\delta).\end{equation}
Thus, the first term in (3.7) makes an  $O(1)$ contribution to $\hat {\boldsymbol {L}}(\varphi )$. To evaluate the second term, we approximate the integral involved as
 \begin{align} \int \frac{\mathcal{P}(\varTheta)}{\cos(\delta \varTheta-\varphi) - \mathrm{i} \mu} \, \mathrm{d} \varTheta &= \frac{1}{\cos \varphi} \int \mathcal{P}(\varTheta) \, \mathrm{d} \varTheta + O(\delta) \nonumber\\ &=\frac{2 {\rm \pi}p_0}{\cos \varphi} + O(\delta). \end{align}
This is also  $O(1)$ except near $\varphi = \pm {\rm \pi}/2$. There we use the rescaled variables $\varPhi _\pm = (\varphi \mp {\rm \pi}/2)/\delta$ to write
 \begin{align} \int \frac{\mathcal{P}(\varTheta)}{\cos(\delta \varTheta-\varphi) - \mathrm{i} \mu} \, \mathrm{d} \varTheta &={\pm} \int \frac{\mathcal{P}(\varTheta)}{\sin(\delta \varTheta-\delta \varPhi_\pm) \mp \mathrm{i} \mu} \, \mathrm{d} \varTheta \nonumber\\ &={\pm} \delta^{{-}1} \int \frac{\mathcal{P}(\varTheta)}{\varTheta-\varPhi_\pm \mp \mathrm{i} \mu} \, \mathrm{d} \varTheta + O(\delta). \end{align}
Introducing (C1), (C2) and (C3) into (3.7), we find
 \begin{align} \hat{\boldsymbol{L}}(\varphi) \sim \frac{16}{g {\bar {H}_s^2}} \times \begin{cases} -\displaystyle{\delta^{{-}2} \partial_{\varPhi_+} \int_{-\infty}^\infty \frac{\mathcal{P}(\varTheta)}{\varTheta - \varPhi_+ - \mathrm{i} \mu} \, \mathrm{d} \varTheta \, \boldsymbol{e}_{\boldsymbol{q}}^\perp+O(1)} & \text{for} \ |\varphi - {\rm \pi}/2| = O(\delta); \\ \displaystyle{\delta^{{-}2} \partial_{\varPhi_-} \int_{-\infty}^\infty \frac{\mathcal{P}(\varTheta)}{\varTheta - \varPhi_-+ \mathrm{i} \mu} \, \mathrm{d} \varTheta \, \boldsymbol{e}_{\boldsymbol{q}}^\perp+O(1)} & \text{for} \ |\varphi + {\rm \pi}/2| = O(\delta); \\ \displaystyle{-2 {\rm \pi}p_0 \left(\frac{\sin \varphi}{\cos^2 \varphi} \boldsymbol{e}_{\boldsymbol{q}}^\perp+ \begin{pmatrix} 2 \\ 0 \end{pmatrix} \right)} & \text{for} \ |\varphi \mp {\rm \pi}/2| = O(1). \end{cases}\end{align}
 Under the assumption of a localised current, we now derive an approximation for  $h_s({\boldsymbol {x}})$ by introducing (C4) in the inverse Fourier transform
 \begin{equation} h_s({\boldsymbol{x}}) {/\bar {H}_s}= \frac{1}{(2{\rm \pi})^2}\int \hat{\boldsymbol{L}}(\varphi) \boldsymbol{\cdot} \hat{\boldsymbol{U}}(\boldsymbol{q}) \, \mathrm{e}^{\mathrm{i} \boldsymbol{q} \,\boldsymbol{\cdot}\, {\boldsymbol{x}}} \, \mathrm{d} \boldsymbol{q} ,\end{equation}
of (2.16). We compute explicitly the contribution of the boundary layer at  $\varphi ={\rm \pi} /2$; the contribution of the other boundary layer is its complex conjugate, denoted by $\mathrm {c.c.}$, and is added. Using the polar representation of $\boldsymbol {q}$ and the approximation
 \begin{equation} \boldsymbol{q} = q (-\delta \varPhi, 1) + O(\delta^2), \end{equation}
where we denote  $\varPhi _+$ by $\varPhi$ for simplicity, we obtain
 \begin{align} h_s({\boldsymbol{x}}) \sim \frac{16\delta^{{-}1}}{(2{\rm \pi})^2 g \bar {H}_s} \int_0^\infty \hat U(0,q) q \, \mathrm{e}^{\mathrm{i} q y} \, \mathrm{d} q \int \left( \frac{\mathrm{d}{}}{\mathrm{d}{\varPhi}} \int \frac{\mathcal{P}(\varTheta)}{\varTheta-\varPhi - \mathrm{i} \mu} \, \mathrm{d} \varTheta \right) \, \mathrm{e}^{-\mathrm{i} \delta q x \varPhi} \, \mathrm{d} \varPhi + \mathrm{c.c.}\end{align}
Here we implicitly assume that  $x = O(\delta ^{-1})$ since this turns out to be the range of $x$ for which $h_s$ is the largest. Integrating by parts in $\varPhi$ and swapping the order of the $\varTheta$ and $\varPhi$ integrations produces
 \begin{equation} h_s({\boldsymbol{x}}) \sim \frac{16 \mathrm{i} x}{(2 {\rm \pi})^2~g \bar {H}_s} \int_0^\infty \hat U(0,q) q^2 \, \mathrm{e}^{\mathrm{i} q y} \, \mathrm{d} q \int \mathcal{P}(\varTheta) \left( \int \frac{ \mathrm{d} \varPhi}{\varTheta-\varPhi - \mathrm{i} \mu} \, \mathrm{e}^{-\mathrm{i} q \delta x \varPhi} \right) \, \mathrm{d} \varTheta + \mathrm{c.c.} \end{equation}
The  $\varPhi$-integral can be evaluated as a contour integral. For $x \ge 0$, we close the contour in the lower half-plane where the simple pole $\varPhi = \varTheta - \mathrm {i} \mu$ is located. In the limit $\mu \to 0^+$ the integral becomes $2 {\rm \pi}\mathrm {i} \mathrm {e}^{-\mathrm {i} q \delta x \varTheta }$, leading to
 \begin{equation} h_s({\boldsymbol{x}}) \sim{-} \frac{8x}{{\rm \pi} g \bar {H}_s} \int_0^\infty \hat U(0,q) q^2 \,\mathrm{e}^{\mathrm{i} q y} \, \mathrm{d} q \int \mathcal{P}(\varTheta) \,\mathrm{e}^{-\mathrm{i} q \delta x\varTheta} \, \mathrm{d} \varTheta + \mathrm{c.c.} \end{equation}
Recognising the integral with respect to  $\varTheta$ as the Fourier transform $\hat {\mathcal {P}}(q\delta x)$ of $\mathcal {P}(\varTheta )$, we obtain the compact expression
 \begin{equation} h_s({\boldsymbol{x}}) \sim{-} \frac{8x}{{\rm \pi} g \bar {H}_s} \int_0^\infty \hat U(0,q) \hat{\mathcal{P}}(q \delta x) q^2 \, \mathrm{e}^{\mathrm{i} q y} \, \mathrm{d} q + \mathrm{c.c.} \quad \text{for} \ x \ge 0. \end{equation}
For  $x<0$, the integration contour can be closed in the upper half-plane of $\varPhi$, where there are no poles, hence $h_s({\boldsymbol {x}})=0$ for $x<0$. The reality conditions $(\hat U^*(0,q))=(\hat U(0,-q))$ and $\hat {\mathcal {P}}^*(q \delta x) = \hat {\mathcal {P}}(-q \delta x)$ can then be used to reduce the result to
 \begin{equation} h_s({\boldsymbol{x}}) \sim{-} \frac{8 x}{{\rm \pi} g \bar {H}_s} \int_{-\infty}^\infty \hat U(0,q) \hat{\mathcal{P}}(q \delta x) q^2 \,\mathrm{e}^{\mathrm{i} q y} \, \mathrm{d} q \quad \text{for} \ x \ge 0,\end{equation}
and  $h_s({\boldsymbol {x}})=0$ for $x<0$.
We now show that (C11) is equivalent to the result obtained by Wang et al. (Reference Wang, Villas Boâs, Young and Vanneste2023) in the linear regime  $\varepsilon \ll \delta \ll 1$. In the notation of the present paper, their result reads
 \begin{equation} h_s({\boldsymbol{x}})={-}\frac{\bar {H}_s}{2} \int D'(\varTheta) \Delta (y-x\varTheta)\,\mathrm{d}\varTheta \quad \text{for} \ x \ge 0,\end{equation}
where  $D(\varTheta )$ is the (normalised) angular distribution of the spectrum and
 \begin{equation} \Delta (y) \mathop=^{\rm def} \frac{1}{{c_{g\star}}}\int_{-\infty}^ \infty \zeta(x,y)\, \mathrm{d}\kern0.7pt x, \end{equation}
with  ${c_{g\star }}$ the peak group speed. The function $\Delta (y)$ can be written in terms of the Fourier transform of the current as
 \begin{equation} \Delta (y)={-}\frac{\mathrm{i}}{2{\rm \pi} {c_{g\star}}}\int q_2 \hat U(0,q_2)\,\mathrm{e}^{\mathrm{i} q_2 y} \, \mathrm{d} q_2.\end{equation}
 \begin{equation} h_s ={-}\frac{\bar {H}_s x}{4{\rm \pi} {c_{g\star}}} \int \hat U(0,q) \hat D(qx) q^2 \, \mathrm{e}^{\mathrm{i} q y}\, \mathrm{d} q\quad \text{for} \ x \ge 0. \end{equation}
The result in (C15) is shown to be identical to (C11) by noting that
 \begin{align} \bar {H}_s^2 D(\theta) &= 16g^{{-}1} \iint \sigma(k)\mathcal{\bar{\mathcal{A}}}k \,\mathrm{d} k \,\mathrm{d} \theta D(\theta)= 32g^{{-}1} \iint {c_{g}}\mathcal{\bar{\mathcal{A}}}k^2 \,\mathrm{d} k \,\mathrm{d} \theta \nonumber\\ & \approx 32 g^{{-}1}{c_{g\star}} \mathcal{P}(\theta). \end{align}
Here we use the definition (3.8) of  $\mathcal {P}(\theta )$ in the case of a separable spectrum and we approximate ${c_{g}}(k) \approx {c_{g\star }}$ as appropriate for a highly directional spectrum.
Appendix D. Axisymmetric vortex
For a purely vortical, axisymmetric flow, with  $\hat \phi (q) = 0$ and $\hat \psi (q) = - q^{-2} \hat \zeta (q)$, combining (3.18) into (3.20) yields
 \begin{equation} h_s(\boldsymbol{q}) ={-}\frac{16 \mathrm{i}}{g \bar {H}_s} \sum_{n={-}\infty}^\infty n (-\mathrm{i})^{|n|} 2 {\rm \pi}\tilde p_n \,\mathrm{e}^{ \mathrm{i} n \varphi} q^{{-}1} \hat \zeta (q). \end{equation}
The inverse Fourier transform is
 \begin{equation} h_s({\boldsymbol{x}}) ={-}\frac{16 \mathrm{i}}{g \bar {H}_s} \sum_{n={-}\infty}^\infty n (-\mathrm{i})^{|n|} \frac{2 {\rm \pi}\tilde p_n}{2 {\rm \pi}} \int_0^\infty \hat \zeta(q) \int_0^{2{\rm \pi}} \,\mathrm{e}^{\mathrm{i} qr \cos (\varphi - \nu) + \mathrm{i} n \varphi}\frac{ \mathrm{d} \varphi}{2 {\rm \pi}}\, \mathrm{d} q .\end{equation}
In the  $\varphi$-integral above, $\nu$ is the polar angle in physical space. The $\varphi$-integral can be reduced to Bessel functions
 \begin{align} \int_0^{2{\rm \pi}} \mathrm{e}^{\mathrm{i} qr \cos (\varphi - \nu) + \mathrm{i} n \varphi} \frac{ \mathrm{d} \varphi}{2 {\rm \pi}} &= \int_0^{2{\rm \pi}} \,\mathrm{e}^{\mathrm{i} qr \cos \alpha } \cos( n \alpha) \, \frac{ \mathrm{d} \alpha}{2 {\rm \pi}}\, \mathrm{e}^{\mathrm{i} n \nu} \nonumber\\ &= \mathrm{i}^{|n|} J_{|n|}(qr)\, \mathrm{e}^{\mathrm{i} n \nu}. \end{align}
Substituting (D3) into (D2) we obtain
 \begin{equation} h_s({\boldsymbol{x}}) ={-} \frac{16 \mathrm{i}}{g \bar {H}_s} \sum_{n={-}\infty}^\infty n \tilde p_n \int_0^\infty \hat \zeta(q)J_{|n|}(qr) \, \mathrm{d} q \,\mathrm{e}^{\mathrm{i} n \nu}, \end{equation}
valid for any vortical axisymmetric flow.
For the Gaussian vortex in (4.5a,b) the  $q$-integral reduces to
 \begin{align} \int_0^{\infty} J_{|n|}(qr) \hat \zeta(q) \,\mathrm{d} q &= \kappa \int_0^{\infty} J_{|n|}(qr) \mathrm{e}^{{-}r_{v}^2 q^2/2}\,\mathrm{d} q \nonumber\\ &=\frac{\kappa}{r_v}\sqrt{\frac{\rm \pi}{2}}\,\mathrm{e}^{{-}r^2/4 r_v^2}I_{|n|/2}(r^2/4 r_v^2), \end{align}
where  $I_{|n|/2}$ is the modified Bessel function. This simplifies $h_s({\boldsymbol {x}})$ in (D4) to (4.6).


 Open access