Introduction
Our understanding of natural climate variability over the past several hundred years and the identification of human-induced climate change in the Arctic is hampered by the lack of long-term instrumental records from this region. to supplement the instrumental record and enhance our understanding of natural climate variability, multivariate climate records can be developed through the collection and analysis of ice cores recovered from suitably located glaciers and polar ice caps. Preserved in glacial ice is a time series of precipitation chemistry and dry deposition reflecting changes in temperature, precipitation and atmospheric circulation. However, the exact links between the ice-core records, the instrumental record and other paleoclimate records are often unclear.
While a growing number of ice-core records have been recovered from Greenland and the eastern Canadian Arctic (e.g. Reference Koerner and Fisher.Koerner and Fisher, 1990; Reference Hammer, Mayewski, Peel and StuiverHammer and others, 1997; Reference FisherFisher and others, 1998; Reference GrumetGrumet and others, 2001), the ice-core record from Mount Logan long remained the only one recovered from northwest North America. the 103 m core was recovered in 1980 from an elevation of 5340 m on the summit plateau of Mount Logan (60.35˚N, 140.30˚ W), Saint Elias Mountains, southwest YukonTerritory, Canada (Reference Holdsworth, Pourchet, Prantl and Meyerhof.Holdsworth and others, 1984; Reference Holdsworth and PeakeHoldsworth and Peake, 1985). Unfortunately, the oxygen isotope record from Mount Logan does not cross-correlate well with regional instrumental records of temperature (Reference Holdsworth, Krouse, Nosal, Bradley and JonesHoldsworth and others, 1992), as the Mount Logan ice-core site samples primarily free tropospheric air masses with a distinctly different stable-isotope fractionation history compared to air masses present at the lower-elevation meteorological stations (Reference Holdsworth, Fogarasi and Krouse.Holdsworth and others, 1991; Reference Holdsworth and Krouse.Holdsworth and Krouse, 2002). However, analysis of the accumulation time series from Mount Logan shows strong correlation with instrumental precipitation records from Japan (Reference Holdsworth, Krouse, Nosal, Bradley and JonesHoldsworth and others, 1992). In addition, due to its location near the 500 mbar height, the Mount Logan record is uniquely situated for evaluating the extratropical response to El Niño– Southern Oscillation (ENSO) (Reference Moore, Holdsworth and AlversonMoore and others, 2001).
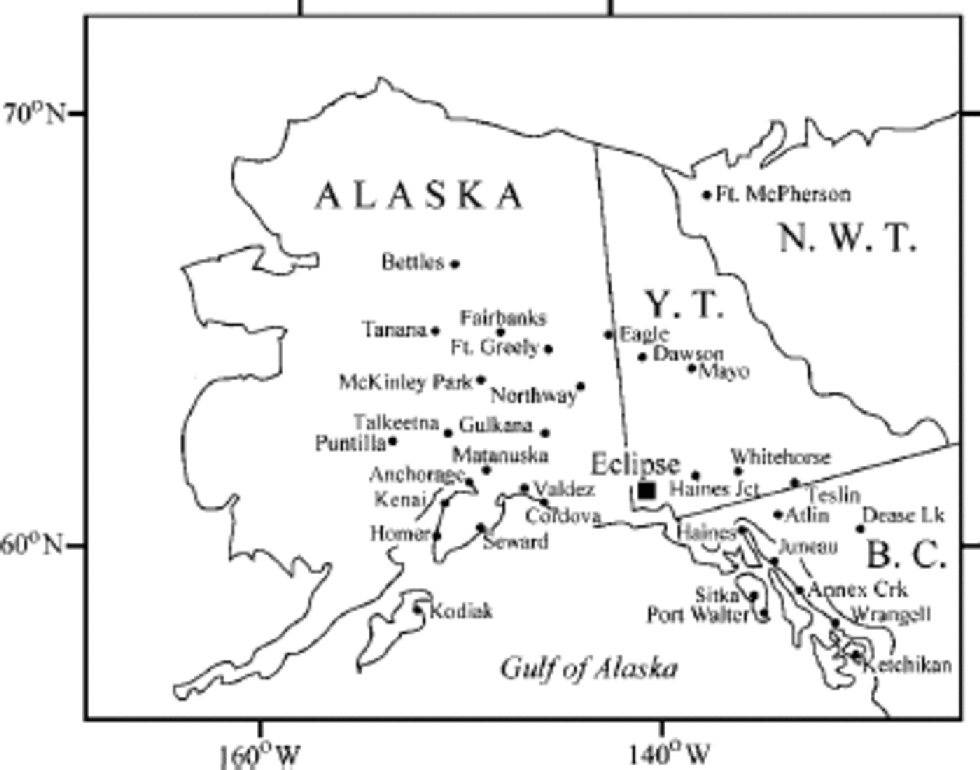
To provide new insights into the temporal variability of precipitation chemistry and develop a broader array of proxy climate records for northwestern North America, a 160m ice core was collected from Eclipse Icefield (Fig. 1; 60.51˚N, 139.47˚W; 3017 ma.s.l.) in the Saint Elias Range, Yukon Territory. the Eclipse site is 45 km northeast of and more than 2 km lower than the Mount Logan drill site, with an accumulation rate nearly five times greater. Due to its lower elevation, the Eclipse site samples air masses distinctly different from those sampled by the Mount Logan site, with different source inputs and transport histories (Reference Holdsworth, Krouse and PeakeHoldsworth and others, 1988; Reference Yalcin and WakeYalcin and Wake, 2001). the high accumulation rate and nearly complete preservation at the Eclipse site provides an excellent opportunity to compare the ice-core record with instrumental time series of temperature, precipitation and sea-level pressure (SLP) and determine the extent to which the Eclipse glaciochemical, isotopic and accumulation time series can be considered a representative proxy for temperature, precipitation and atmospheric circulation in the region.

Fig. 1 Location map for Global Historical Climatological Network (GHCN) meteorological stations whose data are used in this work (small black circles) and the Eclipse Ice-field (large black square).
Methods
The 160m firn/ice core was recovered from Eclipse Icefield in summer 1996 (Reference Blake, Wake and GerasimoffBlake and others, 1998) and shipped frozen to the University of New Hampshire (UNH). the core was continuously sampled in 10 cm segments using stringent core-processing techniques to ensure that samples were contamination-free at the ng g–1 level. Blanks prepared on a frequent basis showed no contamination of samples during processing of the core. Samples were analyzed for major ions (Na+, NH4 +, K+,Mg2+, Ca2+, Cl–, NO3 –, SO4 2–) using an ion chromatograph in a dedicated laboratory at UNH, and for oxygen isotopes at the Department of Geophysics, University of Copenhagen, Denmark. A section of the core from 50 to 76 m depth was analyzed for beta activity.
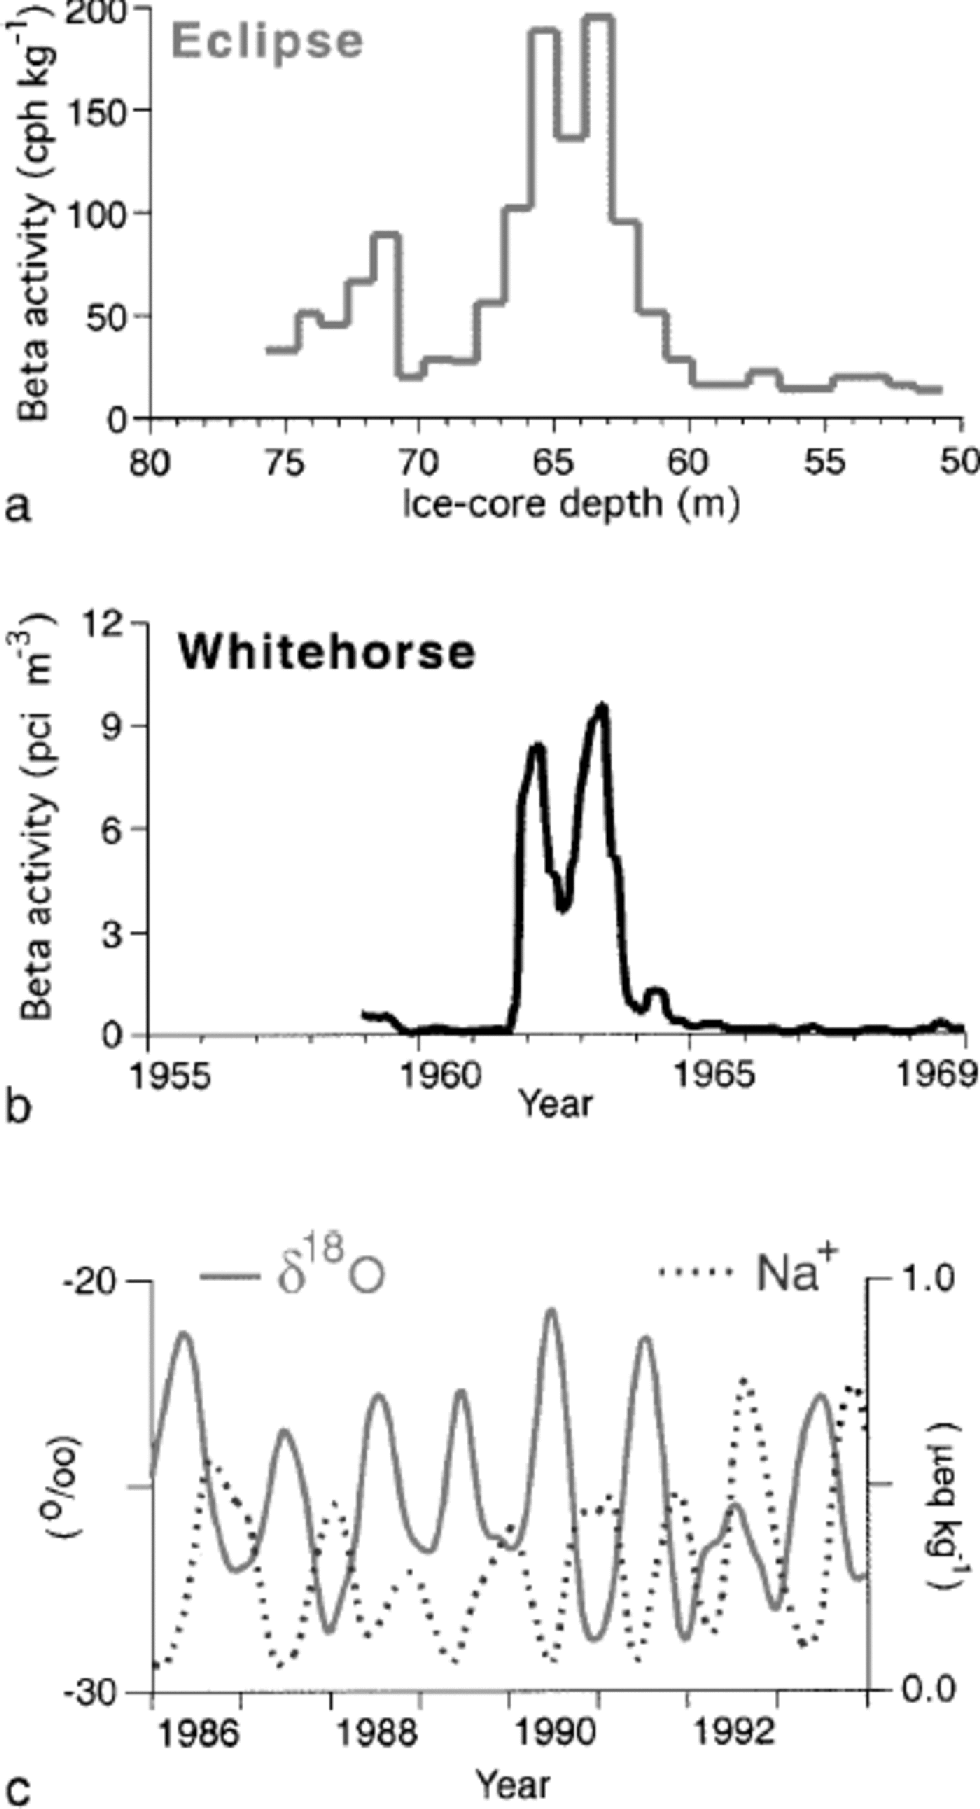
Analysis of the ice-core beta-activity profile and comparison with real-time precipitation measurements from Whitehorse, Yukon Territory (Fig. 2a and b), shows clear identification of the 1961 and 1963 beta-activity peaks from atmospheric thermonuclear weapons testing. Average annual accumulation from 1963 to 1996 was 1.38mw.e. Analysis of snow-pit samples collected during the summer drilling season indicates that δ18O values are heavier and Na+ concentrations lower in summer snow. the seasonal variability of the δ18O signal in snow at Eclipse (heavier in summer, lighter in winter) is similar to that recorded in Greenland snow (Reference DansgaardDansgaard,1964), suggesting that the temperature at which the snow forms in the atmosphere is the dominant control on the oxygen isotope ratio preserved at the Eclipse site. Sodium peaks generally occur during the winter, likely as a result of increased wind speeds. the δ18O and Na+ relationship (Na+ peaks coinciding with troughs in the δ18O record) are evident in the ice-core record, especially when smoothed slightly using a robust spline (Reference Meeker, Mayewski, Bloomfield and DelmasMeeker and others, 1995) (Fig. 2c). the consistent seasonal signals recorded in these two time series provide the basis for the counting of annual layers and the identification of seasonal (summer and winter) layers in the ice-core record. Control on the depth–age relationship developed via annual-layer counting is provided by identification of nuclear weapons-testing fallout and SO4 2– reference horizons linked to known volcanic eruptions (Reference Yalcin and WakeYalcin and Wake, in press). While it is difficult to quantify the dating uncertainty, we estimate it to be no more than ±1year for the last 100 years based on our multiparameter approach and the high number of positively identified volcanic horizons. the annualized ice-core time series discussed in this paper are shown in Figure 3.

Fig. 2 Detail of records used to develop a depth–age relationship for the Eclipse core: (a, b) beta-activity record from the Eclipse ice core (a) and from air samples collected at Whitehorse, Yukon Territory (b) (after Reference Holdsworth, Pourchet, Prantl and Meyerhof.Holdsworth and others, 1984); (c) seasonal signals in the δ18O and Na+ records smoothed using a robust spline.

Fig. 3 Annualized time series developed from physical and chemical analysis of the Eclipse ice core.
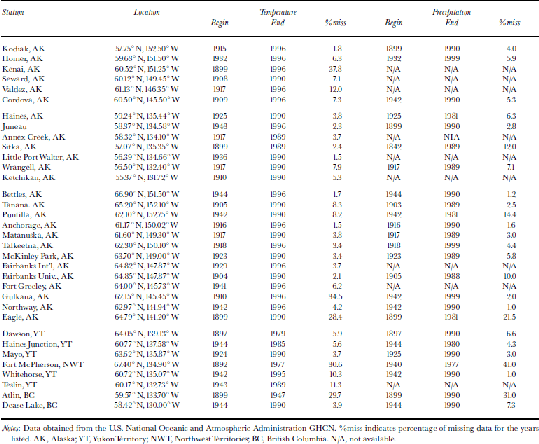
To compare the ice-core record with a variety of meteorological variables, we collected instrumental time series of monthly mean temperature and monthly precipitation from a range of stations surrounding the Saint Elias Mountains (Table 1; Fig. 1). These monthly time series were converted to both annual (January–December) and seasonal (October–March; April–September) resolutions for comparison with our glaciochemical record on an annual and seasonal basis. Missing months in the instrumental records were filled in with the long-term average for that month; years with more than half the months missing were excluded from our analyses. Cross-correlation analysis was performed individually between each instrumental record and the Eclipse ice-core record over the maximum period the records overlapped. This overlap was 45–92 years for temperature records, and 37–92 years for the precipitation records. Instrumental data series shorter than 35 years were not used in our analysis.
Table 1. Monthly temperature and precipitation records from meteorological stations surrounding the Saint Elias Range used in our analysis

We also developed a regional temperature record using data from all stations (31 total) that had records extending from at least 1944 to 1989. This was accomplished by running an empirical orthogonal function (EOF) analysis on the annual, summer and winter records. the first EOF (EOF1-Temperature) explains 71%, 54% and 81% of the variability in the data for the annual, summer and winter records, respectively. A similar analysis was performed on the precipitation data; however, the first EOF explained at most 25% of the variability in the data, and, due to the high spatial variability in these precipitation data, we have not used the precipitation EOF as a regional record. TheEclipse glaciochemical record was also compared with gridded (5˚65˚) Northern Hemisphere SLP data over the period 1899–1995 (after Reference Trenberth and PaolinoTrenberth and Paolino, 1980). Seasonal SLPs for winter (December–February) and summer (June–August) were compared with winter and summer records from the Eclipse ice core.
Results and Discussion
Eclipse δ18Oand instrumental temperature records
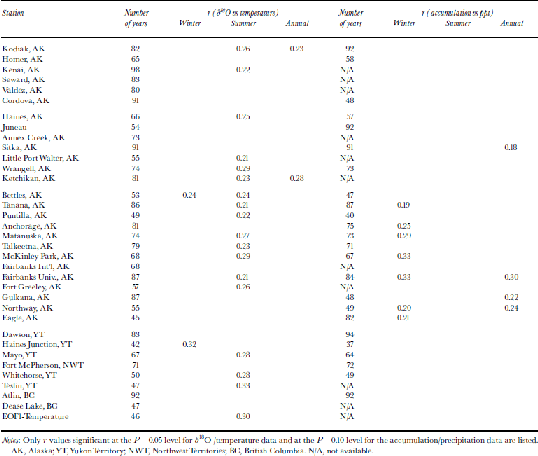
The results of cross-correlation analysis of instrumental temperature and precipitation records with the Eclipse δ18O and net accumulation time series are presented in Table 2. the most widespread significant positive correlations between the Eclipse δ18O and instrumental temperature occur during the summertime (Fig. 4). There also exists a significant positive correlation between ``summer’’ EOF1-Temperature and the summertime δ18O record. the results indicate that summertime δ18O signals at Eclipse represent 5–10% of the temperature variability in a broad coastal region extending from Ketchikan to Kodiak, to the interior of Alaska north of the Alaska Range and at inland locations in the Yukon Territory and northern British Columbia. While the δ18O/summer-temperature correlations are not strong, they are significant and indicate that the summer stable-isotope signals preserved at Eclipse provide a record that is more closely linked to temperatures at low-elevation sites compared to the Mount Logan record.

Fig. 4 Comparison of time series of summertime Eclipse δ18O (top) and “summer” (April–September) temperatures from meteorological stations that show a correlation coefficient greater than 0.2 with the δ18O record.
Table 2. Correlation coefficients for ice core δ18O vs instrumental temperature records, and ice-core accumulation vs instrumental precipitation records

All of the correlation analyses were also done with a lag of ±1year. None of the correlation coefficients discussed here improved with this lag, suggesting that our depth–age relationship is reasonably accurate.
Eclipse accumulation and instrumental precipitation records
Eclipse accumulation is significantly positively correlated primarily with inland sites in Alaska during the winter, but shows no significant correlation with nearby locations. While the cluster of sites with a significant correlation suggests a link between wintertime snow accumulation at Eclipse and in central Alaska, the Eclipse record explains only 4–10% of the variability in Alaska wintertime precipitation. Our EOF analysis of regional precipitation records from 1945 to 1989 indicates that there is much greater spatial variability in precipitation trends compared to those for temperature, so it is not surprising that the Eclipse accumulation record does not display a signal that is representative of station data over the entire region. In addition, the significant elevation gradient between the Eclipse site and lowland instrumental records may explain the limited usefulness of the Eclipse accumulation record as a proxy record for regional precipitation. In this case, orographic process may play a stronger role in controlling the amount of snowfall at Eclipse than regional climate variability. Or conversely, the station data reflect more local influences on precipitation, and the Eclipse record provides a more regional signal.
Eclipse major ions and instrumental sea-level pressure records
For reference, the mean SLP for the winter (December– February) for the period 1945–95 is shown in Figure 5a. the semi-permanent high- and low-pressure cells for winter (Aleutian low, Icelandic low, Siberian high) are apparent. the δ18O, accumulation and glaciochemical time series display significant correlations with the Northern Hemisphere SLP dataset. Here we focus on the relationship between the relative strength of the Aleutian low, and Siberian high, and non-volcanic (nv) sulfate (Reference Yalcin and WakeYalcin and Wake, in press) and nitrate concentrations preserved in the Eclipse ice core since 1945. Since the 1940s there has been an increase in nv sulfate and nitrate deposition in the Arctic linked to increases in anthropogenic emissions from Eurasia (Reference BarrieBarrie,1986; Reference Goto-Azuma and Koerner.Goto-Azuma and Koerner, 2001; Reference Yalcin and WakeYalcin and Wake, 2001). In addition, there is considerable year-to-year variability in nv sulfate and nitrate deposition (Fig. 3) which is not the result of changes in source strength (annual anthropogenic emissions change by only a few per cent at most), but may be related to changes in atmospheric circulation and/or processes which affect the formation, transport and deposition of aerosols. to try to explain this year-to-year variability in terms of changes in atmospheric circulation, we looked at the difference between pressure patterns for years of high winter nv sulfate and nitrate (the highest one-third of concentrations) vs low winter nv sulfate and nitrate (the lowest one-third of concentrations). Winter values were used, as most of the increase in nitrate and nv sulfate over the last 50 years at Eclipse occurs in wintertime snow (Reference Yalcin and WakeYalcin and Wake, 2001). Higher wintertime nv sulfate concentrations are associated with higher pressure of Siberia and the Siberian Sea (SLP 3–4mbar higher; Fig. 5b) and lower pressure over the north (SLP 2 mbar lower; Fig. 5b). Higher wintertime nitrate concentrations correspond with higher pressure over Siberia and the Barents Sea (SLP 2–3mbar higher; Fig. 5c), and lower pressure over Western Europe and in the Aleutian low (SLP 3 mbar lower; Fig. 5c). Note that these patterns of strengthening of the wintertime semi-permanent pressure cells by 2– 4 mbar over the last 55 years shown in Figure 5b and c are comparable to shifts in pressure associated with a changeover from a high to a low index for the North Atlantic Oscillation and ENSO. the increase in the pressure gradient resulting from the increase in SLP pressure over Eurasia, combined with decreased pressure in Western Europe/North Atlantic and in the region of the Aleutian low, would encourage the transport of pollutants from Eurasia into the northwestern North American Arctic (e.g. Reference Raatz and Shaw.Raatz and Shaw, 1984). the results indicate that the year-to-year variability in sulfate and nitrate deposition can be linked to changes in atmospheric circulation, resulting from an increase in the wintertime intensity of semi-permanent pressure cells in the Northern Hemisphere, while the longer-term trends are related to changes in source strength in Eurasia (Reference Goto-Azuma and Koerner.Goto-Azuma and Koerner, 2001; Reference Yalcin and WakeYalcin andWake, 2001).

Fig. 5 (a) Mean Northern Hemisphere SLP (1945–95) in 5˚65˚ grid for winter (December–February) (afterReference Trenberth and PaolinoTrenberth and Paolino, 1980). the semi-permanent high- and low-pressure cells in winter (AL, Aleutian low; IL, Icelandic low; SH, Siberian high) are noted. (b) Mean SLPanomaly, 1945– 95, for high winter sulfate concentrations (highest one-third) minus low winter sulfate concentrations (lowest one-third). (c) Same as (b) but for nitrate.
Conclusions
The 100 year physical and chemical time series developed from the Eclipse ice core provides a valuable new paleoclimate record for northwest North America. Comparison of the accumulation, δ18O and major-ion records with instrumental meteorological data indicates that there exist significant statistical relationships between the Eclipse glaciochemical time series and regional instrumental temperature data and Northern Hemisphere SLP data.
Summertime δ18O signals at Eclipse represent 5–10% of the temperature variability in northwestern North America. There exists little correlation between the Eclipse accumulation time series and instrumental precipitation data, reflecting substantial spatial variability of precipitation across the region. Perhaps the most encouraging results come from the analysis of SLP and the Eclipse nv sulfate and nitrate records. Winters with high sulfate and nitrate concentrations at Eclipse are related to a strengthening of the wintertime semi-permanent pressure cells in the Northern Hemisphere (i.e. Aleutian low, Icelandic low, Siberian high), which would encourage the transport of air from northern Eurasia into the region, indicating that both changes in source strength of pollutants and changes in atmospheric circulation must be considered to explain the observed trends.
Small dating errors in the Eclipse ice-core record may be influencing the results, although any dating error that may exist is not systematic through the entire record as the plus/ minus lag analysis did not reveal any improved relationships. Noise in the Eclipse ice-core time series may also be affecting the result of comparison to climate parameters. Constructing a stacked isotope/major-ion record using this core and cores collected in the near future from this region should improve correlations between the ice-core and climate records by increasing the signal-to-noise ratio. This approach has been used with considerable success for stable-isotope records by Reference Fisher, Jones, Bradley and JouzelFisher and others (1996) and Reference WhiteWhite and others (1997).
Comparison of the Eclipse with Mount Logan ice-core records highlights the importance of collecting ice cores from a range of elevations; time series developed from ice cores recovered from different elevations in the Saint Elias Mountains provide unique records of environmental change. In this sense, the Eclipse ice-core record, in addition to other snow-pit and shallow-core studies (Reference Holdsworth, Krouse and PeakeHoldsworth and others, 1988, Reference Holdsworth, Fogarasi and Krouse.1991), provides an elevational survey that identifies the need for collecting ice cores from a range of elevations to more fully understand environmental change in northwestern North America. Glaciochemical and isotopic records developed over a range of elevations are essential for developing a fuller understanding of climate change in the region.
Acknowledgements
We thank E.W. Blake and S.Williams for assistance in drilling the core, D. Aulisio and C. Dunsta. for assistance with core processing, S. I. Whitlow for major-ion analyses, D. Meeker for assistance with the analysis of the SLP datasets, and D. A. Fisher for review of the manuscript. the Office of Polar Programs at the U.S. National Science Foundation supported this research.


