


Impact statement
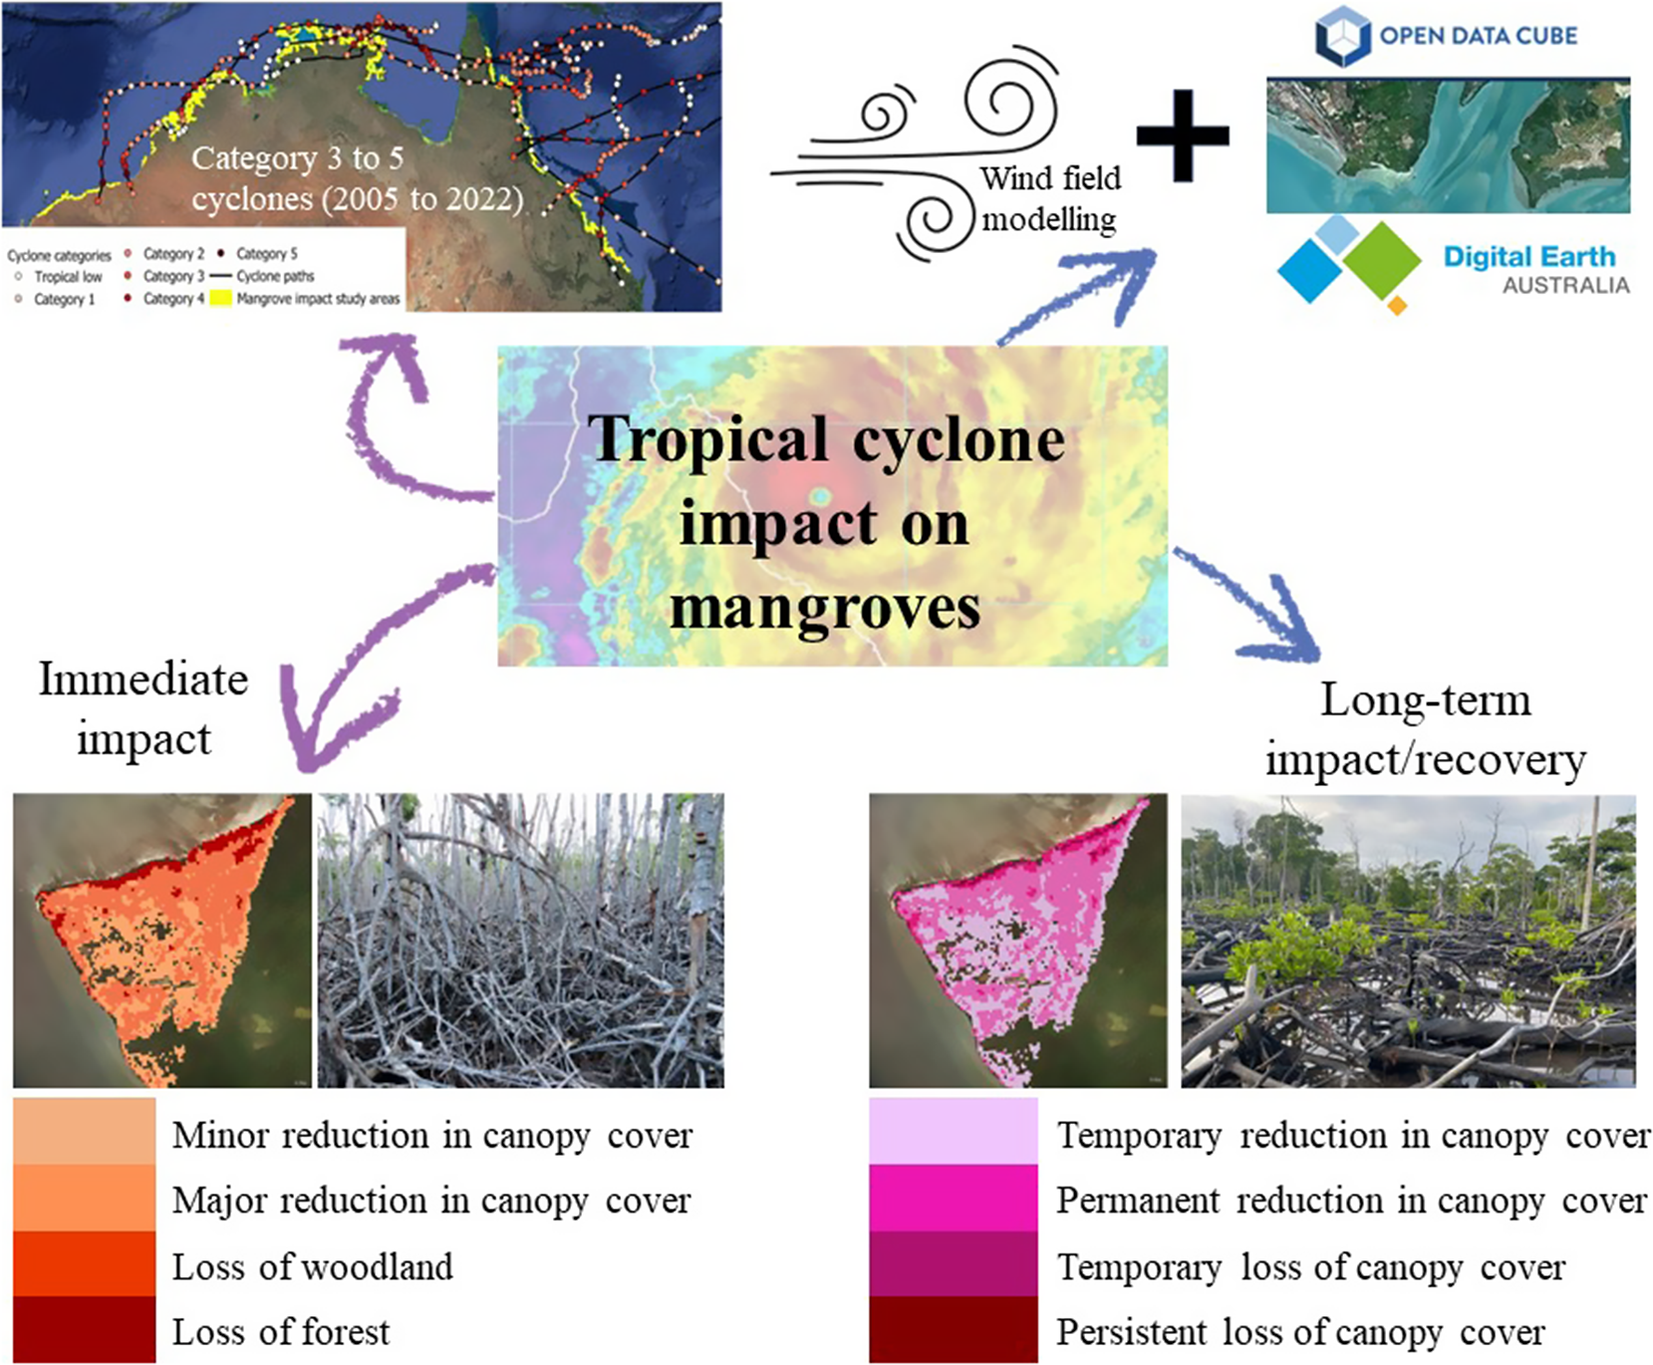
This study offers a national approach to quantifying and classifying the immediate and long-term impacts of category 3–5 cyclones from 2005 to 2021 on mangrove forests in Australia. Cyclone damage can take the form of mechanical damage (bole breakage, uprooting, defoliation and windthrow) and changes to sediment and hydrological conditions. Quantifying and understanding the drivers and spatial patterns of impact and recovery is important as mangroves provide essential ecosystem services, which are threatened as climate change projections indicate an increase in the number of intense cyclones. The results of this study will assist natural resource managers anticipate and prepare for potential disruptions and loss to these services and implement mitigation strategies. Cyclone impact was quantified and classified using Earth observation data (Landsat archive) within Digital Earth Australia (DEA). Maps of changes in mangrove extent and condition (canopy cover) provide insights into adaptation pathways and resilience. Closed forests experienced the greatest level of damage, whilst woodland forests (20–50% cover) experienced the least. Impacts also varied with distance to exposed coastlines and cyclone track. This spatial understanding is valuable for managers tasked with planning and implementing targeted conservation efforts and resource allocation. The consistent methodological approach measures cyclone impact within a long-term monitoring framework that could be potentially applied globally to compare impacts across diverse geographic settings and cyclone intensities, facilitating a deeper understanding of changes in forest structure, composition and recovery. Additionally, the maps of cyclone impact and recovery may aid in selecting suitable sites for on-ground mangrove rehabilitation works.
Introduction
Tropical cyclones produce extreme surface wind velocities, wind gusts, storm surges and wave action that causes immediate damage to coastal environments (Doyle et al. Reference Doyle, Smith and Robblee1995; Krauss and Osland Reference Krauss and Osland2020; Smith et al. Reference Smith, Robblee, Wanless and Doyle1994). Mangroves are often one of the first ecosystems to be impacted by cyclones, as the forests fringe the coastline, increasing their exposure to wind and waves (Ward and de Lacerda Reference Ward, de Lacerda, Frida and Friess2021). Mangroves and the important ecosystem services they provide are at risk of damage and loss as the global distribution of tropical mangroves overlaps with cyclone tracks (Krauss and Osland Reference Krauss and Osland2020).
High wind speeds drive immediate physical damage to mangroves, commonly resulting in widespread changes to sedimentology and hydrological conditions. The type of damage experienced by mangrove forests for each tropical cyclone intensity category has been described (Krauss and Osland Reference Krauss and Osland2020), with the amount of mechanical damage (trees uprooted, defoliation, broken canopies and saplings destroyed) increasing with windspeed and the degree of inundation (duration and intensity) from storm surges and terrestrial flooding. The extent and severity of damage is also correlated with debris deposition, extensive sedimentation (i.e. burial of saplings, pneumatophores and small statured mangroves) and significant erosion causing new channels to be created and undermining mangrove roots. Immediate impacts are also mediated by species, maximum height of the forest, stand density and condition and geomorphology (Asbridge et al. Reference Asbridge, Lucas, Rogers and Accad2018; Imbert Reference Imbert2018; Krauss and Osland Reference Krauss and Osland2020; Peereman et al. Reference Peereman, Hogan and Lin2020; Radabaugh et al. Reference Radabaugh, Moyer, Chappel, Dontis, Russo, Joyse, Bownik, Goeckner and Khan2020).
The long-term impact of tropical cyclones on mangroves can vary temporally and spatially as some systems recover, whilst other mangrove forests show a decline in condition (i.e. increases in defoliation and canopy openness, reduction in forest area and tree density and greater incidence of mortality). Mangrove recovery, in this study, refers to the regeneration of mangroves in an area where they previously existed. Recovery may occur relatively quickly (i.e. within a few years) if there is a regular supply of propagules to locations where hydrological and sediment conditions are optimal for establishment and growth (Asbridge et al. Reference Asbridge, Lucas, Rogers and Accad2018; Duke Reference Duke2001; Krauss et al. Reference Krauss, Whelan, Kennedy, Friess, Rogers, Stewart, Grimes, Trench, Ogurcak and Toline2023). In other locations, the considerable changes in habitat conditions may lead to transitions to alternative states, as recovery can result in forests exhibiting different species composition, structure and complexity (Krauss and Osland Reference Krauss and Osland2020; Paling et al. Reference Paling, Kobryn and Humphreys2008). Limited or no recovery due to the combined effects of mortality, reduced propagule supply, changes to local hydrodynamics (e.g. tidal impoundment) and loss of elevation through erosion and peat collapse may also occur (Gilman et al. Reference Gilman, Ellison, Duke and Field2008; Smith et al. Reference Smith, Robblee, Wanless and Doyle1994). Canopy cover may not return to pre-cyclone condition if the vascular structure within the stem is partially damaged (Krauss and Osland Reference Krauss and Osland2020). Species composition may also alter depending on the severity of the initial damage, species-specific physiological thresholds to stressors and capacity for resprouting and coppicing (Asbridge et al. Reference Asbridge, Lucas, Rogers and Accad2018; Doyle et al. Reference Doyle, Smith and Robblee1995; Duke Reference Duke2001; Imbert Reference Imbert2018; Macamo et al. Reference Macamo, Massuanganhe, Nicolau, Bandeira and Adams2016; Paling et al. Reference Paling, Kobryn and Humphreys2008; Radabaugh et al. Reference Radabaugh, Moyer, Chappel, Dontis, Russo, Joyse, Bownik, Goeckner and Khan2020). Sites dominated by Rhizophora and Ceriops spp. may struggle to recover as these species are unable to resprout or coppice (Aung et al. Reference Aung, Mochida and Than2013; Kauffman and Cole Reference Kauffman and Cole2010; Saenger Reference Saenger2002; Woodroffe and Grime Reference Woodroffe and Grime1999). Other sites with an abundance of Avicennia, Sonneratia, Excoecaria, Lumnitzera and Laguncularia may recover quickly via coppicing and resprouting as these trees have reserve or secondary meristematic tissues (Hamilton and Snedaker Reference Hamilton and Snedaker1984; Snedaker Reference Snedaker1995).
Recovery can be limited by repeat cyclones, as the system has not been able to recover before the next cyclone event occurs, and this may result in greater physical damage (defoliation, bole and branch breakage and uprooting) and prolonged disruption to hydrological or sedimentological processes (e.g. extreme levels of sediment burial or erosion and persistent flooding or prevention of tidal flushing). Ultimately, this can increase the vulnerability of the mangrove forests, leading to ecosystem collapse and significant changes in forest structure (e.g. species dominance; Krauss and Osland Reference Krauss and Osland2020; Lin et al. Reference Lin, Hamburg, Lin, Wang, Chang, Hsia, Vadeboncoeur, Mabry McMullen and Liu2011). If the mangrove forest cannot recover, mass mangrove dieback may result in subsidence and sediment instability, particularly in peat sediments where the continual addition of organic matter (roots) is needed to maintain substrate elevations (Middleton and McKee Reference Middleton and McKee2001). Should live root structures decompose, substrates can auto-compact, reducing the surface elevation of the wetland and further compound the impacts of flooding and sea-level rise.
Given projections of an increase in the frequency of intense cyclones, an increase in the volume of rainfall and a poleward shift in cyclone tracks, particularly in the Southern Hemisphere (Abbs Reference Abbs2012; Chand et al. Reference Chand, Dowdy, Ramsay, Walsh, Tory, Power, Bell, Lavender, Ye and Kuleshov2019; IPCC 2013; Knutson et al. Reference Knutson, Camargo, Chan, Emanuel, Ho, Kossin, Mohapatra, Satoh, Sugi and Walsh2019; Kossin et al. Reference Kossin, Emanuel and Vecchi2014; Leslie et al. Reference Leslie, Karoly, Leplastrier and Buckley2007; Patricola and Wehner Reference Patricola and Wehner2018), the risks for loss of ecosystem services may be amplified in a changing climate. Of particular concern is disruption to sediment dynamics (redistribution through erosion and deposition) and changes to forest structure (canopy cover), both of which can result in significant carbon emissions to the atmosphere (Das et al. Reference Das, Mondal, Saha, Ghosh and Mandal2021; Pendleton et al. Reference Pendleton, Donato, Murray, Crooks, Jenkins, Sifleet, Craft, Fourqurean, Kauffman and Marbà2012). The short-term destruction of mangrove vegetation can lead to immediate carbon emissions as organic matter decomposes. If there are substantial sedimentological changes and prolonged damaged without recovery, the long-term carbon storage potential of these ecosystems can be diminished.
Field-based assessment methods can be used to measure the immediate and long-term impacts of a tropical cyclone on mangrove ecosystems, such as recording the number of mangroves with broken stems, percentage of canopy defoliation/re-foliation and species damaged (Krauss and Osland Reference Krauss and Osland2020). However, given the spatial scale of cyclone impacts, field-based approaches may not be ideal as they are often limited to accessible sites which may not be representative of the wider scale impact and may be located on the fringes of the forest, thereby introducing spatial bias. Alternatively, Earth observation data provides a useful tool for long-term monitoring programs aiming to quantify immediate impacts of cyclone events and understand long-term recovery trajectories over a large area (Buitre et al. Reference Buitre, Zhang and Lin2019; Krauss and Osland Reference Krauss and Osland2020; Mondal et al. Reference Mondal, Dutta, Qadir and Sharma2022; Peereman et al. Reference Peereman, Hogan and Lin2022). The annual mangrove canopy cover product derived from Landsat, housed within DEA, provides a valuable opportunity to quantify tropical cyclone impacts at a national scale (Lewis et al. Reference Lewis, Oliver, Lymburner, Evans, Wyborn, Mueller, Raevksi, Hooke, Woodcock and Sixsmith2017; Lymburner et al. Reference Lymburner, Bunting, Lucas, Scarth, Alam, Phillips, Ticehurst and Held2020; Mohamed-Ghouse et al. Reference Mohamed-Ghouse, Desha, Perez-Mora, Guo, Goodchild and Annoni2020). DEA is an open-source analysis platform within Geoscience Australia, developed as part of the Open Data Cube initiative (Dhu et al. Reference Dhu, Giuliani, Juárez, Kavvada, Killough, Merodio, Minchin and Ramage2019), providing access to calibrated, analysis-ready satellite data products (Dwyer et al. Reference Dwyer, Roy, Sauer, Jenkerson, Zhang and Lymburner2018) that support time-series analysis over Australia.
There is an urgent need to identify patterns of damage and recovery to plan for future trajectories of change and ecosystem service provision. However, the immediate and long-term impacts of cyclones on mangrove ecosystems have not been quantified using a consistent approach, hindering comparisons across landscapes and within and between intensity categories. This study focused on cyclones classified as category 3–5 using the Australian Tropical Cyclone Intensity Scale (BOM 1999), which have sustained windspeeds exceeding ~125 km/hr and wind gusts exceeding ~170 km/hr. These windspeeds are widely considered a critical threshold where physical damage to mangroves is visible (Aung et al. Reference Aung, Mochida and Than2013; Krauss and Osland Reference Krauss and Osland2020; Mo et al. Reference Mo, Simard and Hall2023; Roth Reference Roth1992). Remote sensing approaches were applied to regions where landfall of category 3–5 cyclones coincided with the distribution of mangrove forests. The aim of this project is to quantify and classify the immediate impact and long-term trajectory of mangrove forests following cyclones that made landfall at category 3–5 intensity between 2005 and 2021 in Australia, using a nationally applicable approach that is relevant to assessing cyclone impacts globally. This was achieved by:
-
1. Classifying and quantifying the immediate impact of tropical cyclones on mangrove canopy cover, with results shown for four case study cyclones.
-
2. Classifying and quantifying the long-term impact and recovery of tropical cyclones on mangrove canopy cover, with results shown for four case study cyclones.
-
3. Assessing the impact of repeated tropical cyclones on mangrove canopy cover over immediate and longer timescales.
-
4. Describing the potential long-term trajectories for common types of impact and recovery identified across the cyclones presented in this study.
-
5. Discussing the applicability and prospective use of the framework presented in this study, in other regions where mangroves experience cyclonic impacts.
It is anticipated that the methodological approach presented in this study will provide a useful and consistent framework to quantify the spatial patterns of cyclone impact and mangrove recovery. Understanding the temporal and spatial patterns and the associated drivers is crucial for anticipating potential losses to ecosystem services. This information will support and direct natural resource managers tasked with implementing targeted and tailored mitigation strategies.
Methods
This study focuses on category 3–5 cyclones that have made landfall in mainland Australia between 2005 and 2021 in regions supporting extensive mangrove forests. This time-period was chosen as it represents a balance between providing sufficient data to understand the short- and long-term impacts whilst ensuring feasibility in the development of a practical and effective methodological framework. The Landsat archive (in DEA; Dwyer et al. Reference Dwyer, Roy, Sauer, Jenkerson, Zhang and Lymburner2018; Lewis et al. Reference Lewis, Oliver, Lymburner, Evans, Wyborn, Mueller, Raevksi, Hooke, Woodcock and Sixsmith2017; Wulder et al. Reference Wulder, White, Loveland, Woodcock, Belward, Cohen, Fosnight, Shaw, Masek and Roy2016) has previously been used to generate annual maps of mangrove extent and cover (Lymburner et al. Reference Lymburner, Bunting, Lucas, Scarth, Alam, Phillips, Ticehurst and Held2020). This archive was leveraged in this study to characterise the immediate effects of cyclones on mangrove forest canopy cover, the long-term trajectory of impact and recovery, and the impact of repeated cyclones on mangrove forest canopy cover.
Category 3–5 cyclones in Australia
Between 2005 and 2021, 10 category 3–5 cyclones made landfall along mangrove fringed Australian coastlines (Supplementary Figure 1, Supplementary Table 1). The maximum mean wind speeds for each intensity category are 118–159 km/hr (category 3), 160–199 km/hr (category 4) and >200 km/hr (category 5). The analysis presented in this study has been completed for all 10 cyclones classified as category 3–5, with the data and code publicly available to download on the authors GitHub repository. Here, the results for four of the category 4 and 5 cyclones are presented (Cyclone George in Western Australia, category 5; Cyclone Laurence in Western Australia, category 5; Cyclone Yasi in Queensland, category 5; and Cyclone Lam in Northern Territory, category 4). In addition, analyses for Cyclone Ingrid (March 2005) and Cyclone Monica (April 2006) are provided as the location of landfall coincided, allowing for the effects of repeated cyclones on a mangrove forest to be assessed. Focus is placed on Cyclone Yasi, which is amongst the most impactful cyclones in Australia between 2005 and 2021. The results for the six other category 3–5 cyclones that made landfall between 2005 and 2021 can be found in Supplementary Table 3 and Supplementary Figure 4.
Approach
The approach undertaken to quantify the immediate and long-term impacts of tropical cyclones and the implications of repeated cyclones on mangrove extent and canopy cover is outlined in Figure 1. The analyses used two sources of input data: a wind field associated with each cyclone and data indicating the changing extent of mangroves and their canopy cover immediately before and in the years after each cyclone.

Figure 1. Workflow to investigate the immediate and long-term impacts of tropical cyclones on mangrove extent and canopy cover. Note: The impact of multiple tropical cyclones at the same location could also be ascertained by comparison of time-series canopy cover change. TCRM: Tropical Cyclone Risk Model
Wind field modelling
Wind fields and the associated hazard were modelled using Geoscience Australia’s Tropical Cyclone Risk Model (TCRM; Arthur Reference Arthur2021). The TCRM is an open-source statistical parametric wind field model developed for the assessment of tropical cyclone hazard and can be used to generate synthetic records of cyclones considering thousands of years of events. This is necessary as the historic record of tropical cyclones in Australia is limited, with data only collected in a relatively consistent manner since satellite advancements in the late 1980s. The TCRM is a 2D model that uses parameterisations of wind fields to allow for fast, computationally efficient simulations of tropical cyclone events. The synthetic data sets can be used to determine extreme peak wind speed across large spatial scales at a high spatial resolution (0.05°). The TCRM is particularly useful in locations with limited data availability, as the wind hazard can be estimated using a dense time series of synthetic storm data, to generate spatial patterns in wind speed. Wind fields for tropical cyclones listed in Supplementary Table 1 were modelled using TCRM. The wind field for Cyclone Debbie was sourced from Krause and Arthur (Reference Krause and Arthur2018) and was not re-modelled using the methods outlined here.
Track data for each cyclone were collected from the International Best Track Archive for Climate Stewardship (IBTRACS) database (Knapp et al. Reference Knapp, Diamond, Kossin, Kruk and Schreck2018). Observations of latitude, longitude, wind speed (knots), central pressure (millibar) and radius to maximum winds (nautical mile) for the lifetime of each cyclone were compiled into track (comma delimited or csv) files for each cyclone. TCRM regional wind fields were modelled for each tropical cyclone using the tcevent.py module within TCRM. The tcevent.py script runs scenario simulations and can interpolate track positions over time to create realistic wind field representations that are useful for studying the wind patterns of past events. All cyclone simulations were run using the parameters provided in Supplementary Table 2. The regional wind fields produced by TCRM represent the maximum 10 m above ground 0.2 second duration wind gust. TCRM does not include a representation of land surface conditions, such as topography or land cover, and assumes the land surface has an aerodynamic roughness length of 0.02 m, equivalent to open, flat terrain conditions at an airport. Whilst this makes the model more computationally feasible, the consequence is real-world surface roughness may likely be underestimated. However, carefully considering wind multipliers was undertaken to mitigate these issues.
Land surface conditions such as topography, land cover, wind shielding by upstream objects and wind direction are accounted for by applying wind multipliers to the regional wind field (Yang et al. Reference Yang, Cechet and Nadimpalli2014). These wind multipliers are a representation of the speed up or reduction in wind speed as it moves over the land surface (e.g. the speed up that occurs as wind moves up a slope). Wind multipliers were calculated for each cyclone landfall region, including where a cyclone made landfall multiple times. Elevation data for each landfall region were taken from the SRTM-derived 1 Second Digital Elevation Models Version 1.0 (Gallant et al. Reference Gallant, Wilson, Dowling, Read and Inskeep2011).
TCRM requires land cover of each landfall region needs to be determined to estimate surface (aerodynamic) roughness. Surface roughness estimates can be found in the Australian/New Zealand building Standard AS/NZS 1170.2 Supp 1, 2002, which outlines the processes for calculating wind multipliers. In this study, we chose not to use a land surface classification to determine the terrain roughness lengths for different land cover types to maximise computational efficiency. As we were interested in the impact of tropical cyclones on mangroves forests, we assumed that the entire landfall region was covered by mangroves and assigned a spatially consistent value of 0.2 m was applied. Whilst this value will result in a local wind field that is potentially incorrect for non-mangrove targets, it provides a reasonable estimate of the wind speed over the mangroves that this study focuses on. The spatial resolution (25 m) of the localised wind field was the same resolution as the vegetation data. Local roughness length is a function of the spacing of obstructions and will influence local windspeeds. Consequently, for windspeeds >200 km/hr in open conditions (i.e. over water), the wind speeds may vary by up to 10 km/hr.
Observations from the nearest weather stations were integrated with simulated wind speeds. However, the data from the weather stations may have been recorded some distance from where the cyclone made landfall resulting in poorer simulation (i.e. underestimation or overestimation of windspeed; Arthur Reference Arthur2021). Nonetheless, the wind fields were generated at a high spatial resolution (0.01°), ensuring a wide range of wind speeds were generated allowing for examination of individual cyclone events. The modelled wind speeds generated by the TCRM were used to define the area of interest for each cyclone (i.e. area of mangroves to be assessed for cyclone impact). A mask was created for areas experiencing windspeeds >125 km/hr to clip the mangrove canopy cover layer. Detailed information about setting up and running the model, including examples and scenario simulation, can be found at https://geoscienceaustralia.github.io/tcrm/index.html.
Mangrove extent and canopy cover
Annual national maps of mangrove canopy cover (1987–2021) were previously generated using a dense time series of Landsat data available in DEA (Lymburner et al. Reference Lymburner, Bunting, Lucas, Scarth, Alam, Phillips, Ticehurst and Held2020; data can be found at https://pid.geoscience.gov.au/dataset/ga/145497). This study uses the published maps to quantify the immediate loss of mangrove cover and potential for recovery (i.e. the loss temporary or persistent). This is the first time mangrove canopy cover has been mapped at a continental scale using an annual time step at 25 m spatial resolution (Lymburner et al. Reference Lymburner, Bunting, Lucas, Scarth, Alam, Phillips, Ticehurst and Held2020). The temporal resolution (i.e. annual) is suitable identifying and isolating cyclone impacts as the events are sudden and significant, thus immediately visible in Landsat imagery. It is unlikely that the changes in mangrove extent and structure are due to long-term variability in climatic and environmental conditions (i.e. sea-level rise) as these changes tend to be gradual and subtle on a year-to-year basis. In addition, most of the cyclones impact mangroves in relatively remote regions with little/no anthropogenic disturbances, as such the impacts can be directly related to the cyclone.
The canopy cover product classified mangroves as either closed forest (>80% cover), open forest (50–80% cover) or woodland (20–50% cover), with thresholds of canopy cover being the same as the forest categories outlined in Australia’s State of the Forests Report (SOFR 2019). The minimum canopy cover value of 20% was also in alignment with SOFR (2019), which defines as ‘land with trees where the tree canopies cover less than 20% of the land area is not classified in Australia as forest, but is categorised as various forms of non-forest vegetation’. Closed forests are often associated with the tallest and oldest trees in the region, sometimes known as a ‘core forest’ as they tend to remain stable in terms of extent (Asbridge et al. Reference Asbridge, Lucas, Ticehurst and Bunting2016). Open forest and woodland may include shorter and younger trees that are either on a trajectory of improving condition (i.e. recovery) or deteriorating condition (i.e. increasing openness following cyclone events, flooding, insect infestation etc.; Asbridge et al. Reference Asbridge, Lucas, Ticehurst and Bunting2016; SOFR 2019). The 25-m resolution of the canopy cover maps allows for clear annual comparisons of mangrove condition (i.e. loss or gains in canopy cover across estuaries), an example of which is provided in Supplementary Figure 2 (Lymburner et al. Reference Lymburner, Bunting, Lucas, Scarth, Alam, Phillips, Ticehurst and Held2020). The accuracy of each annual map was assessed by an independent analyst and using statistical metrics with accuracies >92%.
Wind fields and mangrove canopy cover impact
For each cyclone, the rasterised wind speed data derived from wind field modelling was aligned with time-series change in canopy cover to characterise the immediate and long-term implications for canopy cover. To visualise and understand the change in mangrove area and canopy cover annually and to identify the landfall of a specific tropical cyclone, data for all years (1987–2021) were extracted from the annual national maps of mangrove canopy cover derived from DEA (1987–2021). This allowed the change in area of canopy cover to be quantified.
The focal area of cyclone landfall was defined by the cyclone track, cyclone intensity and radius to maximum winds; therefore, the area of mangroves assessed per cyclone can differ considerably. For example, the area of interest for Cyclone Lam is significantly larger compared to other cyclones; hence, the total area of mangroves potentially affected by tropical Cyclone Lam (~3000 km2) is considerably greater than Cyclone George (~280 km2), Cyclone Yasi (~440 km2) and Cyclone Laurence (~280 km2). This should be considered when assessing the area of canopy change and immediate and long-term damage. The focal area of cyclone landfall was further refined by applying the modelled windspeed mask for areas with windspeeds >125 km/hr.
Immediate impact on mangrove canopy cover
The immediate impact of cyclones was quantified by comparing mangrove canopy cover classes for the year immediately prior to a cyclone (i.e. pre-cyclone benchmark) and the year immediately after a cyclone (i.e. 1-year post-cyclone) for each focal area of cyclone landfall. This means that the immediate impact results capture the initial damage but also ongoing impacts throughout the first year. The change in canopy cover was reclassified to represent the immediate impact of cyclones for the year immediately after cyclone landfall. Table 1a shows the classification system used to calculate immediate impact for each cell. Pixels with the most severe canopy cover change included areas that were previously closed (>80% cover) or open (50–80% cover) mangrove forest that was subsequently completely lost; these pixels were classified as ‘Loss of forest’ (class 4). The immediate impact was spatially displayed to provide an insight into patterns of damage and the area and percentage change for each immediate impact class were calculated for each cyclone.
Table 1. The change classes used to calculate (a) immediate impact class based on comparing canopy cover classes for the year immediately prior to cyclone and the year immediately after cyclone and (b) long-term impact class, based on comparing pre-cyclone canopy cover (benchmark) to each year following the cyclone

Note: The label represents the text description, that is, the type of forest, and the class delimits the number associated with this label. For example, ‘Woodland’ is the label, and the associated class is 1.
To determine the longer-term impacts of cyclones on mangrove canopy cover and indicate the degree of recovery, a canopy cover change raster was created by comparing benchmark mangrove canopy cover (year immediately before the cyclone) to each year after the cyclone (Table 1b). This created an annual time series of mangrove canopy cover change post-cyclone. Depending on the timing of the cyclone, the long-term impact analyses may include many years of data, whilst other more recent cyclones will only have a few years of data to use. To illustrate, as Cyclone George occurred in 2007, there are 13 years to assess the long-term impact and potential for recovery (i.e. 2008–2021). In contrast, Cyclone Lam in 2015 only has 6 years post-cyclone that can be used to indicate the long-term impact. In the years following the cyclone, other storm events and lower intensity cyclones (category 1–2) may occur. However, this study only concerns category 3–5 cyclones as recent research has found that damage to mangroves is only visible in Landsat imagery following major cyclone events (i.e. category 3 or greater; Mo et al. Reference Mo, Simard and Hall2023). Therefore, the change in mangrove area in the years after initial cyclone can be attributed to long-term impacts/recovery from the initial event. Pixels were reclassified based on the change in class of the forest for all years post-cyclone (Table 1b). The long-term impact on canopy cover was displayed spatially and the area and percentage change for each long-term impact class was calculated for each cyclone.
Multiple cyclone impact over immediate and long-term timescales
To spatially assess and quantify the impact of multiple category 3–5 cyclones making landfall in the same region the DEA mangrove canopy cover map was used to compare pre-cyclone and post-cyclone cover, along with the short-term/immediate impact and longer-term impact classes for each cell. A region may experience a category 3–5 cyclone and during the following years may experience a category 1 or 2 cyclone, or storm surge. Whilst this would potentially influence the long-term trajectory and potential for recovery, lower intensity storms were not included in this study as their impacts to mangrove systems are reported to be minimal/moderate (Krauss and Osland Reference Krauss and Osland2020; Mo et al. Reference Mo, Simard and Hall2023) and may not be clearly visible in remote sensing imagery.
Cyclone Ingrid (March 2005) and Cyclone Monica (April 2006), followed similar tracks within 13 months, impacting mangroves in Far North Queensland and Arnhem Land, Northern Territory. The sequential impact of the two tropical cyclones on mangrove extent and canopy cover was investigated at a site west of Maningrida, NT. This site was chosen as it coincides with where Cyclone Ingrid passed very close to the coastline and Cyclone Monica made landfall. Cyclones prior to 2005 were not assessed in this study; however, it should be noted that this site is historically prone to cyclones with six cyclones making landfall in this region since 1970. The long-term impact for both cyclones is calculated from all years post-cyclone, meaning that pre-existing damage from Cyclone Ingrid is included in the long-term assessment of Cyclone Monica.
Results
Wind field modelling and mangrove canopy cover
The highest modelled wind speeds were identified for Cyclone Yasi, followed by Cyclone George, Cyclone Laurence and Cyclone Lam (Figure 2a–d). The temporal change in extent and canopy cover for mangrove forests associated with these cyclones (Figure 2e–h) generally indicates relatively small annual fluctuations; however, larger shifts were noted in some years. A substantial change in canopy cover is observed in 2011, with a large reduction in area of closed forest (>80%) and increase in open forest (50–80%) and woodland (20–50%), coinciding with Cyclone Yasi (Figure 2h). The change in canopy cover is less pronounced for the years coinciding with the other tropical cyclones (Figure 2e–g). However, all cyclones show a reduction in the area of closed forest and increase in open forest when compared to the year immediately before.

Figure 2. (a–d) The modelled windspeed over the lifetime of each cyclone. (e–h) The change in canopy over the time series from 1987 to 2021 with the red line indicating the year of the cyclone.
Wind fields and mangrove canopy cover impact
The closed forest mangrove class was most impacted by tropical cyclones followed by open forest and woodland across all four case study cyclones (Supplementary Figure 3). The area lost per canopy cover type represents a shift in the type of cover (i.e. structural forest change). Cyclone Yasi and Cyclone Lam noted the greatest area of closed canopy lost. This may be because the forests impacted were predominantly (>50%) composed of closed forest in the year prior to the cyclone (Figure 2f and h). Cyclone Lam resulted in the greatest overall structural change with losses of 315.24 km2 of closed forest, 97.28 km2 of open forest and 45.87 km2 of woodland, perhaps reflecting the larger area of interest which encompassed a greater area of mangroves. The comparatively lower area of structural change for Cyclone George and Laurence may be due to the sparse mangrove forests in the landfall region. The area of canopy cover lost per wind speed category for the other cyclones not included in the case study results is shown in Supplementary Table 3.
Immediate impact on canopy cover
The immediate impact on mangrove canopy cover was evident when comparing the mangrove canopy cover maps pre- and post-tropical cyclone. This was particularly apparent for the immediate impact at Hecate Point, Hinchinbrook Island, Queensland, prior to and following Cyclone Yasi (Figure 3a–c). Most of the area was composed of closed mangrove forest (>80% cover) prior to the cyclone in 2010 (Figure 3a). However, the forest structure changed after the cyclone to be more open and predominantly woodland (20–50% cover; Figure 3b). Classification of immediate impact (Figure 3c) indicates most of the area experienced loss of woodland, that is, prior to the tropical cyclone pixels were classed as woodland (20–50% cover), but mangroves were not present post-cyclone. Loss of forest (pixels that transitioned from closed or open forest to no mangrove) was observed on the northern coastal fringe and minor reductions occurred mostly in the interior of the forest. The immediate and long-term damage results for the other cyclones not represented as case studies can be seen in Supplementary Figure 4.

Figure 3. Hecate Point, Hinchinbrook Island, Queensland impacted by Cyclone Yasi. (a) Pre-cyclone canopy cover (2010), (b) post-cyclone canopy cover (2011), (c) immediate impact mapping and (d) long-term impact mapping.
Cyclone Lam had the greatest overall area of immediate damage (Figure 4a). Most of the immediate damage was classed as a minor reduction across all cyclones (demonstrated by the percentage change in Figure 4a). Pixels classified as loss of woodland were the next largest area of immediate damage for three out of the four tropical cyclones (George, Laurence and Lam). For Cyclones George and Laurence, the areas classified as a major reduction in cover (transition from closed forest to woodland) and loss of forest (transition from closed or open forest to no mangrove) were negligible. However, it is worth noting that for Cyclone Yasi, the second largest immediate damage category was a major reduction in cover (Figure 4), suggesting that this cyclone may have resulted in widespread loss of cover (i.e. transition between canopy cover types) as opposed to complete loss of mangrove.

Figure 4. (a) Area and percentage change for each immediate impact class and (b) area and percentage change for each long-term impact class for Cyclones George, Laurence, Yasi and Lam.
Long-term impact on mangrove canopy cover
Most of the mangrove forest at Hecate Point, Hinchinbrook Island, experienced a ‘temporary reduction in canopy cover’ following Cyclone Yasi (Figure 3d), suggesting that the forest has since recovered. Overall substantial recovery was evident with only small areas classified as persistent loss of canopy cover (0.80 km2, 0.18%), with this restricted to the north-eastern coastal fringe, coinciding with part of the forest that experienced the most severe immediate impact (‘loss of forest’; Figure 3c). Scattered throughout the forest are areas classified as a ‘permanent reduction in canopy cover’ (12.40 km2, 2.84%), implying that a greater degree of openness has persisted compared to pre-cyclone cover.
The majority of the long-term damage was classified as a ‘temporary reduction in canopy cover’ for all cyclones (Figure 4b), suggesting a positive transition to a more closed canopy cover in the years following the tropical cyclone. Similarly, ‘temporary loss’ was identified as the second greatest area of long-term impact across the four cyclones, suggesting pixels that were void of mangroves following the cyclone were able to recover. The area classified as ‘permanent reduction in cover’ and ‘persistent loss’ was minor for Cyclone George and Cyclone Laurence. For Cyclone Yasi, there was negligible ‘persistent loss’; however, there was a relatively small area classified as a ‘permanent reduction in cover’, this is reflected in Figure 3d. Cyclone Lam notes the largest area without recovery, classified as ‘permanent reduction in cover’ and ‘persistent loss’. However, this is likely due to the larger area of interest as the percentage change for these damage classes is similar across all cyclones (Figure 4b). In addition, Cyclone Lam is the most recent cyclone analysed (i.e. the shortest period in the long-term analysis); therefore, greater areas of recovery may be noted over coming years. The long-term trajectories suggest mangroves have the capacity to exhibit recovery and demonstrate the potential for resilience.
Multiple cyclone impact over immediate and long timescales
At a site west of Maningrida, NT, where two cyclones made landfall within 13 months of each other (Cyclone Ingrid: 2005 and Cyclone Monica: 2006), the effect of multiple cyclones was most noticeable in the short term (i.e. immediate impact). The immediate damage following the first event, Cyclone Ingrid, indicated that almost all the area experienced a ‘minor reduction in cover’ (18.45 km2, 82.92%; Supplementary Figure 5c). However, the immediate impacts of Cyclone Monica were much more evident, with 11.53 km2 (51.82%) of forest lost and 6.03 km2 (27.10%) of woodland lost (Supplementary Figure 5g). Despite the sequential impacts, recovery was evident after both events, with the majority of the long-term impacts classed as ‘temporary loss’ (Supplementary Figure 5d and 5h).
Discussion
Tropical cyclone wind field modelling was integrated with annual national maps of mangrove canopy cover to identify the short and long-term impacts of selected category 3–5 cyclones on mangroves in Australia. Investigating changes in canopy cover using annual composites in DEA was suitable given the significant and obvious impacts of cyclone damage and the lack of other anthropogenic disturbances in many of these remote regions. Analyses indicated that cyclone damage is both spatially variable for an individual cyclone event and between cyclones at different locations impacting different mangrove forests. Despite this spatial variation, there was a general trend of recovery post-cyclone, with only minor areas classified as having persistent loss. These results have important implications for the resilience of mangrove forests exposed to cyclones that will provide useful context for managing mangrove forests that are projected to be exposed to increasing frequency and intensity of cyclones.
Immediate changes to canopy cover
Immediate impacts varied in severity and area (km2) between cyclones, based on cyclone track, length, intensity (i.e. category), landfall location and landfall frequency. Cyclone Laurence (Figure 2g) and Cyclone Lam (Figure 2f) have large areas of immediate impact reflecting long cyclone tracks that travelled parallel and near to the coast and made multiple landfalls (Supplementary Table 1). However, large areas experiencing high winds do not necessarily translate to large areas of mangrove impacted, as most of the track may have been low intensity (Cyclone Laurence), and the cyclone may not have made landfall in a region with extensive mangrove forests (Cyclone George and Cyclone Laurence).
Within a mangrove forest experiencing a cyclone, the immediate impacts varied spatially with distance to the cyclone track and landfall zone. One of the most severely impacted (loss of forest) sites following Cyclone Yasi was on the northern coastal fringe (Figure 3c), where it is likely these forests were exposed to peak wind velocities and experienced the full force of the storm surge due to their positioning on the seaward/windward side of the island and close proximity to the track. Mangroves further into the interior of the forest and on the opposite coastline (southwest) were afforded more protection (wind and wave dissipation from surrounding trees and root systems) and experienced reduced damage (loss of woodland and minor reduction in cover). The pattern of greater immediate damage for mangrove forests closer to the track and within the direct landfall zone (high windspeeds), compared to sheltered interior forests, has been confirmed by several other studies (Barr et al. Reference Barr, Engel, Smith and Fuentes2012; Long et al. Reference Long, Giri, Primavera and Trivedi2016; Ross et al. Reference Ross, Ruiz, Sah and Hanan2009; Ross et al. Reference Ross, Ruiz, Sah, Reed, Walters and Meeder2006; Zhang et al. Reference Zhang, Durgan and Lagomasino2019; Zhang et al. Reference Zhang, Thapa, Ross and Gann2016; Zhao et al. Reference Zhao, Bai, Huang, Gu, Lu and Gao2016). Wind shielding from local topographic conditions (i.e. slope and aspect) can also contribute to spatial variation in immediate impact, as observed on the leeward side of Hinchinbrook Island (Cahoon et al. Reference Cahoon, Hensel, Rybczyk, McKee, Proffitt and Perez2003; Kauffman and Cole Reference Kauffman and Cole2010).
Cyclone Yasi made landfall in very close proximity to Hinchinbrook Island, which is well known for hosting some of the most extensive and productive mangrove forests in Australia. This site supports 31 species, with many forming tall (up to 40 m) predominantly closed forests (Bunt et al. Reference Bunt, Williams and Clay1982; Ellison Reference Ellison2000). Following the cyclone in 2011, there was a considerable reduction in the area of closed canopy cover, indicating a large area of immediate damage (Figure 2h). It is likely that the closed forests at Hinchinbrook Island are the oldest and tallest within the forest, and it is widely accepted that the tallest mangroves are often the most impacted during a cyclone due to greater exposure to higher windspeeds (Asbridge et al. Reference Asbridge, Lucas, Rogers and Accad2018; Krauss and Osland Reference Krauss and Osland2020; Lagomasino et al. Reference Lagomasino, Fatoyinbo, Castañeda-Moya, Cook, Montesano, Neigh, Corp, Ott, Chavez and Morton2021; Peereman et al. Reference Peereman, Hogan and Lin2020; Roth Reference Roth1992; Zhang et al. Reference Zhang, Thapa, Ross and Gann2016). Shorter trees can be shielded from high wind speeds, and seedlings and saplings protected if they are inundated during a storm surge and high tide (Krauss and Osland Reference Krauss and Osland2020; Paling et al. Reference Paling, Kobryn and Humphreys2008; Stocker Reference Stocker1976). Further evidence for wind shielding and differences between tree heights is evident when considering canopy gaps/lightening gaps, as shorter trees growing in gaps tend to be less impacted by wind speeds compared to taller surrounding trees (Smith et al. Reference Smith, Robblee, Wanless and Doyle1994). This suggests that the extent and structure of the forest prior to the cyclone influences the degree of immediate impact (Krauss and Osland Reference Krauss and Osland2020; Lewis et al. Reference Lewis, Milbrandt, Brown, Krauss, Rovai, Beever and Flynn2016; Odum and Johannes Reference Odum and Johannes1975).
Mortality may still occur, and forest structural condition can continue to decrease over the first 12 months, with this often evident in field surveys and remote sensing imagery 1 year post-event, as demonstrated in this study (Asbridge et al. Reference Asbridge, Lucas, Rogers and Accad2018; Lagomasino et al. Reference Lagomasino, Fatoyinbo, Castañeda-Moya, Cook, Montesano, Neigh, Corp, Ott, Chavez and Morton2021; Paling et al. Reference Paling, Kobryn and Humphreys2008). Drivers of this type of loss are persistent hydrological and sedimentological changes that place mangroves under great physiological stress (Castañeda-Moya et al. Reference Castañeda-Moya, Twilley, Rivera-Monroy, Zhang, Davis and Ross2010; Lagomasino et al. Reference Lagomasino, Fatoyinbo, Castañeda-Moya, Cook, Montesano, Neigh, Corp, Ott, Chavez and Morton2021). Cyclonic winds, strong waves and near shore currents can move considerable sediment loads leading to erosion and sediment deposition. Burial of mangrove roots by sediment and persistent waterlogging due to post-cyclone flooding and poor surface drainage can lead to mortality as gas exchange is prevented in the lenticels and aerenchyma (respiratory structures) within the roots (Ellison Reference Ellison1999; Hensel and Proffitt Reference Hensel and Proffitt2003).
Long-term trajectory
A forest can take several years to show signs of recovery and may experience a permanent change in ecosystem state (condition, structure and species composition) following a cyclone event (Doyle et al. Reference Doyle, Smith and Robblee1995; Imbert et al. Reference Imbert, Labbe and Rousteau1996; Sherman et al. Reference Sherman, Fahey and Martinez2001). Recovery post-cyclone depends on the extent and severity of the immediate damage, species type, supply of propagules and environmental conditions including local sediment (peat collapse, erosion and accretion) and hydrological (connectivity and inundation) dynamics (Asbridge et al. Reference Asbridge, Lucas, Rogers and Accad2018; Imbert Reference Imbert2018; Imbert et al. Reference Imbert, Rousteau and Labbe1998; Smith et al. Reference Smith, Robblee, Wanless and Doyle1994).
Temporary reduction in canopy cover was the predominate long-term impact classification across all cyclones, indicating that substantial recovery occurred after each event. This is consistent with other studies (Amaral et al. Reference Amaral, Poulter, Lagomasino, Fatoyinbo, Taillie, Lizcano, Canty, Silveira, Teutli-Hernández and Cifuentes-Jara2023; Aung et al. Reference Aung, Mochida and Than2013; Paling et al. Reference Paling, Kobryn and Humphreys2008). However, there are areas (albeit limited) across all cyclones that showed persistent canopy cover loss and a permanent reduction in canopy cover, suggesting little/no recovery. Changes in substrate conditions (i.e. erosion or sediment burial of roots), hydrological connectivity (i.e. persistent flooding) and a limited supply of propagules may slow or prevent recovery, as has been found at other locations (Asbridge et al. Reference Asbridge, Lucas, Rogers and Accad2018; Sherman et al. Reference Sherman, Fahey and Martinez2001; Steinke and Ward Reference Steinke and Ward1989).
Areas with severe immediate impacts (i.e. mortality/loss of forests) are likely to experience a greater degree of long-term persistent loss and a permanent reduction in canopy cover (Asbridge et al. Reference Asbridge, Lucas, Rogers and Accad2018; Radabaugh et al. Reference Radabaugh, Moyer, Chappel, Dontis, Russo, Joyse, Bownik, Goeckner and Khan2020), as demonstrated at Hecate Point, Hinchinbrook Island (Figure 3c and 3d). Recovery is likely hindered in these (often exposed) areas as high wind speeds lead to immediate gross physical damage and significant and persistent changes to environmental conditions (sediment and hydrological) limiting the capacity for propagule establishment and growth. Trees in these areas are likely to experience considerable defoliation, as opposed to branch and bole breakage, and may take longer to recover as defoliation leads to prioritised resource allocation for new leaves as opposed to propagules (Anderson and Lee Reference Anderson and Lee1995; Hodkinson and Hughes Reference Hodkinson and Hughes1982; Tong et al. Reference Tong, Lee and Morton2003). In addition, defoliated mangroves tend to be more vulnerable to stressors such as persistent inundation and extreme salinities (Grace and Ford Reference Grace and Ford1996; Piyakarnchana Reference Piyakarnchana1981).
Figure 5 provides a conceptualisation of the most common types of observed immediate impacts and recovery trajectories for different pre-cyclone canopy cover classes. The trajectories are based on the trends identified in this study, and the understanding that the severity of the immediate impact and the pre-cyclone forest condition greatly influences the potential for recovery (Krauss and Osland Reference Krauss and Osland2020; Lewis et al. Reference Lewis, Milbrandt, Brown, Krauss, Rovai, Beever and Flynn2016; Odum and Johannes Reference Odum and Johannes1975). The greater the immediate impact (i.e. the loss of canopy cover), the longer (and more unlikely) the recovery trajectory to pre-cyclone canopy cover. Closed forests (Figure 5a) and open forests (Figure 5b) exhibiting minor impact tended to recover to pre-cyclone canopy cover relatively quickly (i.e. within 1 year). It is rare that a closed or open forest experiencing a minor reduction in canopy cover would transition to non-mangrove system. However, for closed forests experiencing a major reduction in cover, the forests tended to exhibit slower recovery, with the most common outcome being an increase in cover, albeit not to pre-cyclone cover (Figure 5c). If the immediate impact to closed forests is more severe, that is transition from closed forest to non-mangrove resulting in dieback, it is likely the forest will only recover to (20–50% cover), with greater cover only possible over the long term (Figure 5d). The system may also remain as non-mangrove if hostile conditions persist.

Figure 5. Conceptual figure to describe the potential long-term trajectories for common types of impact and recovery identified across the four case study cyclones. Panels indicate likely recovery trajectories of (a) closed forest after a minor reduction in canopy cover, (b) open forest after minor reduction in canopy cover, (c) closed forest after major reduction in canopy cover and (d) closed forest after severe mortality post-cyclone.
Repeated cyclones
The first cyclone to make landfall can make the system vulnerable and predispose the forest to more severe immediate and long-term impacts following a second category 3–5 cyclone, as observed following repeated cyclones at Maningrida, NT (Supplementary Figure 5). Despite these sequential impacts, mangroves were observed to recover with the vast majority of the long-term impact classed as temporary, demonstrating resilience and the capacity to adapt to new environmental conditions. Previous studies have reported similar results, with limited long-term impacts (i.e. mortality) and little permanent canopy cover damage in cyclone prone regions (Lin et al. Reference Lin, Hamburg, Lin, Wang, Chang, Hsia, Vadeboncoeur, Mabry McMullen and Liu2011; Peereman et al. Reference Peereman, Hogan and Lin2022). The capacity for recovery and increased resilience may be due to defoliation during the first cyclone which in turn decreases wind drag during subsequent cyclones resulting in increased resistance to high wind speeds (Lin et al. Reference Lin, Hamburg, Lin, Wang, Chang, Hsia, Vadeboncoeur, Mabry McMullen and Liu2011).
Mangrove canopy height in Maningrida, NT, primarily ranges from 5 to 15 m, with only relatively small patches (~<1 km2) of taller trees (~20–25 m). This is in contrast to other mangrove forests in northern Australia such as Port Douglas and Daintree (Northern Queensland) which have significantly larger areas of tall (>20 m) trees (Simard et al. Reference Simard, Fatoyinbo, Smetanka, Rivera-Monroy, Castañeda-Moya, Thomas and Van der Stocken2019a). The forest structure (shorter stature trees) in Maningrida may reflect a history of repeated cyclone events and provide insights into adaptation strategies (Krauss and Osland Reference Krauss and Osland2020; Rovai et al. Reference Rovai, Riul, Twilley, Castañeda‐Moya, Rivera‐Monroy, Williams, Simard, Cifuentes‐Jara, Lewis and Crooks2016; Simard et al. Reference Simard, Fatoyinbo, Smetanka, Rivera-Monroy, Castañeda-Moya, Thomas and Van der Stocken2019a). This is supported by other studies that have identified mangroves in cyclone prone regions often experience long-term canopy dwarfing as taller trees are disproportionally damaged by frequent high windspeeds and are removed from the system, leaving short canopies with greater resistance to high windspeeds (Chi et al. Reference Chi, McEwan, Chang, Zheng, Yang, J-M and Lin2015; Doyle et al. Reference Doyle, Smith and Robblee1995; Krauss and Osland Reference Krauss and Osland2020; Lagomasino et al. Reference Lagomasino, Fatoyinbo, Castañeda-Moya, Cook, Montesano, Neigh, Corp, Ott, Chavez and Morton2021; Lin et al. Reference Lin, Hamburg, Lin, Wang, Chang, Hsia, Vadeboncoeur, Mabry McMullen and Liu2011; Peereman et al. Reference Peereman, Hogan and Lin2022; Sherman et al. Reference Sherman, Fahey and Martinez2001). In contrast, the tallest mangroves in the world are mostly found in regions without cyclones, such as the Gabon Estuary (Simard et al. Reference Simard, Fatoyinbo, Smetanka, Rivera-Monroy, Castañeda-Moya, Thomas and Van der Stocken2019a), suggesting favourable conditions (lower windspeeds) for tall forests to dominate.
Permanent reduction in canopy cover and persistent loss/mortality of mangrove forest was observed following multiple cyclone impact, albeit a very small area. This can occur if environmental conditions become too challenging for propagule establishment and regrowth (Duke Reference Duke2001). In addition, large quantities of vegetation debris following repeated cyclones may result in rapid decomposition, sediment compaction (subsidence or peat collapse; Barr et al. Reference Barr, Engel, Smith and Fuentes2012; Lang’at et al. Reference Lang’at, Kairo, Mencuccini, Bouillon, Skov, Waldron and Huxham2014) and persistent inundation (Cahoon et al. Reference Cahoon, Hensel, Rybczyk, McKee, Proffitt and Perez2003), limiting propagule establishment. In regions where the frequency of cyclones is predicted to increase with climate change, the environmental conditions in the forest may not have time to recover between disturbances, potentially leading to ecosystem collapse (Peereman et al. Reference Peereman, Hogan and Lin2020). This scenario may become more apparent with the compounding influence of climate change (increasing temperatures, changes to rainfall regimes and sea-level rise) further increasing the frequency, duration and intensity of environmental stressors and leading to reduced mangrove resilience.
Conclusions
Remote sensing and increased accessibility in Earth observation data provide capacity to monitor immediate and long-term cyclone impacts, recovery pathways and changes in ecosystem state at national scales. The consistent approach presented in this study offers a potential opportunity to measure cyclone impact as part of a long-term monitoring program that could be applied globally, particularly given the global coverage of Landsat data. This would facilitate comparisons between locations with different geomorphic settings, cyclones of varying severity and provide further data to understand impacts to forest structure, composition and recovery pathways. Differentiating immediate impacts and longer-term trajectories provides insights into the impact of wind speed, the influence of location-specific variables such as cyclone track, geomorphology and tidal position, and forest structural adaptations (height, density, condition and species). The predominance of a minor reduction in canopy cover immediately post-cyclone indicates that immediate mortality was limited. Recovery was evident across all sites with only localised areas noting persistent loss of forest and permanent reduction in canopy cover, coinciding with sites most severely impacted in the immediate term. Intense and repeated cyclones often change forest structure to an alternative stable condition that is more resilient in the long term.
Understanding the range and severity of impacts and long-term trajectories allows natural resource managers to identify sites for monitoring and targeted management; this information is urgently needed to plan for future climate change scenarios. Forests with the capacity to recover quickly are regarded as resilient and should be prioritised conservation efforts. Conversely, sites experiencing longer-term impacts should be targeted for further investigation to determine the causes of limited or no recovery, where possible on ground interventions could be implemented to prevent permanent loss of mangrove forests and their ecosystem services. Carbon sequestration is one of the most important ecosystem services provided by coastal wetlands. Tropical cyclones have the potential to negate mangrove blue carbon sequestration, at least in the short term, particularly if the cyclone has fundamentally altered the substrate. However, longer-term trajectories of mangrove canopy cover recovery were evident in most cases and in some instances restored to pre-cyclone canopy cover classes, providing some confidence that impacts on blue carbon stocks may be short term in most cases. The approach presented in this study provides information essential for modelling carbon fluxes, physiological thresholds and evaluating system resilience in Australia and can be readily transferred to cyclones globally.
Open peer review
To view the open peer review materials for this article, please visit http://doi.org/10.1017/cft.2024.19.
Supplementary material
The supplementary material for this article can be found at http://doi.org/10.1017/cft.2024.19.
Acknowledgements
This manuscript is published with permission of executives at Geoscience Australia. The authors would like to thank Geoscience Australia for providing expert advice and access to datasets (IP ownership). The authors thank the Australian Research Council (ARC Discovery Project DP210100739) for their funding and support.
Author contribution
All authors have made contributions to this submission. E Asbridge led the writing of the manuscript, including critical analysis and interpretation of results in the context of existing literature and placed the findings within the broader context of climate change. CK, CO, E Ai and SW conducted the wind field modelling and used annual national maps of mangrove canopy cover derived from DEA (1987–2021) to extract changes in mangrove canopy cover. CK and CO produced the wind field figure and maps of mangrove canopy cover change. RL, KR, LL and NM provided feedback on the draft sections, with KR helping substantially to revise sections and create the conceptual figure.
Financial support
This research has been conducted with the financial support of the Australian Research Council (ARC Discovery Project DP210100739).
Competing interest
The authors declare no conflicts of interest.


 Open access
Comments
Dear Editor-in-Chief, Professor Tom Spencer,
I hope this letter finds you well. I am writing to submit my manuscript titled “Characterising the Impact of Tropical Cyclones on Mangroves Using a Multi-decadal Landsat Archive” for consideration for publication in Cambridge Prisms: Coastal Futures, on the topic of coastal wetlands.
As a researcher deeply invested in the study of coastal ecosystems, particularly mangroves, I am thrilled to present this work to your esteemed journal. This manuscript presents remote sensing techniques used to understand the immediate and long-term impacts of tropical cyclones on mangroves in Australia. Coastal wetlands, especially mangroves, are vital ecosystems that provide numerous ecological, economic, and social benefits. However, they are increasingly threatened by the impacts of climate change, including more frequent and severe tropical cyclones.
In this manuscript, I employ a comprehensive analysis of time-series Landsat data and wind field modelling to characterise the impact of tropical cyclones on the extent and condition of mangroves. We provide insights into the patterns and drivers of mangrove resilience and vulnerability. Our findings not only contribute to advancing scientific knowledge in this field but also have significant implications for coastal management and conservation efforts.
I believe that our manuscript aligns well with the scope and mission of Cambridge Prisms: Coastal Futures, as it addresses pressing issues related to coastal wetlands and their resilience in the context of a changing climate. Moreover, our rigorous methodology and novel insights make a valuable addition to the scholarly discourse on this topic.
Enclosed, please find the manuscript, along with any supplementary materials required for review. I trust that you will find our work suitable for publication in Cambridge Prisms: Coastal Futures and that it will be of interest to your readership. I thank you for the invitation to publish in Coastal Futures and I look forward to hearing from you soon regarding the outcome of the review process.
Warm regards,
Dr Emma Asbridge
University of Wollongong, School of Earth, Atmospheric and Life Sciences, NSW, 2522
emmaa@uow.edu.au, +61 435 714 228