1 Introduction, related work and methodology
In the European Union, transportation is responsible for about one quarter of all greenhouse gas emissions because over 90% of the fuel used for transportation is petroleum based (European Union 2017). Additionally, cars, trucks and buses are responsible for other noxious or toxic substances, such as carbon monoxide from incomplete combustion, hydrocarbons from unburnt fuel, nitrogen oxides from excessive combustion temperatures, and particulate matter. To achieve ambitious climate goals, e.g., the reduction of
![]() $\text{CO}_{2}$
emissions by 60% in 2040 in the European Union (European Commission 2011) and to improve air quality especially in urban areas, ‘clean technologies’ have to be developed and deployed in all sectors of transportation.
$\text{CO}_{2}$
emissions by 60% in 2040 in the European Union (European Commission 2011) and to improve air quality especially in urban areas, ‘clean technologies’ have to be developed and deployed in all sectors of transportation.
Therefore, public transport authorities have a great interest in introducing zero-emission buses (Faltenbacher et al. Reference Faltenbacher, Vetter, Rock and Grafetstätter2016). However, replacing today’s fleets of diesel buses entails several challenges. First, electric buses – apart from catenary based trolley bus systems – only recently have become commercially available and they still need further technical improvements. Second, bus operators face several different options of electric bus and charging technologies and a vast number of possibilities to combine these options into a system solution. All options have specific assets and drawbacks concerning technological complexity, capital and operational cost.
Different aspects of this far-reaching transformation have been covered in numerous papers. Sinhuber, Rohlfs & Sauer (Reference Sinhuber, Rohlfs and Sauer2012) and Rogge, Wollny & Sauer (Reference Rogge, Wollny and Sauer2015) used a simulation model to determine the route specific energy consumption and calculate the required battery size. Rogge et al. (Reference Rogge, Wollny and Sauer2015) further discussed the trade-off between passenger and battery capacity and the interdependency between charging power and battery capacity in order to electrify an existing bus network. The energy consumption in both studies is calculated under cooling condition. Jefferies et al. (Reference Jefferies, Ly, Kunith and Göhlich2015) investigated the energy consumption for heating and cooling in detail and showed that heating is the most critical condition if zero-emission operation (i.e., purely electric heating) is required.
Battery sizing is investigated in Gao et al. (Reference Gao, Lin, LaClair, Liu, Li, Birky and Ward2017). The researchers concluded that the operational requirements and the charging concept affect the battery size and design significantly. The study of Mahmoud et al. (Reference Mahmoud, Garnett, Ferguson and Kanaroglou2016) presents a review of alternative powertrains based on results of simulation models and operational data from the literature. The study is a comparative analysis of 16 performance features for electric powertrains including economic, environmental, operational, and energy efficiency aspects. The study reveals the complexity of such systems and the challenge to compare different operating methods objectively.
Generic economic assessments of electric buses can be found in Göhlich, Spangenberg & Kunith (Reference Göhlich, Spangenberg and Kunith2013), Nurhadi, Borén & Ny (Reference Nurhadi, Borén and Ny2014) and Pihlatie et al. (Reference Pihlatie, Kukkonen, Halmeaho, Karvonen and Nylund2014). The researchers analyse possible cost drivers of a line electrification and put a focus on the impact of operational constraints.
So far, only very limited research has been published which combines technology, operational and economical aspects in an integrated system approach. Rothgang et al. (Reference Rothgang, Rogge, Becker and Sauer2015) analyse the design process for electric public buses based on a standard 12 m and a 7 m battery-electric bus with focus on the battery design. The researchers also used a simple life-cycle cost model and evaluated the impact of a defined fuel cost increase and defined battery cost decrease on the overall costs per kilometre. Lajunen & Lipman (Reference Lajunen and Lipman2016) evaluate the life-cycle costs and the well-to-wheel carbon dioxide emissions of different types of city buses and different routes. However, in these studies neither additional energy for heating and air conditioning nor additional staff cost caused by electrification has been included. Uncertainties in cost development of electric bus systems were not discussed. Moreover, the strategic question of the appropriate procurement time also remains to be addressed.
This study presents a holistic design methodology for urban electric bus systems based on technical feasibility assessment and TCO (total cost of ownership) as a key performance indicator. Figure 1 visualises the proposed methodology. The design of an urban electric bus system is based on operational data and assumptions discussed in Sections 3 and 4. Our approach combines technical, operational and economical aspects based on two core models: A system simulation model explained in Section 5 and a TCO model described in Section 6.
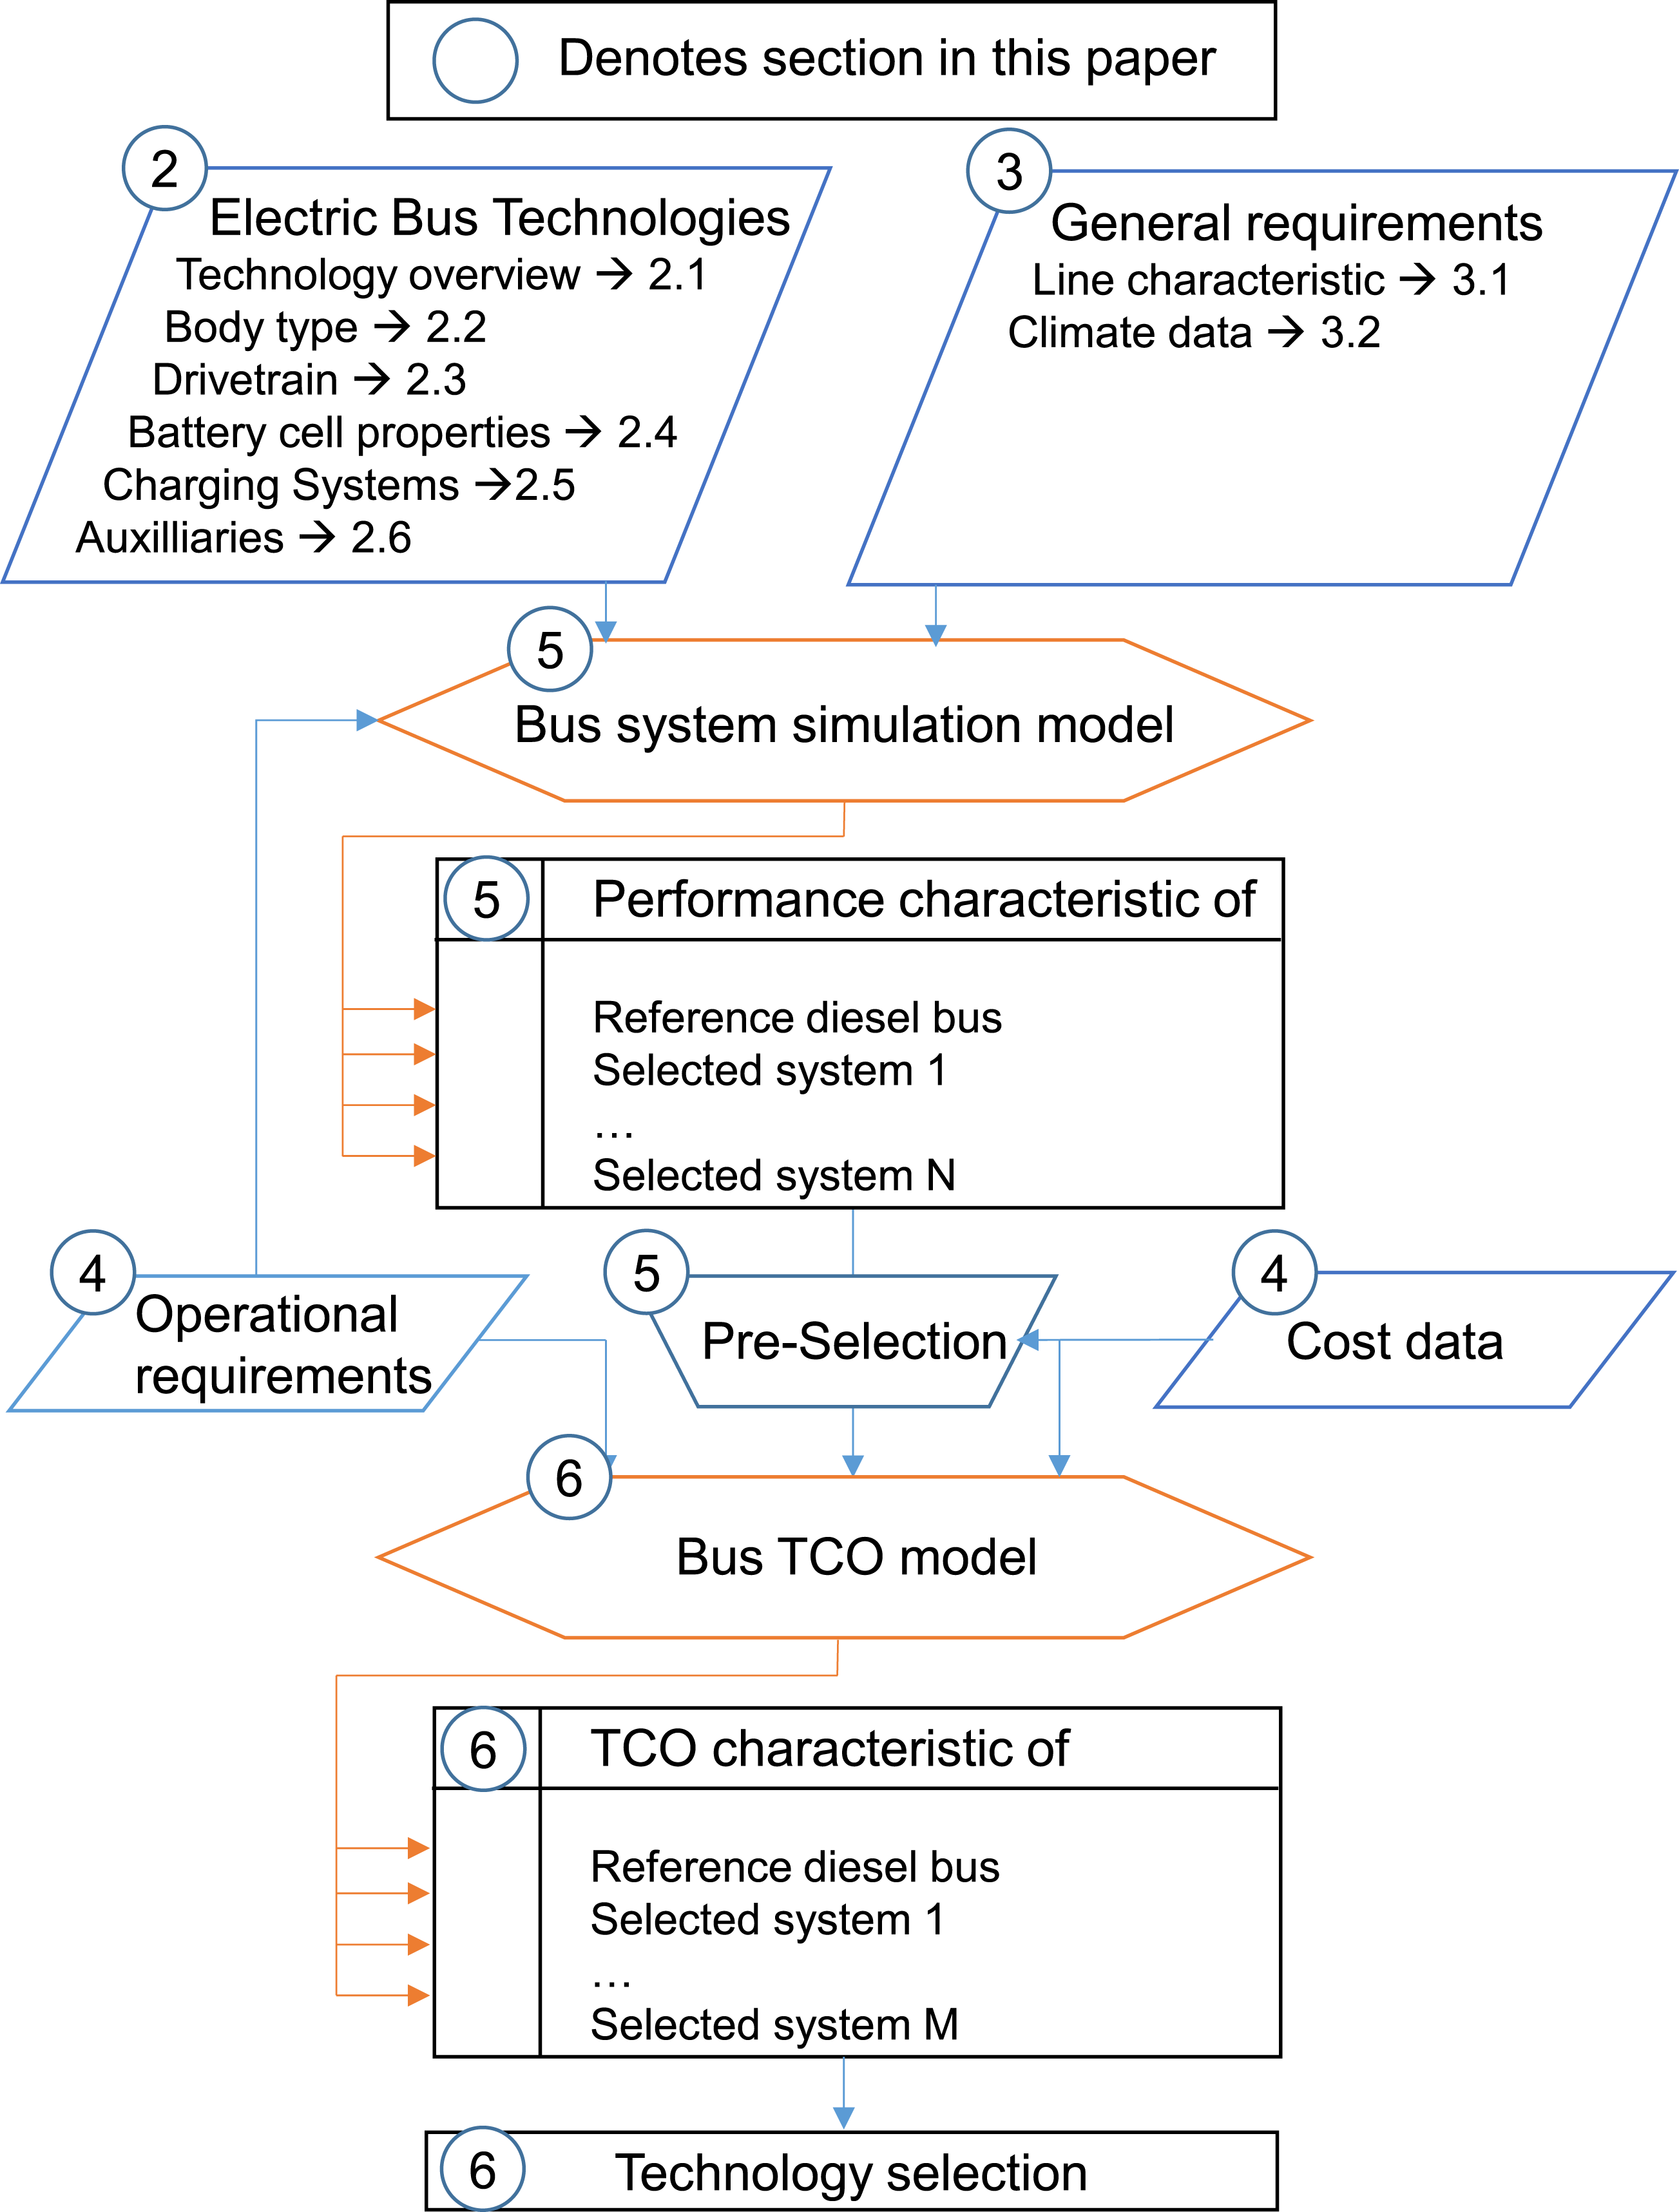
Figure 1. Holistic design methodology for electric bus technologies.
2 Urban electric bus technologies
In this section, we will give an overview of relevant components in electric bus systems and discuss the technical parameters most important for electric bus system design.
2.1 Functions and technology options
The morphological matrix method was applied to illustrate the complexity of designing an electric bus system. We derived a matrix of nine different functions with up to six options each, as shown in Figure 2. This leads to over 100,000 different system solutions which are theoretically possible.
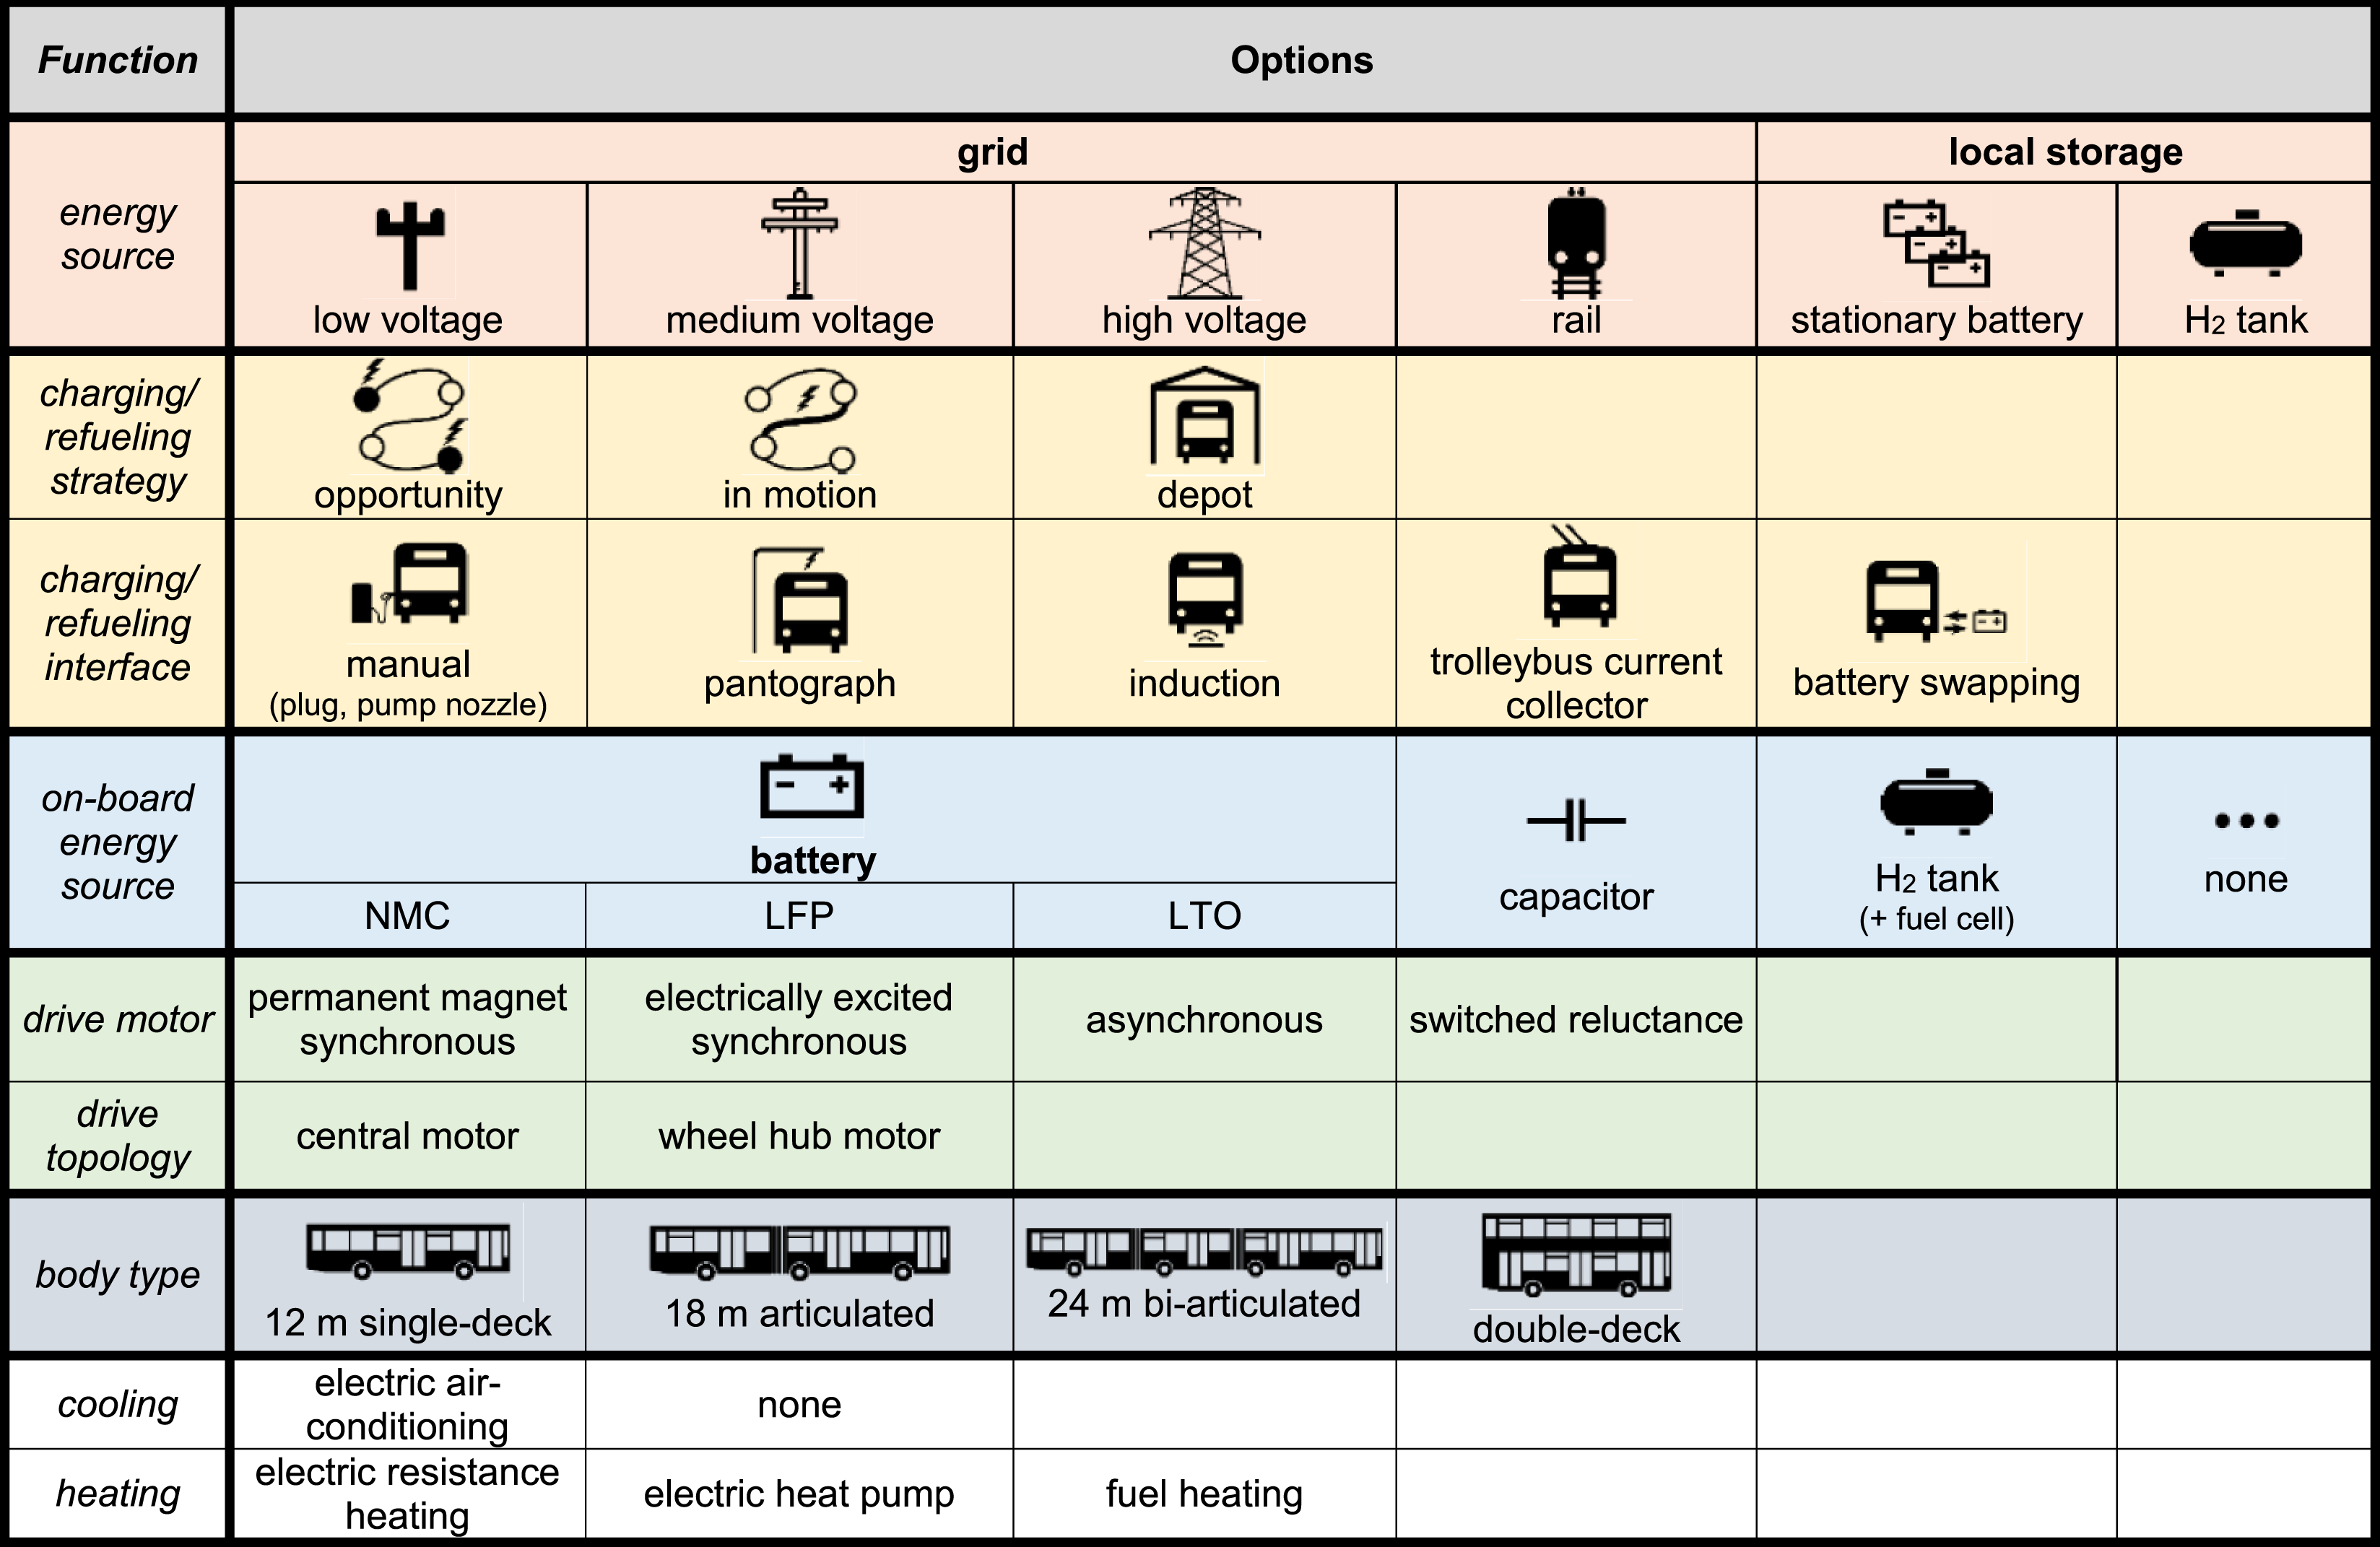
Figure 2. Morphological matrix of available technology options in electric bus systems.
For this study, we limit the system boundary to include the vehicles on the route and the necessary charging infrastructure at terminal stops and in the depot. Changes to the processes in the bus depot are not within the scope of this study.
The electric bus system has been divided into six main functions (coloured): energy source, charging/refuelling strategy and interface, on-board storage, drive motor and topology, bus type as well as cooling and heating. Here, the interaction of the charging/refuelling strategy and interface with the on-board storage will play a decisive role in the overall design. Three different strategies were identified:
∙ Opportunity charging (OC), also referred to as fast charging: the batteries are charged several times during operation, usually during dwell times at terminal stations, by automated charging systems (pantograph or induction system). The daily range is therefore theoretically unlimited and is only limited by cleaning and maintenance procedures in the depot. Since only short dwell times are available, high charging power is required.
∙ In motion charging: the roadway of the buses is partially equipped with an overhead cable, which is connected with the vehicle by means of a current collector. The batteries are charged while driving under the overhead cable, so that the energy for route segments without overhead wires can be supplied by the battery storage. The daily range is also theoretically unlimited.
∙ Depot charging (DC): the battery is only charged during the operating pause in the depot, usually with a manual plug. The maximum range of such buses is currently about 200–300 km. Depot charging is also known as overnight or slow charging.
In the case of battery-electric buses, battery charging can be physically decoupled from the vehicle by means of battery swapping stations. These feature stationary battery charging banks and an automated system to transfer battery packs between charging bank and vehicle.
The on-board storage can be realised through four different options, in which a combination of several options is also possible: battery, super capacitor, hydrogen fuel tank or none, which is only possible with a continuous energy supply via overhead wires.
The proposed method is applicable to all technologies but within the scope of this article, we assumed that a (local) zero-emission operation is sought. Therefore, only the pure electric drive is taken into account and hybrid options have been excluded. Furthermore, battery swapping and trolley bus systems are not included in this study because battery-electric bus projects in recent years have been focused nearly exclusively on depot and opportunity charging (ZeEUS Project 2016). Also, fuel cell bus systems are excluded because the expenditures for fuel cell buses, including the necessary hydrogen infrastructure, have been shown to be significantly higher than for battery-electric buses. The studies FCH JU (2012) and Roland (Reference Roland2015) predict an approximate cost parity for fuel cell and conventional diesel buses not before the year 2030; whereas, battery-electric buses are promising to achieve cost savings considerably earlier in time.
But even with this reduced number of options we still face the need for a methodical identification of a ‘most suitable system solution’ under given strategic and operational requirements.
2.2 Vehicle body and passenger capacity
Electric buses are based on the same vehicle bodies as diesel buses. Table 1 lists typical body types used in metropolitan bus services.
Table 1. Overview of common urban bus body types. Typical empty weight refers to conventional diesel buses. Sources: MAN Nutzfahrzeuge Gruppe (2008), Berliner Verkehrsbetriebe AöR (2013, 2016), European Union (2015) and Omnibus Revue (2017)

Our market surveys have shown that currently, the market for battery buses is dominated by standard 12 m buses and 18 m articulated buses. Fully electric double-decker buses are still at the prototype stage. 25 m bi-articulated buses are currently only encountered in the form of trolley buses.
Table 1 also specifies the respective gross vehicle weight (GVW) permitted by EU regulations, typical empty masses and the resulting payload and passenger capacity.Footnote 2 Although the empty weight is taken from datasheets for diesel buses, it can still serve as a valid basis for electric bus system design because the empty mass of diesel buses and electric buses excluding traction batteries and charging equipment can be assumed to be roughly equal. We have verified this for a 12 m vehicle based on confidential manufacturers’ data.
The weight of an electric bus battery can be on the order of several tons, giving rise to an apparent conflict between battery capacity and passenger capacity. However, it is reasonable to assume that the practical maximum passenger capacity is not limited by payload, but rather by the floor space available to standees. The standee density achieved at full payload represents extreme crush-loading levels that, arguably, do not reflect realistic operating conditions.Footnote
3
Designing the vehicle for a passenger capacity determined by floor space leaves ample weight reserve for traction batteries even under crowded conditions, as Figure 3 illustrates for a 12 m bus. In this example, even assuming a passenger density of
![]() $8/\text{m}^{2}$
, a battery weighing close to 1.3 tons could be added without exceeding the GVW of 19.5 tons.
$8/\text{m}^{2}$
, a battery weighing close to 1.3 tons could be added without exceeding the GVW of 19.5 tons.

Figure 3. Passenger capacity of a 12 m bus by GVW as a function of added battery weight, and passenger capacity.
2.3 Powertrain
A typical electric bus powertrain configuration consists of an energy source (e.g., battery), a single traction motor with controller and a final drive differential gearbox. Alternative configurations are two traction motors with reduction gears near the wheels or two to four in wheel motors (Lajunen Reference Lajunen2014). These configurations with multiple traction motors can use a simple torque splitting or a specific driving and regenerative braking regulation design can be used to optimise the vehicle efficiency, as shown in Zhang & Goehlich (Reference Zhang and Goehlich2016).
According to the ZeEUS Project (2016) the majority of bus suppliers (
![]() $20/26$
) have single traction central motors using asynchronous motor (ASM) or permanent magnet synchronous motor (PSM). The power peak ranges from 100 kW to 480 kW for 8 m–24 m buses.
$20/26$
) have single traction central motors using asynchronous motor (ASM) or permanent magnet synchronous motor (PSM). The power peak ranges from 100 kW to 480 kW for 8 m–24 m buses.
For the system design, the crucial information is the characteristic of the powertrain. Figure 4 shows typical efficiency maps of a PSM and an ASM including the efficiency of the inverter (Inv.). In general, synchronous motors have high efficiency at low motor speed and high torque, whereas the asynchronous machine is more efficient at high speed and low torque.
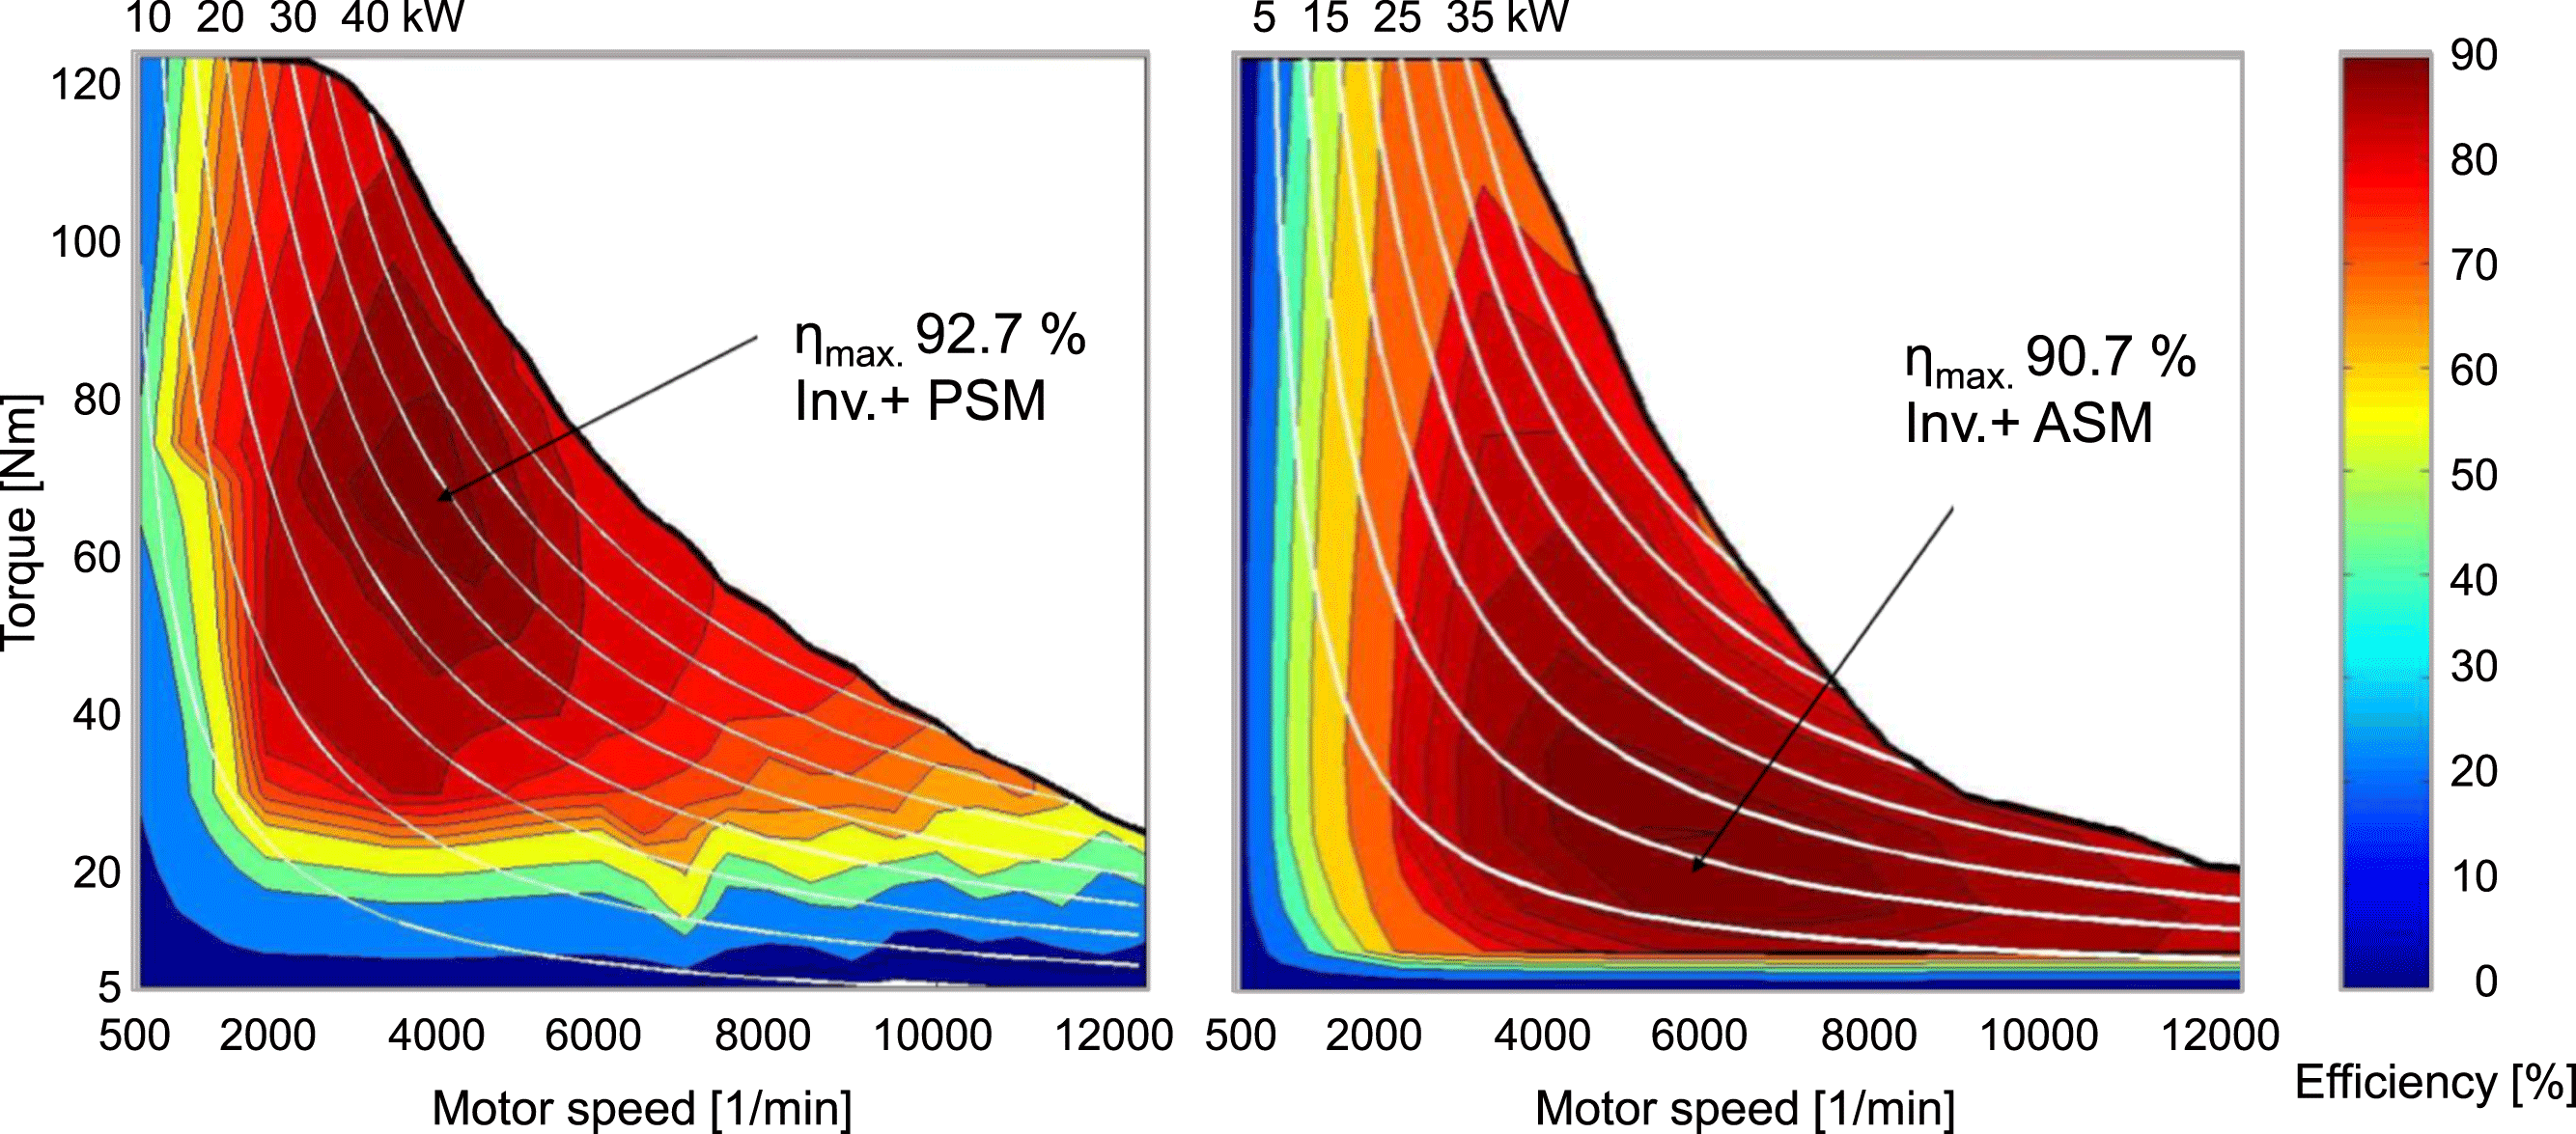
Figure 4. Typical efficiency maps of synchronous (PSM) and asynchronous motor (ASM) (Neudorfer Reference Neudorfer2016).
Currently, both types can be found in bus systems, because in actual system design, packaging, motor control and cost are further parameters that need to be examined. Permanent magnet synchronous motors have advantages in mass and have higher efficiencies in the nominal operating point, but are more costly due to permanent magnets and manufacturing issues (Neudorfer Reference Neudorfer2016).
2.4 Battery system
While nearly all modern electric vehicles feature some form of lithium-based battery (Thielmann et al. Reference Thielmann, Neef, Hettesheimer, Döscher, Wietschel and Tübke2017), various cell chemistries exist whose technical parameters differ significantly. The most important characteristics of a specific cell type with regard to electric bus operations are energy density, charge rate and cycle life.
Currently, lithium iron phosphate (LFP), lithium titanium oxide (LTO) and lithium nickel manganese cobalt oxide (NMC) are the most common cell types encountered in electric buses, as our surveys of electric bus projects indicate. Table 2 shows typical parameters for these cell types from catalogue data. For the sake of comparability, only pouch-type cells are considered. Figure 5 indicates calculated values for charge current and charge power per cell type, using the mean values from Table 2.

Figure 5. Cell charge current and cell charging power for different cell types.
Table 2. Comparison of LFP, LTO and NMC pouch-type battery cells. Sources: Datasheets from EIG, European Batteries, Altairnano, Kokam, Leclanche

To compare these cell types for e-bus applications, we will assume a 12 m bus designed for a maximum standee density of
![]() $4/\text{m}^{2}$
(see Figure 3) which leaves about 3400 kg excess payload for the battery system. Furthermore, we assume the battery system, including electronics and cooling equipment, to have an energy density 0.6 times the energy density at cell level (calculated from catalogue data). Using the mean values from Table 2, the vehicle’s battery capacity and maximum continuous charging powerFootnote
4
can be determined, shown in Figure 6.
$4/\text{m}^{2}$
(see Figure 3) which leaves about 3400 kg excess payload for the battery system. Furthermore, we assume the battery system, including electronics and cooling equipment, to have an energy density 0.6 times the energy density at cell level (calculated from catalogue data). Using the mean values from Table 2, the vehicle’s battery capacity and maximum continuous charging powerFootnote
4
can be determined, shown in Figure 6.

Figure 6. Battery capacity and maximum continuous charging power for a 3400 kg battery system with different cell types.
Figures 5 and 6 give an indication as to the potential use cases for each cell type. LTO permits the highest charging power of all technologies, however, owing to its comparatively low energy density, it has the lowest capacity. LTO is only applicable in opportunity-charging systems. NMC enables the largest capacity as well as high charging power and therefore lends itself both to OC and DC. LFP is only feasible in slow-charging situations like DC.
In actual system design, battery cost and cycle life have to be considered also. Cycle life is a function of the depth of discharge (DoD) per cycle: Deep cycles cause more battery wear than shallow cycles (Korthauer Reference Korthauer2013). This is why, in opportunity-charging vehicles, a narrow DoD window is chosen (e.g., 40%), compared to 85%–90% for depot-charging vehicles.Footnote 5
2.5 Charging systems
2.5.1 Charging interfaces
Various charging concepts are available for electric buses as described in the introduction. Depending on the charging concept, different interfaces are used for energy transfer, the most common of which are listed in Table 3.
Table 3. Overview of vehicle charging interfaces

In stationary opportunity-charging systems, there is currently a coexistence of several non-interoperable, automated charging interfaces. Conductive systems feature a pantograph that is either mounted on the roof of the vehicle or on a wayside pole (the latter also being referred to as an inverted pantograph). Inductive systems feature a coil beneath the road surface and a matching coil on the underside of the vehicle to enable wireless energy transfer; here, also, several incompatible solutions exist, e.g., systems with a fixed or shifting vehicle-side coil (Bombardier Transportation 2015; IPT Technology GmbH (IPT) 2016). To increase interoperability, the EU has instructed its standardisation agencies to develop a European standard for conductive charging interfaces by the end of 2019 and for inductive charging interfaces by the end of 2018 (European Commission 2015).
Depot-charging vehicles in Europe are usually equipped with an IEC 62196 based, manual plug interface (CCS, combined charging system). Opportunity-charging buses generally also feature this interface not only to recharge the battery, but also to ensure thermal conditioning of the battery while parked in the depot.
2.5.2 Grid connection
Connection of charging infrastructure to the electricity grid is highly dependent on local circumstances. For example, depending on charging power and local grid capacity, individual opportunity-charging stations may be connected directly to the low-voltage grid (400 V), or they may have a dedicated transformer substation connected to the medium-voltage grid (10–20 kV). An energy storage unit (batteries or capacitors) can be implemented within the charging station to reduce peak load (Prenaj Reference Prenaj2014). If charging stations are placed in proximity of existing tram infrastructure, it is possible to tap the tram’s DC network without the need for additional transformer stations (Overkamp Reference Overkamp2015). Electric bus depots usually require a dedicated substation connected to the medium-voltage grid; large depots (
![]() ${>}200$
vehicles) may even need a high-voltage grid connection (60–132 kV) with a distribution station (Crastan Reference Crastan2012; Lang Reference Lang2017).
${>}200$
vehicles) may even need a high-voltage grid connection (60–132 kV) with a distribution station (Crastan Reference Crastan2012; Lang Reference Lang2017).
2.6 Auxiliaries
The auxiliary power demand is governed by the heating, ventilation and air-conditioning (HVAC) system and other auxiliaries.
2.6.1 HVAC system
The HVAC system is the most energy-consuming auxiliary in an electric vehicle (Braess & Seiffert Reference Braess and Seiffert2013) and therefore must be given special attention in electric bus system design. Air conditioning of city buses is regarded by operators as an essential means to improve the service experience for customers (Verband Deutscher Verkehrsunternehmen (VDV) 2015). Current bus fleets in Europe are, indeed, mostly fully air-conditioned.Footnote 6
A typical (diesel) city bus HVAC system includes a rooftop air-conditioning unit and floor-level convectors for heat distribution (Figure 7). The rooftop unit comprises a compression refrigeration machine and several heat exchangers for air cooling and heating. Water pipes link the rooftop unit and the floor-level convectors to the IC engine’s cooling water circuit which is used as a primary heat source. An auxiliary diesel fuel heater mounted in the rear of the vehicle, not depicted in Figure 7, can supply additional heat to the water circuit.
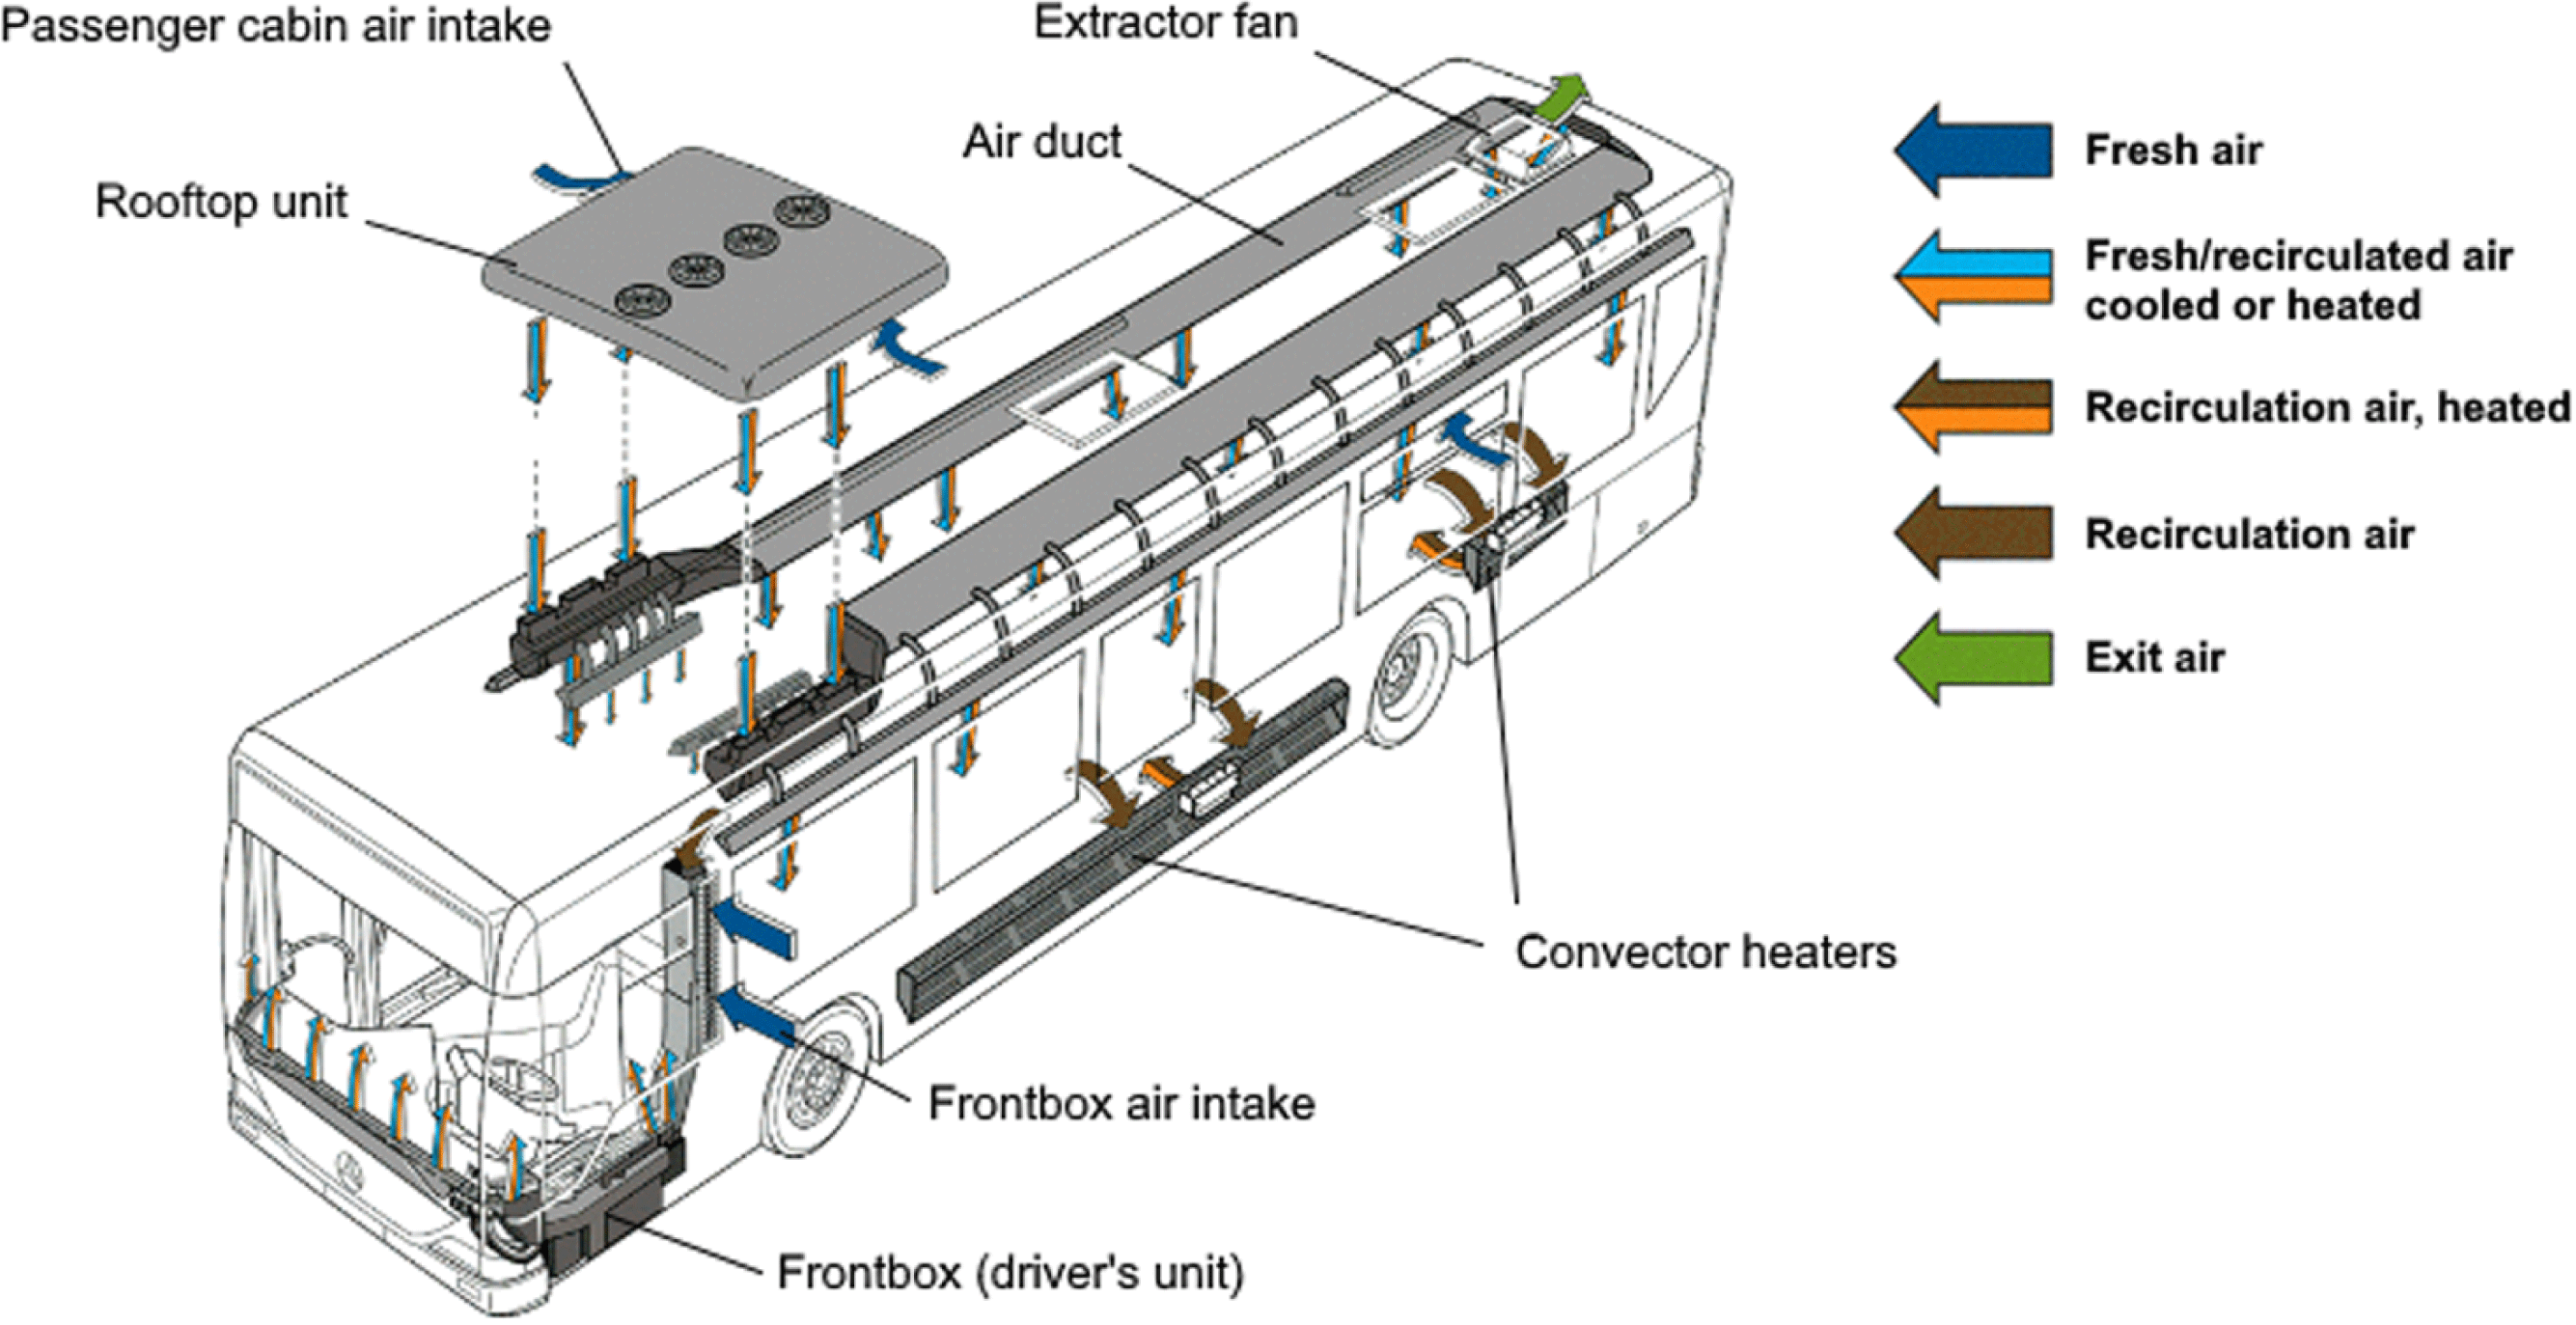
Figure 7. Typical city bus HVAC system. Reproduced and modified with kind permission from Evobus GmbH.
HVAC systems currently implemented in electric buses mostly derive from this design and employ either the same diesel fuel heaters found in conventional buses (therefore not qualifying as fully zero-emission vehicles) or compatible electric resistance heaters. Cooling is also typically delivered by rooftop units.
Energy demand for resistance heating can, at worst, nearly triple the vehicle energy consumption, as a simple calculation shows. From our measurements on a 12 m electric bus, we estimate the average electric power necessary to keep the cabin at
![]() $17\,^{\circ }\text{C}$
on a cold winter day with
$17\,^{\circ }\text{C}$
on a cold winter day with
![]() $-10\,^{\circ }\text{C}$
ambient temperature (as illustrated in Figure 10) to be around 24 kW. Assuming a specific energy demand for traction and non-HVAC auxiliaries of 1.2 kWh
$-10\,^{\circ }\text{C}$
ambient temperature (as illustrated in Figure 10) to be around 24 kW. Assuming a specific energy demand for traction and non-HVAC auxiliaries of 1.2 kWh
![]() $/$
km – a plausible value according to our measurements – a constant 24 kW load for heating will increase vehicle consumption by 1.3 kWh
$/$
km – a plausible value according to our measurements – a constant 24 kW load for heating will increase vehicle consumption by 1.3 kWh
![]() $/$
km for an average velocity of 18 km
$/$
km for an average velocity of 18 km
![]() $/$
h (SORT 2) and 2 kWh
$/$
h (SORT 2) and 2 kWh
![]() $/$
km for an average velocity of 12 km
$/$
km for an average velocity of 12 km
![]() $/$
h (SORT 1).Footnote
7
In comparison, cooling the vehicle in summer at an outdoor temperature of
$/$
h (SORT 1).Footnote
7
In comparison, cooling the vehicle in summer at an outdoor temperature of
![]() $35\,^{\circ }\text{C}$
with a typical 24 kW
$35\,^{\circ }\text{C}$
with a typical 24 kW
![]() $_{\text{th}}$
chiller (Konvekta Reference Konvekta2016) running at full load with a COP of 1.9 (calculated from catalogue data) will cause a compressor power demand of around 12.5 kW, leading to an increase in specific consumption of 0, 7 kWh
$_{\text{th}}$
chiller (Konvekta Reference Konvekta2016) running at full load with a COP of 1.9 (calculated from catalogue data) will cause a compressor power demand of around 12.5 kW, leading to an increase in specific consumption of 0, 7 kWh
![]() $/$
km for 18 km
$/$
km for 18 km
![]() $/$
h and 1, 0 kWh
$/$
h and 1, 0 kWh
![]() $/$
km for 12 km
$/$
km for 12 km
![]() $/$
h. The critical design case in Central European climates is, therefore, the heating case.
$/$
h. The critical design case in Central European climates is, therefore, the heating case.
Alternative HVAC designs primarily focus on reducing the heating energy demand. Electric heat pump (HP) systems comprise a reversible compression refrigeration circuit that enables both heating and cooling through the same device, while providing a more efficient heat supply than resistance heating (American Society of Heating, Refrigerating and Air-Conditioning Engineers (ASHRAE) 2000). Some models allow for heat recovery from the traction battery, further increasing system efficiency (see, e.g., Ingersoll-Rand Company 2016). However, the capacity of a heat pump drops with ambient temperature, mandating the need for an electric or fuel-fired backup heater at low ambient temperatures (American Society of Heating, Refrigerating and Air-Conditioning Engineers (ASHRAE) 2000). Based on catalogue data (Ingersoll-Rand Company 2016) and the above figures, the heating capacity deficit at
![]() $-10\,^{\circ }\text{C}$
is estimated to be least 12 kW for a 12 m bus. Due to a lack of experimental data, we cannot validate this value at present.
$-10\,^{\circ }\text{C}$
is estimated to be least 12 kW for a 12 m bus. Due to a lack of experimental data, we cannot validate this value at present.

Figure 8. Cumulative distributions showing the length and duration of vehicle schedules, the length of passenger trips and the dwell time after passenger trips; correlation of dwell time and trip length. 39 routes of an urban bus network were analysed, covering 469 vehicle schedules and 8545 passenger trips. Empty trips were not considered.
Aside from efficient HVAC systems, electric buses offer potential for demand-side optimisation. Possible measures include improved thermal insulation, double-glazed windows (as known from long-distance coaches), door air curtains and improved control systems (Jefferies et al. Reference Jefferies, Ly, Kunith and Göhlich2015). However, experimental data assessing the effectiveness of these measures is, thus far, unavailable to the research community.
2.6.2 Other auxiliaries
Besides the HVAC system, there are other auxiliaries like battery cooling, air compressor, steering pump and lights. According to our measurements on a 12 m electric bus, the power demand of the high-voltage auxiliaries is lower compared to the HVAC system: Air compressor max. 5 kW and steering pump max. 2.75 kW. Both systems are only infrequently in operation. The battery cooling unit (4 kW
![]() $_{\text{th}}$
) was found to have a maximum electric power of 2.75 kW and to be in constant operation on hot summer days. Furthermore, a 500 W battery heater is operational on cold days.
$_{\text{th}}$
) was found to have a maximum electric power of 2.75 kW and to be in constant operation on hot summer days. Furthermore, a 500 W battery heater is operational on cold days.
3 General requirements
A holistic electric bus system design first needs to analyse the requirements of an urban bus system. This includes the daily operation range, distance of trips, driving pattern and idle time at end stops.
Depending on the charging technology used, deployment of electric buses may be limited by schedule length (i.e., the distance covered by a vehicle before it returns to the depot) or by a combination of individual trip length and subsequent dwell time. An investigation carried out for a sub-network of a public transit operator reveals the typical range and distribution of these parameters encountered in metropolitan areas (Figure 8). In particular,
∙ 95% of all vehicle schedules cover a distance shorter than or equal to 330 km, while the maximum distance observed was 407 km; also, 95% of vehicle schedules operate for 20.4 h or less, the maximum schedule duration observed being 24.7 h.
∙ 95% of all passenger trips are shorter than or equal to 20.6 km, the longest being 23.3 km.
∙ Dwell times – serving the purpose of driver recreation and compensating for service delays – vary considerably between zero and 45 min while not correlating with trip length; nearly 9% of all trips are followed by zero dwell time before commencing the next trip. This occurs especially at early morning or late night hours with low service delays, or if the next trip is a non-passenger trip (i.e., the vehicle is transferred to a depot or to another route).
3.1 Line characteristic
In addition, energy consumption per trip is a major design factor, influenced by the driving pattern, the topology, the climate conditions and the payload.
The UITP defines three synthetic driving patterns (standardised on-road test cycles – SORT) reflecting heavy urban (SORT 1, 12 km
![]() $/$
h), easy urban (SORT 2, 18 km
$/$
h), easy urban (SORT 2, 18 km
![]() $/$
h) and suburban (SORT 3, 25 km
$/$
h) and suburban (SORT 3, 25 km
![]() $/$
h) conditions (Union Internationale des Transports Publics (UITP) 2009). The cycles are designed for on-road energy consumption measurement and are comparable to the new European drive cycle (NEDC) for passenger cars. Additionally, driving cycles have been compiled from measured velocity profiles for dynamometer testing. These real driving cycles can also be used to approximate the energy consumption on actual bus lines through simulation without the need for velocity profile measurements. However, a flat topology is assumed. Table 4 summarises the specifications of common chassis dynamometer driving cycles with realistic urban drive patterns for buses including their frequent stops. These cycles are the New York bus cycle (NYBus), the ADEME RATP cycle (ADEME), the Manhattan bus cycle (MAN), the Braunschweig cycle (BRA) and the Orange County Cycle (OCC). For the following study, the heavy urban Manhattan bus cycle, shown in Figure 9, has been selected.
$/$
h) conditions (Union Internationale des Transports Publics (UITP) 2009). The cycles are designed for on-road energy consumption measurement and are comparable to the new European drive cycle (NEDC) for passenger cars. Additionally, driving cycles have been compiled from measured velocity profiles for dynamometer testing. These real driving cycles can also be used to approximate the energy consumption on actual bus lines through simulation without the need for velocity profile measurements. However, a flat topology is assumed. Table 4 summarises the specifications of common chassis dynamometer driving cycles with realistic urban drive patterns for buses including their frequent stops. These cycles are the New York bus cycle (NYBus), the ADEME RATP cycle (ADEME), the Manhattan bus cycle (MAN), the Braunschweig cycle (BRA) and the Orange County Cycle (OCC). For the following study, the heavy urban Manhattan bus cycle, shown in Figure 9, has been selected.

Figure 9. Speed and acceleration Manhattan bus cycle.
Table 4. Overview of chassis dynamometer driving cycles for buses with realistic urban drive patterns (Giakoumis Reference Giakoumis2017)

3.2 Climate data
The Association of German Transport Companies (VDV) has defined a standard for air-conditioned buses that requires the passenger cabin of a city bus to be kept within the temperature limits illustrated in Figure 10.
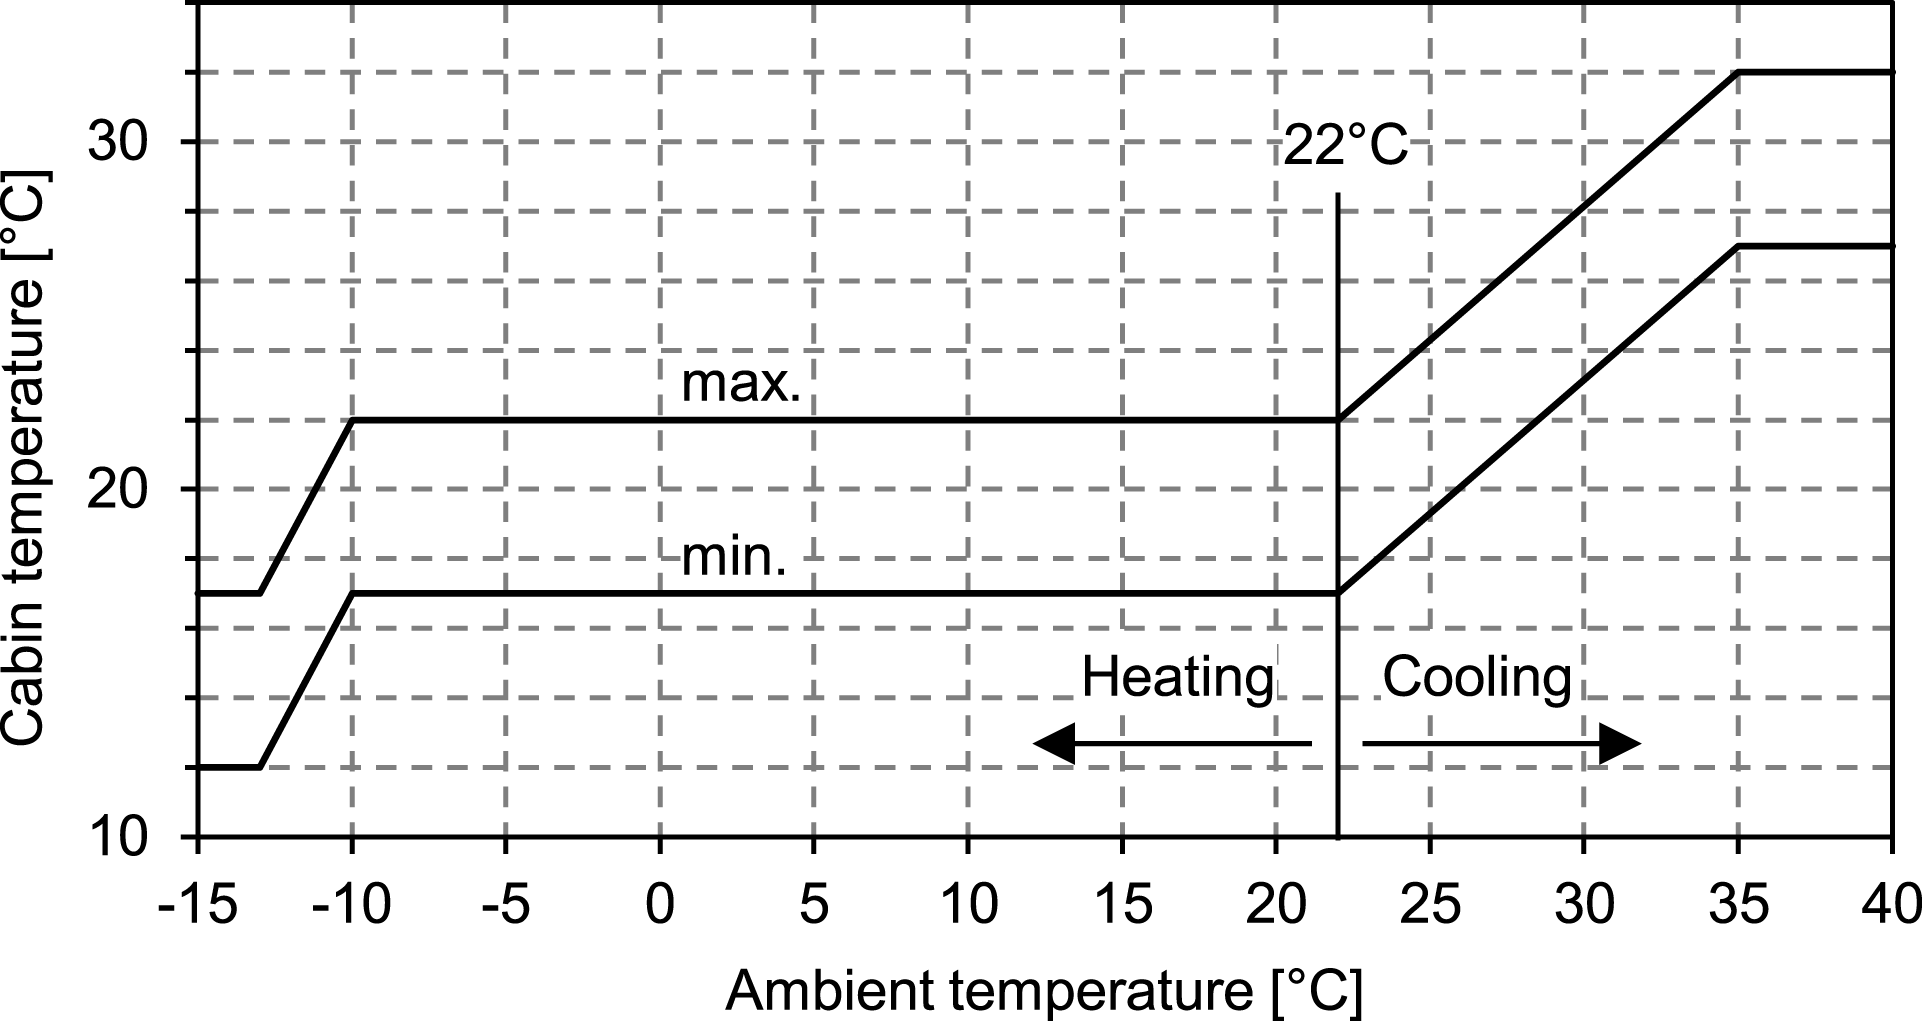
Figure 10. Required cabin temperature range as a function of ambient temperature according to Verband Deutscher Verkehrsunternehmen (VDV) 2015.
The HVAC system must operate under a wide range of outdoor temperatures, as Figure 11 shows for the example of Berlin.
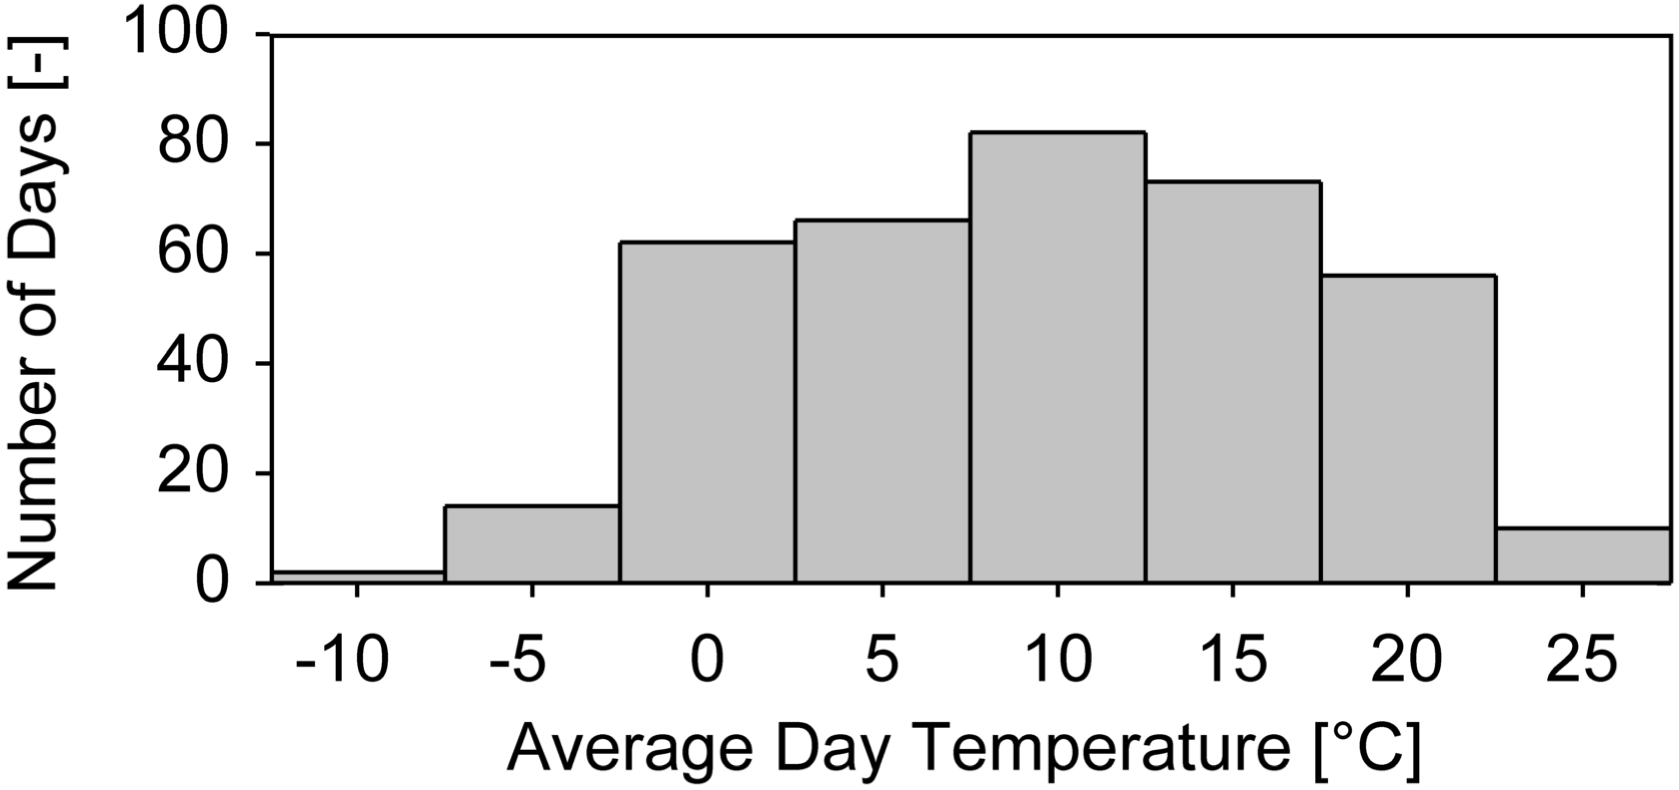
Figure 11. Long-term average yearly temperature distribution for Berlin, generated from Bundesinstitut für Bau-, Stadt- und Raumforschung (2013).
4 Operational requirements and cost data
4.1 Operational assumptions
For a holistic electric bus system design we first need to define the operational conditions. In this study we assume a short bus line that is two times the Manhattan cycle with an overall length of 6.65 km and a dwell time of 10 min. Exemplarily, a 12 m single-deck bus is considered. The passenger occupancy is set to 20% (Verband Deutscher Verkehrsunternehmen (VDV) 2016). The power of auxiliaries in winter is set to maximum 24 kW, while the average auxiliary power is 8 kW (see Section 2.6.1). The battery capacity has to be chosen such that in winter conditions (scenario 1 in Table 5), the bus can be driven from terminus to terminus. Furthermore, we stipulate that in average conditions the unavailability of one charging station should not affect the normal operation service, hence the vehicle range must be sufficient to cover two trips from terminus to terminus (i.e., one round trip, scenario 2 in Table 5).
4.2 Cost data
Cost data for the economical assessment, shown in Tables 6 and 7, has been derived from extensive literature review and interviews with experts from European manufacturers (Kunith Reference Kunith2017).
5 Electric bus system simulation model
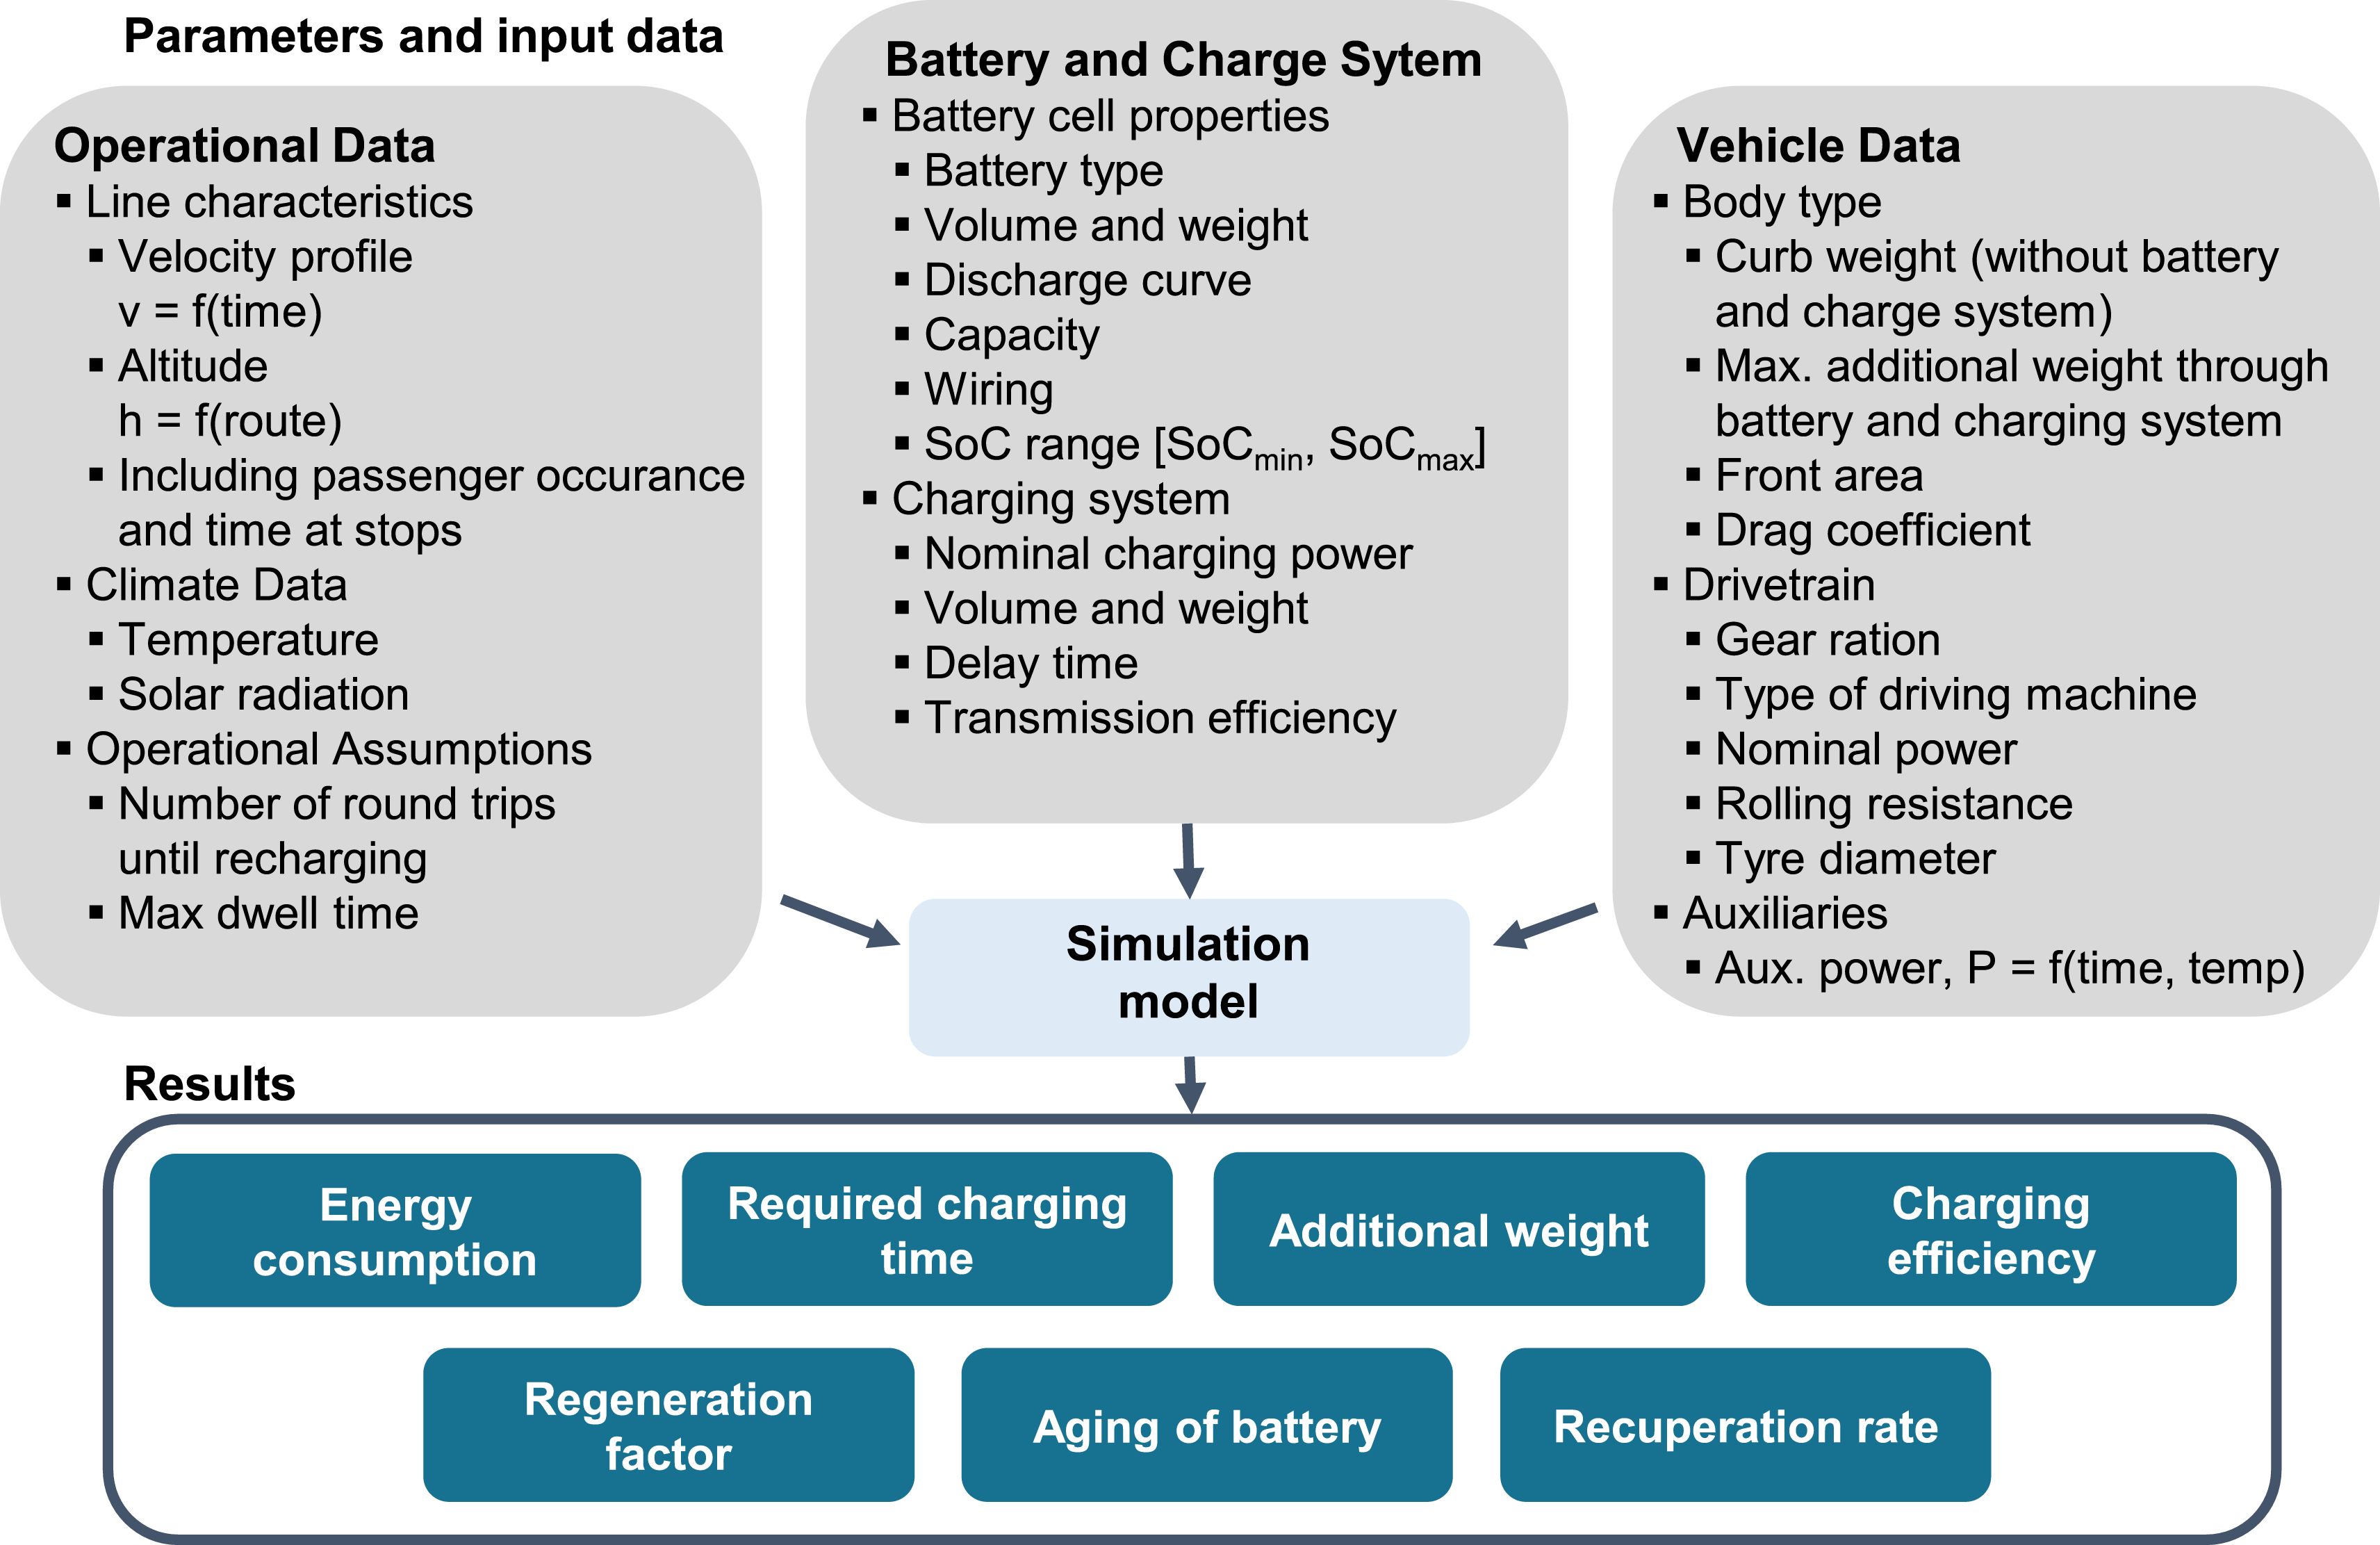
After defining the requirements of urban buses and depicting the different characteristics of electric bus systems, the following section focuses on the technical assessment of urban bus systems based on a modular bus system simulation model. This model can be used to design a suitable battery system with a given SoC window, and an appropriate charging system for a certain bus line. Design parameters can be determined by taking into account bus schedules and weather conditions. In the following, the vehicle simulation model with its sub-models is presented. The exhaustive description of the sub-models and their respective application can be found in Göhlich, Kunith & Ly (Reference Göhlich, Kunith, Ly, Brebbia and Longhurst2014), Jefferies et al. (Reference Jefferies, Ly, Kunith and Göhlich2015) and Ly, Göhlich & Heide (Reference Ly, Göhlich and Heide2016). In Figure 12 the input and output data for the bus system simulation are shown.

Figure 12. Input and output data for bus system simulation.
5.1 Model description
In order to determine design parameters, an appropriate simulation model has been developed.
The parameters are examined for specific bus systems under specific operational conditions. Therefore, the input data covers operational data, as described in Section 4.1, vehicle data, battery cell properties and charging system data.
The traction energy consumption is dependent on the sum of resistance forces
![]() $F_{\text{res}}$
, shown in Equation (1).
$F_{\text{res}}$
, shown in Equation (1).
In Equation (1), the mass
![]() $m$
contains the bus kerb weight and the payload with the additional weight of charging system, battery system and passengers.
$m$
contains the bus kerb weight and the payload with the additional weight of charging system, battery system and passengers.
![]() $\unicode[STIX]{x1D706}_{m}$
is the mass factor and takes rotational masses into account. The vehicle speed
$\unicode[STIX]{x1D706}_{m}$
is the mass factor and takes rotational masses into account. The vehicle speed
![]() $v$
is given by the driving cycle, e.g., the Manhattan bus cycle in Figure 8.
$v$
is given by the driving cycle, e.g., the Manhattan bus cycle in Figure 8.
![]() $g$
is the gravity,
$g$
is the gravity,
![]() $f_{R}$
is the rolling resistance,
$f_{R}$
is the rolling resistance,
![]() $\unicode[STIX]{x1D6FC}$
is the grade of the road,
$\unicode[STIX]{x1D6FC}$
is the grade of the road,
![]() $\unicode[STIX]{x1D70C}_{L}$
is the air density,
$\unicode[STIX]{x1D70C}_{L}$
is the air density,
![]() $c_{W}$
is the drag coefficient and
$c_{W}$
is the drag coefficient and
![]() $A$
is the front area of the bus.
$A$
is the front area of the bus.
With the resistance forces, the motor characteristic (
![]() $\unicode[STIX]{x1D702}_{\text{drive}}$
determined from efficiency map in Section 2.3) and the auxiliary power demand
$\unicode[STIX]{x1D702}_{\text{drive}}$
determined from efficiency map in Section 2.3) and the auxiliary power demand
![]() $P_{\text{aux}}$
, it is possible to determine the total required battery power
$P_{\text{aux}}$
, it is possible to determine the total required battery power
![]() $P_{\text{total}}$
:
$P_{\text{total}}$
:
Auxiliary power demand is chiefly dependent on the electric power of the HVAC system
![]() $P_{\text{HVAC}}$
; contributions by other components (see Section 2.6.2) are summarised in
$P_{\text{HVAC}}$
; contributions by other components (see Section 2.6.2) are summarised in
![]() $P_{\text{others}}$
:
$P_{\text{others}}$
:
![]() $P_{\text{HVAC}}$
is determined by an HVAC system model coupled to a thermal model of the passenger cabin, as depicted in Figure 13. It results from the net total heating or cooling load and the efficiency of the HVAC system. Various HVAC systems are considered, including electric resistance heater, compression heat pump, diesel fuel heater and compression refrigeration unit. In the case of resistance and diesel heaters, constant efficiencies from manufacturer datasheets are assumed; for heat pumps and refrigeration units, a variable efficiency is calculated from a refrigerant circuit model parameterised using manufacturers’ data. The passenger cabin model includes convective and radiation heat exchange with the environment, inner thermal loads and air exchange through open doors (Göhlich et al.
Reference Göhlich, Ly, Kunith and Jefferies2015; Jefferies et al.
Reference Jefferies, Ly, Kunith and Göhlich2015).
$P_{\text{HVAC}}$
is determined by an HVAC system model coupled to a thermal model of the passenger cabin, as depicted in Figure 13. It results from the net total heating or cooling load and the efficiency of the HVAC system. Various HVAC systems are considered, including electric resistance heater, compression heat pump, diesel fuel heater and compression refrigeration unit. In the case of resistance and diesel heaters, constant efficiencies from manufacturer datasheets are assumed; for heat pumps and refrigeration units, a variable efficiency is calculated from a refrigerant circuit model parameterised using manufacturers’ data. The passenger cabin model includes convective and radiation heat exchange with the environment, inner thermal loads and air exchange through open doors (Göhlich et al.
Reference Göhlich, Ly, Kunith and Jefferies2015; Jefferies et al.
Reference Jefferies, Ly, Kunith and Göhlich2015).
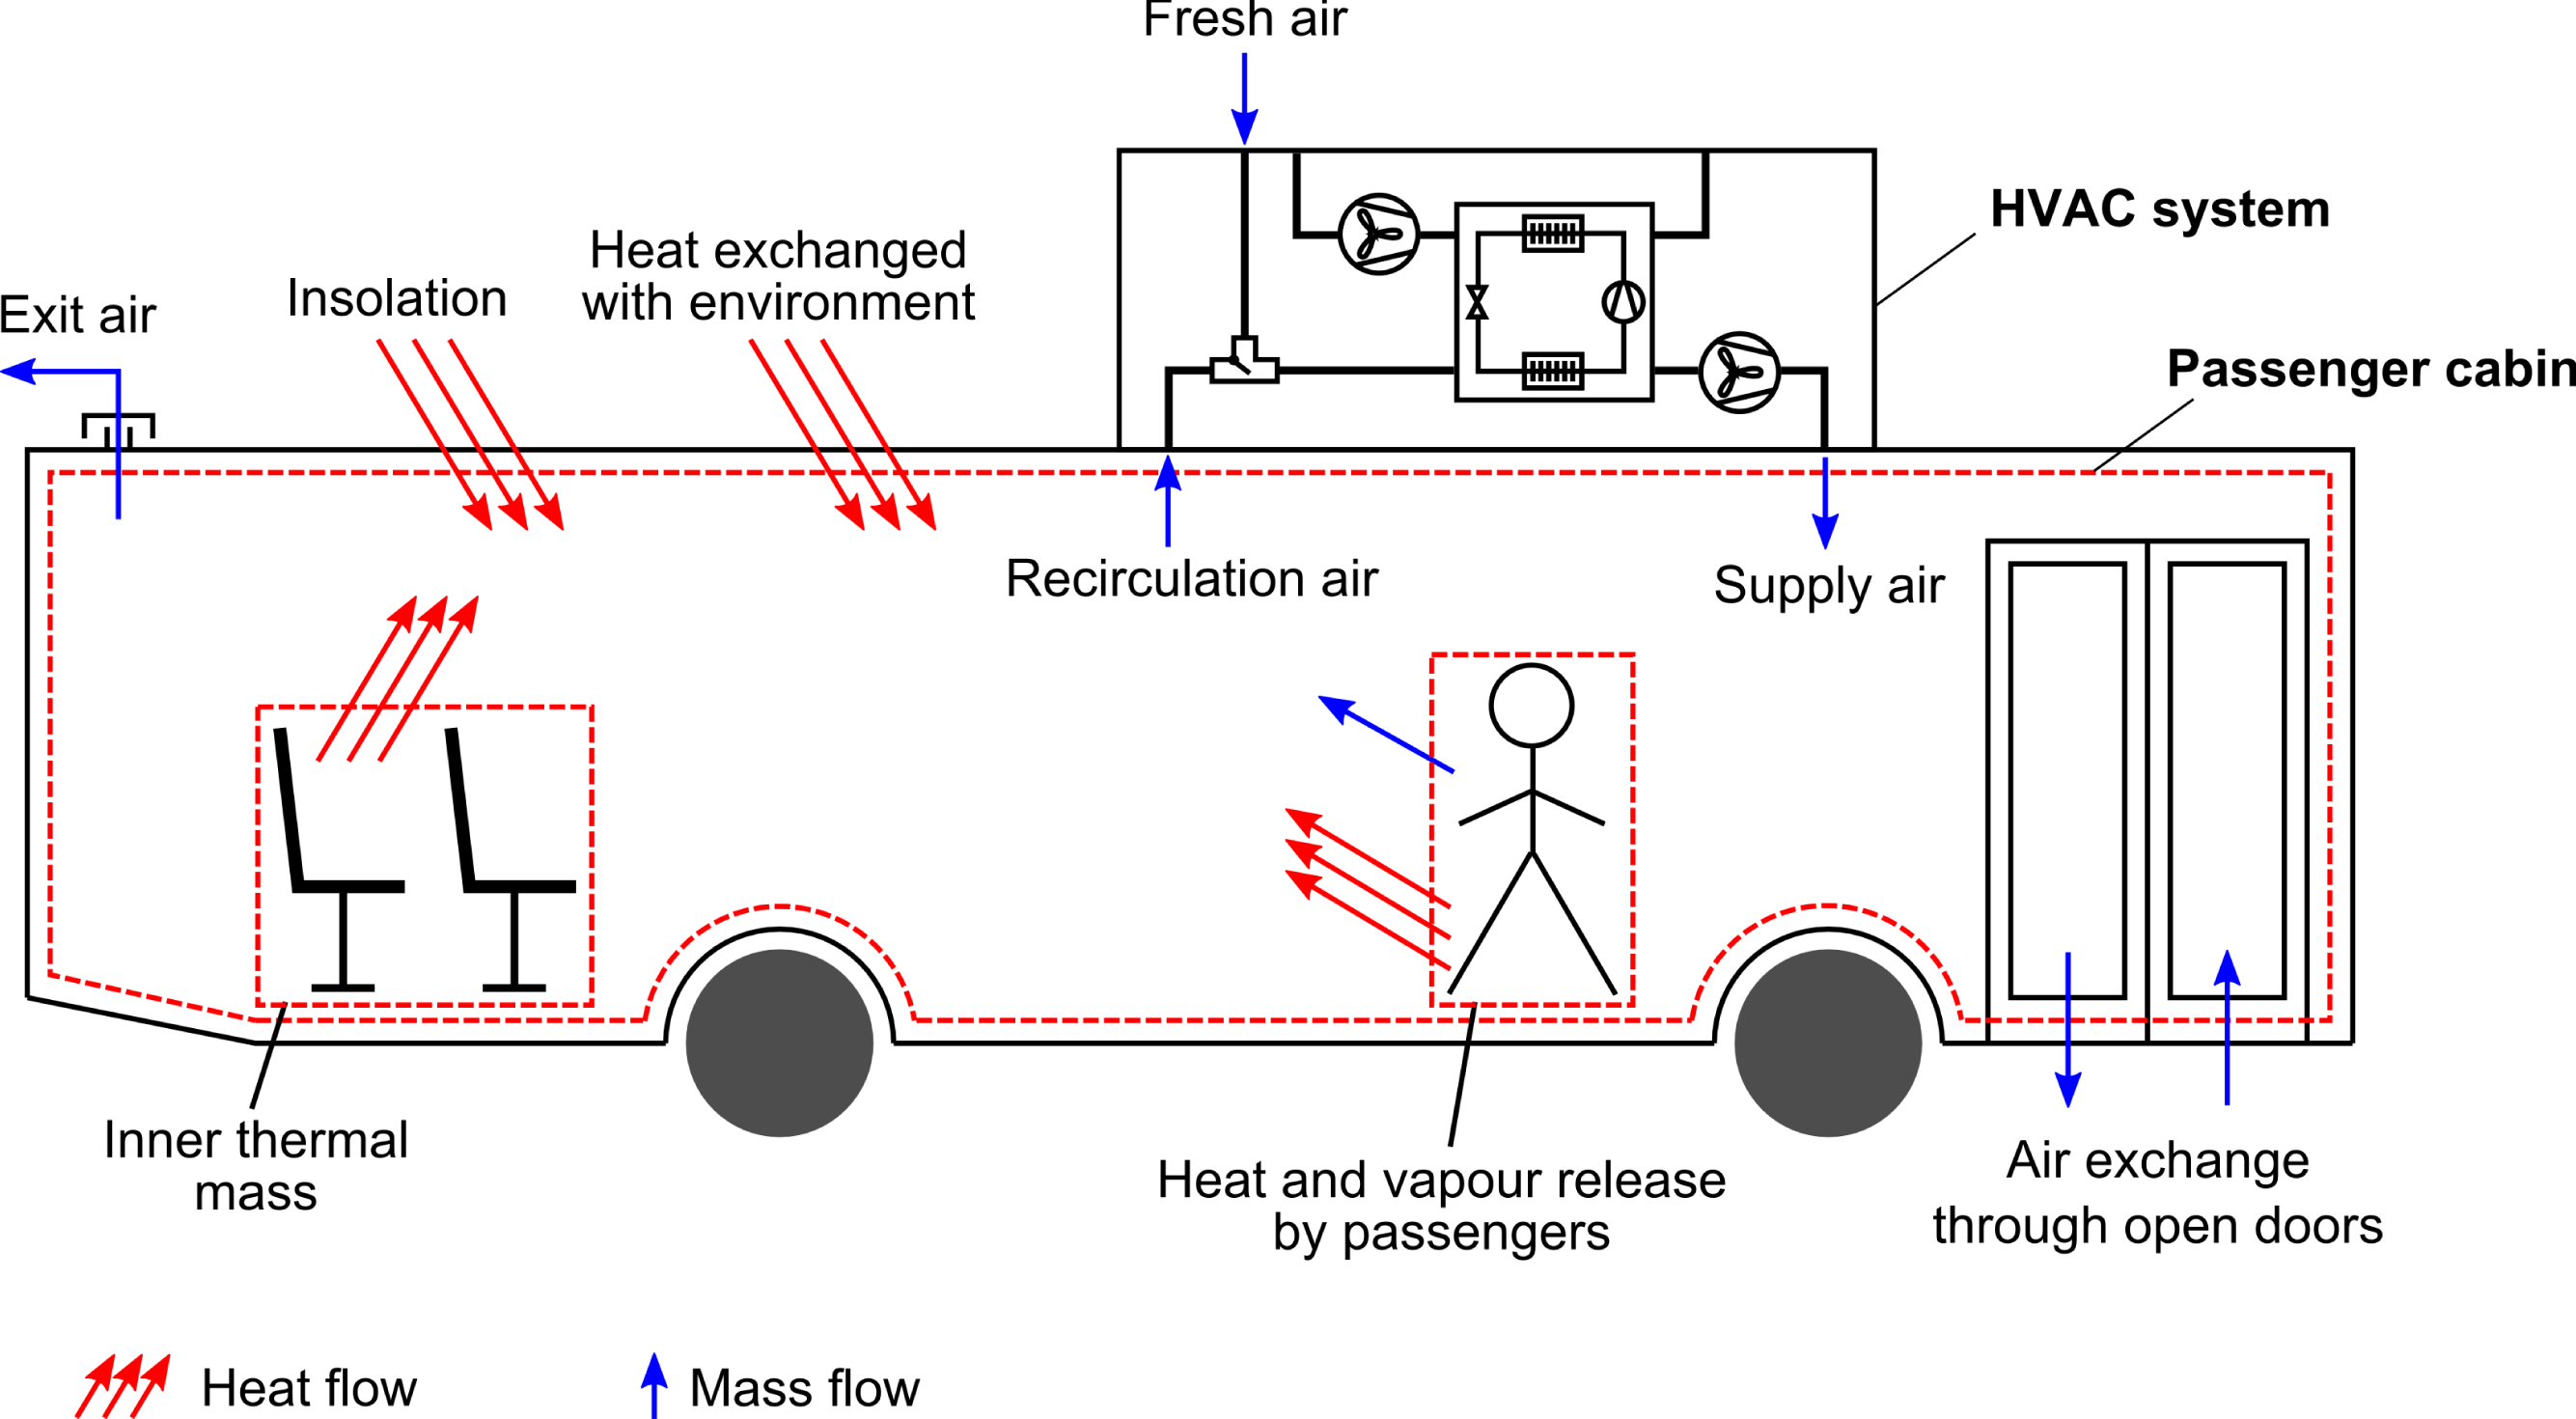
Figure 13. Passenger cabin and HVAC system model; image based on Jefferies et al. (Reference Jefferies, Ly, Kunith and Göhlich2015).
5.2 Model validation
The simulation results were validated by equipping two 12 m battery-electric buses with data gathering equipment and driving 19 round trips on a heavy urban cycle. The data gathering equipment recorded bus speed, auxiliary power, battery state of charge as well as various temperatures and control signals.
Figure 14 illustrates a measurement of a trip without HVAC usage and without passengers, used to validate the drivetrain and battery model. The recorded speed profile was used as an input for the simulation. The measured and simulated drivetrain power are in good agreement and the SoC can be predicted with an error margin of less than 1%.
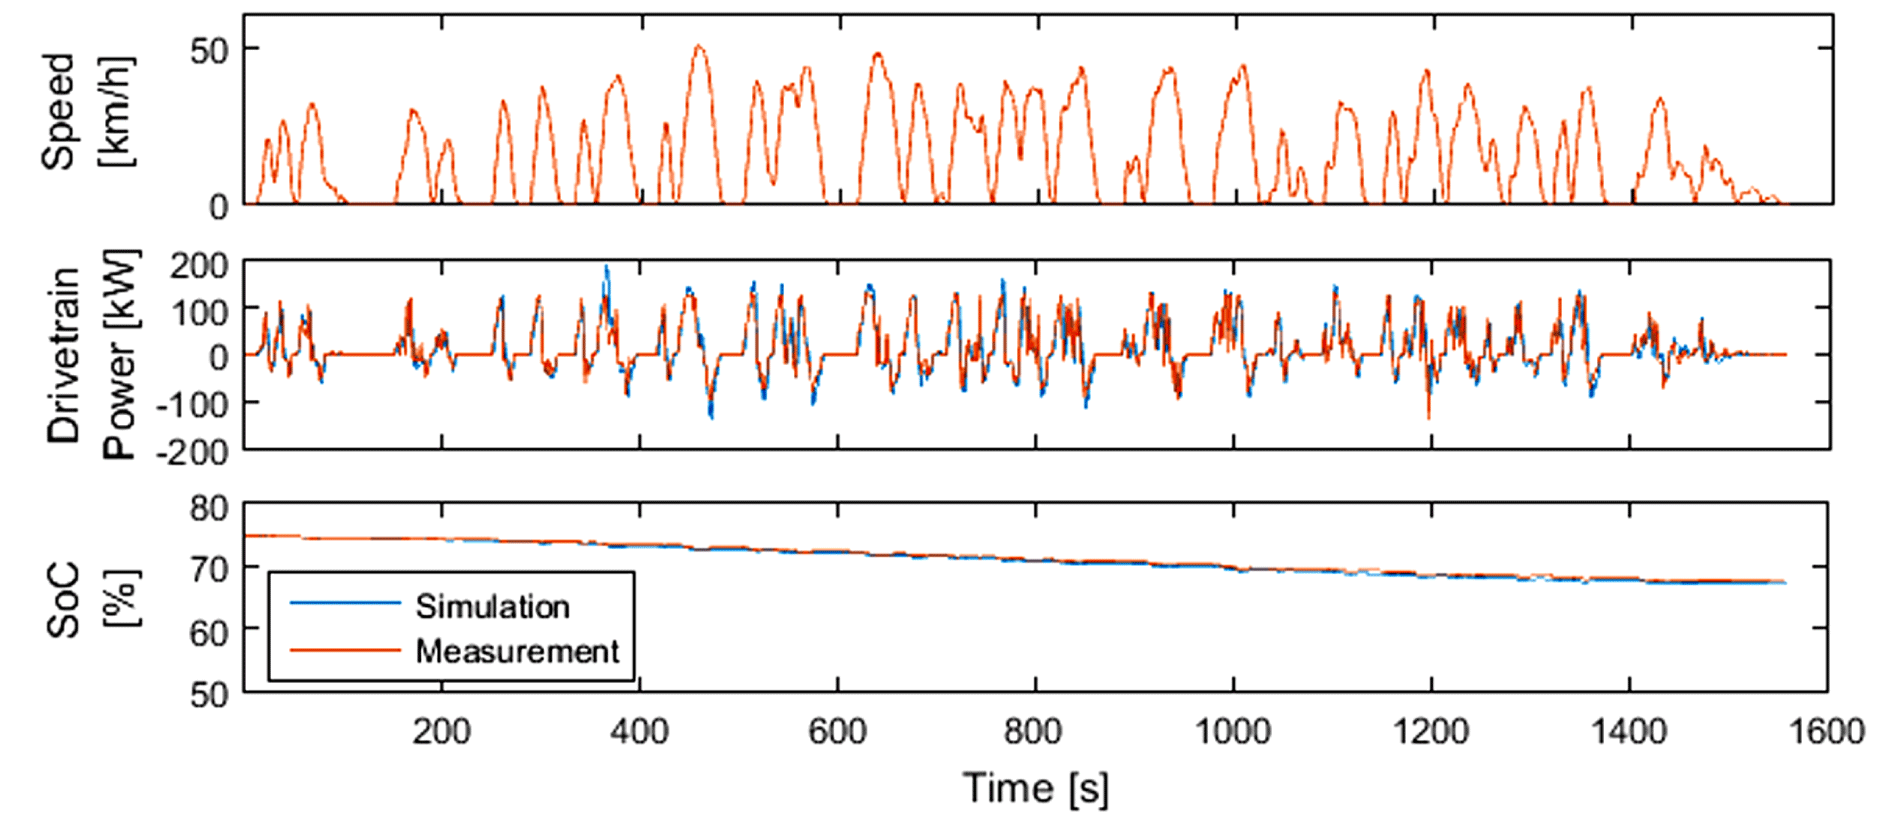
Figure 14. Comparison of the measured and simulated electric drivetrain power and SoC depletion based on a real measured driving cycle without HVAC system.
To validate the passenger cabin sub-model, heating and cooling cases were considered. Prior to the measurement, the passenger cabin was heated up or cooled down using the on-board HVAC system until steady state was reached. The HVAC system was then turned off and several trips were carried out on a heavy urban bus cycle. The model was validated by using the recorded ambient temperature and vehicle speed as inputs and subsequently comparing the simulated cabin temperature with the measured cabin temperature, as Figure 15 illustrates for a sample test drive. Simulated and measured cabin temperature deviate by no more than 1.5 K. Further validation of the HVAC model is still in progress.

Figure 15. Electric bus drive cycle and cabin temperature (measurement and simulation, heating case).
5.3 Model application and technology pre-selection
The application of the bus system simulation model is demonstrated for two charging strategies: depot charging (DC) and opportunity charging (OC). For DC, we assume charging via a manual plug. For OC, we considered two different charging interfaces: pantograph and induction.
As shown in Section 2.4, LFP batteries are most suitable for slow charging in the depot, whereas LTO and NMC batteries permit high charging power and are therefore suitable for opportunity charging.
The NMC battery is suitable for both OC and DC. However, the specific cost of NMC batteries is nearly double that of LFP batteries (see Table 7), therefore, for DC only LFP is considered. The resulting five simulation cases are shown in Table 8. The maximum charging power provided by the wayside charging system is an upper limit, but the actual charging power is governed by the specific battery design and may be lower.
Further parameters for batteries and charging systems required for the simulation are summarised in Ly et al. (Reference Ly, Göhlich and Heide2016).
For the OC case, the required vehicle range is determined by the scenarios set out in Section 4.1 and the SoC window is set to 30%–70%. For this application, this is a plausible value according to our interviews with battery manufacturers, limiting high-cycle fatigue of the battery. For the DC case, the most critical parameter is the vehicle range, thus we will choose the maximum battery capacity bounded by the weight limitations (see Table 5). The SoC window for this case is set to 10%–95%.
Table 5. Operational assumptions

Table 6. Cost data for bus and infrastructure procurement in 2017 based on Kunith (Reference Kunith2017)

Table 7. Cost data for battery procurement in 2017 based on Kunith (Reference Kunith2017)

Table 8. Simulation cases

With these parameters a vehicle simulation is performed for the scenarios described in Section 4.1. The scenario with the greater energy demand is chosen as the design case. The specific layout of the battery system (number of cells in series and in parallel) is determined from total energy consumption and maximum vehicle power demand as shown in Ly et al. (Reference Ly, Göhlich and Heide2016). This may result in slightly different battery capacities for each case despite identical operational requirements.
Figure 16 shows the resulting battery capacity and additional weight for the five cases listed in Table 8. Figure 17 illustrates the charging time and the actual charging power including the transmission efficiency of the charging interface and the C-rate of the battery technology. In the case of conductive OC, the maximum wayside charging power of 375 kW cannot be used by the NMC battery system.

Figure 16. Additional weight and battery capacity of the different bus system designs for OC.
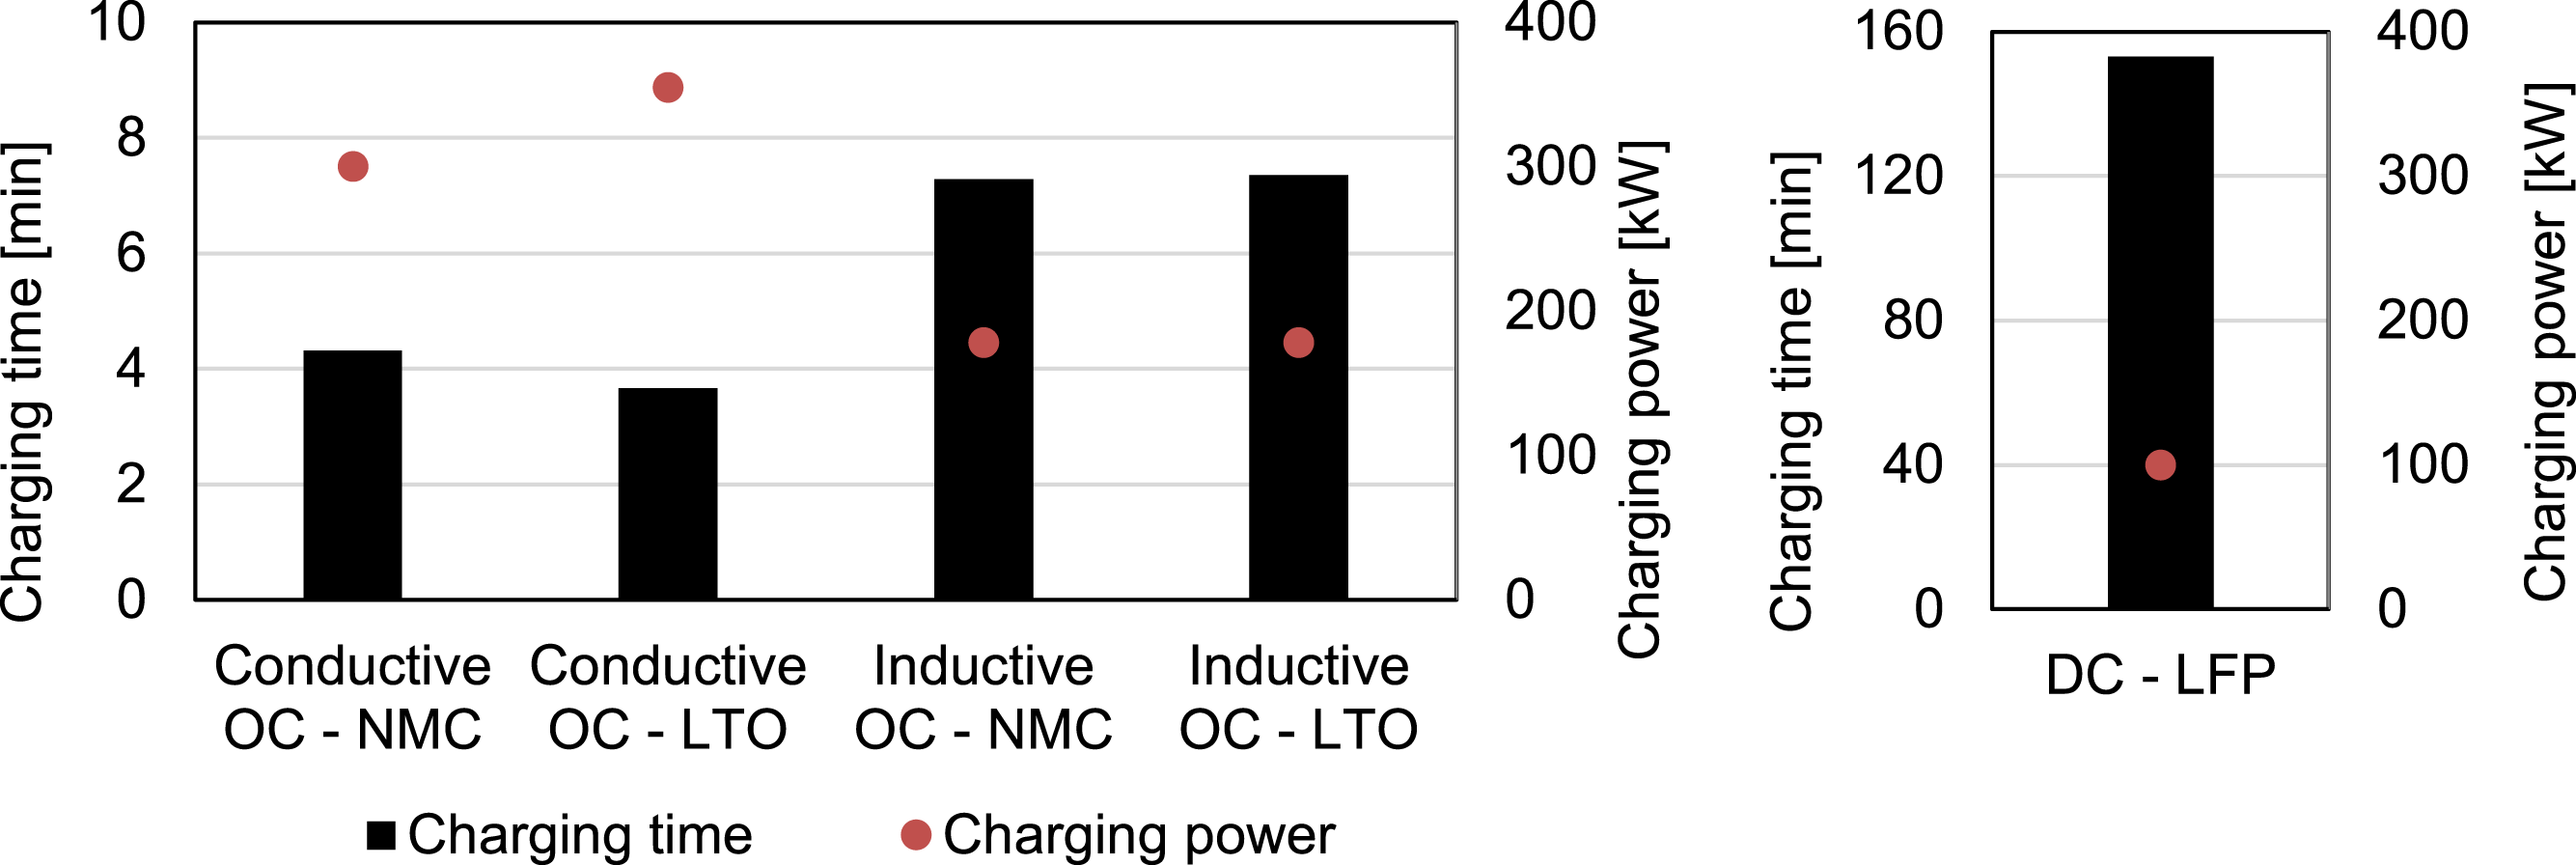
Figure 17. Charging time and actual charging power of the different bus system designs under winter conditions.
The simulation results in Table 9 reveal that all selected bus concepts are feasible and the charging power of 200 kW is sufficient for the battery to be recharged within the dwell time. Since the installed charging power highly influences the total cost, OC systems are restricted to 200 kW in the subsequent economic analysis. With the specific parameters used for this study, the performance of NMC based systems is superior compared to LTO based systems in terms of cost and weight. Therefore, the subsequent economic analysis will be limited to OC systems with NMC batteries and, as explained above, DC systems with LFP batteries.
Table 9. Performance characteristic of selected bus concepts under average condition

6 Electric bus TCO model
The following section covers the economic assessment of bus line electrification. Here, we merge the operational and technological aspects of electric bus service with economic figures in order to determine the total cost of electrification. The presented approach is based on a TCO model including all costs occurring during the life cycle of a bus system, allowing for an objective technology selection. The model features and data requirements are described and the evaluation of a reference bus line is conducted.
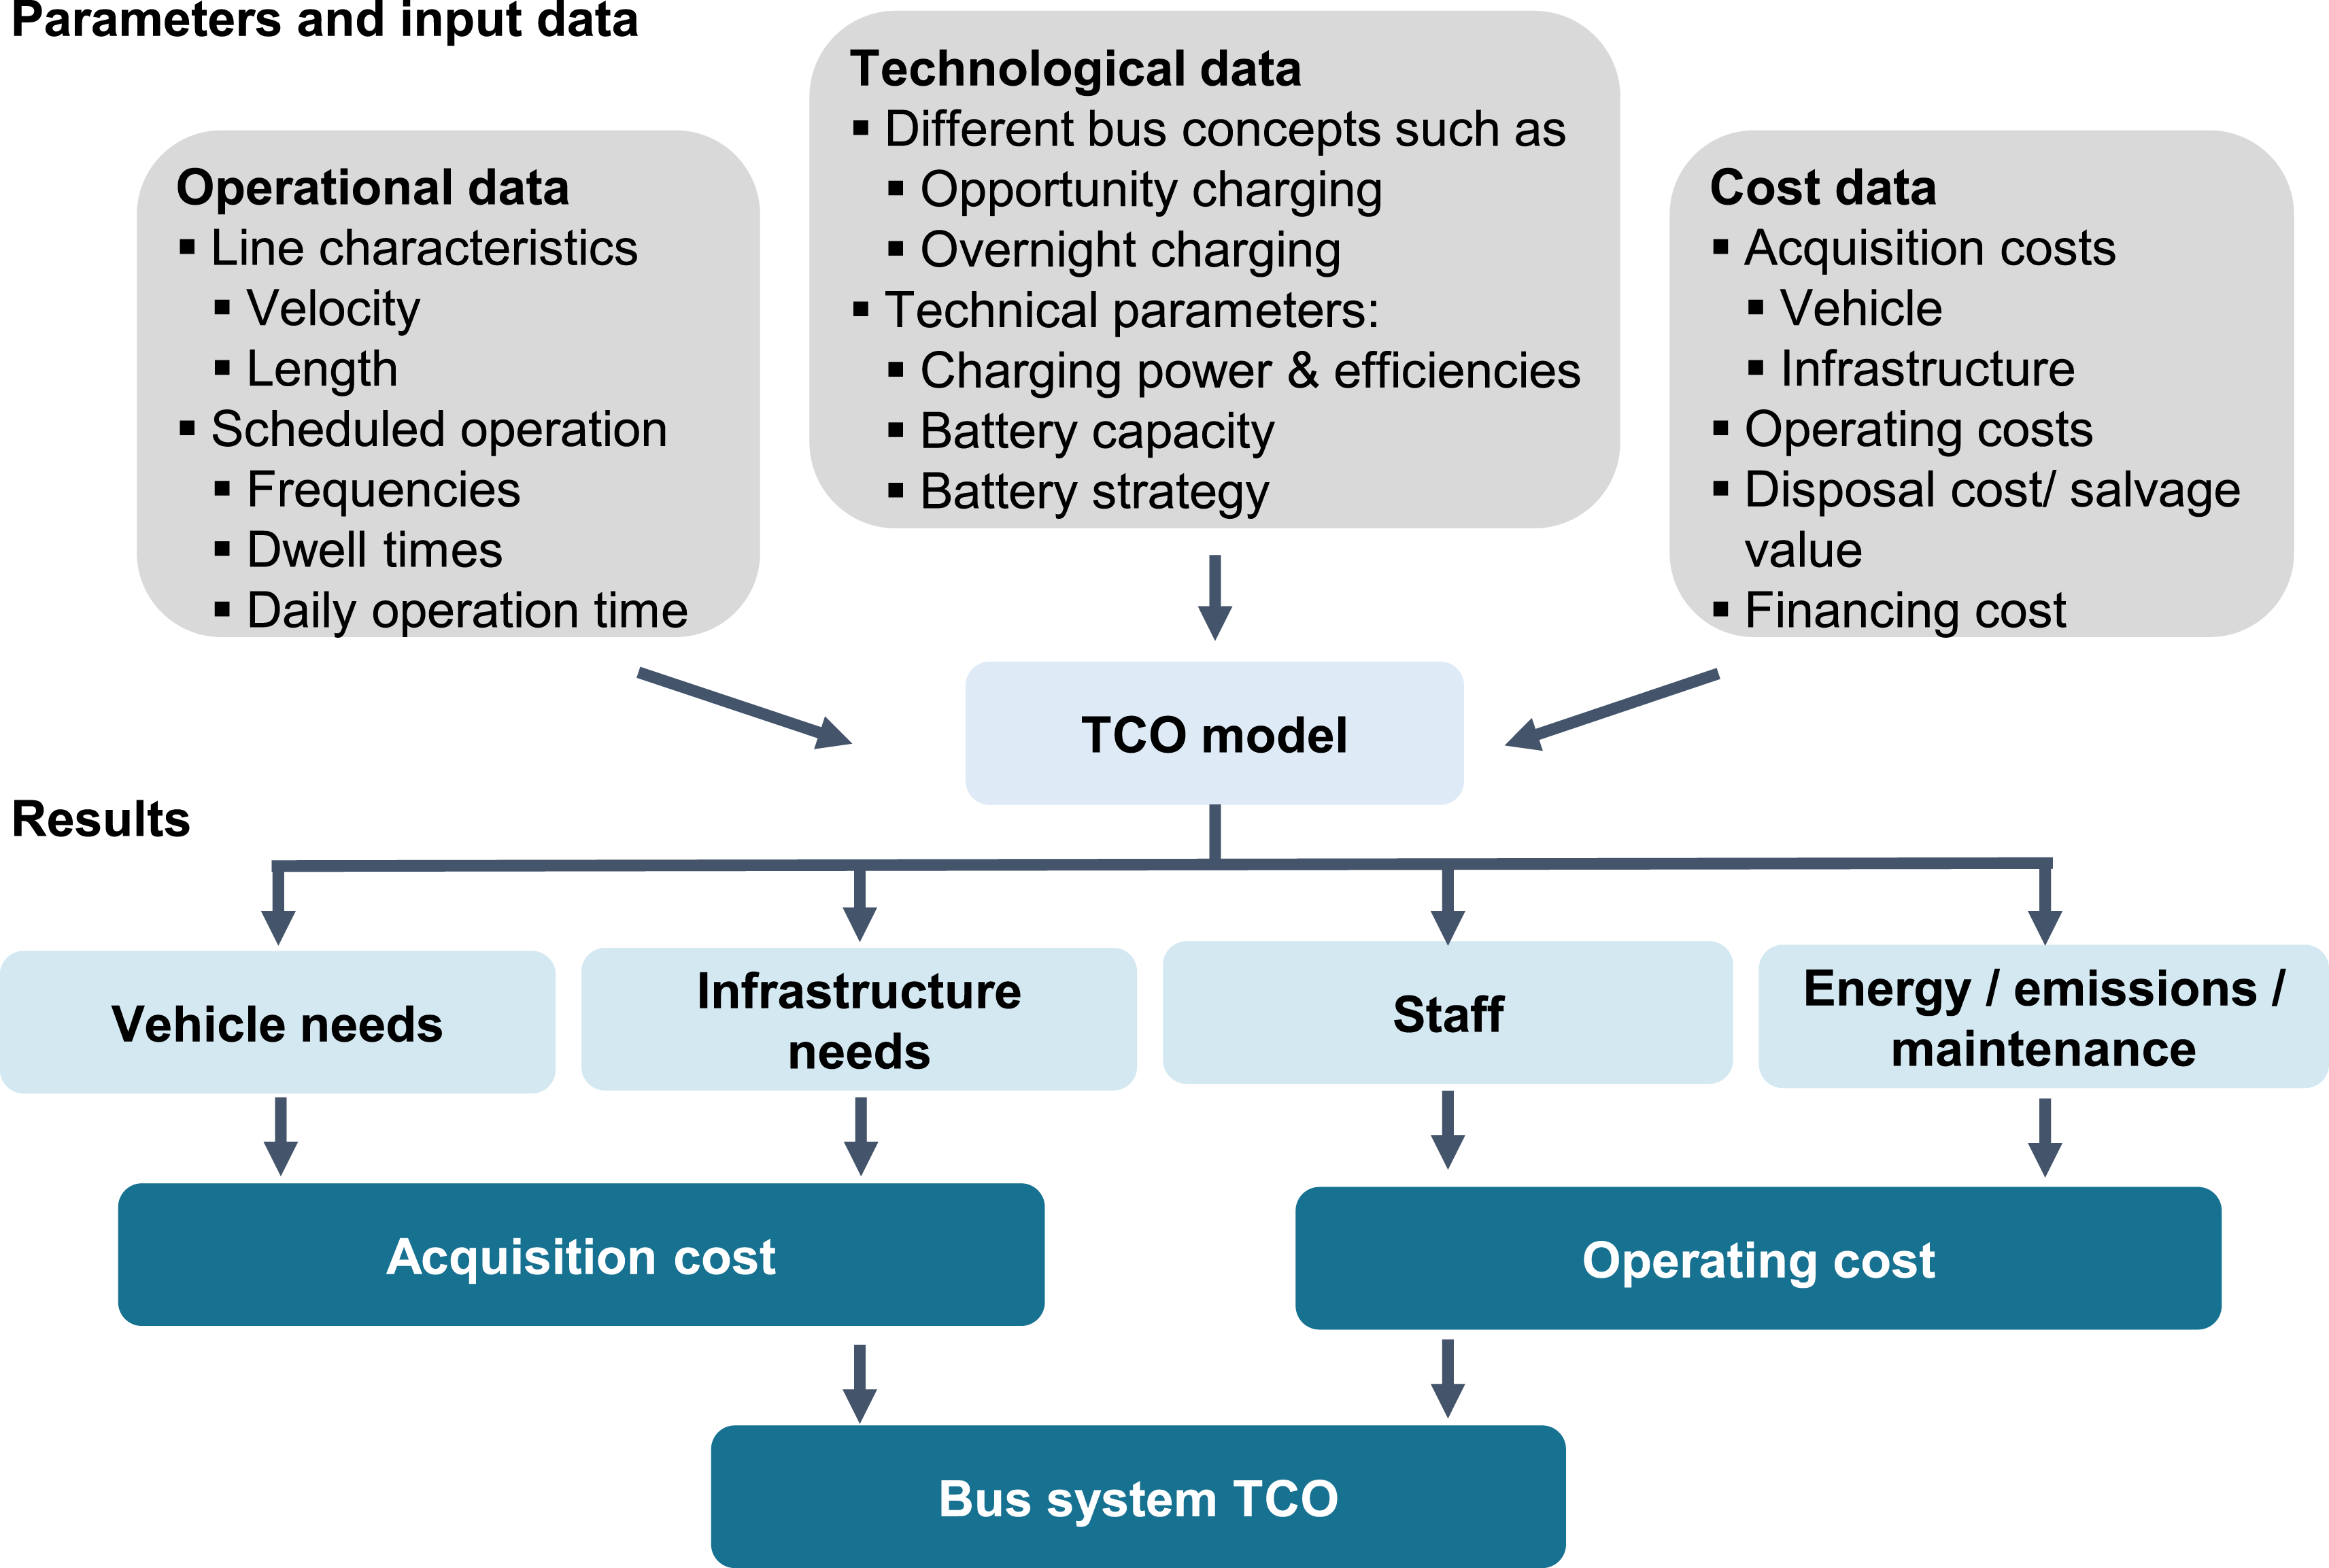
Figure 18. TCO model for the bus line electrification assessment.
6.1 Model description
The TCO model is composed of acquisition and operational cost for vehicles and infrastructure (en route and in the depot), capital financing cost, personnel cost and emission cost. It is based on the net present value method. As shown in Figure 18, the model input comprises operational, technical and cost data. The final TCO value is expressed in €/km based on the total mileage over the operational period.
Our TCO model (Göhlich et al. Reference Göhlich, Kunith, Ly, Brebbia and Longhurst2014; Kunith Reference Kunith2017) focuses on the evaluation of individual bus lines with a given schedule. For each technology, the required numbers of vehicles and charging stations have to be determined such that the bus schedule can be retained. The bus and infrastructure configuration as well as the technology-specific energy consumption have been determined in Sections 3–5. To obtain the operational cost, the calculation of annual energy demand, vehicle and infrastructure maintenance cost as well as technology-specific personnel cost are necessary.
Future developments of all cost elements are considered over the operational period. To forecast the cost of technical systems, a component-based experience curve approach is selected. A simplified cost structure of the bus systems is assumed where individual bus components are aggregated into component groups or vehicle sub-systems such as battery system or charging components. For the sub-systems, the cost reduction potentials are determining using learning rates based on market forecasts. In order to cope with uncertainties of future energy cost, a stochastic modelling of critical input parameters is performed. Finally, the project-evaluated-and-review-technique (PERT) method, which depicts cost trends via the beta distribution, is used to derive a distribution function from discrete prognosis values (Göhlich et al. Reference Göhlich, Spangenberg and Kunith2013).
6.2 Model application and results
Based on the pre-selection shown in Section 5, the TCO assessment is conducted for two OC cases, one DC case and standard diesel buses as a reference case.
The input data for the TCO model is obtained from a series of demonstration studies on electric buses and interviews with transport authorities and manufacturers. Operating lifetime of vehicles is assumed to be 12 years, battery 6 years and infrastructure 20 years. After this period, the salvage value is set to zero.
For each case, three cost scenarios were evaluated: a probable cost development (trend scenario), an optimistic and a pessimistic cost degression for electric bus systems. The vehicle acquisition cost projections for the trend scenario are shown in Figure 19. Increasing production volume and technology advancements of electric buses will lead to significant cost reduction. Especially the increasing production volume of vehicle batteries (not only for buses but also for passenger cars) will lead to significant cost reduction (Thielmann, Sauer & Wietschel Reference Thielmann, Sauer and Wietschel2015). However, within the time span considered, vehicle acquisition cost for electric bus systems remains higher than for diesel buses.
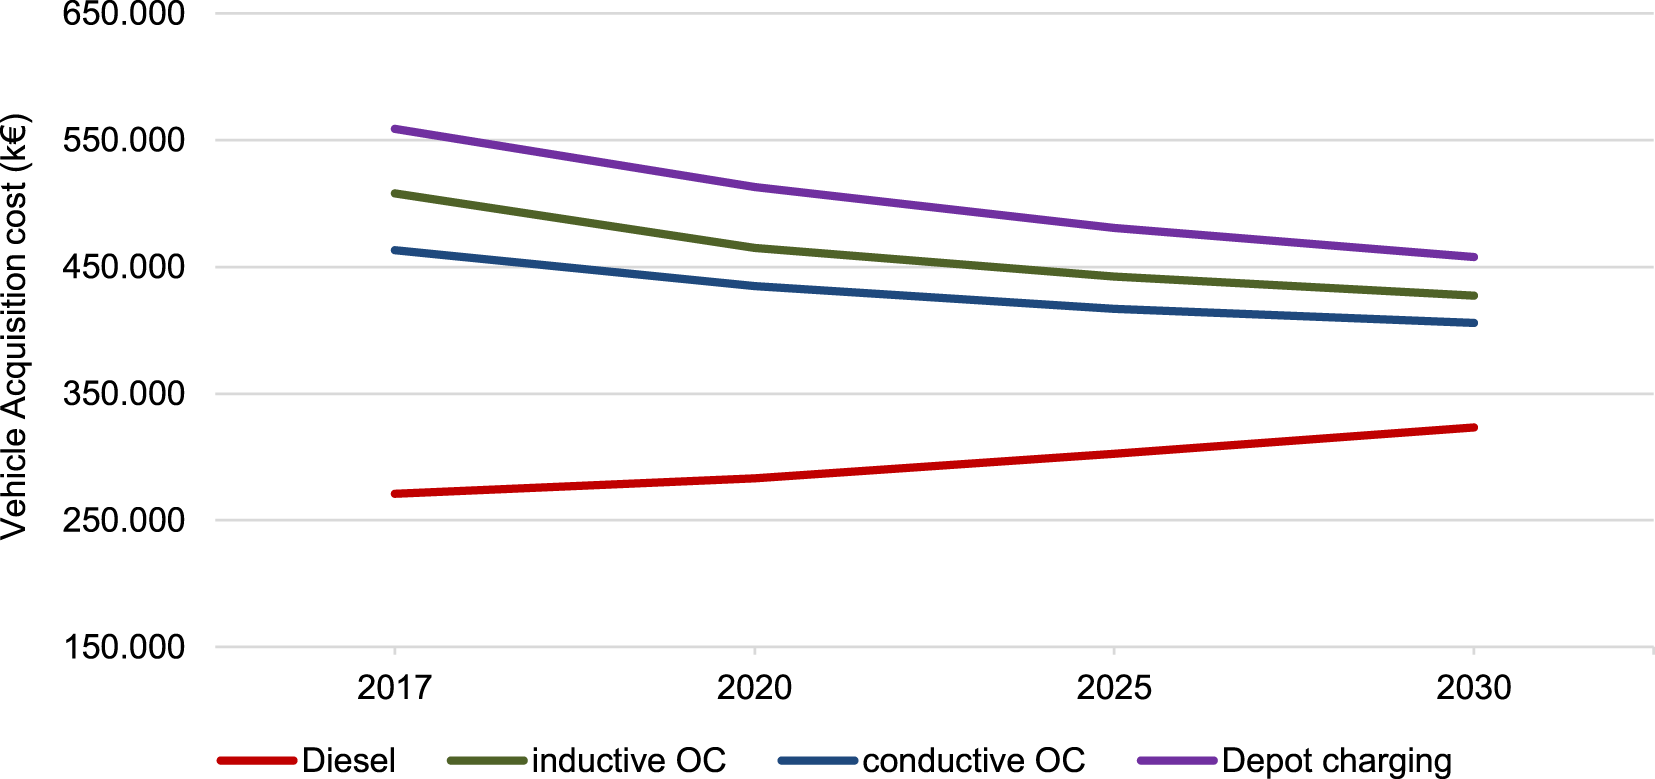
Figure 19. Forecasting vehicle acquisition cost for the trend scenario.
Figure 20 shows the TCO values for electric 12 m buses compared to conventional buses under operational and technical parameters obtained in Sections 4 and 5.
The assessment is conducted for a procurement in the year 2017 and in 2025, respectively. The assumed cost input data corresponds to the aforementioned trend scenario with moderate cost developments. Under the conditions examined, the current deployment of electric bus systems leads to higher total cost in 2017, but for 2025, both conductive and inductive OC concepts become the most cost-effective solutions. The OC concept benefits from lower battery cost and an unchanged fleet size compared to the reference diesel fleet. By contrast, DC requires additional vehicles due to range limitations and hence causes higher acquisition and staff cost. The number of required additional buses for DC is determined based on operational scenario 1 (see Section 4).
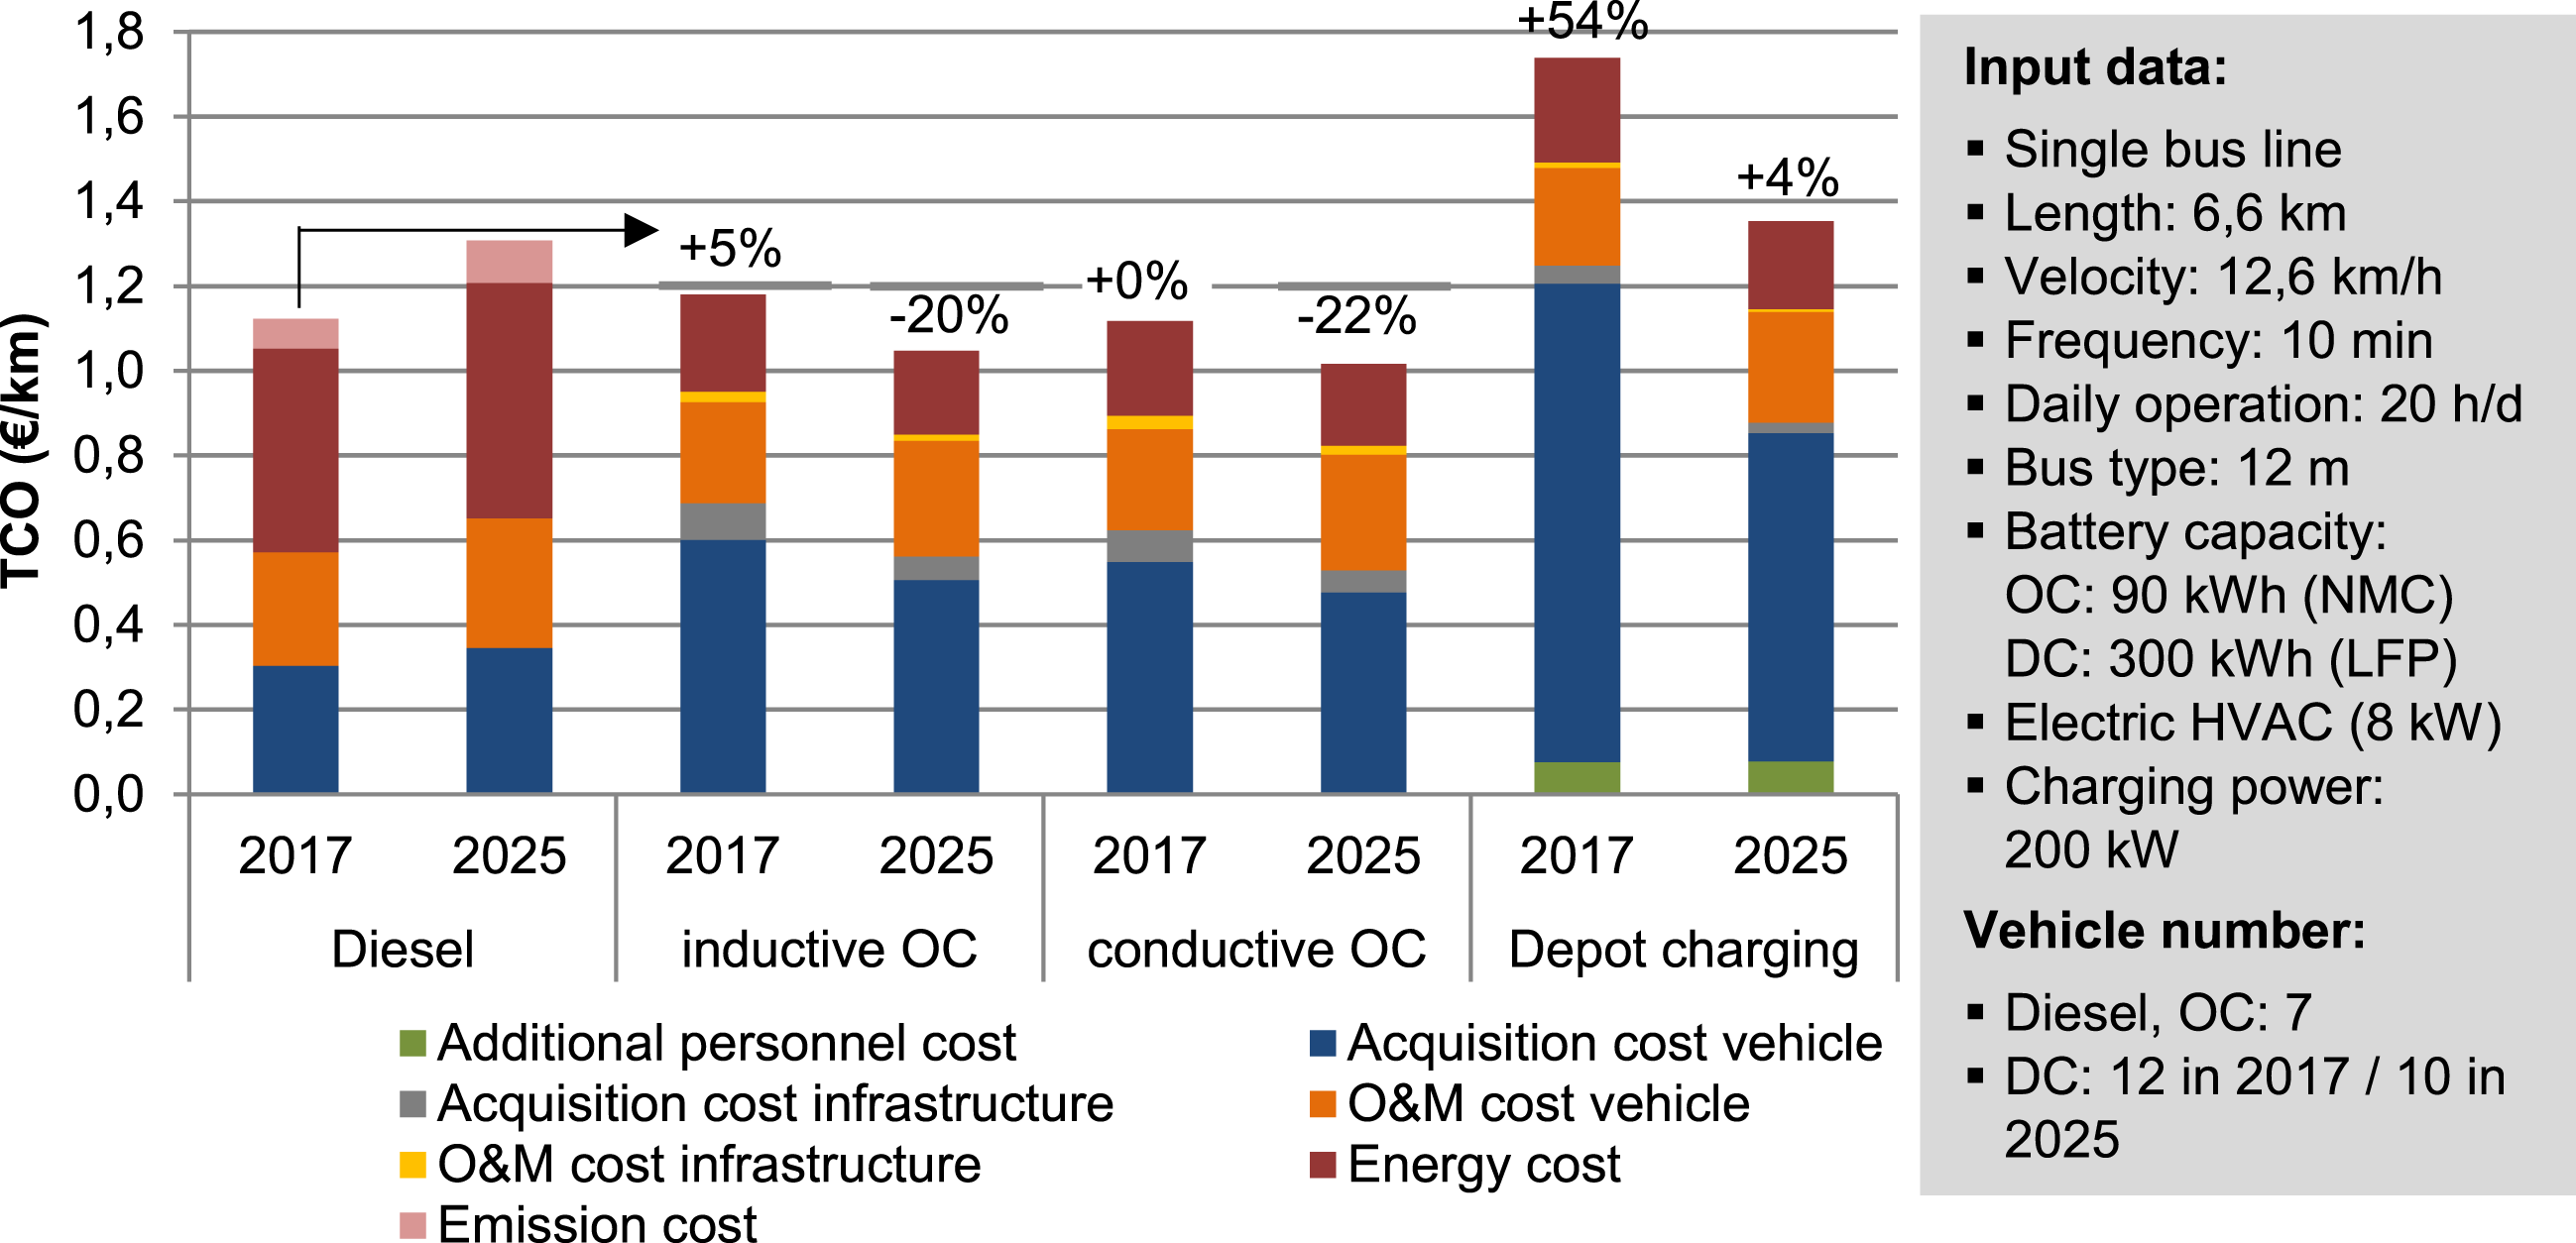
Figure 20. TCO assessment of different technologies for 2017 and 2025 (forecast trend scenario).
The integrated PERT method combined with a stochastic simulation allows the evaluation of the cost variation impacts. Figure 21 shows possible probability distribution of future TCO outcomes for different technologies in the year 2025, allowing a risk assessment for technology decisions. The spread of each histogram indicates the degree of cost uncertainty. For instance, the conventional diesel bus features the highest uncertainty due to the dependency on fossil fuel.
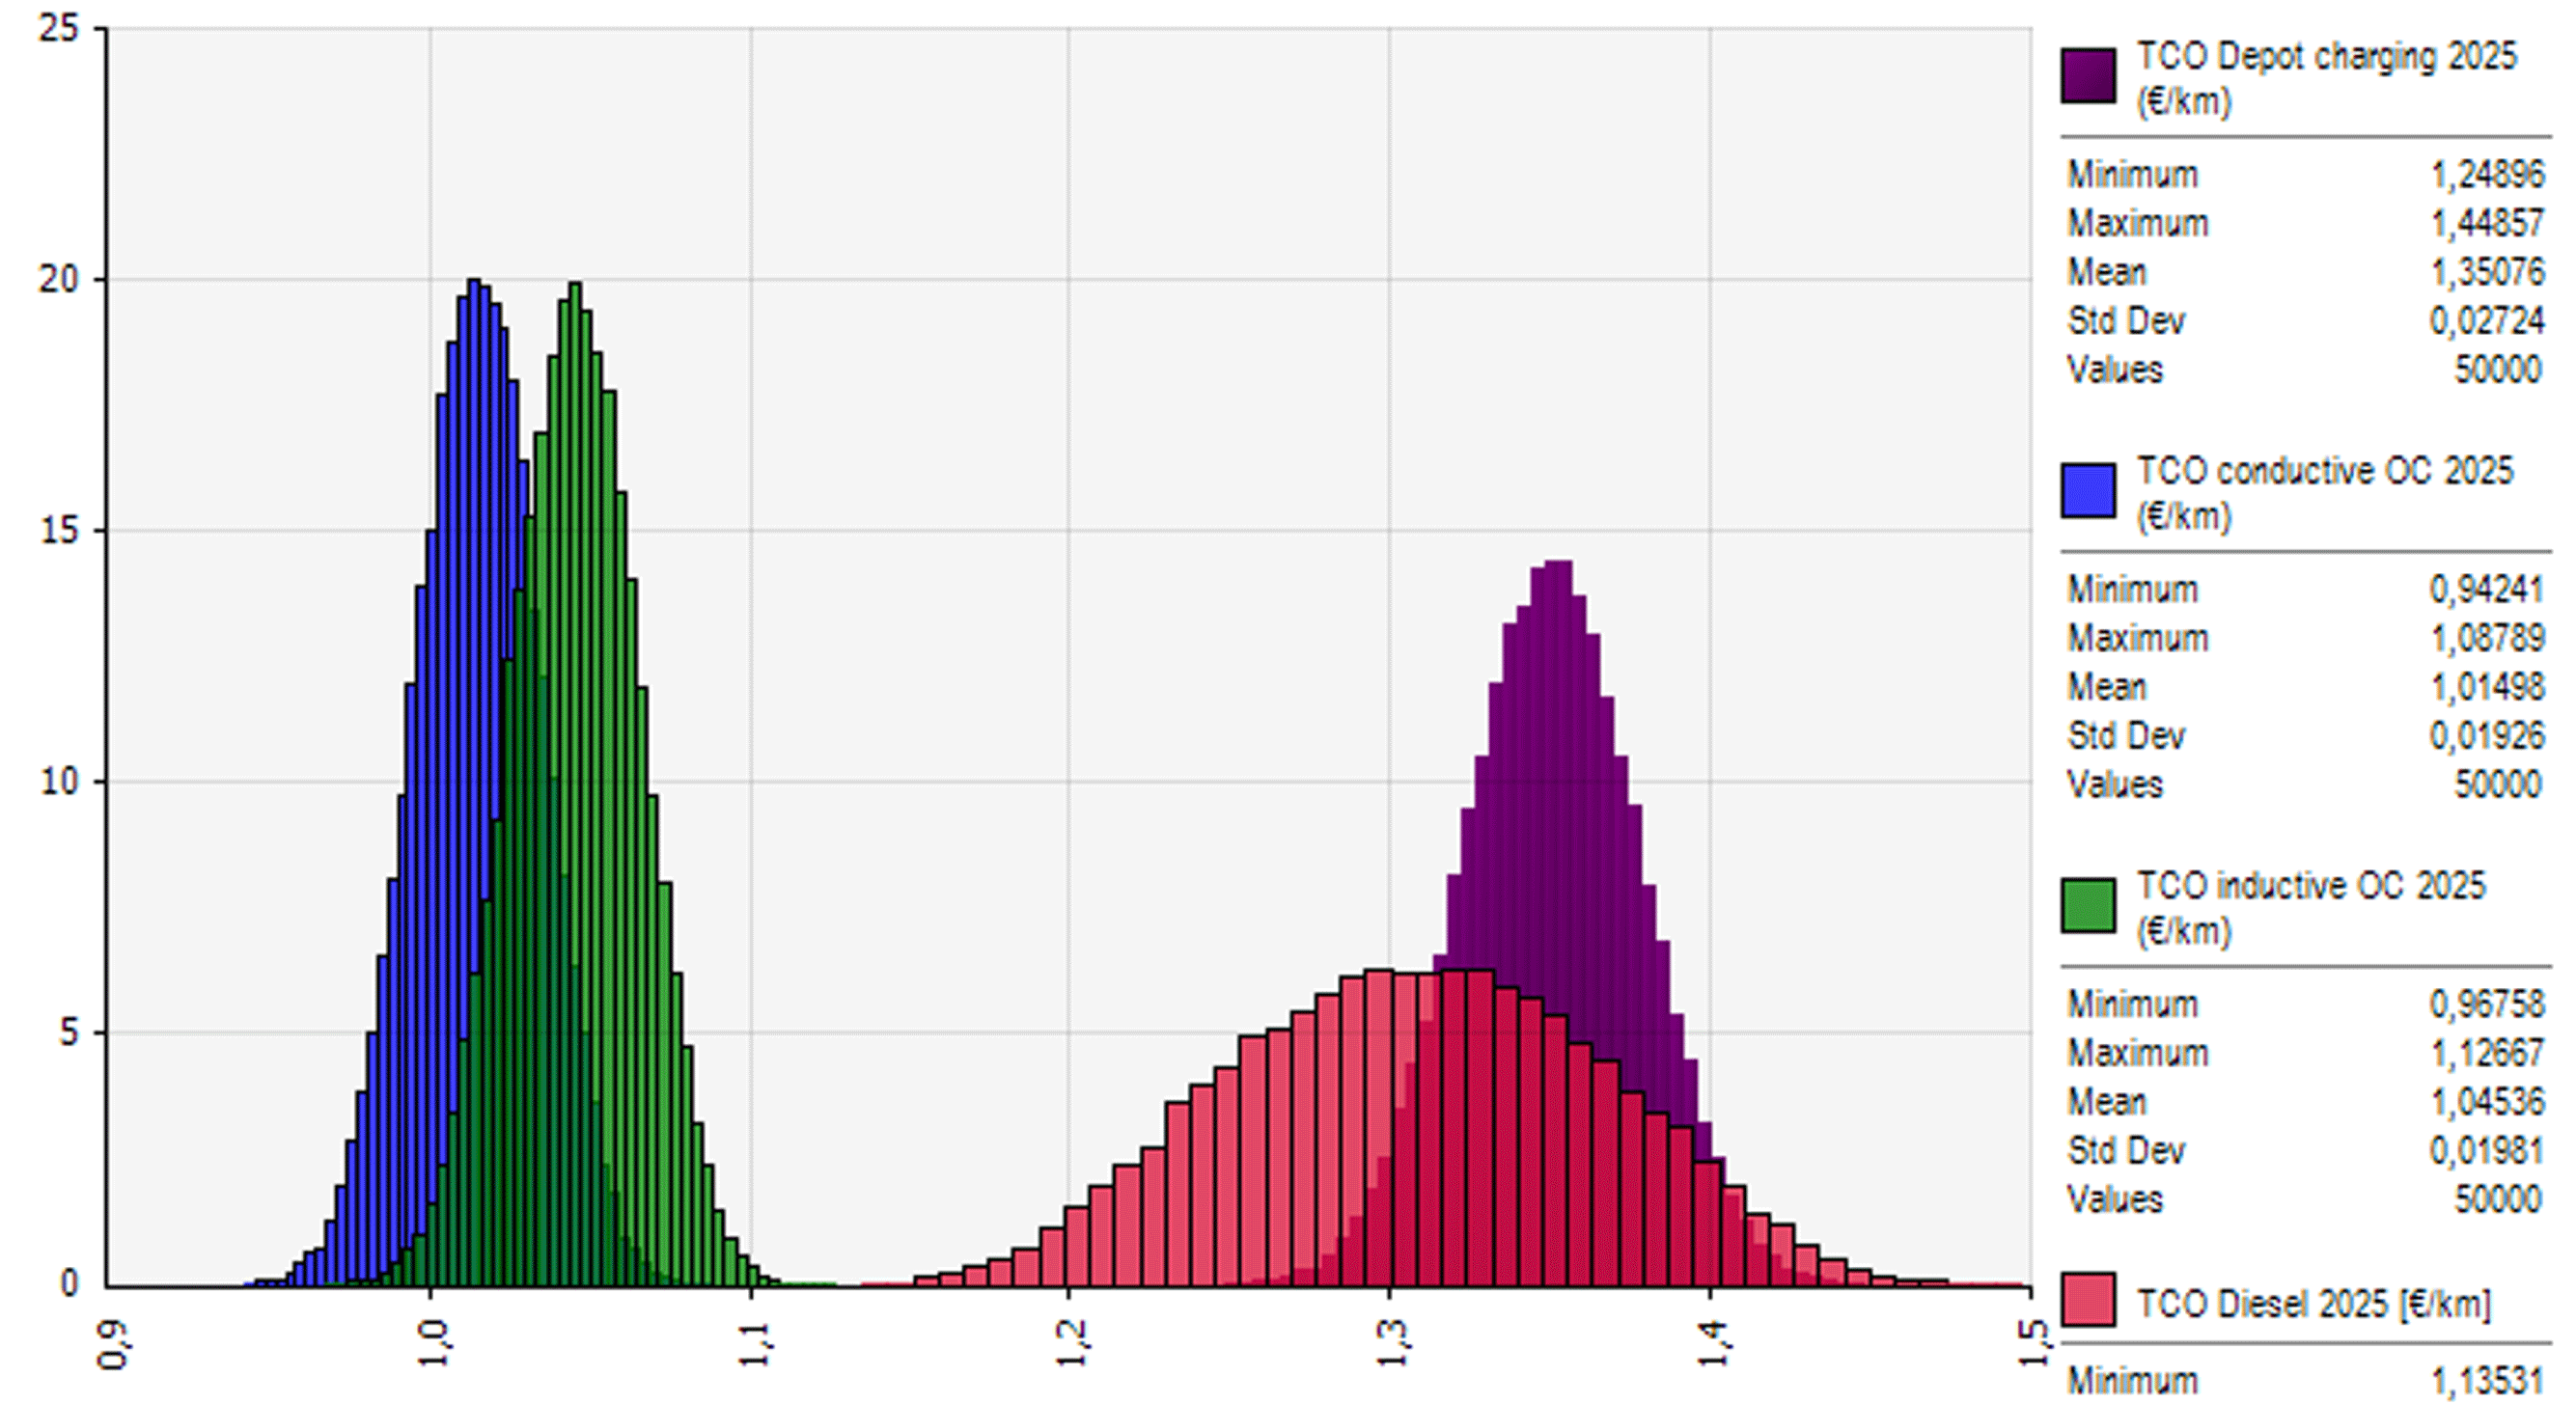
Figure 21. Stochastic TCO simulation for a bus procurement in 2025 based on selected route.
7 Conclusion and future work
The transformation process from diesel to electric bus systems opens up a very large design space. In this paper, all relevant vehicle technologies and charging systems are analysed and structured using a morphological matrix. Energy consumption is analysed considering the characteristics of different electric powertrains and batteries. As heating and air conditioning are typically the most energy-consuming auxiliaries in electric buses, special attention was given to the HVAC system.
With the help of a verified modular simulation model, the vast variety of theoretical system solutions can be reduced to a subset of technically feasible variants. The final technology selection is based on a detailed economic analysis which is conducted by means of a TCO model.
We have applied the methodology to an exemplary bus line considering realistic operational aspects and viable cost input data. Uncertainties in future cost predictions have been considered using a stochastic modelling of critical input parameters.
The proposed methodology is suitable to support metropolitan bus operators in making a systematic procurement decision. Also, it can aid original equipment manufacturers (OEM) of electric buses and related infrastructure in making systematic design decisions.
Our results indicate that electric bus systems are technically feasible and can become economically competitive from the year 2025 and we have identified OC as the ‘most suitable system solution’ considering available technologies and operational requirements.
Recent transformation initiatives in Norway and the Netherlands support our findings (VDL Bus & Coach bv 2017; Waschbusch Reference Waschbusch2017). However, other bus operators are favouring DC. Especially the most extensive bus electrification project to date, the introduction of 16,000 electric buses in Shenzen, exclusively favours DC (Coren Reference Coren2018). Here, LFP batteries are employed, as proposed in this paper for depot-charging systems.
It should be noted that our presented TCO model is based on fixed vehicle schedules and does not consider service delays which may result in higher energy consumption and lower available charging time. Also, the necessary transformation of bus depot processes is not yet incorporated in our model. A new depot simulation model is currently being developed to determine the effects of different operating processes on the charging behaviour. Also, an intelligent charging management for an electric bus fleet is considered and presented in Raab et al. (Reference Raab, Lauth, Strunz and Göhlich2017).
When planning the transformation of a complete bus network rather than a single line, cost efficient placement of charging infrastructure has to be considered. An approach to optimise the location of charging infrastructure based on a mixed-integer linear optimisation model has been presented in Kunith, Mendelevitch & Goehlich (Reference Kunith, Mendelevitch and Goehlich2017). Furthermore, it can become necessary to adapt vehicle schedules to technological or operational constraints: In opportunity-charging systems, for example, it is possible that turnaround time at terminal stops has to be increased to allow sufficient charging time; with DC, on the other hand, existing vehicle schedules may have to be split to account for the limited vehicle range. A new algorithm to re-schedule vehicles to satisfy timetables and charging demand is currently under development by the Electric Transport Solutions research team at TU Berlin.
Acknowledgments
The authors gratefully acknowledge the financial support of the German federal government. Parts of this work have been supported by the Federal Ministry of Transportation and Digital Infrastructure (Showcase Project ‘E-Bus Berlin’, grant no. 16SBB004E) and by the Federal Ministry of Education and Research (Research Campus Mobility2Grid, grant no. 03SF0524A). Furthermore, we thank our partners at the Berlin public transport operator (BVG) for the inspiring discussions and their valuable support.


